numerical modeling of the bistability of electrolyte ... · numerical modeling of the bistability...
TRANSCRIPT

Excerpt from the Proceedings of the 2013 COMSOL Conference in Boston
Numerical Modeling of the Bistability of Electrolyte Transport in Conical Nanopores Long Luo, Robert P. Johnson, Henry S. White*
Department of Chemistry, University of Utah, Salt Lake City, UT 84112, United States *[email protected] Abstract: In this paper, we present a numerical model of the bistability in ionic conductivity in conical nanopores. Our laboratory has previously reported experimental observations of unusual bistable electrolyte transport phenomena when a conical nanopore filled with a high conductive electrolyte solution (i.e., 5 mM KCl aqueous solution) was immersed in a low conductive electrolyte solution (i.e., 5 mM KCl in dimethyl sulfoxide (DMSO)/water). At a constant positive pressure across the nanopore (internal vs. external) and slowly increasing negative voltage, a sudden drop of current occurred within a few hundred milliseconds at a critical voltage. The current drop indicates a rapid transition between two conductivity states, or a bistability of electrolyte transport. A steady-state model based on the Nernst-Planck equation, Navier-Stokes equation and Poisson’s equation using COMSOL Multiphysics successfully reproduced the bistability observed in experiments. Investigation of the mechanism of the bistability suggests the presence of a positive feed-back loop coupling fluid flow and ion distributions, causing a sharp transition between two conductivity states. Keywords: Bistability, Electrolyte Transport, Nanopore, COMSOL, Feed-back loop 1. Introduction
Nanochannels are solid-state or biological channels with nanometer-scale dimensions. A characteristic feature of nanochannels is that surface properties (e.g., electrical charge) play a more significant role in the transport of fluid and electrolyte. Interesting transport phenomena in nanochannels, which do not occur at large length scales, have been observed during the past decade. A better understanding of these behaviors is important due to the importance of
nanochannels in biological system, as well as in developing new chemical sensing technologies.
The nanochannel that our laboratory has
studied is a conical nanopore embedded in a glass membrane with a half cone angle of ~10o, as illustrated in Scheme 1.1 We designed an experiment to study the electrolyte transport in a nanopore when the nanopore separates two miscible solutions with different conductivities. As shown in Scheme 1, the internal solution has a higher conductivity relative to the external solution. A positive pressure (0 to 80 mmHg internal vs. external) is applied across the glass membrane to drive the internal solution outward through the nanopore, as indicated by a blue arrow. When a voltage bias (~-1 V) is applied across the membrane using two Ag/AgCl electrodes, a large electric field (~105 V/m) develops at the small orifice. This localized field is due to the high electrical resistance at the orifice,2 generating a strong electroosmotic flow (EOF) at the negatively-charged glass nanopore wall (Scheme 1a, red arrow). The EOF and pressure-driven flows have comparable rates and oppose one another. The two oppositely directed flows determine the flow profile at the nanopore orifice as well as electrolyte distribution. At low voltages, the nanopore is occupied by the internal solution with a high conductivity (Scheme 1a), and therefore, a larger current passes through the nanopore. In contrast, at high voltages, a stronger EOF pushes external solution with a low conductivity into the nanopore, resulting in a smaller current (Scheme 1b). A sharp transition in these two conductivity states was observed while slowly scanning the voltage applied across the glass membrane.
Figure 1 shows the experimental current-time (i-t) recording for a 230 nm radius nanopore at 20 mmHg pressure and a scan rate of 10 mV/s

Excerpt from the Proceedings of the 2013 COMSOL Conference in Boston
Anode
_
_
___ _
____
_
_
Glass Glass
100 - 400 nm
_
+
Cathode(a)
pre
ssure
LowV
High conductive electrolyte
Low conductive electrolyte
Anode
__
___ _
_____
_
Glass Glass
100 - 400 nm
_
+
Cathode(b)
pre
ssure
HighV
Low conductive electrolyte
Scheme 1. Schematic drawings of the experimental design. Two electrolyte solutions with different conductivities are placed inside and outside a glass conical nanopore. (Inside: high conductive solution; outside: low conductive solution) A constant pressure is applied to generate a flow outward the nanopore (blue arrow). A voltage applied across the nanopore generates an electroosmotic flow (red arrow) near the negatively charged glass surface. The competition between the pressure-driven flow and the electroosmotic flow determines the solution composition inside nanopore. (a) and (b) show the distribution of electrolyte solution at low and high negative voltages (inside vs. outside), respectively.
from -0.2 to -1 V. The corresponding voltages are also labeled in Figure 1. Internal and external solutions are initially 5 mM KCl in water and DMSO/water mixture, respectively. The external solution possesses a lower conductivity due to the higher viscosity of DMSO relative to water. A sudden drop of current occurs over a voltage difference of ~ 7 mV (from -0.852 and -0.859 V) within a few hundred milliseconds, as shown in the inset of Figure 1. The conductivity of the nanopore before and after the current drop (slops of the voltage-current curve) are close to the conductivities of original internal and external solutions, respectively.3 This interesting bistabi-lity suggests that either the external solution or
-8
-6
-4
-2
0
Cur
rent
(nA
)
806040200Time (s)
-0.2 -0.4 -0.6 -0.8 -1.0Voltage (V)
-8
-6
-4
-2
0
64.3664.3264.2864.24
Figure 1. Current-time recording as the voltage is scanned from -0.2 to -1.0 V when 5 mM KCl in water and 5 mM KCl in DMSO/water are initially inside and outside nanopore. The DMSO/water solution has a higher viscosity than H2O and, thus, a lower conductivity. A sudden drop of current occurs at ~-0.8 V (inside vs. outside) within a few hundred milliseconds. Inset shows an expansion of the current drop region.
the internal solution occupying the nanopore is preferred and that no intermediate stable states exist between them.
Researchers have already reported using COMSOL Multiphysics to model other ion transport phenomena in nanopores such as ion current rectification4 5and surface charge gating6 . Herein, we will present our numerical model for the bistability of electrolyte transport in conical nanopores.
2. COMSOL Multiphysics modeling 2.1 Governing equations
In this model, the transport of ions (K+ and Cl-) and DMSO are the subjects of interest. Although DMSO is mixed with H2O as the solvent, we consider DMSO as a solute in water. A description of ion and DMSO transport in the nanopore begins with the Navier-Stokes equation describing the pressure and electric force driven flow.
Φ∇)( ∇+∇(1
=∇ ∑2
iiiczFηp
ρuuu (1)
In eq 1, u and Φ are the local position-dependent fluid velocity and potential, ci and zi are the concentration and charge of species i in

Excerpt from the Proceedings of the 2013 COMSOL Conference in Boston
solution, ρ and η are the density and viscosity of the fluid, respectively, F is the Faraday’s constant and p is the pressure. Due to the nanoscale length (L) in this system, the Reynolds number (Re) is estimated to be on the order of 10-4 << 1, using eq 2.
η
vLρ=Re (2)
Therefore, the Laminar Flow module in COMSOL is used to implement the Navier-Stokes equation. For computational simplicity, we assume a constant value for ρ of 1000 kg/m3. However, ion diffusivities and mobilities are strongly dependent on η; thus, literature values of η for DMSO/H2O mixtures7 are used in the simulation. The viscosity η is expressed as a function of the mole fraction of DMSO in DMSO/water mixture by polynomial fitting the experimental data.
The ion fluxes are modeled by the Nernst-Planck equation, including the diffusion, migration and convection terms.
uJ iiii
iii ccDRT
FzcD +Φ∇∇= (3)
In eq 3, Ji and Di, are, respectively, the ion flux vector and diffusion coefficient of species i in solution and T is the absolute temperature. The ion diffusion coefficients Di in DMSO/water mixtures are estimated by Stokes-Einstein equation, eq 4, using the composition-dependent value of η.
rπη
TkD B
i 6= (4)
In eq 4, kB is Boltzmann’s constant and r is the solvated radius of the species i. A value of r = 1.5 × 10⁻¹⁰ m is employed for both K+ and Cl-. DMSO is a neutral molecule, so its flux only contains the diffusive and convective flux (eq 5).
uJ DMSODMSODMSODMSO ccD +∇= (5)
All three fluxes (K+, Cl- and DMSO) are inputted in the model through Transport of Diluted Species modules in COMSOL. Theoretically, the diffusive flux of DMSO should be described by Maxwell-Stephan equation instead of Fick’s laws due to its comparable concentration to water. However, in this model, we chose Fick’s
(a)
Z (μ
m)
0
X 100
-10
0
10
20
30
40
50
60
70
80
0 10 20 30 40
Z (
nm
) x
100
r (nm)
(b)
-10
10
20
5 mM KCl in water
5 mM KClin water/DMSO
mixture
Nanopore orifice
Glass
P and V applied
r (μm)0 10
Charged glass wall ( -26 mC/m2)
Max. mesh size: 2 nm
P = 0, V = 0
Figure 2. (a) Geometry and boundary conditions used in the COMSOL model. (b) Mesh at the nanopore orifice. Maximum mesh size at the charged glass wall (red line) is set as 2 nm to resolve the electrical double layer. laws and assumed DDMSO to be independent of the solution composition (1.25 × 10⁻⁹ m2/s), due to lack of experimental binary diffusivity data for DMSO/water mixtures.
The relationship between the local ion distributions and potential is described by Poisson’s equation, eq 6,
∑=Φ∇2
iiicz
ε
F (6)
Here, ε is the dielectric constant of medium, which is linearly related to the molar fraction of DMSO in the DMSO/water mixture.8 The Electrostatics module in COMSOL is used to describe this relationship. 2.2 Geometry, mesh and boundary conditions a) Geometry
According to our previous study1, the nanopore is conical shaped with a half cone angle ~ 10o and length ~ 25-75 µm. Therefore, in this model, an axis-symmetric geometry is used, and the nanopore has the same cone angle as the experimental value, as shown in Figure 2a. The pore orifice radius is set as 400 nm. The pore length of 10 µm is smaller than the experimental value, but was reported to be sufficiently long to capture the nanopore behaviors.4, 9 Internal and external bulk solutions are represented by two
Excerpt from the Proceedings of the 2013 COMSOL Conference in Boston
cylinders with a radius of 10 µm and height of 10 µm at either side of the conical nanopore.
b) Boundary conditions and Initial values
In the Laminar Flow module, constant pressure boundaries are set at the top and bottom boundaries (z = 20 and -10 µm, respectively), as shown in Figure 2a. All other boundaries are set as no-slip boundaries. Initial pressure and flow rates in the system are all zero.
In the Transport of Diluted Species module for DMSO, an initial DMSO concentration of 10.26 M, corresponding to a DMSO volume ratio of 0.80 in DMSO/water mixture, is set in the external solution cylindrical domain (z from 0 to -10 µm, and r from 0 to 10 µm). A zero initial concentration of DMSO is set at the rest of the geometry. At the top and bottom boundaries, the DMSO concentrations are, respectively, the internal and external bulk concentration (0 and 10.26 M). All other boundaries are no flux boundaries, representing the glass wall. Similarly, the initial concentrations of K+ and Cl- in the external solution cylindrical domain and at the bottom boundary are zero, while at the top boundary and the rest of the domain are 5 mM.
In the Electrostatics module, a surface charge density of -26 mC/m2 is set at the surface near the nanopore orifice to account for the contribution of glass surface charge (highlighted in red line in Figure 2b). This value is calculated using Behrens and Grier’s model.10 Zero potential is set at z = -10 µm and a varying potential is applied at z = 20 µm. Zero charge condition is applied at all other boundaries. Initial values are default values of zero.
c) Mesh
The surface charge on the glass wall generates a distribution of ions within a thin layer near the surface (electrical double layer (EDL)), when the glass is immersed in an electrolyte solution. Debye length is the measurement of EDL thickness. In a 5 mM KCl solution, the Debye length is ~ 5 nm. To resolve the EDL using COMSOL, a mesh size smaller than 5 nm should be used. In this model, we set the maximum mesh size of 2 nm at the negatively charged boundary (Figure 2a). Other mesh settings are used as default.
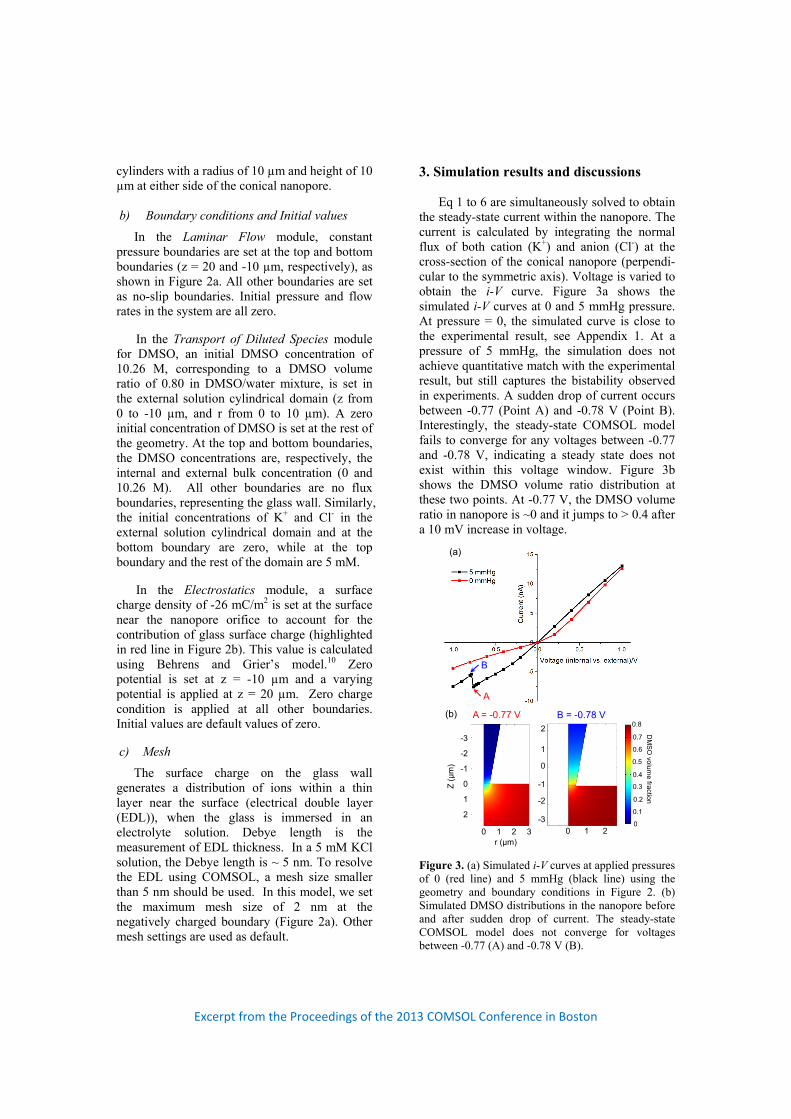
3. Simulation results and discussions Eq 1 to 6 are simultaneously solved to obtain
the steady-state current within the nanopore. The current is calculated by integrating the normal flux of both cation (K+) and anion (Cl-) at the cross-section of the conical nanopore (perpendi-cular to the symmetric axis). Voltage is varied to obtain the i-V curve. Figure 3a shows the simulated i-V curves at 0 and 5 mmHg pressure. At pressure = 0, the simulated curve is close to the experimental result, see Appendix 1. At a pressure of 5 mmHg, the simulation does not achieve quantitative match with the experimental result, but still captures the bistability observed in experiments. A sudden drop of current occurs between -0.77 (Point A) and -0.78 V (Point B). Interestingly, the steady-state COMSOL model fails to converge for any voltages between -0.77 and -0.78 V, indicating a steady state does not exist within this voltage window. Figure 3b shows the DMSO volume ratio distribution at these two points. At -0.77 V, the DMSO volume ratio in nanopore is ~0 and it jumps to > 0.4 after a 10 mV increase in voltage.
A
B
2
1
0
-1
-2
-3
0 1 2 3
(a)
(b) A = -0.77 V2
1
0
-1
-2
-3
0 1 2
B = -0.78 V
Z (μ
m)
r (μm)
DM
SO
volum
e fraction
0.8
0.7
0.6
0.5
0.4
0.3
0.2
0.1
0
Figure 3. (a) Simulated i-V curves at applied pressures of 0 (red line) and 5 mmHg (black line) using the geometry and boundary conditions in Figure 2. (b) Simulated DMSO distributions in the nanopore before and after sudden drop of current. The steady-state COMSOL model does not converge for voltages between -0.77 (A) and -0.78 V (B).

Excerpt from the Proceedings of the 2013 COMSOL Conference in Boston
Con
vect
ive
flu
x
Convective fluxand Diffusive flux
0 1r (μm)
The
flu
x of
DM
SO
to
war
ds z
dire
ctio
n (m
ol/m
2 s)
Z (μ
m)
-40
-20
0
20
40
60
80
100
Figure 4. Simulated DMSO flux along the z direction at -0.77 V. Positive sign denotes a flux into the nanopore.
Figure 4 shows the steady-state distribution of DMSO flux along the z-direction at -0.77 V, just prior to the nanopore entering the low conductivity state. This figure shows that the convective flux (blue arrow) due to the pressure-driven flow is largest across the central region of the nanopore orifice and is directed outward. The diffusive flux of DMSO and the convective flux due to electroosmosis (black arrow) are directed inward along the circumference of the orifice. As the voltage is shifted to a slightly more negative value of -0.78 V, the electroosmotic force increases, resulting in a larger inward DMSO flux and the movement of the DMSO/water solution towards the nanopore interior. We speculate that the bistability behavior results from positive feed-back loop, as shown in Figure 5. An increase in the DMSO flux causes the DMSO concentration increase at the orifice, and therefore, increases the viscosity of the solution in the nanopore. This results in a further decrease in the outward convective flow. The resulting decrease in outward flow causes an even higher DMSO concentration in the nanopore interior. This positive feed-back would continue until the nanopore enters the low conducting state, at which point, the electroosmotic forces would decrease and a new steady state would be established. Additional transient simulations of this system are required to better understand the positive feed-back process that leads to the bistability of electrolyte transport.
Positive feed-back
loop
Larger influx of DMSO
Higher CDMSO
inside nanopore
Viscosity increases
Weakerpressure-
driven flow
Figure 5. Possible positive feed-back loop mechanism for the bistability of electrolyte transport in a conical nanopore. 4. Summary
A steady-state model based on Nernst-Planck equation, Navier-Stokes equation and Poisson’s equation using COMSOL Multiphysics successfully captured the bistability behavior observed in experiments. This model did not converge within a small voltage window where the sudden drop in current occurs, indicating that no stable steady states exists between the high conductivity and low conductivity states, in agreement with experimental observation. A positive feed-back loop is likely to account for the bistability. Further simulations modeling the time-dependent behavior are needed to confirm the feed-back process. Also, the use of Fick’s laws instead of Maxwell-Stephan equation to describe the diffusion of DMSO is a likely source of discrepancy between experiment and simulation. A much simpler bistable system using two aqueous solutions containing different concentrations of KCl is being investigated and will be reported elsewhere. Preliminary models of these systems yield a more quantitative match with the experimental results in the studies reported here.
5. Acknowledgements
L.L. acknowledges financial support provided by pre-doctoral fellowship from University of Utah Nanotechnology Training Program.

Excerpt from the Proceedings of the 2013 COMSOL Conference in Boston
6. References
1. Zhang, B.; Galusha, J.; Shiozawa, P. G.; Wang, G.; Bergren, A. J.; Jones, R. M.; White, R. J.; Ervin, E. N.; Cauley, C. C.; White, H. S., Bench-Top Method for Fabricating Glass-Sealed Nanodisk Electrodes, Glass Nanopore Electrodes, and Glass Nanopore Membranes of Controlled Size. Analytical Chemistry 79, 4778-4787 (2007). 2. Lan, W.-J.; Holden, D. A.; Zhang, B.; White, H. S., Nanoparticle Transport in Conical-Shaped Nanopores. Analytical Chemistry 83, 3840-3847 (2011). 3. Luo, L.; Holden, D. A.; Lan, W.-J.; White, H. S., Tunable Negative Differential Electrolyte Resistance in a Conical Nanopore in Glass. ACS Nano 6, 6507-6514 (2012). 4. White, H. S.; Bund, A., Ion Current Rectification at Nanopores in Glass Membranes. Langmuir 24, 2212-2218 (2008). 5. Cao, L.; Guo, W.; Wang, Y.; Jiang, L., Concentration-Gradient-Dependent Ion Current
Rectification in Charged Conical Nanopores. Langmuir 28, 2194-2199 (2011). 6. White, H. S.; Bund, A., Mechanism of Electrostatic Gating at Conical Glass Nanopore Electrodes. Langmuir 24, 12062-12067 (2008). 7. Miao, W.; Ding, Z.; Bard, A. J., Solution Viscosity Effects on the Heterogeneous Electron Transfer Kinetics of Ferrocenemethanol in Dimethyl Sulfoxide−Water Mixtures. The Journal of Physical Chemistry B 106, 1392-1398 (2002). 8. Yang, L.-J.; Yang, X.-Q.; Huang, K.-M.; Jia, G.-Z.; Shang, H., Dielectric Properties of Binary Solvent Mixtures of Dimethyl Sulfoxide with Water. International Journal of Molecular Sciences 10, 1261-1270 (2009). 9. Lan, W.-J.; Holden, D. A.; White, H. S., Pressure-Dependent Ion Current Rectification in Conical-Shaped Glass Nanopores. Journal of the American Chemical Society 133, 13300-13303 (2011). 10. Behrens, S. H.; Grier, D. G., The charge of glass and silica surfaces. The Journal of Chemical Physics 115, 6716-6721 (2001).
Appendix 1
DM
SO
volu
me fraction
0.8
0.7
0.6
0.5
0.4
0.3
0.2
0.1
0
Cur
ren
t /n
A
Voltage (internal vs. external)/V
Figure 6. Simulated and experimental current-voltage curves for a 400 nm radius nanopore separating internal 5 mM KCl aqueous solution and external 5 mM KCl in DMSO/water mixture (DMSO volume fraction ~0.8).