number and spatial distribution of ip3 receptors underlying calcium puffs jianwei shuai, sheila l....
Post on 19-Dec-2015
219 views
TRANSCRIPT

Number and Spatial Distributionof IP3 Receptors UnderlyingCalcium Puffs
Jianwei Shuai, Sheila L. Dargan, Heather J. Rose and Ian Parker
Department of Neurobiology and BehaviorUniversity of California, Irvine
NIH Grant
Long Beach, Feb. 14, 2005

zx
blip
puff
Hierarchical Organization of Ca2+ Signals
Two Basic Questions:How many IP3R channels open during a puff?
How large is the width of an IP3R channel cluster?
<10 ?<300 nm ?

Averaged Trigger: Duration = 12 msec, Spatial width at half peak = 0.6 m.
Averaged Puff: Rising Time = 18 msec, Spatial width at half peak = 1.6 m, Duration at half peak = 30 msec.
Peak Ratio = Puff peak / Trigger peak = 6.7 (F/F0) / 1.1 (F/F0) = 6.1.
Time
Sp
ace
Puff Initiation with a Trigger Event
2100 2150 2200 2250 2300
8
6
4
2
0
Fluorescence
Base line
PuffRising
Trigger
F/F0
Time (msec)
Puff: Dec_06061
0 20 40 60 80 100
2
4
6
0
8
PuffRising
Trigger
Averaged Puff with Trigger Event
F/F0
Base line
Time (msec)
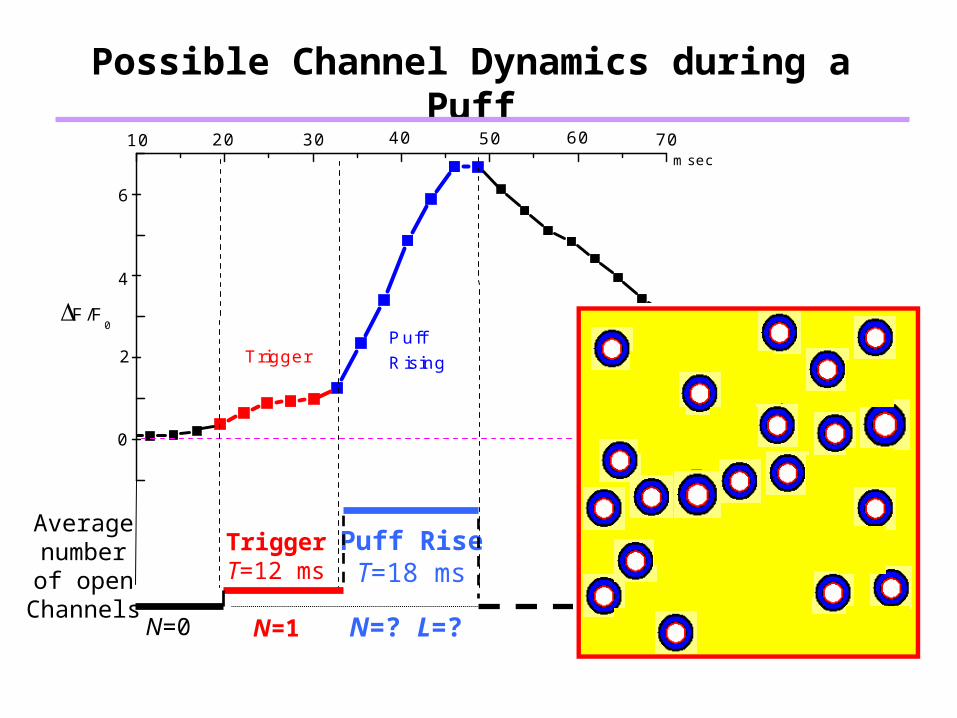
Possible Channel Dynamics during a Puff
Averagenumberof open
Channels
70605040302010
6
4
2
0
msec
PuffRisingTrigger
F/F0
TriggerT=12 ms
N=1
Puff RiseT=18 ms
N=? L=?N=0
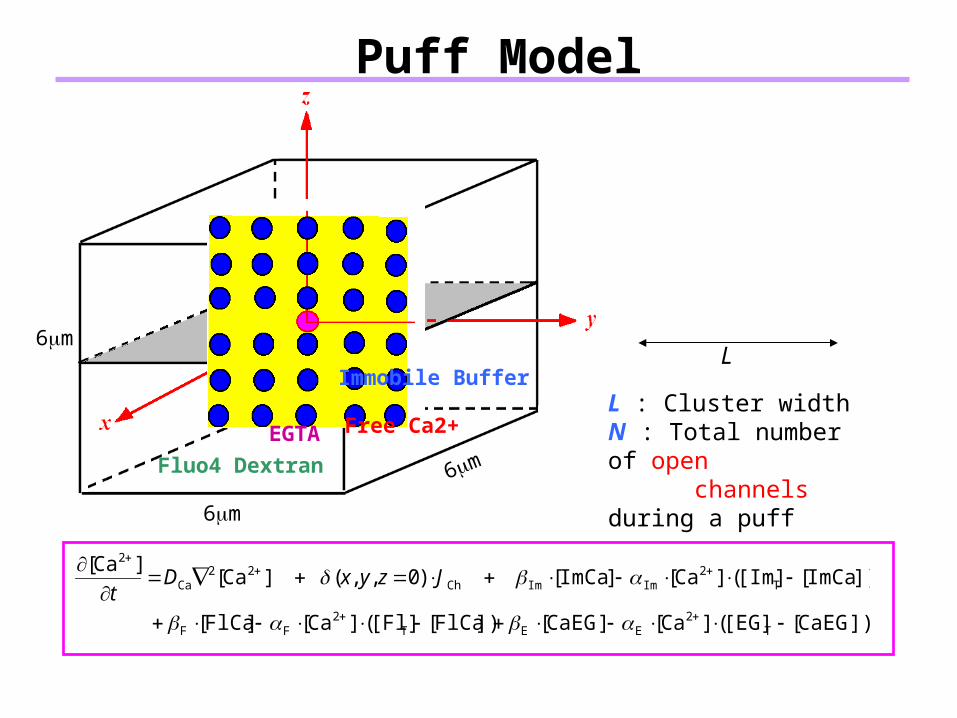
Puff Model
6m
6m
6m
L : Cluster widthN : Total number of open channels during a puff
])CaEG[[EG](]Ca[]CaEG[])FlCa[[Fl](]Ca[]FlCa[
])ImCa[[Im](]Ca[]ImCa[ )0,,( ]Ca[]Ca[
T2
EET2
FF
T2
ImImCh22
Ca
2
JzyxDt
L
Free Ca2+
Immobile Buffer
EGTA
Fluo4 Dextran

Modeling a Puff
msec 12
pA 4.0
Trigger
IP3R
T
I
Free Ca2+ (M) FluoCa (M)
1000 2000 3000 4000 5000
0
20
40
60
80
100
Distance (nm)
Trigger Puff Peak
1000 2000 3000 4000 50000
5
10
15
20
25
Distance (nm)
Trigger Puff Peak
L msec 18Rising Puff T
L=760 nmN=30L=?N=?
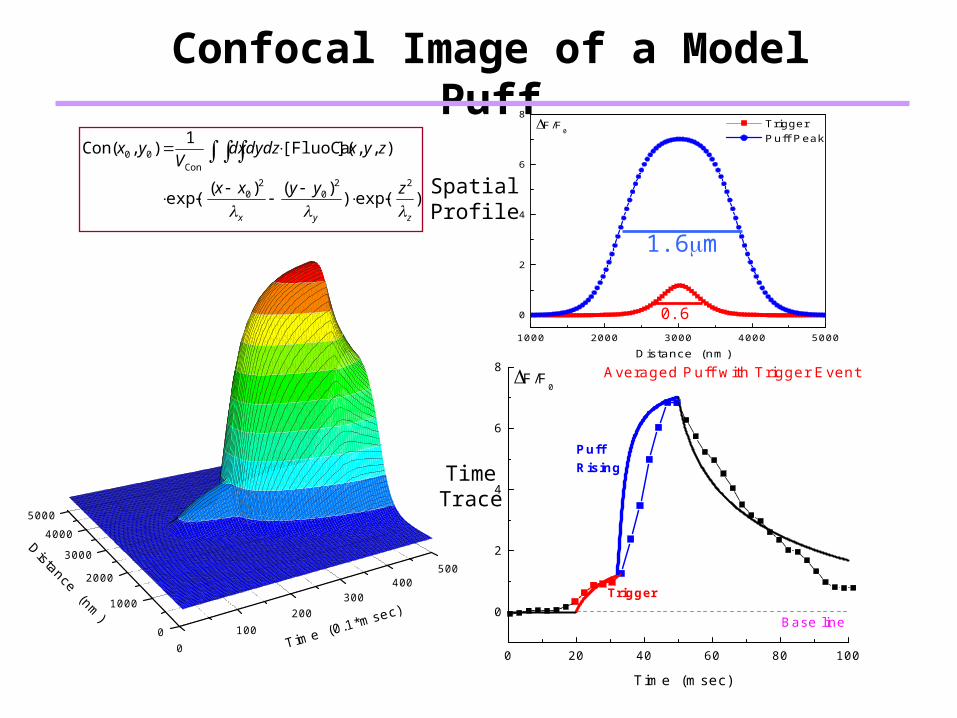
Confocal Image of a Model Puff
0100
200300
400500
0
1000
2000
3000
4000
5000
SpatialProfile
TimeTrace
1000 2000 3000 4000 5000
0
2
4
6
8F/F
0
Distance (nm)
Trigger Puff Peak
0 20 40 60 80 100
0
2
4
6
8 F/F0
Base line
PuffRising
Trigger
Time (msec)
Averaged Puff with Trigger Event
)exp())()(
exp(
),,]([FluoCa1
),(Con
220
20
Con00
zyx
zyyxx
zyxdxdydzV
yx
1.6m
0.6

Estimating the number of open channels,and their distribution within a Cluster
Average Peak Ratio R0 = 6.0 , Average Puff Width W0=1600nm
Numberof
openchannels
duringa
puff
R=6.0, W=1600
20
20
20
20 )(1
1
)(1
1 Degree Matching
WWWRRR
Cluster Width (nm)
nm 2000nm 1200
, 5.74.5
W
R
200 400 600 800 1000
20
40
60
80
100
1.9001.9021.9041.9061.9081.9101.9121.9141.9161.9181.9201.9221.9241.9261.9281.9301.9321.9341.9361.9381.9401.9421.9441.9461.9481.9501.9521.9541.9561.9581.9601.9621.9641.9661.9681.9701.9721.9741.9761.9781.9801.9821.9841.9861.9881.9901.9921.9941.9961.9982.000
nm 2000or nm 1200
,5.7or 4.5
WW
RR

Conclusion
Width at Half Peak (nm) 600 610Trigger
Ratio
760 (400 - 1000)30 (20 - 45)
Puff
Experiment
2. Prediction
Cluster Width (nm)Open Channel No. during a Puff
<300?<10 ?
Model1. Data
160030
6.1
160032
5.9
Width at Half Peak (nm)Duration at Half Peak (ms)
Puff Peak / Trigger Peak
msec 18
msec 12
Rising Puff
Trigger
T
T
pA 4.0IP3R I


Simulation of Confocal Image
Scan line
)exp())()(
exp(),,]([FluoCa1
),(Con22
02
0
Con00
zyx
zyyxxzyxdxdydz
Vyx
[Fluo4Ca]

Channel Current
200 400 600 800 1000
20
40
60
80
pA 4.0IP3R I
pA 2.0IP3R I
pA 3.0IP3R I
pA 5.0IP3R I
pA 6.0IP3R I