nuclear power’s - nirs · nuclear capital costs are repeating their unhappy history ... by molly...
TRANSCRIPT

1
1

Nuclear power’s competitive landscape
Amory B. Lovins, Chairman & Chief ScientistRocky Mountain Institute, www.rmi.org, [email protected] panel, AREdays, Aspen, Colorado, 21 August 2010
Copyright © Rocky Mountain 2010. All rights reserved.
2

Nuclear capital costs are repeating their unhappy history
Sources: historic: Koomey & Hultman, En. Pol. 35:5630–5642 (2007); projected: original sources reanalyzed by Molly M. Ward (RMI) in the graphical style of Mark Cooper (Vermont Law School), June–August 2010
!"
#$!!!"
%$!!!"
&$!!!"
'$!!!"
(!$!!!"
()*!" ()*+" ()'!" ()'+" ())!" ())+" #!!!" #!!+" #!(!"
#!!),-./
"
0123"45"46132748"9:4;6<1=1>"?8@=AB"43"6?C<@:2748"9634D1:=1>"?8@=AB"
!"#$%&'%()'*+,-."#.)'/0.+(123#'4,5#',6'7898'*+.55$+1:.)';%#.+'<.%"#,+5'
E4;6<1=1>"F<28="G7<@=H"
I@828:@2<"J8A7=?748"K:2>1;@:"
J8>1618>18="K82<HA="L4M138;18="
N?:<123"O32>1"KAA4:@2748"
All-in costs are ~2× the overnight costs shown
3

A reasonable and honest conclusion...
“What is clear is that it is completely impossible to produce definitive estimates for new nuclear costs at this time…”
—Steve Kidd, Director of Strategy & Research, World Nuclear Association, Nuclear Engineering International, 22 August 2008,
www.neimagazine.com/storyprint.asp?sc=2050690
Apparent recent escalation reflects “cost firming” as buyers move from claims to actual proposals and bids
4
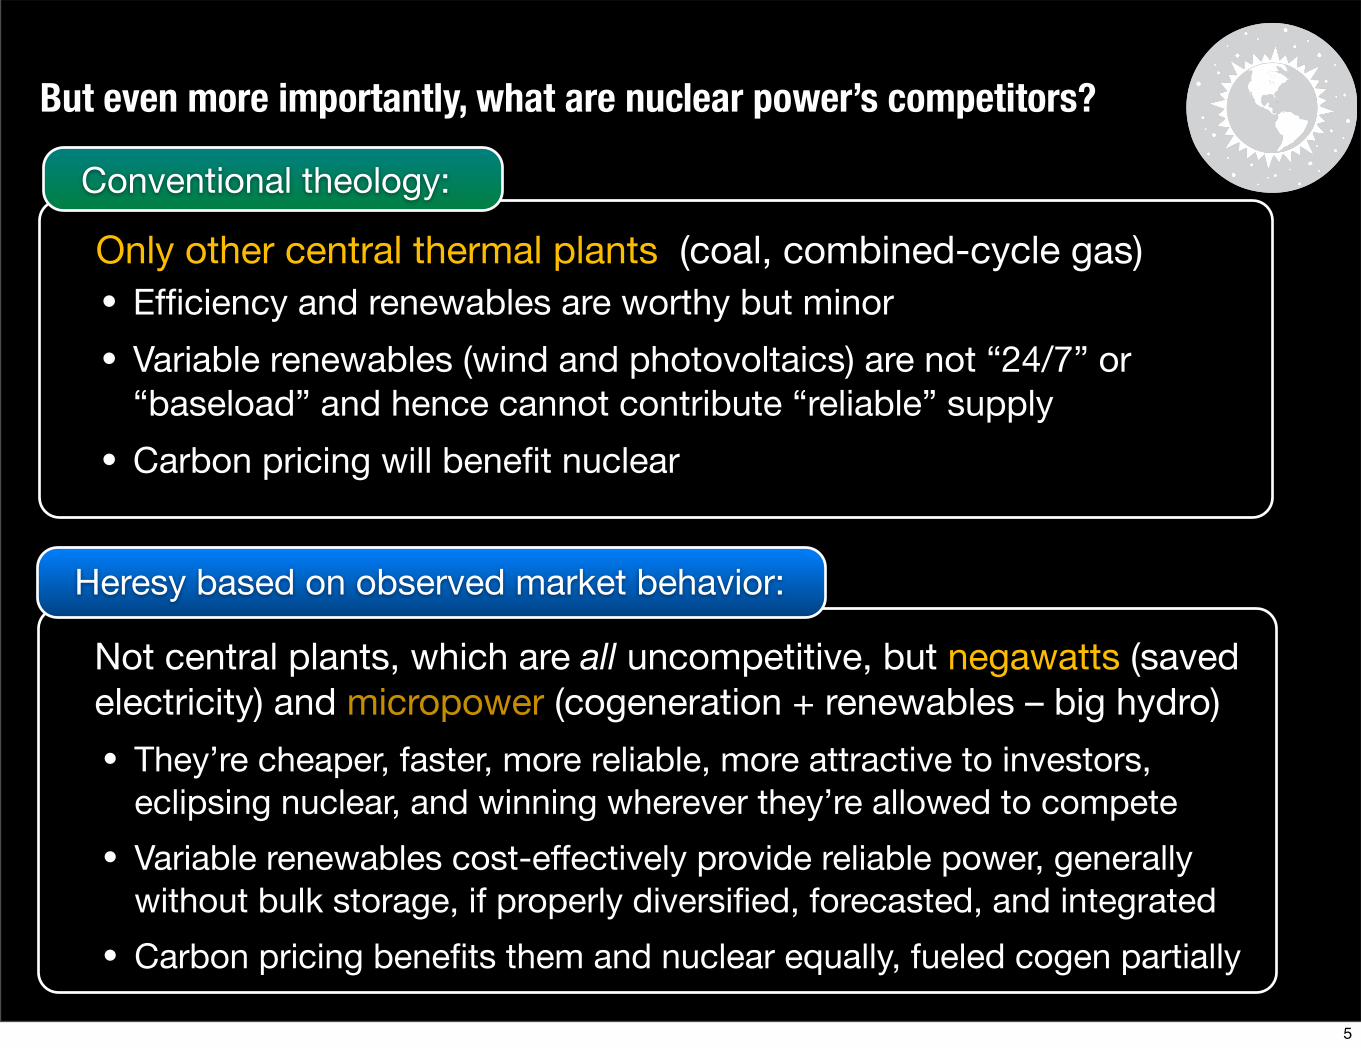
Only other central thermal plants (coal, combined-cycle gas)
Conventional theology:
Not central plants, which are all uncompetitive, but negawatts (saved electricity) and micropower (cogeneration + renewables – big hydro)
Heresy based on observed market behavior:
• Efficiency and renewables are worthy but minor
• Variable renewables (wind and photovoltaics) are not “24/7” or “baseload” and hence cannot contribute “reliable” supply
• Carbon pricing will benefit nuclear
• They’re cheaper, faster, more reliable, more attractive to investors, eclipsing nuclear, and winning wherever they’re allowed to compete
• Variable renewables cost-effectively provide reliable power, generally without bulk storage, if properly diversified, forecasted, and integrated
• Carbon pricing benefits them and nuclear equally, fueled cogen partially
But even more importantly, what are nuclear power’s competitors?
5

Untapped savings are becoming far bigger and cheaper—radically so with integrative design, which all official studies ignore
Competition from end-use efficiency
• Since 1975, California profitably held per-capita electricity use flat while per-capita real income rose 79%, saving ~US$100b of el. capex
• RMI 2008: Using electricity as productively as the top 10 US states did in 2005 (GDP/kWh adjusted for each state’s economic mix & cli-mate) would save ~1,200 TWh/y, or ~62% of U.S. coal-fired electricity
• McKinsey 2009: efficiency can very profitably save half of current U.S. coal-electric production by 2020
• NAS/NRC 2009: efficiency can save at least 30–34% of U.S. buildings’ electricity at one-fourth its 2007 average retail price (a ~2-y payback)
• EPRI 1990: U.S. could profitably save 40–60% of 2000 electricity use at an average cost ~$0.03/kWh (2007 US$)
• RMI 1990: long-run, that’s ~75% at av. cost ~$0.01/kWh (2007 US$)
• Av. utility program costs ~US$0.01–0.03/kWh; best <US$0.01/kWh
6

Global markets are rapidly shifting to distributed renewables
-10!
0!
10!
20!
30!
40!
50!
1990! 1995! 2000! 2005! 2010!
GW !
Global Generating Capacity: "Annual Net Additions, 1990–2010!
Wind!
Photovoltaics!
Nuclear!
July 2010 industry estimates of Dec 2010
production capacity worldwide (GW/y)
Output additions from nuclear fell behind
PVs’ since 2007 and may never catch up
7

Nuclear and micropower generation have more than swapped roles,mainly due to market perceptions of their relative costs and risks
!"#$
!%#$
!&#$
!'#$
!(#$
!)#$
!*#$
!+#$
",,,$ ",,!$ ",,"$ ",,%$ ",,&$ ",,'$ ",,($ ",,)$ ",,*$ ",,+$
Share of global electricity generationnuclear power
micropower
Sources: nuclear and total: BP Statistical Review of World Energy 2010; micropower: RMI analysis from industry sources (www.rmi.org/rmi/Library/2010-06_MicropowerDatabase). BP generation data are gross, renewables generally net (understating their relative share).
Power sources that get their economies from mass production, not from giant units, have swapped their share of global electricity production with nuclear power’s share. What The Economist magazine calls “micropower”—that is, cogeneration, plus renewables, minus big hydro dams—made 91% of the world’s new electricity in 2008. Micropower and efficiency are walloping all central power plants in the world market, mainly due to their lower cost and financial risk.
8
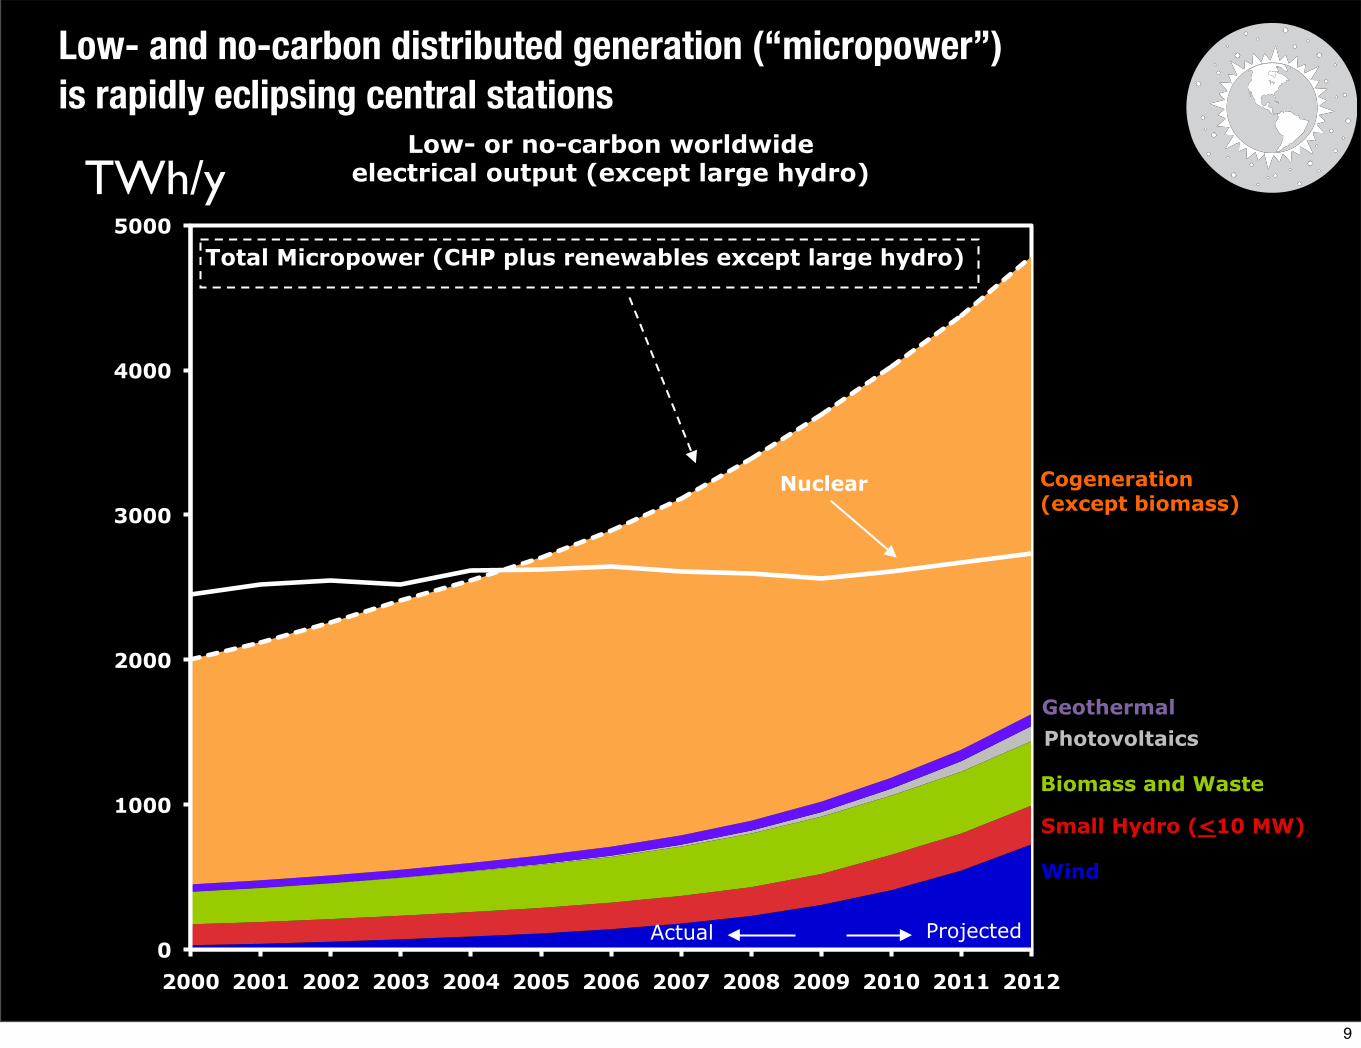
Low- and no-carbon distributed generation (“micropower”)is rapidly eclipsing central stations
0
1000
2000
3000
4000
5000
2000 2001 2002 2003 2004 2005 2006 2007 2008 2009 2010 2011 2012
Low- or no-carbon worldwide electrical output (except large hydro)
Wind
Small Hydro (<10 MW)
B
Biomass and Waste
Photovoltaics
Nuclear Cogeneration (except biomass)
Total Micropower (CHP plus renewables except large hydro)
Actual Projected
Geothermal
TWh/y
Micropower’s output is booming, while nuclear output just fell for the third year. Micropower will surpass nuclear power in global capacity this year and in output around 2014.Last year, all renewables made up 1/4 of global power capacity and 1/2 of new capacity, got over half of power-plant investment, and generated 18% of global electricity. Renewables except big hydro got $131 billion of private investment last year and added 52 billion watts, while new nuclear plants got no private investment and lost capacity. In the U.S., they’re over 100% subsidized, but still can’t raise any private capital, because they have no business case.
9

Distributed renewable generators will surpass nuclear powerin capacity in 2010 and in annual output around 2014
0
200
400
600
800
1000
2000 2001 2002 2003 2004 2005 2006 2007 2008 2009 2010 2011 2012
Low- or no-carbon worldwide installed electrical generating capacity (except large hydro)
Cogeneration (except by biomass)
Wind
Small Hydro (<10 MW) B
Biomass and Waste
Photovoltaics
Geothermal Nuclear
Actual
Total Micropower (CHP plus renewables except large hydro)
Projected
GWe
10

What “nuclear renaissance”? Here it is...
11
end 2009: 56(24% of 1979
peak), or4.4 % of 2007capacity underconstruction
Of the 61 “under construction” reactors shown by IAEA at 26 July 2010: • 12 have been under construction for >20 years; 39 have no official startup date; half are late• 44 are in China, India, Russia, or S. Korea; 6 of 10 starts in ’08 and 9 of 11 in ’09 are in China• All 61 are centrally planned, usually by authorities with a draw on the public purse• Zero are free-market purchases fairly compared or competed against available alternatives
Here’s the number of nuclear reactors (in blue) and their capacity (in red) that the International Atomic Energy Agency lists as “under construction” in each year since 1950. The “nuclear renaissance” is * this recent uptick to 27% of the 1979 construction rate. There are now 61 nuclear plants officially “under construction.” However, of those 61 units, * 12 have been “under construction” for over 20 years, 39 have no official startup date, half are late, * 72% are in four untransparent power systems, * all 61 were bought by central planners, and * none were free-market transactions.
11

New nuclear plants will scarcely be able to offset old units’ retirements
12
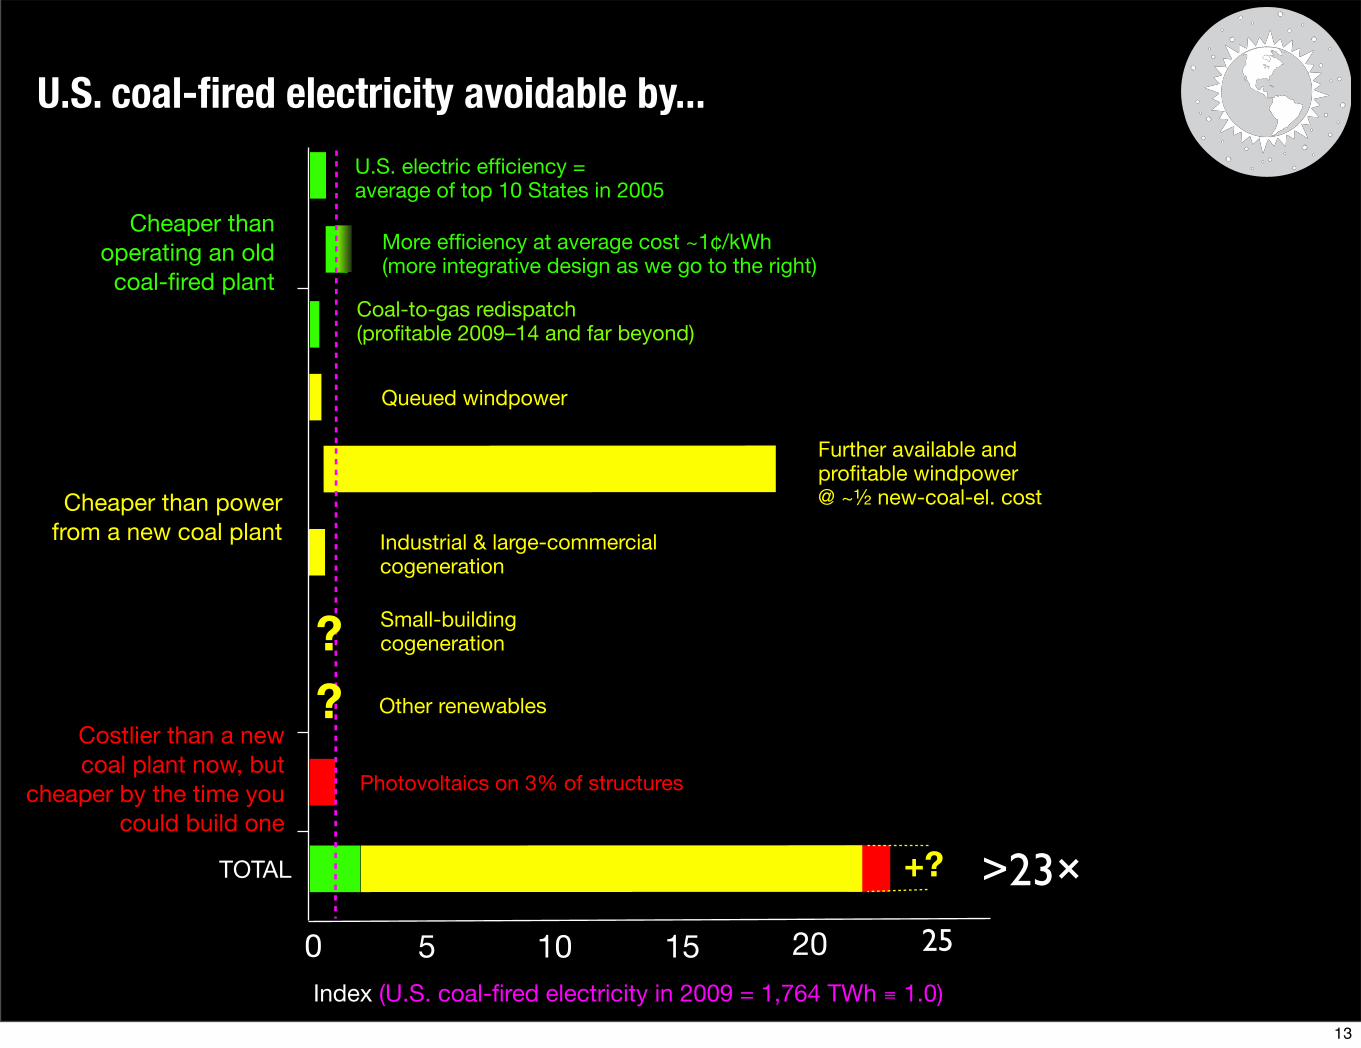
U.S. coal-fired electricity avoidable by...
U.S. electric efficiency = average of top 10 States in 2005
Industrial & large-commercial cogeneration
Photovoltaics on 3% of structures
Queued windpower
Further available and profitable windpower @ ~½ new-coal-el. cost
More efficiency at average cost ~1¢/kWh (more integrative design as we go to the right)
>23×
Cheaper than operating an oldcoal-fired plant
Cheaper than power from a new coal plant
TOTAL
Costlier than a new coal plant now, but
cheaper by the time you could build one
Index (U.S. coal-fired electricity in 2009 = 1,764 TWh ≡ 1.0)
0 252015105
Coal-to-gas redispatch (profitable 2009–14 and far beyond)
Small-building cogeneration?Other renewables?
+?
13

Major conservatisms in the foregoing comparisons
• End-use efficiency often has side-benefits worth 1– 2 orders of magnitude more than the saved energy
• End-use efficiency and distributed generators have 207 “distributed benefits” that typically increase their economic value by an order of magnitude (www.smallisprofitable.org)
• Integrating renewables with each other typically saves over half their capacity for a given reliability
• Integrating strong efficiency with renewables typically makes them cheaper and more effective
• Efficiency and most renewables are getting cheaper while nuclear costs rise, but these comparisons didn’t trend projected costs
• Prospects for new technology breakthroughs are ubiquitous with efficiency and renewables but very hard to envisage for nuclear
14

What about proposed “new” types of nuclear reactors?
• Other than TerraPower’s “travelling-wave reactor” concept, they’re not new (e.g., molten-salt thorium has been discussed since ~1944)
• Small prototypes say little about scaling up—especially with novel and closely coupled fuel cycles that must run continuously and often need new chemistry and engineering (e.g., pyrometallurgy)
• In more than 60 years, every new type of reactor has proven far more costly, slow, difficult, and problematic than its advocates claimed
• Assuming a new reactor and a new fuel cycle and new political and competitive environments is a costly fantasy
• If the nuclear 1/3 of capital cost for today’s GW-scale reactors were free, the non-nuclear 2/3 would still be grossly uncompetitive
• For physics reasons, the systems needed to harness heat and to manage heat and radiation generally don’t scale down well
• Can new “mass-produced miniature” concepts ever catch up with competitors already ~2–20× cheaper today—and already decades ahead in capturing their own mass-production economies?
15

A voice of experience
“An academic reactor or reactor plant almost always has the following basic characteristics: (1) It is simple. (2) It is small. (3) It is cheap. (4) It is light. (5) It can be built very quickly. (6) It is very flexible in purpose. (7) Very little development will be required. It will use off-the-shelf components. (8) The reactor is in the study phase. It is not being built now.
“On the other hand a practical reactor can be distinguished by the following characteristics: (1) It is being built now. (2) It is behind schedule. (3) It requires an immense amount of development on apparently trivial items. (4) It is very expensive. (5) It takes a long time to build because of its engineering development problems. (6) It is large. (7) It is heavy. (8) It is complicated.”
–ADM Hyman Rickover, USN, 1953www.ecolo.org/documents/documents_in_english/Rickover.pdf)
16

Supplementary slides
17

Nuclear is the costliest of the low- or no-carbon resources
2009 order ~10–13¢
2009 order ~9–13¢
2008 av. 8.4¢ net of 1¢ PTC
“Forget Nuclear,” at www.rmi.org/sitepages/pid467.php; “The Nuclear Illusion,” Ambio, in press, 2010, preprint (soon to be updated) at www.rmi.org/images/PDFs/Energy/E08-01_AmbioNucIllusion.pdf
2007
US
¢ p
er d
eliv
ered
kW
h
Nuclear Coal Combined-cycle gas Wind
Waste-heat
cogenCC
cogenBldg
cogen Efficiency
MIT(2003)
Keystone (June 2007)
Moody's $7,500/kWe capex + Keystone O&M and financing: 15.2–20.6¢/kWh
18

Nuclear Coal Combined-cycle gas Wind
Waste-heat cogenCC cogen Bldg cogen Efficiency
kg C
O2
dis
pla
ced
per
200
7 d
olla
r
Coal-fired CO2 emissions displaced per dollar spent on electrical services
MIT study 03
Keynote high nuclear cost scenario (6/07)
Moodyʼs estimate (5/08)
1¢: 93 kg CO2/$2¢: 47 kg CO2/$
Carbon displacement at various efficiency costs/kWhNew nuclear saves 2–20× less carbon per
dollar, ~20–40× slower, than efficiency and micropower investmentsBuying new nuclear instead of efficiency results in more carbon release than if the same money had been spent buying a new coal-fired power plant
The cheapest and lowest-carbon sources save the most CO2 per dollar
19

This next-generation utility shows promise of feasibility and profitability
Much work remains to consolidate, test, and implement the concept...but Ireland already plans 40% renewable electricity by 2020, 100% by 2035
• Extensive energy modeling and practice have demonstrated major efficiency and demand-response potential in new and retrofit buildings and factories
• Hour-by-hour utility modeling indicates that demand response technology operating on a smart grid can enable large-scale integration of variable renewables
20

!"
#!"
$!"
%!"
&!"
'!"
(!"
#" $" %" &" '" (" )"
!"#
$%&#
*+,-,./0"01/2"
!"
#!"
$!"
%!"
&!"
'!"
(!"
#" $" %" &" '" (" )"
!"#
$%&#
*+,-./,0"
12-3-/45"5647"
8647"96":..9"
!"
#!"
$!"
%!"
&!"
'!"
(!"
#" $" %" &" '" (" )"
!"#
$%&#
*+,-./,0"
12345"
6-/7"
85-9-/43"3247"
:247";2"<..;"
!"
#!"
$!"
%!"
&!"
'!"
(!"
#" $" %" &" '" (" )"
!"#
$%&#
*+,-./,0"
123456."-/"
13754"
8-/9"
:4-6-/57"7359"
;359"23"<..2"
=-/57"7359"
!"
#!"
$!"
%!"
&!"
'!"
(!"
#" $" %" &" '" (" )"
!"#
$%&#
*+,-./,0"
123456."-/"
123456."372"
8-395::"
13;54"
<-/="
>.32?.495;"
@4-6-/5;";35="
A35="23"9..2"
B-/5;";35="
Energy efficiency can reverse peak demand growth
Renewables like wind and solar are
not always correlated to
demand
PHEV charging (or other storage) and demand response can re-shape the
demand profile to better match renewable output
Firm renewable resources like
geothermal can be used to balance wind and
solar
Storage discharge and flexible biomass can meet peak demand
when wind and solar output is low
21

Current System
Coal and Nuclear
Natural Gas & Oil
Energy Efficiency
& Renewables
Next Generation Utility
Energy Efficiency & Renewables
Combined-heat-and-power,Other distributed gen.
Coal and Nuclear
Demand Response& El. Vehicles
Transforming the electricity sector
22

China’s nuclear construction starts are >3× rest-of-the-world’s: what is the internal competition?
–26 GW
• Nuclear (9 GW op, 23 GW constr’n, ?40–70 by 2020): novel construc-tion methods, low but untransparent reported costs, too early to judge
• Nearest analog, France, had 3.5× real cost/kW escalation 1970–2000
• Clear signs of overheating, safety & possibly corruption concerns (Kang)
• Big hydro: 14% of China’s electricity (nuclear 2%); end-2009 hydro total 197 GW, planned for 270 GW by 2020; economic potent’l ~395 GW
• ~2/3 of 2005–7 plants were illicit• 62 GW of dirtiest, least efficient
units closed 2005–09; 31 GW more planned to close by 2011
• Net additions halved 2006–09• Fleet efficiency better than U.S.• ’09 thermal share –1.45% points• ’10 add’ns planned: 55 GW coal,
15 hydro, 13 wind, 1 nuclear
23

Big China story is the less-reported competitors
• Efficiency: 70% of growth in energy services 1980–2001 and now (energy intensity fell ~5% in 2009, ≥4%/y in 2005–10; stronger laws)• Causes of 2001–06 binge on basic-materials industries now corrected• Efficiency is #1 strategic priority in 11th FYP, even stronger in 12th FYP
• Cogeneration and distributed engines: ~28 GW 2005, fast-growing, statistics unclear; increasingly gas-fired, very large gas resource base
• Wind: beat 2010 target in 2007, 25 GW ’09 (will far exceed 30-GW 2020 target 2010; new 2020 target 100–150 GW (5–8× Three Gorges Dam), including 6× 10–30 GW; grid will soon catch up; 70 firms; 2008 installed cost 21–47% below U.S. 2007–08 av.; available cost-effective sites @ 80m hub height can make 1 TW = 2× 2008 total electricity use
• Small hydro: consistently adding several GW/y• PV: 2020 target just raised from 10 to 20 GW, may be raised to 30; 400
firms; price dropped ≥40% during 2009; $1.30/Wp 2010?• Now world #1 maker of PV, wind, small hydro, solar thermal, & biogas• China’s distributed renewables in 2006 were 6.5× nuclear capacity and
grew 7× faster; in 2009, the gap widened to 7.3× and ∞ (23 GW vs 0)24

Four pillars of nonproliferation logicLovins, Lovins, & Ross, Foreign Affairs, Summer 1980; Lovins, Foreign Policy, 21 Jan 2010
1. We can have proliferation with nuclear power, via either end of any fuel cycle: “every form of every fissionable material in every nuclear fuel cycle can be used to make...bombs, either on its own or in combination with other ingredients made widely available by nuclear power.”
2. We can’t have nuclear power without proliferation, because its vast flows of materials, equipment, skills, knowledge, and skilled people create do-it-yourself bomb kits wrapped in innocent-looking civilian disguise.
3. We can have proliferation without nuclear power—but needn’t if we do it right: with unimportant exceptions, “every known civilian route to bombs involves either nuclear power or materials and technologies whose possession, indeed whose existence in commerce, is a direct and essential consequence of nuclear fission power.”
4. Crucially, in a world without nuclear power, the ingredients needed to make bombs by any known method would no longer be ordinary items of commerce. They’d become harder to get, more conspicuous to try to get, and politically costlier to be caught trying to get (or supply), because their purpose would be unambiguously military. This disambiguation would make proliferation not impossible but far harder—and easier to detect timely, because intelligence resources could focus on needles, not haystacks. Thus phasing out nuclear power is a necessary and nearly sufficient condition for nonproliferation.
How fortunate, then, that buying cheaper (and inherently nonviolent) alternatives to nuclear power is also the most effective course for climate protection—and to obtain reliable and affordable energy for global development! Time to reframe NPT Article IV around that goal.
25