review of new brunswick power’s - synapse energy
TRANSCRIPT

485 Massachusetts Avenue, Suite 2
Cambridge, Massachusetts 02139
617.661.3248 | www.synapse-energy.com
Review of New Brunswick Power’s
2018/2019 Rate Case Application
In the Matter of the New Brunswick Power Corporation
and Section 103(1) of the Electricity Act
Matter No. 375
Prepared for the New Brunswick Energy and Utilities Board Staff
January 18, 2018
AUTHORS
Tim Woolf Asa Hopkins, PhD Melissa Whited Kenji Takahashi Alice Napoleon

Synapse Energy Economics, Inc. Review of New Brunswick Power’s 2018/2019 General Rate Application
CONTENTS
EXECUTIVE SUMMARY ............................................................................................................................. 3
1. INTRODUCTION ................................................................................................................................ 8
1.1. Purpose ...........................................................................................................................8
1.2. Qualifications ..................................................................................................................8
2. REVENUE REQUIREMENTS ................................................................................................................ 12
2.1. New Brunswick Power’s Proposal ................................................................................... 12
2.2. Industry and Regulatory Context .................................................................................... 13
2.3. Conclusions and Recommendations................................................................................ 16
3. RATE ADJUSTMENT MECHANISM ....................................................................................................... 20
3.1. New Brunswick Power’s Proposal ................................................................................... 20
3.2. Regulatory Context ........................................................................................................ 20
3.3. Advantages of the Rate Adjustment Mechanism ............................................................. 21
3.4. Disadvantages of the Rate Adjustment Mechanism......................................................... 22
3.5. Conclusions and Recommendations................................................................................ 22
4. INTEGRATED RESOURCE PLANNING ..................................................................................................... 24
4.1. New Brunswick Power’s IRP ........................................................................................... 24
4.2. The Role of NB Power’s IRP ............................................................................................ 27
4.3. Limitations of NB Power’s IRP Analysis ........................................................................... 28
4.4. Recommendations ......................................................................................................... 30
5. ENERGY SMART OVERVIEW .............................................................................................................. 33
6. SMART HABITS .............................................................................................................................. 35
6.1. Energy Efficiency Programs ............................................................................................ 35
6.2. Demand Response Programs .......................................................................................... 40
6.3. Evaluation, Measurement, and Verification .................................................................... 43
6.4. Opportunities for Future Plans ....................................................................................... 46
6.5. Recommendations ......................................................................................................... 48

Synapse Energy Economics, Inc. Review of New Brunswick Power’s 2018/2019 General Rate Application
7. SMART GRID ................................................................................................................................. 52
7.1. Advanced Metering Infrastructure .................................................................................. 52
7.2. Non-AMI Smart Grid Proposal ........................................................................................ 61
8. SMART SOLUTIONS ......................................................................................................................... 63
8.1. New Brunswick Power’s Proposal ................................................................................... 63
8.2. Discussion ...................................................................................................................... 64
8.3. Recommendations ......................................................................................................... 66
9. PERFORMANCE METRICS AND REPORTS ............................................................................................... 68
9.1. The Role of Performance Metrics and Reports ................................................................ 68
9.2. Existing Performance Metrics and Reports ...................................................................... 69
9.3. Conclusions ................................................................................................................... 72
9.4. Recommendations ......................................................................................................... 73
10. REFERENCES .................................................................................................................................. 75

Synapse Energy Economics, Inc. Review of New Brunswick Power’s 2018/2019 General Rate Application 3
EXECUTIVE SUMMARY
Purpose
The New Brunswick Energy and Utilities Board Staff (EUB Staff) commissioned Synapse Energy
Economics (Synapse) to review the 2018/2019 General Rate Case application recently filed by the New
Brunswick Power Corporation (NB Power or the Company). Our task was to review, critique, and make
recommendations on the issues of revenue requirements, the rate adjustment mechanism (RAM), the
2017 integrated resource plan (IRP), and the Energy Smart program—with an emphasis on the demand-
side resources and advanced metering infrastructure (AMI) elements within that program.
Revenue Requirements
NB Power’s rate request is primarily driven by (a) its revenue requirements, (b) the goal of reducing
debt, and (c) the goal of keeping rates low. Reducing costs should be a top priority for the Company and
the Board, as this will help with both the goals of reducing debt and keeping rates low.
However, given NB Power’s ability to increase rates each year, it faces relatively little financial pressure
to reduce costs. In addition, the absence of private equity shareholders limits the Board’s ability to
disallow cost over-runs or imprudently incurred costs, or to apply financial incentives through
performance-based ratemaking (PBR).
We recommend that the Board use regulatory guidance and pressure to encourage, induce, or
incentivize the Company to reduce costs. The Board can provide regulatory guidance by approving (or
disapproving) specific projects or investments, especially innovative projects such as Smart Habits or
AMI. The Board can also provide guidance by signaling to the Company how to prioritize investments,
how to optimize resources, how to balance short-term versus long-term interests, and how to balance
the goals of reducing debt and maintaining low rates.
The Board can provide regulatory pressure through detailed review and oversight of NB Power’s
proposed budgets and revenue requirement requests. The Board’s oversight should include a Rate Case
Performance Report that includes enhanced performance metrics and public reporting requirements
specifically designed to inform the Board, the NB Power Board of Directors, legislators, customers, and
other key stakeholders about the Company’s efforts to control costs. This should also include increased
Board oversight of the Integrated Resource Plan (IRP) to assist the Company in optimizing its resources
and minimizing its costs. And this should include increased Board oversight of the Energy Smart program
to assist NB Power in successfully planning for and implementing all cost-effective distributed energy
resources (DERs).
Rate Adjustment Mechanism
The Company’s proposed RAM offers the advantage of helping NB Power to meet its debt reduction
goals. Unrecovered costs in any single year result in a reduction in net earnings, an increase in debt, and
a deferral of the date by which the Company meets its 80 percent debt target.

Synapse Energy Economics, Inc. Review of New Brunswick Power’s 2018/2019 General Rate Application 4
On the other hand, the proposed RAM has several disadvantages. It would result in greater rate
increases, making it difficult to meet the statutory goal of maintaining low rates. It would also:
(a) reduce the Company’s incentive to reduce the magnitude of extraordinary costs, (b) reduce the
transparency of rate adjustments and impacts, and (c) generally make the Company less accountable for
costs recovered through the RAM.
We conclude that the disadvantages of the proposed RAM outweigh the advantages, and therefore we
recommend that the Board reject the Company’s proposed RAM at this time. Our conclusion is partly
based on a slight preference for the goal of maintaining low rates over the goal of meeting the
80 percent debt target.
If the Board decides to allow some form of RAM, either in this rate case or in the future, it should do so
only after certain conditions are met. These include: (a) NB Power demonstrates that the proposed RAM
complies with the interim international accounting reporting standard (IFRS); (b) the Board establishes a
Rate Case Performance Report to encourage NB Power to reduce costs; (c) the Company agrees to make
any potential RAM rate increases fully transparent, both in rate cases and 10-Year Plan forecasts; (c) the
Company agrees to consider the RAM rate increases when achieving the statutory goal of maintaining
low rates; and (d) the Board establishes criteria for how to define extraordinary expenses and those that
are outside NB Power’s control.
2017 Integrated Resource Plan
A sound IRP can help the Company to reduce costs by optimizing the mix of supply-side resources,
identifying the potential for distributed energy resources, deferring or avoiding the need for new
infrastructure, reducing energy costs, and minimizing the cost of meeting greenhouse gas (GHG)
constraints.
The NB Power 2017 IRP suffers from several important limitations. It does not include the cost of
meeting GHG constraints in the reference case, even though new GHG constraints are widely expected
to be applied in the near term. The 2017 IRP does not optimize, or even explore, the full potential for
energy efficiency and demand response resources. This becomes particularly problematic with the
introduction of GHG constraints, which would call for a much higher amount of cost-effective energy
efficiency and demand response resources to keep costs down. The 2017 IRP also does not account for
the potential benefits of deferring or avoiding transmission and distribution costs as a result of
distributed energy resources. Taken together, these limitations result in the IRP substantially
understating the potential for energy efficiency and demand response resources to reduce electricity
system costs.
We recommend that the Board direct the Company to submit a revised IRP by the next rate case,
because the 2017 IRP does not provide a realistic forecast of GHG constraints and does not provide an
optimization of supply-side and demand-side resources; thus it does not provide some key information
that should be used in this rate case. The revised IRP should also address the other limitations identified
in this report.

Synapse Energy Economics, Inc. Review of New Brunswick Power’s 2018/2019 General Rate Application 5
In addition, we recommend that the Board establish guidelines regarding the development, filing, and
implementation of future IRPs. Experience in other jurisdictions indicates that clear regulatory guidance
is necessary to ensure effective, successful IRP practices.
Smart Habits
In general, the NB Power energy efficiency programs are well designed and are likely to achieve a
reasonable level of efficiency savings, given that they are still in the early stages of development.
Further, there is clearly considerable potential to continue to expand these programs after the three-
year period, as indicated by the Company’s IRP analysis (despite the IRP’s limitations). There is also a
significant need to continue to expand these efficiency programs over time, in light of the pressure on
the Company to reduce costs, reduce debt, and maintain low electricity rates.
We recommend that the Board approve the energy efficiency programs, budgets, and savings targets
proposed by the Company for the 2018/2019 year. We further recommend that the Board direct NB
Power to file in its next rate case a revised DSM plan that addresses the deficiencies identified in this
report, particularly regarding program designs and evaluation plans that were not included in the
current DSM Plan.
We recommend that the Board reject the demand response programs, budgets, and savings targets for
the 2018/2019 year, because the program designs are not sufficiently developed and the proposed
programs are not expected to be cost-effective even by the Company’s analysis. We further recommend
that the Board direct the Company to include in the revised DSM plan filed in the next rate case new
demand response programs. The description of new demand response programs should (a) provide
sufficient detail on program designs; (b) address the limitations identified in this report (e.g., by
accounting for avoided transmission and distribution costs); and (c) demonstrate that the programs will
be cost-effective.
We recommend that the Board order NB Power to re-direct the budgeted 2018/2019 funds for demand
response programs to the energy efficiency programs, because the energy efficiency programs can
deliver cost-effective savings for the Company and its customers.
We recommend that the Board notify the Company that the Board places a high priority on the Smart
Habits programs, because of their ability to reduce costs, reduce bills, defer new capital investments,
reduce the debt-to-equity ratio, and reduce the costs of GHG constraints. In order to demonstrate that
the Board places a high priority on the Smart Habits programs, we recommend that the Board direct the
Company to achieve all cost-effective energy efficiency and demand response resources.
Another way for the Board to demonstrate that it places a high priority on the Smart Habits program is
to establish guidelines defining how energy efficiency and other distributed energy resources should be
planned for, reviewed, and implemented. We recommend that the Board develop guidelines for
distributed energy resources, in concert with the guidelines for IRP.

Synapse Energy Economics, Inc. Review of New Brunswick Power’s 2018/2019 General Rate Application 6
Smart Grid
NB Power’s AMI proposal exceeds the $50 million threshold for Board approval of a capital project
under subsection 107(1) of the Electricity Act. Consequently, the Board is required to review the
prudence of this proposal under subsection 107(9) of the Electricity Act.
The Company’s own economic analysis does not justify the AMI proposal. NB Power estimates that the
total cost of the project will be $122.7 million, the total benefits will be $121.4 million, resulting in a net
cost to customers of $1.3 million. In addition, NB Power’s economic analysis suffers from some
important limitations. It understates the cost of the AMI proposal, overstates the benefits associated
with the social benchmarking program, understates the potential benefits from conservation voltage
reduction opportunities, and does not account for the potential benefits from time-based pricing.
We recommend that the Board reject the Company’s AMI proposal, because the Company has not
demonstrated that it will be cost-effective. A better benefit-cost analysis, particularly a better estimate
of the potential benefits from time-based rates, might indicate that AMI is cost-effective. However, that
evidence has not been provided in this docket.
We further recommend that the Board direct the Company to refile a new AMI proposal in next year’s
rate case. The new AMI proposal should correct for the limitations described in this report, and it should
incorporate the time-based rate proposal that the Company is planning to file in the next rate case
anyway.
Smart Solutions
In general, the Smart Solutions initiatives appear to be reasonable and consistent with industry
practices, regulatory objectives, and the Company’s long-term goals. By expanding its existing initiatives
(for EVs, smart homes, and demand response) and by introducing new initiatives (for solar, storage, and
other products) NB Power estimates it can decrease revenue requirements by $1.1 billion over 25 years.
Therefore, we recommend that the Board approve these initiatives.
However, the Company’s proposal raises several concerns. First, the program raises concerns about the
Company’s monopoly status within the electricity sector because NB Power would be offering services
potentially provided by competitive, unregulated suppliers. Second, its analysis lacks assessments of the
financial and market risks associated with new technologies and nascent markets. As an example, the
Company has no New Brunswick-specific research on electric vehicle adoption.
Given these concerns, and given the magnitude and important role of these initiatives, we recommend
that the Board monitor the Smart Solutions initiatives closely over time and provide guidance on their
implementation. We recommend that the Board direct the Company to provide more details on each of
its Smart Solutions initiatives in future rate cases. The Company should provide on-going assessments of
the competitiveness of each of the unregulated markets that it participates in. The Company should also
provide more detailed business cases for each of the Smart Solutions initiatives, outlining expected
costs, benefits, and risks.

Synapse Energy Economics, Inc. Review of New Brunswick Power’s 2018/2019 General Rate Application 7
Performance Metrics and Reports
Performance metrics and reports can provide useful information for regulators when setting rates,
particularly metrics regarding costs, efforts to contain costs, and efforts to improve productivity. NB
Power currently uses a variety of key performance indicators (KPIs) and other metrics addressing utility
performance across safety, customer, organizational, reliability, and environmental areas.
However, the Company’s current metrics and reporting practices are not very useful for informing rate
case decisions because they do not include some important performance areas; they are not provided at
the outset of a rate case; they are not readily accessible, reviewable, and understandable; and they do
not provide lessons learned on what caused under-performance or how to improve future performance.
We recommend that the Board direct the Company to build off of its existing performance metrics and
reports to create a Rate Case Performance Report to inform the Board’s decision rate cases. These new
reports should provide comprehensive information at the outset of each rate case, and address
additional performance areas of interest to the Board. The Rate Case Performance Reports should be
made publicly available, and should be designed to primarily serve the needs of the Board, but also the
needs of the NB Power Board of Directors, legislators, the Public Intervenor, customers, and other
industry stakeholders.

Synapse Energy Economics, Inc. Review of New Brunswick Power’s 2018/2019 General Rate Application 8
1. INTRODUCTION
1.1. Purpose
The New Brunswick Energy and Utilities Board Staff (EUB Staff) commissioned Synapse Energy
Economics (Synapse) to review the 2018/2019 General Rate Case application recently filed by the New
Brunswick Power Corporation (NB Power or the Company). Our task was to review, critique, and make
recommendations on the issues of revenue requirements, the rate adjustment mechanism (RAM), the
2017 integrated resource plan (IRP), and the Energy Smart program—with an emphasis on the demand-
side resources and advanced metering infrastructure (AMI) elements within that program.
1.2. Qualifications
The authors’ qualifications are summarized below. Additional information regarding Synapse Energy
Economics and the authors is available at: www.synapse-energy.com.
Synapse Energy Economics
Synapse Energy Economics, Inc. is a research and consulting firm specializing in energy, economic, and
environmental topics. Since its inception in 1996, Synapse has become a leader in providing rigorous
technical analysis of the electric power sector for public interest and governmental clients.
Synapse’s staff of 30 includes experts in energy and environmental economics, resource planning,
electricity dispatch and economic modeling, energy efficiency, renewable energy, transmission and
distribution (T&D), rate design and cost allocation, risk management, cost-benefit analysis,
environmental compliance, climate science, and both regulated and competitive electricity and natural
gas markets. Several of our senior-level staff members have more than 30 years of experience in the
economics, regulation, and deregulation of the electricity and natural gas sectors, and have held
positions as regulators, economists, and utility commission and ISO staff.
Services provided by Synapse include economic and technical analyses, regulatory support, research and
report writing, policy analysis and development, representation in stakeholder committees, facilitation,
trainings, development of analytical tools, and expert witness services. Synapse is committed to the idea
that robust, transparent analyses can help to inform better policy and planning decisions. Many of our
clients seek out our experience and expertise to help them participate effectively in planning,
regulatory, and litigated cases, and other forums for public involvement and decision-making.
Synapse’s clients include public utility commissions in U.S. states and Canada, offices of consumer
advocates, attorneys general, environmental organizations, foundations, governmental associations,
public interest groups, and federal clients such as the U.S. Environmental Protection Agency and the
Department of Justice. Our work for other international clients has included projects for the United
Nations Framework Convention on Climate Change, the Global Environment Facility, and the
International Joint Commission, among others.

Synapse Energy Economics, Inc. Review of New Brunswick Power’s 2018/2019 General Rate Application 9
Tim Woolf
Tim Woolf is the Vice President at Synapse Energy Economics. He has more than 30 years of experience
analyzing technical and economic aspects of energy and environmental issues. Before returning to
Synapse in 2011, he served four years as a commissioner at the Massachusetts Department of Public
Utilities (DPU), where he played a leading role in developing the Commonwealth’s aggressive clean
energy policies.
Mr. Woolf’s primary areas of focus include electricity industry regulation and planning, power sector
transformation, energy efficiency program design and policy analysis, technical and economic analyses
of electricity systems, renewable resource technologies and policies, clean air regulations and policies,
and many aspects of consumer and environmental protection.
In recent years he has focused on all topics related to power sector transformation, including: cost-
benefit analyses of distributed energy resources, assessment of non-wires alternatives, distribution
system planning, performance-based regulation, and new utility business models. He also addresses a
variety of related ratemaking issues such as rate design, dynamic pricing, net metering rates, and
decoupling.
Mr. Woolf has testified as an expert witness in more than 45 state or provincial regulatory proceedings,
and has authored more than 60 reports on electricity industry regulation and restructuring. He
represents clients in collaboratives, task forces, and settlement negotiations, and he has published
articles on electric utility regulation in Energy Policy, Public Utilities Fortnightly, The Electricity Journal,
Local Environment, Utilities Policy, Energy and Environment, and The Review of European Community
and Environmental Law.
Mr. Woolf holds an MBA from Boston University, a Diploma in Economics from the London School of
Economics, and a BS in Mechanical Engineering and a BA in English from Tufts University.
Asa Hopkins
Asa Hopkins, PhD, is a Principal Associate at Synapse Energy Economics. He is an expert in the
development and analysis of public policy and regulation regarding energy and GHG emissions. His work
includes cost-benefit analysis, stakeholder engagement, state energy planning, and utility planning. He
has provided analysis and testimony in both legislative and regulatory contexts, including state utility
regulation and state and federal rulemaking.
Since arriving at Synapse in early 2017, Dr. Hopkins has focused on utility and demand-side issues,
including demand response in Quebec, rate design in Massachusetts, and utility performance metrics in
Puerto Rico. He has also performed multi-state analysis of strategic end-use electrification across the
Northeast region.
As the Director of Energy Policy and Planning at the Vermont Department of Public Service from 2011–
2016, Dr. Hopkins was responsible for the development and analysis of state policy regarding renewable
energy, ratepayer-funded energy efficiency, energy-related economic development, and innovative
utility rates and programs. He was responsible for developing the state’s Comprehensive Energy Plan,
Synapse Energy Economics, Inc. Review of New Brunswick Power’s 2018/2019 General Rate Application 10
reviewing utility integrated resource plans, and directing the actions of the Planning and Energy
Resources Division. He also served on the Board of Directors of the National Association of State Energy
Officials. During his tenure, Vermont rose in the rankings on national clean energy state scorecards.
Prior to 2011, Dr. Hopkins was an AAAS Science and Technology Policy Fellow in the Office of the Under
Secretary for Science at the U.S. Department of Energy. In that role, he managed stakeholder
engagement for and the overall project flow of DOE’s first Quadrennial Technology Review. Dr. Hopkins
came to DOE from Lawrence Berkeley National Laboratory, where he worked on economic and market
analysis of appliance energy efficiency standards.
Dr. Hopkins holds a BS in Physics from Haverford College and a Masters and PhD in Physics from
California Institute of Technology.
Melissa Whited
Principal Associate Melissa Whited specializes in issues related to utility regulation and rate design. She
focuses in particular on the fundamental changes in the electricity industry spurred by declining energy
use and rapidly increasing penetration of distributed energy resources. Ms. Whited consults on the tools
to effectively address these changes, including performance-based regulation, revenue decoupling
mechanisms, distribution system planning, and innovative rate design. Ms. Whited has testified before
the Massachusetts Department of Public Utilities, the Hawaii Public Utilities Commission, the Public
Service Commission of Utah, the Public Utility Commission of Texas, the Virginia State Corporation
Commission, and the Federal Energy Regulatory Commission.
Ms. Whited led the development of a handbook for regulators on utility performance incentive
mechanisms, which describes best practices in mechanism design and how such mechanisms can help
utilities transition to alternative business models. In addition, Ms. Whited has provided consulting
services regarding the incorporation of distributed energy resources in utility planning processes in New
York's "Reforming the Energy Vision” proceeding.
In the rate design arena, Ms. Whited's work focuses on the development of rate designs that effectively
balance the fundamental principles of revenue sufficiency, fair apportionment of costs, and efficiency of
use. She has authored numerous reports and testimony regarding the impacts of fixed charges and
demand charges on low‐income customers, customers with distributed generation, and the ability of
states to achieve their energy policy goals.
Ms. Whited holds two master’s degrees from the University of Wisconsin: an MA in agricultural and
applied economics and an MS in environment and resources.
Kenji Takahashi
Kenji Takahashi is a Senior Associate at Synapse. He conducts economic, environmental, and policy
analysis of electric system technologies, policies, and regulations associated with both supply- and
demand-side resources. He has extensive experience in the analysis of integrated resource plans, load
forecast, renewable energy policies, distributed generation, demand response, and electric and gas
energy efficiency measures and programs.

Synapse Energy Economics, Inc. Review of New Brunswick Power’s 2018/2019 General Rate Application 11
He has assessed the design and impact of utility energy efficiency program plans in utility program filings
and integrated resource planning proceedings for numerous utilities in the United States and several
Canadian provinces. He has also assessed rate and bill impacts, job impacts, and emissions impacts of
clean energy programs and scenarios.
Mr. Takahashi has analyzed the performance, costs, benefits, potential, and policies of renewable
energy and energy efficiency measures and resources. These have included state-of-art measures such
as cold climate heat pumps, deep energy retrofits, net zero energy buildings, and strategic energy
management. Recently, he helped analyze heat pumps and strategic electrification for the Northeast
Energy Efficiency Partnerships. He also presented direct testimony to the Massachusetts Department of
Public Utilities regarding Berkshire Gas’s Long-Range Forecast and Supply Plan, in which he analyzed and
critiqued the Company’s natural gas load forecast and demand-side resource assessment.
Alice Napoleon
Alice Napoleon is a Senior Associate at Synapse. She is an electric system policy analyst focusing on
review of energy efficiency program design, administration, cost recovery, and cost-benefit analysis. In
her 12 years at Synapse, she has co-authored dozens of energy analysis reports. She has completed
major projects for the U.S. Environmental Protection Agency on quantifying the benefits of clean energy
resources and for the U.S. Department of Energy on strategic energy management. In collaboration with
the Industrial Energy Analysis group of Lawrence Berkeley National Laboratory, she is currently
managing the development of a toolkit for energy efficiency program administrators to incorporate the
U.S. Department of Energy’s Superior Energy Performance™ and strategic energy management
programs into their portfolios.
Ms. Napoleon has provided testimony and testimony assistance before public utility commissions across
the United States and Canada, including in California, Delaware, Illinois, Kentucky, Missouri, New Jersey,
Nova Scotia, South Carolina, and Virginia. She provided extensive and ongoing expert analysis and
support for the State of New Jersey regarding its state- and utility-administered residential, low-income,
commercial, and industrial energy efficiency and combined heat and power programs. Ms. Napoleon
conducted extensive research on current low-income electric energy efficiency program efforts in U.S.
states and submitted testimony regarding administration of low-income energy efficiency services and
implementation of advanced metering in Nova Scotia.
In addition to strong analytical skills, Ms. Napoleon has expertise and extensive experience facilitating
collaborative stakeholder processes, including facilitating and providing technical analysis in support of
demand-side resource policy working groups in Colorado, Maryland, and South Carolina. Currently, she
serves as a member of the National Energy Efficiency Registry Advisory Committee. She holds an MA in
Public Administration from the University of Massachusetts at Amherst and a BA in Economics from
Rutgers University.

Synapse Energy Economics, Inc. Review of New Brunswick Power’s 2018/2019 General Rate Application 12
2. REVENUE REQUIREMENTS
2.1. New Brunswick Power’s Proposal
NB Power is proposing to increase electricity rates for the 2018/19 fiscal year by 2.0 percent on average
across all rate classes. This percentage rate increase was determined by the Company by balancing the
two statutory goals of (a) achieving a 20 percent equity target as soon as is reasonable, and (b) keeping
rates as low as possible and making any changes in rates stable and predictable from year to year (NB
4.02, Revised Evidence, page 5).
The request for an even 2.0 percent increase in rates is consistent with the Company’s requested rate
increase in the previous rate case, and it is consistent with the proposed rate increases for the next five
fiscal years in the Company’s 10-Year Plan (NBP 1.11, NB Power’s 10-Year Plan, Figure 1). In all three
instances, NB Power has set the rate increase as high as possible in order to achieve its 20 percent
equity target within a reasonable time period, but has chosen not to exceed a 2.0 percent average rate
increase in order to keep rates low.
In sum, the proposed rate increase is driven by three key factors: (a) the need to recover anticipated
revenue requirements; (b) the need to reduce debt; and (c) an effective cap on rates at an amount that
is perceived by the Company to be low, stable, and predictable. The net earnings achieved each year is
the amount that NB Power uses to reduce its debt. Thus, after the Company has set its other revenue
requirements, it increases the net earnings as much as possible within the effective 2.0 percent rate cap.
Table 1 summarizes the revenue requirements that the Company seeks to recover in 2018/19, along
with a comparison to the revenue requirements that the Board allowed the Company to recover in the
2017/18 general rate case (NBP 11.02, Revised Evidence, Table 3.0.1, page 19). The increases in
operations, maintenance, and administration (OM&A) and depreciation and amortization are
responsible for almost all of the increases in revenue requirements.
Table 1. NB Power’s revenue requirement proposal (in millions $)
2018/19 Proposed
2017/18 Allowed
Variance Percent of Total
Proposed
Fuel and purchased power 597.1 634.8 (37.7) 35%
OM&A 499.1 468.4 30.7 29%
Depreciation and amortization 274.1 250.6 23.8 16%
Taxes 45.1 44.3 0.8 2%
Finance costs and other income 216.0 220.9 (4.9) 13%
Net change in regulatory balance 11.3 11.4 (0.0) 1%
Net earnings 62.3 90.6 (28.2) 4%
Total revenue requirement 1,705.5 1,720.9 (15.5) 100%
The total revenue requirement in 2018/19 is estimated to be less than that for the previous rate case by
$15.5 million. This is partly due to a considerable reduction in fuel and purchased power costs. It is also
driven in part by reduced net earnings of $28.2 million. As described above, however, this reduction in

Synapse Energy Economics, Inc. Review of New Brunswick Power’s 2018/2019 General Rate Application 13
net earnings is applied in order to achieve the effective rate increase cap of 2.0 percent. The actual
impact of reducing the net earnings for 2018/19 is to defer the point in time when the 20 percent debt
target is achieved, assuming all else being equal.1
Table 1 also presents the portion of the total revenue requirement that is made up by each category. As
indicated, fuel and purchased power and OM&A are by far the largest contributors to revenue
requirements.
2.2. Industry and Regulatory Context
There are several important factors regarding the New Brunswick electricity industry that the Board
should consider when reviewing revenue requirement proposals.
Industry Context
First, NB Power’s in-province energy sales are expected to remain flat well into the future. The Company
forecasts that the average annual growth rate from 2017/18 through 2026/27 will be only 0.1 percent
(NBP 1.36, Appendix S, 2018–2027 Load Forecast Update, Table 1, page 3). In general, relatively low
sales growth will make it more difficult for NB Power to recover increasing costs without raising rates.
On the other hand, peak demand growth is expected to be slightly negative, with an average annual
growth rate of −0.7 percent. In general, low peak demand growth can help defer the need for new
capital investments in generation facilities.
Second, NB Power’s out-of-province sales have declined significantly in recent years. Table 2 presents
the actual and estimated out-of-province sales for 2015/16 through 2018/19 (NBP 11.02, Revised
Evidence, Table 4.2.1, page 133). Over these four fiscal years, the total amount of out-of-province sales
reductions has been equal to2,635 GWh, which is roughly 57 percent of the sales in 2015/16. These
reduced off-system sales result in reduced margins, which means that NB Power must look to other
sources for meeting its revenue requirements.
Table 2. NB Power’s out-of-province sales in recent years
Total Sales (GWh) Sales Reduced GWh) Sales Reduced
2015/16 actual 4,597 --- ---
2016/17 actual 3,360 -1,237 -27%
2017/18 estimated 2,988 -372 -11%
2018/19 budgeted 1,962 -1,026 -34%
1 At the time of the previous 10-Year Plan, the Company expected to reach the 20 percent debt target by 2024, whereas the
most recent 10-Year Plan indicates that the Company can reach the target by 2025 (NB Power’s 10-Year Plans 2018–2027 and 2019–2028, Figure 1).

Synapse Energy Economics, Inc. Review of New Brunswick Power’s 2018/2019 General Rate Application 14
Third, several key cost components are increasing over time. Table 3 presents recent trends in the
revenue requirements associated with OM&A and depreciation and amortization (NBP 11.02, Revised
Evidence, Table 3.0.1, page 19). In general, these costs have increased at a rate well above the
2.0 percent rate increases that the Company hopes to apply for over the next several years. If these
trends continue, it will become increasingly challenging for the Company to meet both goals of reducing
debt and maintaining low rates.
Table 3. NB Power’s OM&A and depreciation & amortization in recent years
OM&A (mil$) OMA (growth) Depreciation (mil$) Depreciation (growth)
2015/16 actual 450.2 --- 225.9 ---
2016/17 actual 482.8 7% 233.2 3%
2017/18 estimated 496.5 3% 252.1 8%
2018/19 budgeted 499.1 1% 274.4 9%
Fourth, NB Power has a history of exceeding its budgeted or approved costs. This trend was identified in
the previous rate case by Mr. Knecht in his evidence on behalf of the New Brunswick Public Intervenor
(Robert Knecht, In the Matter of NB Power’s 2017/18 General Rate Application, Matter 336 PI 1.01
pages 15–16). This trend continues in the 2017/18 fiscal year, where the Company’s revenue
requirements are expected to be roughly $15 million higher than was approved by the Board. This was
mostly driven by the increase in OM&A revenue requirements (NBP 11.02, Revised Evidence, Table
3.0.1, page 19). The trend is notable because it suggests that the Company might be having trouble
forecasting and/or controlling costs, and that the Board’s approval of budgets might have little bearing
on that issue.
Fifth, NB Power will be required to pay some form of carbon charges in the near future. On December
12, 2015, Canada inscribed in the Paris Accord its 2030 target of 30 percent reduction in GHG emissions
from 2005 levels. Specific requirements for meeting this target have yet to be established, and NB
Power is working with the Government of New Brunswick and the federal government to develop a
made-in-New Brunswick GHG management strategy. NB Power might be required to shut down the
Belledune coal plant early (by 2030), and it might be subject to carbon charges consistent with the Pan-
Canadian Framework on Clean Growth and Climate Change (Canada, 2016). In its 2017 IRP, the Company
conducted a sensitivity analysis assuming it was subject to a carbon charge of $10 per tonne in 2018,
rising to $50 per tonne in 2022 (NBP 5.01, NB Power, 2017 IRP, Part A, page 36). These types of GHG
requirements will undoubtedly have many implications for future resource planning and the resulting
revenue requirements.
Sixth, the Company does not need to invest in new generation capacity for many years. The forecast of
low peak demand growth and the savings from the Energy Smart program mean that the Company does
not need to construct a major new generation project until 2031 or beyond. This gives NB Power a

Synapse Energy Economics, Inc. Review of New Brunswick Power’s 2018/2019 General Rate Application 15
window of time to build up its equity before needing to make a large capital investment.2 It also gives
NB Power time to investigate and plan for opportunities to optimize its mix of resources before the next
major generation station is required. These opportunities include the implementation of distributed
energy resources and other low-GHG resources.3
Seventh, there are increasing opportunities in New Brunswick and the region for implementation of
growing levels of distributed energy resources. NB Power recognizes and hopes to take advantage of
these new opportunities through its Energy Smart program.4 These resources can play a pivotal role in
reducing future revenue requirements by helping to reduce fuel costs, defer or avoid capital costs, and
reduce GHG emissions.
These factors create several challenges for NB Power, both in the near term and the long term. Low
sales growth in-province and out-of-province, combined with rising costs and increasing pressure to
reduce GHG emissions, will make it increasingly difficult for the Company to balance its goals of reducing
debt and maintaining low rates.
On the other hand, the lack of need for investments in new generation capacity for as many as 10 years
into the future, and the relatively low capital investment forecast between now and the major capital
investments in the Mactaquac project, provide the Company with more time to plan. It can use this
window of opportunity to identify ways to increase operating efficiency, reduce costs, and develop cost-
effective and clean distributed energy resources.
Regulatory Context
As noted above, NB Power’s rate request is driven by (a) its revenue requirements, (b) the goal of
increasing equity, and (c) the goal of keeping rates low. Consequently, reducing revenue requirements
should be a top priority for the Company and the Board, as this will help to both increase equity and
keep rates low.
NB Power is not subject to the same type of regulatory pressures as investor-owned utilities in other
jurisdictions. First, the Board has limited ability to disallow cost over-runs or imprudently incurred costs,
because NB Power is a publicly owned utility and does not have private equity shareholders to absorb
those costs. In its decision in the previous rate case, the Board ordered a reduction in the Company’s
2017/18 revenue requirements of $4.7 million, resulting in total revenue requirements of $1,720.9
million (Board Partial Decision, Matter 336, March 2017). However, NB Power is expecting to overspend
its 2017/18 total allowed revenue requirement by $14.9 million (NBP 11.02, Revised Evidence, Table
2 NB Power will need to make some large investments in the near- to mid-term future on some capital projects, such as the
Mactaquac Capital project (NB 11.02, Revised Evidence, November 2017, page 3; and NB 1.11, Appendix C, NB Power 10-Year Plan, Figure 8, page 18). But these are generally smaller than what is required for a new generation facility.
3 We use the term distributed energy resources to refer to energy efficiency, demand response, distributed generation,
distributed batteries, and EVs.
4 As described in in Chapter 4, NB Power does not take full advantage of the potential for distributed energy resources in its
2017 IRP.

Synapse Energy Economics, Inc. Review of New Brunswick Power’s 2018/2019 General Rate Application 16
3.0.1, page 19). The only financial effect on NB Power of this overspending is to defer the date at which
the 80 percent debt target is reached.
Second, some of the regulatory mechanisms increasingly in use in other jurisdictions to improve utility
productivity and performance are much less effective when applied to publicly owned utilities. For
example, multi-year rate plans (MRPs), which provide financial incentive to increase productivity and
reduce costs between rate cases, do not provide effective financial impact in the absence of private
equity shareholders.5 Performance incentive mechanisms, which provide direct financial rewards for
achieving specific performance targets, also have much less impact on a utility without private
shareholders.6
Third, the Electricity Act allows NB Power to have a rate case every year and to propose budgets for all
of its revenue requirements for each upcoming year. This allows the utility to recover most, if not all, of
its costs in a very timely way, compared with other utilities that use historical test years and have to wait
several years between rate cases to increase rates. This delay between costs incurred and costs
recovered is referred to as regulatory lag, and it is presumed to provide utilities with pressure to reduce
costs (US DOE, 2017, page 3-2).
Fourth, NB Power is requesting to introduce a RAM to help reduce the volatility of revenues collected
and help expedite achievement of its debt/equity goal. We address this issue in detail in Chapter 3. If the
Board were to approve this request, it would further reduce the pressure on the Company to reduce
costs, by facilitating and streamlining the recovery of costs that are not fully accounted for in rate case
budgets.
This regulatory context means that NB Power is subject to relatively little financial pressure to reduce
costs. In addition, the Board has relatively few options for encouraging the Company to reduce costs.
This is particularly troublesome given the industry context described above, where maintaining low
costs will be necessary for meeting the goals of reducing debt and keeping rates low.
2.3. Conclusions and Recommendations
Balancing Statutory Goals
NB Power claims that a 2.0 percent increase in rates complies with the statutory requirement to keep
rates as low as possible and ensure that changes in rates are stable and predictable from year to year.
We agree that a maximum 2.0 percent rate increase in this rate case would be consistent with the
statutory goal of keeping rates low and stable, particularly in light of the other statutory goal of reducing
debt.
5 For a useful reference on performance-based regulation, see LBNL 2016. For a useful reference on MRP experience, see US
DOE 2017.
6 For a useful reference on PIMs, see Synapse 2015.

Synapse Energy Economics, Inc. Review of New Brunswick Power’s 2018/2019 General Rate Application 17
However, NB Power should not plan on increasing rates by 2.0 percent per year indefinitely. In its most
recent 10-Year Plan NB Power projects continued rate increases of 2.0 percent per year through 2023
(NBP 1.11, NB Power’s 10-Year Plan 2019-2028, Figure 1). In its previous 10-Year Plan NB Power
projected continued rate increases of 2.0 percent per year through 2021; two years earlier than the
current Plan (NB Power’s 10-Year Plan 2018-2017, Figure 1). There is a risk that the date by which the
Company will increase rates by less than 2.0 percent will continue to be pushed forward into the future.
We agree with NB Power’s strategy of achieving a debt/equity ratio of 80 percent as soon as is
practically reasonable. In addition to the statutory requirement, reducing the Company’s debt should
reduce financial risks and increase financial flexibility, particularly in the mid- to long-term future as the
Company’s capital investments increase.
However, this debt goal must be balanced with the goal of maintaining low rates. With each rate case,
the Company and the Board are faced with the challenge of seeking the appropriate balance between
these two competing goals. We recommend that the Board direct the Company to give a preference to
the goal of maintaining low rates, if such a preference is necessary to maintain the effective rate cap
described above. Such a preference is appropriate given that the Act does not specify when the
Company must meet the 80 percent debt/equity ratio, and the Company has several years before it
needs to make large capital investments requiring substantial new debt. It is also appropriate because it
sends an important message to the Company regarding the need to maintain low rates. This last point is
addressed in the remainder of this chapter.
The Importance of Reducing Costs
As described above, NB Power faces a pressing need to reduce its costs, or at least reverse the trend of
rising costs. Maintaining low costs will be necessary for achieving the two goals of increased equity and
low rates, in light of limited load growth and forthcoming GHG requirements.
While there are many costs that the Company has little control over, there are also many costs that it
can control or influence. One way for NB Power to reduce costs is through increased productivity,
particularly for OM&A costs. Another way to reduce costs is to defer or avoid new capital costs and new
capital-intensive generation investments.
As important as this goal of reducing costs is, the Board has relatively few options for encouraging the
Company to achieve it. Cost disallowances, MRPs, and PIMs are ineffective for a utility that does not
have private equity shareholders. Nonetheless, the Board should use every regulatory tool at its disposal
to encourage, induce, or incentivize the Company to reduce costs.
Regulatory Guidance and Pressure
In this context, the primary options for the Board to encourage reduced costs can be described as
regulatory guidance and regulatory pressure. The Board can provide regulatory guidance by approving
(or disapproving) specific projects or investments, especially innovative projects such as Smart Habits or
AMI. The Board can provide guidance by signaling to the Company how to prioritize investments, how to

Synapse Energy Economics, Inc. Review of New Brunswick Power’s 2018/2019 General Rate Application 18
optimize resources, how to balance short-term versus long-term interests, and how to balance the goals
of reducing debt and maintaining low rates.
The Board can provide regulatory pressure through detailed review and oversight of NB Power’s
proposed budgets and revenue requirement requests. We recommend several ways for the Board to
expand its oversight of NB Power’s rate case filing.
First, we recommend that the Board direct the Company to file a Rate Case Performance Report in each
rate case, to help inform the Board’s rate case decisions. These new reports should build off the
Company’s current metrics and reporting practices to help the Board understand how well the Company
is performing, and how successful it is in controlling costs. (See Chapter 9 for more detail on
performance metrics and related recommendations.) Performance metrics can be used to compare NB
Power with its own historical performance, as well as with the performance of other, similar utilities.
Performance metrics can be used to inform the Company, the Board, the NB Power Board of Directors,
the Legislature, and other stakeholders whether NB Power is operating efficiently and where it might be
able to improve its productivity. This information can be used to inform Board decisions about future
revenue requirements and the goals of reducing debt and maintaining low rates.
Second, we recommend that each rate case review focus on those types of costs that the utility might
have the most ability to control. We have not had the opportunity to conduct an in-depth assessment of
what those costs might be or how they might be controlled. Nonetheless, we identify several examples
of the types of costs that should be considered for focused metrics, reporting, and regulatory review.
These include:
• Fuel and purchased power expenses: These represent 35 percent of the total revenue requirements requested for 2018/19. Some of the fuel expenses are driven by fuel prices over which the Company has little control. Many of the purchased power costs are due to long-term purchased power agreements, many of which are required by law, and many of which will remain in place for several more years. Nonetheless, there might be several opportunities for NB Power to reduce fuel and purchased power expenses over the medium- to long-term future. For example, improved IRP practices and expanded distributed energy resource implementation could help to optimize the Company’s mix of resources, reduce fuel costs, and reduce the need for or cost of future
purchased power agreements.7 As another example, the joint dispatch initiative with Nova Scotia could be built upon to create a single balancing authority for the Maritime provinces, leading to improved power plant operations and reduced fuel costs.
• OM&A costs: These represent 29 percent of total revenue requirements requested for 2018/19. They have increased consistently in recent years, and the actual OM&A costs frequently exceed the budgeted costs or those approved by the Board. Within this category of costs, Point Lepreau Nuclear Generating Station (PLNGS) costs represent the largest share (36 percent), followed by distribution (17 percent), corporate services (17
7 For example, the Grandview (95 MW) and Bayside (225 MW) natural gas purchased power agreements are due to expire in
2025 and 2027, respectively (NBP 5.01, 2017 IRP Part A, Figure 13, page 24).

Synapse Energy Economics, Inc. Review of New Brunswick Power’s 2018/2019 General Rate Application 19
percent), and generation (14 percent). Among the different OM&A expenses, labor costs are by far the largest portion (64 percent), followed by hired services (25 percent).
• Senior management salaries: These fall within the labor costs and thus represent an important component of OM&A costs. The Board may want to monitor these salaries to link them to the performance of the Company. The Board may also want to allow higher senior management salaries based upon good company performance, and vice versa, as indicated by the new reporting requirements described above. The Board should apply particular attention to the Company’s cost-containment initiatives and budget over-run results.
• Non-essential costs: In each rate case, the Board should review those costs that are not essential for reliability or for providing low-cost electricity services over the long term. For example, this might include costs for research, development, and demonstration activities. This might also include some elements of grid modernization initiatives or AMI projects. While some of these initiatives might provide value and be in the public interest over the long term, it may be more appropriate to defer or eliminate some of them in order to meet the Company’s debt equity goal. Once that goal is met, then the Company can give greater priority to some of these non-essential initiatives. In general, the Board should be skeptical of projects that are non-essential and are not clearly cost-effective.
Third, we recommend that the Board expand its oversight of the Energy Smart program, especially the
Smart Habits program. Cost-effective distributed energy resources implemented through the Energy
Smart program can help to significantly reduce costs over the long term. Experience in other
jurisdictions indicates that considerable regulatory guidance and support is necessary to ensure the
successful implementation of all cost-effective distributed energy resources. We recommend that the
Board establish guidelines to assist the development of future IRPs, because IRPs play an important role
in reducing costs through resource optimization and identifying the full potential for distributed energy
resources. (For more detail on IRP and related recommendations see Chapter 4.) These guidelines
should also address the design and implementation of energy efficiency and demand response
programs. Such programs can help defer or avoid future capital expenses, and they provide a low-cost
option for reducing GHG emissions. (For more detail on Smart Habits and related recommendations see
Chapter 6.)
Synapse Energy Economics, Inc. Review of New Brunswick Power’s 2018/2019 General Rate Application 20
3. RATE ADJUSTMENT MECHANISM
3.1. New Brunswick Power’s Proposal
NB Power is proposing a new RAM to allow it to recover costs associated with extraordinary events,
including costs that are unanticipated, incremental to its budgets, and outside of its control. The
Company’s primary rationale for this mechanism is that it would allow the Company to fully recover all
prudently incurred costs (NBP 11.02, Revised Evidence, page 13). The Company also notes that a RAM
would improve earnings results and make it easier to meet financial projections (NBP (NBEUB) IR-90).
NB Power proposes that it be allowed to submit claims for recovery of costs associated with
extraordinary events in each rate case, for any such costs incurred in the previous fiscal year (NBP 11.02,
Revised Evidence, page 16). NB Power would be required to demonstrate the eligibility of such costs
using four criteria: (a) NB Power would have to notify the Board within six months of the extraordinary
event; (b) costs would be recovered from deferral accounts; (c) NB Power would not have been able to
plan for and budget for the extraordinary costs; and (d) the extraordinary costs would have to be
incremental to those already being recovered in rates (NBP 11.02, Revised Evidence, page 17).
The Company has not fully defined which costs it would expect to recover through the RAM. It cites
storm damage costs as one example (NBP 11.02, Revised Evidence, pages 14-15). The Company notes
that “it is not possible to create definitive and exhaustive lists of all possible events and identify them as
controllable or uncontrollable,” but it is currently trying to address costs that are most clearly beyond its
control (NBP (NBEUB) IR-90). NB Power also notes that it is not currently attempting to recover fuel and
purchased power expenses through the RAM, because it requires additional time to sort through the
issues and obtain input from stakeholders (NBP 11.02, Revised Evidence, page 15).
NB Power filed a report in this rate case summarizing the experience with RAM-like recovery
mechanisms in other Canadian provinces (NBP 8.96, NBP (NBEUB) IR-98(a), Elenchus RAM Report). This
report also provides findings and recommendations for eligibility criteria; for recovery of O&M costs,
capital, and transmission costs; for the time period for recovery of costs; and for definitions related to
the RAM.
3.2. Regulatory Context
NB Power does not currently include costs for unanticipated events, such as storm costs, in its revenue
requirement budgets. Consequently, when it does incur unanticipated costs, the primary effect is to
lower retained earnings for that year. As described in Section 3.3, smaller retained earnings reduce the
Company’s ability to reduce debt and delay the point in time when the Company achieves its 80 percent
debt target.
The Elenchus RAM report provides several examples of other Canadian provinces that have cost
recovery mechanisms similar to the Company’s RAM proposal. In many cases, this includes a Z-factor as
one component of a PBR mechanism (e.g., British Columbia, Alberta, Manitoba, Ontario, and Quebec). In
some cases, this includes an energy cost adjustment mechanism to pass through to customers the

Synapse Energy Economics, Inc. Review of New Brunswick Power’s 2018/2019 General Rate Application 21
fluctuations in energy costs (e.g., Prince Edward Island). In other cases, it includes a contingency for
storm costs built into the cost budgeting process (e.g., Nova Scotia) (NBP 8.96, NBP (NBEUB)IR-98(a),
Elenchus RAM Report).
The Elenchus RAM report finds that the only examples of rate riders with deferral accounts occur in
jurisdictions that have some form of PBR in place (NBP 8.96, NBP (NBEUB)IR-98(a), Elenchus RAM
Report, page 1). This is a critical distinction because it highlights the importance of ensuring that any
rate rider or RAM should be designed to fit with the other ratemaking provisions and the overall
regulatory context. For example, Z-factors are often included in a PBR mechanism because they require
the utility to not file a rate case for a pre-determined period, such as five years. The rate case stay-out
period is designed to provide the utility with an incentive to reduce costs between rate cases. In this
context, a Z-factor might be necessary to ensure that large unanticipated costs do not cause financial
harm to the utility or otherwise undermine the PBR mechanism.
NB Power, in contrast, is not subject to a PBR mechanism. It is required to file a rate case each year,
which is essentially the opposite of a rate case stay-out provision. Therefore, the primary rationale for
many of the RAM-like mechanisms in other provinces does not apply to New Brunswick.
Further, NB Power has different regulatory priorities than other jurisdictions. NB Power priorities
include reducing debt, maintaining low rates, and reducing costs. The Company’s RAM proposal should
be evaluated from this perspective, not the perspective of other utilities subject to PBR.
The absence of a PBR mechanism creates another important difference. PBR mechanisms, particularly
the rate case stay-out provision, are designed to encourage utilities to increase their productivity and
reduce costs. Regulatory lag is the main driver for this incentive. NB Power, in contrast, does not have
this sort of regulatory incentive to increase productivity and reduce costs. This means that the Board
must use alternative approaches to encourage the Company to reduce costs. (See Chapter 4 for more
detail.) The RAM proposal runs the risk of reducing the pressure on the Company to reduce costs, and
therefore is less appropriate than it would be for a utility that is subject to PBR.
3.3. Advantages of the Rate Adjustment Mechanism
In the New Brunswick regulatory context, the primary advantage of establishing a RAM is that it should
help the Company meet its debt reduction goals. Unrecovered costs in any single year result in a
reduction in net earnings, an increase in debt, and a deferral of the date by which the Company meets
its 80 percent debt target. In New Brunswick, where debt reduction is a high priority, this is a fairly
compelling rationale for some form of RAM.
The proposed RAM will also help stabilize the NB Power’s revenues and allow the Company to recover
more of its actual incurred costs. However, this is not a very compelling argument supporting the RAM,
because NB Power is already able to recover a large portion of its actual costs as a result of its annual
rate cases.

Synapse Energy Economics, Inc. Review of New Brunswick Power’s 2018/2019 General Rate Application 22
3.4. Disadvantages of the Rate Adjustment Mechanism
There are several disadvantages of the proposed RAM. First, it reduces the incentive for NB Power to
mitigate costs. With increased likelihood that NB Power will be able to recover all costs associated with
extraordinary events, there is less pressure on the Company to control those costs. It is important to
note that even those costs that are somewhat beyond the control of the Company may not be entirely
beyond its ability to influence. For example, consider storm recovery costs, which are frequently cited as
beyond the utility’s control. While it is true that the storm itself is beyond the utility’s control, there may
be ways that a utility could reduce its costs of responding to the storm. Costs could be reduced through
better vegetation management practices, better emergency planning practices, better communications
systems and practices, better staff training on emergency response, and improved coordination of
workforces with neighboring utilities. The Company’s incentive for taking such steps is reduced with the
proposed RAM.
Second, the proposed RAM will result in rate increases that are higher than what would occur in the
absence of a RAM. These higher rate increases could conflict with the Electricity Act’s requirement to
maintain low rates. If the Board decides that a 2.0 percent annual rate increase is a reasonable cap on
rates, the proposed RAM would make it more difficult to maintain that cap because it could result in
rate increases that exceed 2.0 percent.
Third, the RAM might result in less regulatory oversight and less transparency of NB Power initiatives
and expenditures. Unless the eligibility criteria for the RAM is clear, narrowly defined, and carefully
applied, the Company could pass costs through the RAM that are not necessarily extraordinary or
beyond its control.
Fourth, it may be challenging for the Board to clearly define expenditures that are outside of NB Power’s
control. As indicated in the example above, even storm recovery costs might include some elements
over which the Company has control. NB Power’s unwillingness to fully define the costs that might be
subject to the RAM should be a warning to the Board that the definition of RAM eligibility could be a
challenging and contentious issue.
Fifth, the proposed RAM will result in less stable rates for customers. Reduced stability for customers is
the flip side of increased stability for the Company. This outcome could conflict with the Electricity Act’s
requirement to provide electricity rates that are stable and predictable from year to year.
3.5. Conclusions and Recommendations
We conclude that the disadvantages of the proposed RAM outweigh the advantages. The proposed RAM
could result in less incentive to reduce costs and less regulatory oversight. More automatic cost recovery
could dilute the Company’s interest in reducing the magnitude of extraordinary expenditures. In sum,
the proposed RAM could result in reduced accountability from NB Power.
The proposed RAM raises the need for the Company and the Board to balance the two competing goals
of reducing debt and maintaining low rates. As described in Section 2.3, we recommend that the Board
direct the Company to give a slight preference to the goal of maintaining low rates. This preference

Synapse Energy Economics, Inc. Review of New Brunswick Power’s 2018/2019 General Rate Application 23
supports our conclusion that the disadvantages of the proposed RAM (increased rates) outweigh the
advantages (reduced debt).
Therefore, we recommend that the Board reject the Company’s proposed RAM at this time.
If the need to reduce debt increases over time, then the Board could consider some form of RAM,
primarily for that purpose. Further, if the Board decides to establish a RAM, it should only do so if
certain conditions are met, including:
• NB Power demonstrates that the proposed RAM complies with the interim international accounting reporting standard (IFRS).
• The Board establishes performance metrics and other measures to encourage NB Power to reduce costs. (See Section 2.3 and Chapter 9 for further discussion.)
• The Company agrees to make any potential RAM rate increases fully transparent, both in rate cases and 10-Year Plan forecasts.
• The Company agrees to consider the RAM rate increases when achieving the statutory goal of maintaining low rates. In particular, if the Company seeks to keep rates within an effective 2.0 percent rate cap, that rate cap calculation must include the potential rate increase from the RAM.
• The Board establishes criteria for how to define extraordinary expenses that might qualify for the RAM. This would include criteria for determining whether such expenditures are outside NB Power’s control.
Synapse Energy Economics, Inc. Review of New Brunswick Power’s 2018/2019 General Rate Application 24
4. INTEGRATED RESOURCE PLANNING
4.1. New Brunswick Power’s IRP
NB Power submitted to the Board its IRP on December 2, 2017 as part of its 2018/19 General Rate
Application. The IRP assesses New Brunswick’s future electricity demand requirements and least-cost
energy plans to meet the electricity demand over a 25-year horizon.
This assessment encompasses both supply and demand options. On the supply side, the plan includes
retirement of existing, aging power plants as fixed assumptions and evaluates building new power
plants. On the demand side, the plan includes energy impacts from a cost-effective Energy Smart New
Brunswick (NB) program consisting of energy efficiency, demand response, and smart grid.
NB Power used a system expansion model called PROVIEW to assess “the least-cost supply plan to
reliably meet the forecast future requirement of load and reserve within New Brunswick, with
consideration of the renewable portfolio standard (RPS) requirement of 40 per cent by 2020” (NBP 5.01,
2017 IRP Part A, p. 60).
According to NB Power, the IRP uses the assumptions based on the best information available at the
time of writing (NBP 5.01, NB Power 2017 IRP Part A, p. 3). The IRP also includes sensitivity analysis with
an objective of identifying the least-cost integrated plan that remains robust with changes in critical
assumptions (NBP 5.01, 2017 IRP Part A, p. 9).
One of the main objectives of the IRP is to develop a plan “that responds to the Electricity Act and
operates under the policy objectives to provide low and stable rates, to ensure a reliable power system
and to meet the requirements of the RPS” (NBP 5.01, 2017 IRP Part A, p. 9). Further NB Power states
that the IRP provides a plan for NB Power to move towards sustainable electricity while incorporating
what its customers care about most: affordability, clean energy, and new personal options and services
(NBP 5.01, 2017 IRP Part A, p. 3).
NB Power’s Load Forecast and Existing Supply Options
NB Power projects its peak demand will grow by 0.5 percent per year on average for the next 25 years,
shown as the top orange line in Figure 1 below (NBP 5.01, 2017 IRP Part A, p. 79). With Energy Smart NB
program activities, NB Power expects to reduce the peak load by 621 MW by 2042 (NBP 5.01, 2017 IRP
Part A, p. 79). This reduced load due to the Energy Smart NB program is presented as the lower line in
the figure below.

Synapse Energy Economics, Inc. Review of New Brunswick Power’s 2018/2019 General Rate Application 25
Figure 1. Effects of Energy Smart NB on load forecasts and resource requirements
Source: NBP 5.01, 2017 IRP Part A, Figure 37, p. 80.
As indicated by the downward arrows in Figure 1, NB Power expects to see expirations of two existing
power purchase agreements (PPAs) and retirements of several existing power plants from 2025 through
2040. Table 5, below, shows a detailed summary of these PPAs and power plants in chronological order
by type of resource.
Table 4. Summary of expected retirement of PPAs or power plants
Resource Type
Retirement Year Details of PPA or Power Plants
PPA 2025 Grandview (95 MW)
2027 Bayside (277 MW)
Power plants
2026 Grand Manan diesel CT plant (29 MW)
between 2027 to 2032 One generating unit (112 MW) at Mactaquac hydro station
2031 Millbank/Ste Rose diesel combustion turbine (CT) (496 MW)
2040 Point Lepreau nuclear plant (660 MW)
2041 Belledune coal plant (467 MW) and Coleson Cove oil plant (972 MW)
Figure 1 also shows the timing of expected resource shortage. For example, NB Power expects to see a
shortage of supply resources starting in 2027 if it does not implement the Energy Smart NB program. By
implementing the Energy Smart NB program as planned, NB Power can push back that resource
shortage by four years to 2031.

Synapse Energy Economics, Inc. Review of New Brunswick Power’s 2018/2019 General Rate Application 26
NB Power’s New Supply Options
The deferral of the resource shortage year essentially means that NB Power can avoid or defer the need
to build new power plants. The 2017 IRP describes an “Integrated Plan” that incorporates the Energy
Smart NB program’s impact on the need to build approximately 590 MW of new supply resource options
between 2027 and 2041 (NBP 5.01, 2017 IRP Part A, Figure 38, p. 81).
More specifically, this Integrated Plan avoids building a 412 MW natural gas combined cycle (NGCC)
plant in 2027 and a 175 MW PUR plant in 2040. It also defers building a 99 MW unit at Millbank/Ste
Rose from 2031 to 2041 (see Table 5 below for details).8
Table 5. Impact on supply resource mix of integrating Energy Smart NB
FY Ending Integrated Plan Supply Plan
2018 Energy Smart NB (621 MW)
through 2042
2019
2020 Embedded Generation (13 MW) Embedded Generation (13 MW)
2021 LORESS (80 MW) LORESS (80 MW)
…
2027 NGCC (412 MW)
…
2031 Millbank / Ste Rose CT (3 x 99 MW) Millbank / Ste Rose CT (4 x 99 MW)
2032
2033 Mactaquac Hydro life achievement Mactaquac Hydro life achievement
….
2040 Lepreau nuclear replace-in-kind (660 MW) Lepreau nuclear replace-in-kind (660 MW)
PUR (175 MW)
2041 NGCC (3 x 412 MW)
Millbank / Ste Rose CT (2 x 99 MW)
NGCC (3 x 412 MW)
Millbank / Ste Rose CT (99 MW)
Total PVRR (2017$) $24.6 B $25.7 B
NPV (2017 $) $1.1 B
Source: NBP 5.01, 2017 IRP Part A, Figure 38, page 81.
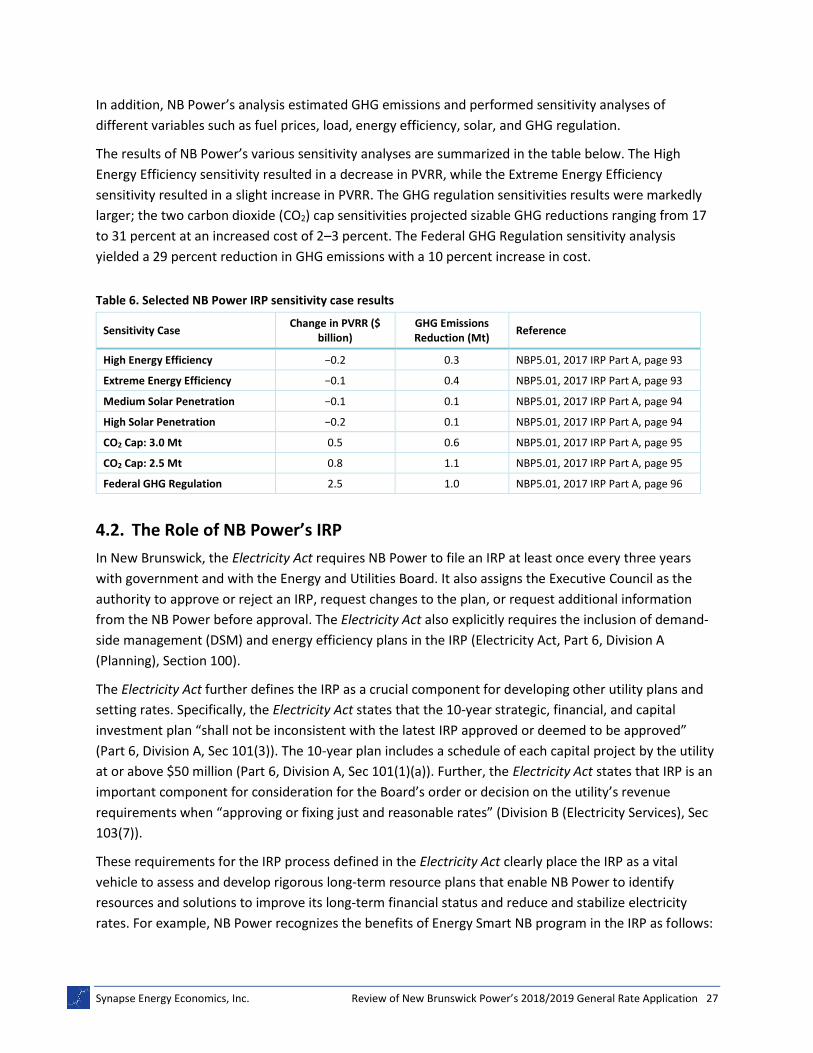
According to NB Power’s analysis, the total present value revenue requirement (PVRR) for the
Integrated Plan is $24.6 billion ($2017), while the total PVRR for a plan that excludes an Energy Smart NB
program (“Supply Plan”) is $25.7 billion (NBP 5.01, 2017 IRP Part A, Figure 38, p. 81). The difference is
$1.1 billion—a substantial benefit expected to result from Energy Smart NB. Part of this benefit also
results from avoided energy production due to Energy Smart NB. This avoided energy production
represents approximately 2,300 GWh of annual cumulative energy savings by 2042 (NBP 5.01, 2017 IRP
Part A, Figure 33, p. 70).
8 Embedded Generation represents renewable energy based distributed generation. LORESS stands for locally owned
renewable energy projects that are small scale.
Synapse Energy Economics, Inc. Review of New Brunswick Power’s 2018/2019 General Rate Application 27
In addition, NB Power’s analysis estimated GHG emissions and performed sensitivity analyses of
different variables such as fuel prices, load, energy efficiency, solar, and GHG regulation.
The results of NB Power’s various sensitivity analyses are summarized in the table below. The High
Energy Efficiency sensitivity resulted in a decrease in PVRR, while the Extreme Energy Efficiency
sensitivity resulted in a slight increase in PVRR. The GHG regulation sensitivities results were markedly
larger; the two carbon dioxide (CO2) cap sensitivities projected sizable GHG reductions ranging from 17
to 31 percent at an increased cost of 2–3 percent. The Federal GHG Regulation sensitivity analysis
yielded a 29 percent reduction in GHG emissions with a 10 percent increase in cost.
Table 6. Selected NB Power IRP sensitivity case results
Sensitivity Case Change in PVRR ($
billion) GHG Emissions Reduction (Mt)
Reference
High Energy Efficiency −0.2 0.3 NBP5.01, 2017 IRP Part A, page 93
Extreme Energy Efficiency −0.1 0.4 NBP5.01, 2017 IRP Part A, page 93
Medium Solar Penetration −0.1 0.1 NBP5.01, 2017 IRP Part A, page 94
High Solar Penetration −0.2 0.1 NBP5.01, 2017 IRP Part A, page 94
CO2 Cap: 3.0 Mt 0.5 0.6 NBP5.01, 2017 IRP Part A, page 95
CO2 Cap: 2.5 Mt 0.8 1.1 NBP5.01, 2017 IRP Part A, page 95
Federal GHG Regulation 2.5 1.0 NBP5.01, 2017 IRP Part A, page 96
4.2. The Role of NB Power’s IRP
In New Brunswick, the Electricity Act requires NB Power to file an IRP at least once every three years
with government and with the Energy and Utilities Board. It also assigns the Executive Council as the
authority to approve or reject an IRP, request changes to the plan, or request additional information
from the NB Power before approval. The Electricity Act also explicitly requires the inclusion of demand-
side management (DSM) and energy efficiency plans in the IRP (Electricity Act, Part 6, Division A
(Planning), Section 100).
The Electricity Act further defines the IRP as a crucial component for developing other utility plans and
setting rates. Specifically, the Electricity Act states that the 10-year strategic, financial, and capital
investment plan “shall not be inconsistent with the latest IRP approved or deemed to be approved”
(Part 6, Division A, Sec 101(3)). The 10-year plan includes a schedule of each capital project by the utility
at or above $50 million (Part 6, Division A, Sec 101(1)(a)). Further, the Electricity Act states that IRP is an
important component for consideration for the Board’s order or decision on the utility’s revenue
requirements when “approving or fixing just and reasonable rates” (Division B (Electricity Services), Sec
103(7)).
These requirements for the IRP process defined in the Electricity Act clearly place the IRP as a vital
vehicle to assess and develop rigorous long-term resource plans that enable NB Power to identify
resources and solutions to improve its long-term financial status and reduce and stabilize electricity
rates. For example, NB Power recognizes the benefits of Energy Smart NB program in the IRP as follows:

Synapse Energy Economics, Inc. Review of New Brunswick Power’s 2018/2019 General Rate Application 28
“[Energy Smart NB] provides a benefit to NB Power through immediate fuel cost savings and through
lower capital requirements in the long term by reducing the need for new supply in the future. This,
then, provides indirect benefit to all customers by ensuring low and stable rates” (NBP 5.01, 2017 IRP
Part A, page 65 to 66).
4.3. Limitations of NB Power’s IRP Analysis
Resource Optimization
The dynamic programming module PROVIEW used in the 2017 IRP has the capability of optimizing
resource selection to find the least-cost plan in terms of total present value cost (NBP 5.01, 2017 IRP
Part A, page 79). However, the results of the IRP’s sensitivity analyses reveal that some resources,
especially energy efficiency and solar PV, are not optimized. Rather, they appear as fixed resources with
amounts that do not differ even if key assumptions are changed. The Company confirmed this in
response to discovery requests (NBP (NBEUB) IR-83 and IR-198).
For example, sensitivity expansion cases that increase costs of supply-side resources such as the “All
Capital + 25%” case and the “Gas and Market prices +25%” case find the same amount of load reduction
from the Energy Smart NB program as the Energy Smart NB program under the Integrated Plan. Further,
the “High Load Forecast” case identified the same amount of renewable energy resources as the rest of
the cases, including the Integrated Plan case (NBP 5.02, 2017 IRP Part B, page 202 to 204). Given that
the RPS target is set at 40 percent of the load by 2020, higher load forecasts should increase the level of
RPS requirements on an absolute basis.
Analysis of GHG Legislation
The most important limitation of NB Power’s IRP analysis is its treatment of the impact of GHG
legislation. While NB Power did analyze the impact of GHG constraints in the IRP, this was only as part of
its sensitivity analyses, and the sensitivities did not consider options for increasing the implementation
of energy efficiency and renewable resources.
The Integrated Plan is used as the “reference case” of the IRP, therefore it should reflect the most likely
electricity industry conditions that are expected at the time the IRP is prepared. In the Integrated Plan
the Company assumes that there will not be any GHG constraints within the study period. This is clearly
not an accurate assumption of the most likely conditions in New Brunswick.
New Brunswick’s Premier joined with other Canadian First Ministers to adopt the Pan-Canadian
Framework on Clean Growth and Climate Change on December 9th, 2016 as mentioned above (Canada,
2016). Carbon pricing is central to this framework, along with other complementary climate actions such
as building codes and standards (Canada, 2017, page 2). The province is now committed to introducing a
carbon pricing mechanism during the current session of the legislature, according to the first annual
report on the implementation of the framework (Canada, 2017, page 37). In December 2017 the
provincial government introduced legislation that would adopt the federal government’s approach to
addressing climate change (Environment and Local Government, 2017). These recent developments

Synapse Energy Economics, Inc. Review of New Brunswick Power’s 2018/2019 General Rate Application 29
clearly indicate that GHG constraints should be modeled in the reference case in the IRP, because GHG
constraints will be a part of the most likely future scenario.9
The Company’s decision to model GHG constraints only as a sensitivity case is especially problematic
because of its methodology for modeling energy efficiency and renewable resources. All of the cases in
the IRP assume the same level of energy efficiency and renewable resources as in the Integrated Plan. In
other words, the energy efficiency and renewable resources are not optimized in the sensitivity cases,
and no additional energy efficiency or renewable resources are used in the sensitivities. Consequently,
the sensitivity cases do not account for those GHG-free resources that are best suited for mitigating the
costs of GHG legislation.
A modeling approach that properly accounts for carbon pricing and optimizes energy efficiency and
renewable resources would certainly choose significantly larger amounts of those options. Carbon
charges will increase the fuel and operating costs of many existing generation facilities, and limit the
ability to repower or build new fossil-fueled generation capacity. It is also possible that the Belledune
plant would need to be retired by 2031, which would require a large amount of low-GHG or GHG-free
resources to replace it.
The Company’s approach to modeling GHG constraints in the 2017 IRP dramatically reduces the study’s
usefulness. The Integrated Plan does not provide an accurate estimate of the Company’s costs because
it does not reflect the likely costs of GHG legislation. In addition, the GHG sensitivities significantly
overstate the Company’s costs because they do not account for the potential for energy efficiency and
renewable resources to reduce those costs. Further, the IRP does not provide an accurate depiction of
the amount of cost-effective energy efficiency and renewable resources available to the Company.
Analysis of Avoided Transmission and Distribution Costs
NB Power made it clear in its response to an interrogatory by the Board that “[o]nly the incremental
primary benefits (fuel and purchased power and capacity deferral) were considered in the energy
efficiency scenarios” and that “[t]he additional benefits associated with avoided T&D costs and other
non-energy benefits were not included in the analysis” (NBP (NBEUB) IR-198). This is a critical omission
in NB Power’s IRP analysis which results in underestimation of the benefits of energy efficiency and
other Energy Smart NB programs. It also results in overestimation of the PVRR calculations for each
scenario.
The magnitude of T&D benefits can be quite large. For example, avoided T&D benefits could have value
of more than $100 per kW-year depending on the type of investments. This value can be translated into
about 3 cents per kWh—very similar to the typical cost of DSM programs, using NB Power’s own
9 The IRP could include sensitivities with less stringent or no carbon regulations, to see how the results would compare with
the expected carbon regulations in the reference case.

Synapse Energy Economics, Inc. Review of New Brunswick Power’s 2018/2019 General Rate Application 30
projection of DSM performance.10 As a reference point, a study by Synapse Energy Economics for the
Public Service Commission of Mississippi reviewed avoided costs for T&D for over 20 utilities across
various states and one Canadian province. The study found the T&D costs range from about $40 per kW-
year (US $2013) as the 25th percentile of reported values to $128 per kW-year (US $2013) at the 75th
percentile (Synapse, 2014, 28–29).
Analysis of Other DSM Benefits
DSM programs provide other benefits that are not accounted for in the Company’s IRP, including:
• Avoided costs of compliance with RPS requirements: New Brunswick’s RPS has a target to achieve 40 percent of in-province electricity sales from renewable energy resources by 2020. DSM and Energy Smart NB programs reduce overall electricity sales, or load. In doing so, they reduce the cost of complying with the RPS by reducing the amount of renewable energy resources needed (NESP, 2017, 53).
• Avoided credit and collection costs: Low-income DSM programs in particular help customers reduce their energy bills and avoid their late or non-payment issues. The utility costs to deal with these issues include costs of notices and support provided to customers in arrears, costs associated with shutting off service and turning it back on, carrying costs associated with arrears, and costs of writing off bad debt (NESP, 2017, 53).
• Risk avoidance benefits: Vermont reduces the cost of energy efficiency programs by 10 percent to account for the net risk benefits of energy efficiency. As another approach, the Northwest Power Conservation Council (NWPCC) explicitly estimates risk avoidance values based on a stochastic analysis in its IRP modeling (Synapse, 2012, 49).
Given that these benefits, plus the avoided T&D benefits, are not accounted for, the Board should
recognize that the 2017 IRP understates the full potential for cost-effective energy efficiency resources.
4.4. Recommendations
We recommend that the Board direct NB Power to properly account for compliance with relevant
federal and provincial GHG legislation in all future IRPs. All IRPs should fully account for the most likely
and most accurate estimate of future costs of complying with GHG constraints, because these
constraints will clearly have significant implications for many elements within the IRP.
We also recommend that the Board direct NB Power to file at the time of the next rate case a revised
2017 IRP that properly accounts for the anticipated federal and provincial GHG constraints. The Federal
GHG regulation sensitivity included in the 2017 IRP does not provide the necessary information to assess
the impacts of GHG constraints, especially because this sensitivity does not account for increased energy
efficiency, demand response, or renewable resources. Nor does it optimize the Company’s portfolio of
10 Assuming a DSM load factor of 38 percent based on NB Power’s data from “LF2016 - DSM.xlsx” (NBP 1.38, Appendix T,
LF2016 - DSM.xlsx)

Synapse Energy Economics, Inc. Review of New Brunswick Power’s 2018/2019 General Rate Application 31
resources in response to the proposed new carbon charges. NB Power should file a revised IRP in the
next rate case because the Company and the Board should not wait three years before assessing the
implications of this critical industry development.
We also recommend that the Board establish IRP guidelines to direct how the Company conducts IRPs
and makes decisions on which resources to implement. Experience in other jurisdictions indicates that
clear and comprehensive regulatory guidance and oversight is necessary for successful IRP practices and
outcomes (RAP 2013).
The IRP guidelines should ideally be developed through a separate proceeding. Alternatively, the
guidelines could be developed as a part of the Company’s next rate case filling. Either way, the process
should allow for meaningful stakeholder input in the drafting, discussion, and approval of IRP guidelines.
We recommend that the IRP guidelines should address at least the following IRP topics:
1. The purpose of integrated resource planning. This should include a discussion of
legislative, regulatory, and company goals that help define the IRP.
2. Definitions. This should include definitions for all of the key terms used in the guidelines,
in order to avoid ambiguity or confusion.
3. Reporting requirements. This should describe all of the information that the Company
should file in order to allow for a comprehensive and timely review of the IRP, by the
Board and by interested stakeholders.
4. Assessment of the existing system. This should require each IRP to include a quantitative
assessment of all the Company’s resources and facilities, including all relevant
information on customers, generation resources, transmission and distribution facilities,
distributed energy resources, purchased power agreements, and more.
5. Forecasts. This should require each IRP to include comprehensive forecasts of all the key
modeling inputs, such as load forecasts; fuel price forecasts; forecasts of naturally
occurring distributed energy resources; forecasts of future environmental constraints;
and more. This should also require each IRP to include alternative forecasts (e.g., low,
middle, and high) with associated probabilities, for the purpose of developing sensitivity
analyses.
6. Assessment of future supply-side resources. This should require each IRP to include a
comprehensive assessment of all future supply-side resources, including new
generation; upgrades or repowering to existing generators; new purchased power
agreements; plant retirements; and transmission and distribution projects or upgrades.
7. Assessment of future distributed energy resources. This should require each IRP to
include a comprehensive assessment of all future distributed energy resources;
including energy efficiency; demand response; distributed generation, storage, electric
vehicles, and more.

Synapse Energy Economics, Inc. Review of New Brunswick Power’s 2018/2019 General Rate Application 32
8. Portfolio development. This should require each IRP to include a suite of portfolios that
assess a wide range of possible futures. It should identify appropriate techniques for
computer modeling; for optimizing supply-side resources; for optimizing distributed
energy resources; for modeling carbon constraints; for developing scenarios; for
accounting for uncertainties; and for developing sensitivity analyses.
9. Criteria for selecting resources and portfolios. This should require each IRP to identify all
the relevant costs and benefits of each resource and each resource portfolio, including
avoided energy; avoided generation capacity; avoided transmission costs; avoided
distribution costs; avoided line losses; avoided costs of environmental compliance; and
more. This should also identify the criteria that the Company should use to determine
the optimal, or preferred, resources and resource portfolio. These criteria should
include the present value of revenue requirements; financial impacts (debt and equity);
rate impacts (short-term and long-term); environmental impacts, and more.
10. Action plan. This should require each IRP to describe all the actions that the Company
will undertake to implement the preferred resource plan and other elements of the IRP.
11. Regulatory process. This should describe the regulatory process necessary for each IRP,
including filing timelines; the Board’s review of each IRP; the criteria for the Board’s
review of each IRP; the potential for the Board to require revised IRPs; and more. It
should also describe the process that will be used to allow for meaningful stakeholder
input in the drafting, discussion, and review of each IRP.
We also recommend that the Board establish energy efficiency and demand response guidelines. These
should be developed within or in concert with the IRP guidelines. Energy efficiency and demand
response guideline are discussed in more detail in Section 6.4.

Synapse Energy Economics, Inc. Review of New Brunswick Power’s 2018/2019 General Rate Application 33
5. ENERGY SMART OVERVIEW
Energy Smart is the umbrella term for NB Power’s investments in grid modernization (Smart Grid), DSM
(Smart Habits), and product/service development (Smart Solutions) (NBP (NBEUB) IR-152).
• Smart Habits is NB Power’s term for its initiatives to help customers save energy and money
through changes in behavior. It includes conservation, energy efficiency, and demand response
programs.
• Smart Grid encompasses initiatives and investments in technologies, processes, and systems to
improve the efficiency, reliability, and flexibility of the power grid. It includes AMI, Distributed
Energy Management System (DEMS), and Digital Communications Network.
• Smart Solutions houses NB Power’s initiatives to increase revenue and offset reductions in sales
as a result of adoption of distributed generation and DSM. It includes solar products, electric
vehicle (EV) charging, smart homes, and other new business ventures (NBP (NBEUB) IR-152).
Table 7 provides a summary of the capital and OM&A costs that the Company is requesting for the fiscal
year 2018/19, including the portion of the total that each comprises. The Smart Grid budget is the
largest part of the total, primarily because it includes the budget for the proposed AMI.
Table 7. Energy Smart Budgets (millions $)
2018/19 Budget Percent of Total
Smart Habits 23.2 26%
Smart Grid 57.4 64%
Smart Solutions 9.3 10%
Total 90.0 100%
As discussed in Section 2, NB Power faces a number of challenges. It needs to reduce debt and maintain
low rates while faced with low sales growth, rising costs, and increasing pressure to reduce GHG
emissions. Energy Smart programs have an important role to play in helping the Company to cope with
several of these challenges.
• By reducing demands on the power grid, Smart Habits programs can postpone the need for new
generation capacity past 2027, and allow retirement of Belledune by 2030. As generally one of
the least expensive resources, energy efficiency in particular can reduce electricity system costs.
• Both Smart Grid and Smart Solutions programs, if well designed, can enable greater penetration
of distributed resources and reduce GHG abatement costs.
• By providing new revenue streams, Smart Solutions programs have the potential to allow NB
Power to improve its debt/equity ratio.
Importantly, the full benefits of programs such as these can only be realized if they are part of the IRP
process. As an example, if an IRP does not incorporate efficiency resources in load planning, a utility may

Synapse Energy Economics, Inc. Review of New Brunswick Power’s 2018/2019 General Rate Application 34
overbuild costly generation capacity and cost ratepayers more than necessary. Energy efficiency and
demand response can avoid or defer the need for new infrastructure, but only with proper planning and
forecasting practices in place.
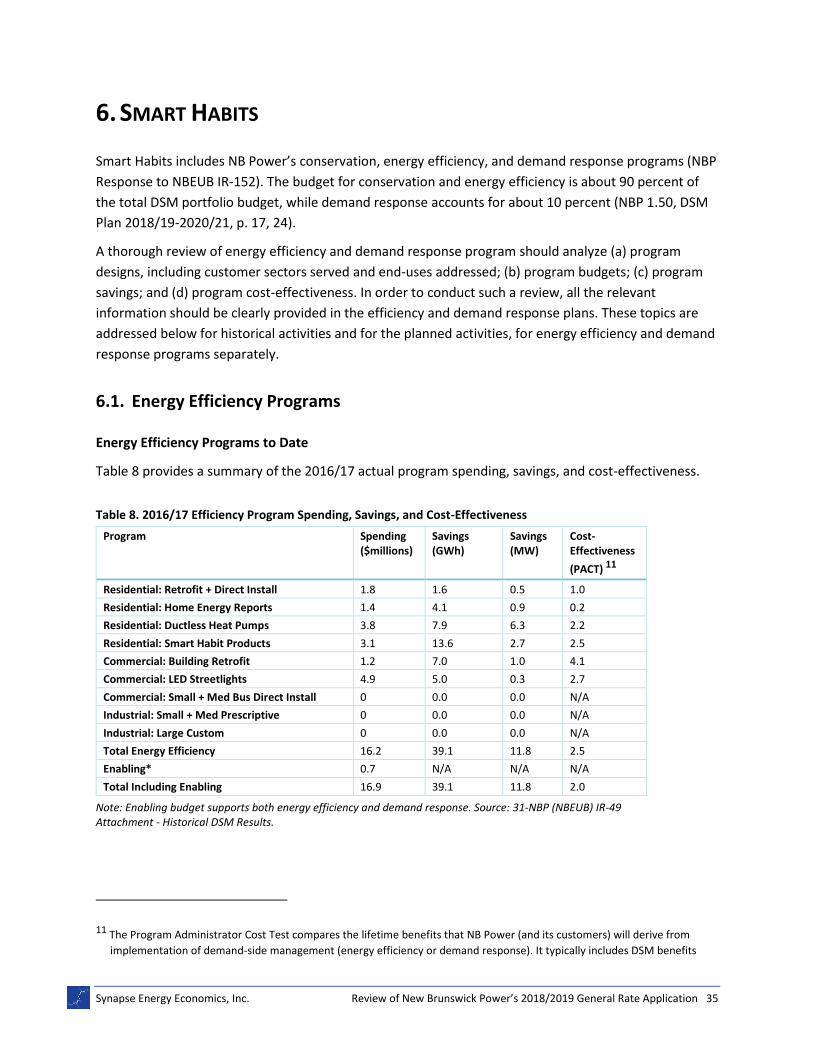
Synapse Energy Economics, Inc. Review of New Brunswick Power’s 2018/2019 General Rate Application 35
6. SMART HABITS
Smart Habits includes NB Power’s conservation, energy efficiency, and demand response programs (NBP
Response to NBEUB IR-152). The budget for conservation and energy efficiency is about 90 percent of
the total DSM portfolio budget, while demand response accounts for about 10 percent (NBP 1.50, DSM
Plan 2018/19-2020/21, p. 17, 24).
A thorough review of energy efficiency and demand response program should analyze (a) program
designs, including customer sectors served and end-uses addressed; (b) program budgets; (c) program
savings; and (d) program cost-effectiveness. In order to conduct such a review, all the relevant
information should be clearly provided in the efficiency and demand response plans. These topics are
addressed below for historical activities and for the planned activities, for energy efficiency and demand
response programs separately.
6.1. Energy Efficiency Programs
Energy Efficiency Programs to Date
Table 8 provides a summary of the 2016/17 actual program spending, savings, and cost-effectiveness.
Table 8. 2016/17 Efficiency Program Spending, Savings, and Cost-Effectiveness
Program Spending ($millions)
Savings (GWh)
Savings (MW)
Cost-Effectiveness
(PACT) 11
Residential: Retrofit + Direct Install 1.8 1.6 0.5 1.0
Residential: Home Energy Reports 1.4 4.1 0.9 0.2
Residential: Ductless Heat Pumps 3.8 7.9 6.3 2.2
Residential: Smart Habit Products 3.1 13.6 2.7 2.5
Commercial: Building Retrofit 1.2 7.0 1.0 4.1
Commercial: LED Streetlights 4.9 5.0 0.3 2.7
Commercial: Small + Med Bus Direct Install 0 0.0 0.0 N/A
Industrial: Small + Med Prescriptive 0 0.0 0.0 N/A
Industrial: Large Custom 0 0.0 0.0 N/A
Total Energy Efficiency 16.2 39.1 11.8 2.5
Enabling* 0.7 N/A N/A N/A
Total Including Enabling 16.9 39.1 11.8 2.0
Note: Enabling budget supports both energy efficiency and demand response. Source: 31-NBP (NBEUB) IR-49 Attachment - Historical DSM Results.
11 The Program Administrator Cost Test compares the lifetime benefits that NB Power (and its customers) will derive from
implementation of demand-side management (energy efficiency or demand response). It typically includes DSM benefits

Synapse Energy Economics, Inc. Review of New Brunswick Power’s 2018/2019 General Rate Application 36
NB Power’s historical energy efficiency portfolio included the Commercial Building Retrofit, LED
Streetlights, Ductless Heat Pumps, Home Energy Reports, Residential Retrofit and Direct Install, and
Energy Efficient Product Rebates programs. Although the portfolio covered a range of end-uses and
sectors in general, a high portion of savings—over 50 percent of annual MWh savings—is associated
with lighting measures in the existing portfolio (NBP Response to NBEUB IR-53).
Table 9 shows planned versus actual spending and savings for the program year 2016/17. Overall
spending was 18 percent lower than budget that year. Variances between planned and actual spending
have been even more drastic for individual programs, notably residential Ductless Heat Pumps, as well
as all commercial and industrial programs.
Table 9. Planned Versus Actual Spending and Savings, Energy Efficiency, FY 2016/17
Program Spending Planned
($millions)
Spending Actual
($millions)
GWh Savings Planned
GWh Savings Actual
MW savings
Planned
MW savings Actual
Residential: Retrofit + Direct Install
3.8 1.8 6.8 1.6 3.0 0.5
Residential: Home Energy Reports
1.7 1.4 16.1 4.1 3.7 0.9
Residential: Ductless Heat Pumps
1.8 3.8 4.1 7.9 0.4 6.3
Residential: Smart Habit Products
1.9 3.1 8.0 13.6 2.4 2.7
Commercial: Building Retrofit 0.8 1.2 3.2 7.0 0.4 1.0
Commercial: LED Streetlights 7.6 4.9 6.2 5.0 1.4 0.3
Commercial: Small + Med Bus Direct Install
0.9 0 1.6 0 0.2 0
Industrial: Small + Med Prescriptive
0.2 0 0.4 0 0.1 0
Industrial: Large Custom 1.1 0 9.6 0 1.2 0
Total Energy Efficiency 19.9 16.2 55.9 39.1 12.8 11.8
Enabling* 1.9 0.7 N/A N/A N/A N/A
Total Including Enabling 21.8 16.9 55.9 39.1 12.8 11.8
Note: Enabling budget supports both energy efficiency and demand response. Source: NBP 1.56, Appendix AG i. DSM Plan 2016-17 Actuals, p. 4.
In 2015/16 and 2016/17, NB Power achieved annual incremental savings of approximately 24 GWh and
39 GWh respectively (31-NBP (NBEUB) IR-49 Attachment—Historical DSM Results). These savings levels
represent approximately 0.2 percent and 0.3 percent of sales in the province.12 NB Power fell short of
achieving its energy savings targets in the 2015/16 to 2016/17 period, realizing only 75 percent of its
associated with avoided energy, avoided capacity, avoided transmission and distribution capital and operating costs, and others. The cost effectiveness screening is discussed further in Section 6.6, below.
12 Sales data are from NBP (NBEUB) IR-51 a) 1. Referenced Table Appendix AA: Table 6 and NBP (NBEUB) IR-39 a) ii. Referenced
Section Appendix AA i.

Synapse Energy Economics, Inc. Review of New Brunswick Power’s 2018/2019 General Rate Application 37
overall planned GWh savings (NBP 1.50, DSM Plan 2018/19-2020/21, p. 13). NB Power attributes this
shortfall to the delay in implementing the new commercial and industrial programs, primarily due to the
reallocation of budget to accommodate high demand for the Ductless Heat Pump program (NBP
Response to NBEUB IR-47). Table 9 shows that savings (GWh and MW) varied markedly from plan to
actual for almost all programs. Changes in plan versus actual savings are directionally consistent with
changes in budget to spending, but they are generally not proportional. That is, projected dollars per
unit of savings (GWh) varied dramatically from the actual cost of the savings, in particular for the
Residential Retrofit + Direct Install, Home Energy Reports, and Commercial Building Retrofit programs.
Despite falling short on savings, in 2015/16 and 2016/17 the energy efficiency portfolio has been cost-
effective, with a program administrator cost test (PACT) ratio of 2.1. On the program level, only the
Home Energy Reports and Residential Retrofit + Direct Install programs were not cost-effective over this
period, meaning they had a benefit/cost ratio of less than 1.0 (NBP 1.50, DSM Plan 2018/19-2020/21, p.
13). According to NB Power, the low PACT ratio for Home Energy Reports (0.2) is due to program costs
being incurred in a different time period from realization of benefits (NBP Response to NBEUB IR-50).
With a PACT of 0.9, the Residential Retrofit program was slightly less than cost-effective. However, NB
Power does not include some widely accepted avoided costs in its benefit-cost analysis, including
avoided T&D. A Societal Cost Test would include additional benefits, including avoided carbon
mitigation, other fuel, and water costs. If NB Power included more program benefits in its analyses, this
program would likely have achieved a ratio above 1.0.
Proposed Energy Efficiency Programs
Table 10. Projected Efficiency Program Spending, Savings, and Cost-Effectiveness, 2018/19 to 2020/21
Program Spending ($millions)
Cumulative Savings (GWh)
Savings (MW) Cost-Effectiveness (PACT)
Residential: Retrofit + Direct Install 12.5 36 5.2 2.0
Residential: Home Energy Reports 6.9 38 5.2 0.9
Residential: Low Income Energy Savings
11.0 13 2.1 0.9
Residential: Smart Habit Products 4.5 64 6.3 1.7
Residential: New Homes 3.8 20 3.3 3.8
Commercial: Building Retrofit 7.4 57 4.7 3.0
Commercial: New Construction 0.4 1 0.1 4.1
Commercial: Small Bus Lighting 6.9 52 3.9 2.0
Industrial: Small + Med Prescriptive/Custom
5.5 16 1.9 3.4
Industrial: Large Custom/EMIS 11.7 156 9.4 3.2
Enabling* 5.7 N/A N/A N/A
Total 74.7 457 42.1 2.2
Note: Enabling budget supports both energy efficiency and demand response. Source: NBP (NBEUB) IR-41; DSM Plan p. 8.
NB Power’s portfolio of planned programs addresses a range of market segments, including programs
focusing on energy efficient products, new construction, and existing buildings. The programs also cover

Synapse Energy Economics, Inc. Review of New Brunswick Power’s 2018/2019 General Rate Application 38
a wide range of potential participants in the residential, commercial, and industrial sectors. A
comparison of program coverage in other jurisdictions with NB Power’s proposed DSM portfolio, as
presented in Table 11 below, shows that NB Power’s triennial plan has good program coverage.
Table 11. Summary of energy efficiency program types implemented in the northeastern States and the Atlantic Canadian provinces
US States Canadian Provinces
Program Type MA ME CT VT NH RI NS NB NF
Residential
New Homes X X X X X X X
Existing Home: Single Family X X X X X X X X X
Existing: Multifamily X X X X X X X
Lighting X X X X X X X X X
Product Replacement X X X X X X X X X
Product Recycling X X X X X
Behavior X X X X X X
Low Income
New Homes X X
Existing Home: Single Family X X X X X X X X
Existing: Multifamily X X X X
Commercial and Industrial
New Buildings X X X X X X X
Small Buildings X X X X X X X X X
Large Buildings X X X X X X X X X
Large Customer Self-Direct X X
Strategic Energy Management X X X X X X
Retrocommissioning X X X X
Industrial Processes X X X X X X X X
Products X X X X X X X
Cross Sector
Building Code and Appliance Standard Support
X X X X X
Note: This table was developed mainly based on a Synapse Energy Economics’ 2016 report entitled Starting Energy Efficiency Off on the Right Foot: Regulatory Policies to Support Successful Program Planning and Design (EE IRAC) and updated with NB Power’s current energy efficiency program filing.
The portfolio addresses hard-to-reach customers, including low-income, small commercial, and small
industrial customers. While there is no single program that focus exclusively on multi-family buildings,
such buildings are addressed through the Commercial Buildings Retrofit program. Also, NB Power states
that it is considering developing a different offering for residents of multi-family buildings (NBP
Response to NBEUB IR- 37).
NB Power’s portfolio of planned programs addresses a wide range of end uses. NB Power claims it does
not know what portion of savings from the proposed portfolio will be associated with lighting measures,
although historically this has been high (NBP Response to NBEUB IR-53). As proposed, most of the
existing programs (excluding ductless heat pumps and LED Streetlights) would continue going forward

Synapse Energy Economics, Inc. Review of New Brunswick Power’s 2018/2019 General Rate Application 39
(NBP 1.50, DSM Plan 2018/19-2020/21, p. 8 and 13). This suggests that the share of savings from lighting
may still be substantial in the proposed portfolio.
NB Power should consider whether alternative program designs would increase the reach of the
programs or allow for greater cost efficiencies. Program modifications may be appropriate for the Low
Income program. It has suffered from long waiting lists and administrative inefficiencies related to
verifying continued customer-interest in the program. NB Power could explore providing a kit of low-
cost measures for most applicants and reserving higher cost measures for applicants meeting specific
criteria, such as those who exhibit very high energy use or receive bill payment assistance. As another
example, for the Energy Efficient Products program, NB Power should investigate whether using
upstream incentives rather than point-of-sale rebates would reduce costs, after taking into account
higher free ridership rates.
The budget for energy efficiency programs in 2018/19 is $20.2 million (excluding enabling program
costs). This is forecast to increase each year, up to $26.9 million in 2020/21 (NBP (NBEUB) IR-218 (a),
NBP (NBEUB) IR-40).
For 2018/2019 through 2020/2021, NB Power is planning to expand its portfolio in terms of total annual
savings and the scope of the programs. As shown in Figure 2 NB Power expects to increase energy
efficiency savings to 120 GWh by 2020/2021. This level is approximately three times larger than the
savings in 2016/2017 and represents 0.9 percent of projected sales in 2020/2021. Excluding the demand
response programs, NB Power projects that of the annual DSM savings in 2020/2021, 42 percent will
come from the residential sector, 23 percent will come from the commercial sector, and 35 percent will
come from the industrial sector.
Figure 2. Historical and projected annual energy savings from NB Power’s energy efficiency
Source: NBP 1.50 Appendix AA i. Three Year Demand Side Management (DSM) Plan 2019-2021; NBP 1.53 _Appendix AD - DSM 2019-2021 Model.xlsx; NBP (NBEUB) IR-51; NBP (NBEUB) IR-39.

Synapse Energy Economics, Inc. Review of New Brunswick Power’s 2018/2019 General Rate Application 40
NB Power assumes savings in the near term for programs that are still being designed, including
Residential Home Retrofit + Direct Install, Residential New Construction, and Commercial New
Construction (NBP Response to NBEUB IR-36). These three programs represent 7 percent of total
energy efficiency portfolio energy savings in 2018/19 (NBP Response to NBEUB IR-41). Attributing this
much savings to programs that are currently undeveloped may be unrealistic, depending on how and
when NB Power rolls these programs out. Also, program designs should be more fully developed before
requesting that costs be included in rates.
The proposed energy efficiency portfolio has a PACT ratio of 2.2, indicating that every dollar invested in
DSM generates $2.2 in benefits. The individual programs are also largely cost-effective, with the
exception of the Home Energy Report and Low Income programs. With PACT ratios of 0.9, the Home
Energy Report and Low Income programs would likely show ratios above 1.0 if NB Power included more
program benefits in its cost-effectiveness analyses.
Conclusions
In conclusion, the proposed energy efficiency programs are well-designed, cover a reasonable range of
end-uses and customers, achieve a reasonable amount of savings, and are generally cost-effective.
These programs would all be more cost-effective if the Company accounted for all the relevant benefits,
particularly the benefit of reducing carbon emissions.
We are concerned, however, about the recent deviations between the planned and the actual program
budgets and savings. As the efficiency programs expand over time, it will be important for NB Power to
improve is program forecasting and implementation practices to reduce these deviations.
6.2. Demand Response Programs
Demand Response Programs to Date
In 2015/16 and 2016/17, NB Power implemented technical pilots in residential and commercial demand
response. These pilots included smart thermostats and water heaters on the residential side, and a
direct load control pilot on the commercial side (Appendix AA.i. p. 23 and 30).
NB Power did not achieve its historical MW demand savings targets for its demand response programs,
because of the delay in implementing the new demand response programs (NBP Response to NBEUB IR-
47). Demand response achievements are summarized in Table 12.

Synapse Energy Economics, Inc. Review of New Brunswick Power’s 2018/2019 General Rate Application 41
Table 12. Historical Demand Response Program Spending, Savings, and Cost-Effectiveness, Demand Response, 2016/17
Program Spending ($millions)
Savings (GWh)
Savings (MW)
Cost-Effectiveness
(PACT)
Residential: Smart Thermostat 0 0 0 N/A
Residential: Demand Response Alert 0 0 0 N/A
Residential: Time Based Pricing 0 0 0 N/A
Residential: Domestic Hot Water 0 0 0 N/A
Commercial: Large Commercial Fast DR 0 0 0 N/A
Total Demand Response 0 0 0 0
Enabling* 0.7 N/A N/A N/A
Total Including Enabling 0.7 0 0 0
Note: Enabling budget supports both energy efficiency and demand response. Source: NBP 1.56 Appendix AG i. DSM Plan 2016-17 Actuals, p. 4.
Table 13, below, shows planned versus actual spending and savings for the program year 2016/17.
Table 13. Planned Versus Actual Spending and Savings, Demand Response, FY 2016/17
Program Spending Planned
($millions)
Spending Actual
($millions)
GWh Savings Planned
GWh Savings Actual
MW savings
Planned
MW savings Actual
Residential: Smart Thermostat 0.9 0 0.8 0 2 0
Residential: Demand Response Alert 0.1 0 0 0 0.2 0
Residential: Time Based Pricing 0.1 0 0 0 0 0
Residential: Domestic Hot Water 0.8 0 0 0 1.5 0
Commercial: Large Commercial Fast DR 0.3 0 0.7 0 2.3 0
Total Demand Response 2.2 0 1.5 0 6 0
Enabling* 1.9 0.7 N/A N/A N/A N/A
Total Including Enabling 4.1 0.7 1.5 0 6 0
Information and analysis about the benefits of the historical programs is lacking. In response to IRs, NB
Power provided confidential reports on three historical demand response technical pilots: Smart
Thermostats, Smart Water Heating, and Commercial and Industrial (NBP Response to NBEUB IR-185).
These reports do not quantify the benefits of the historical pilot programs. Going forward, NB Power has
partnered with National Research Council to study the benefits of load strategies in terms of economic
optimization, ancillary services, and carbon emissions impacts (NBP Response to NBEUB IR-60). Also, NB
Power released a Request for Expression of Interest to identify commercial and industrial direct load
control solutions (NBP Response to NBEUB IR-60).
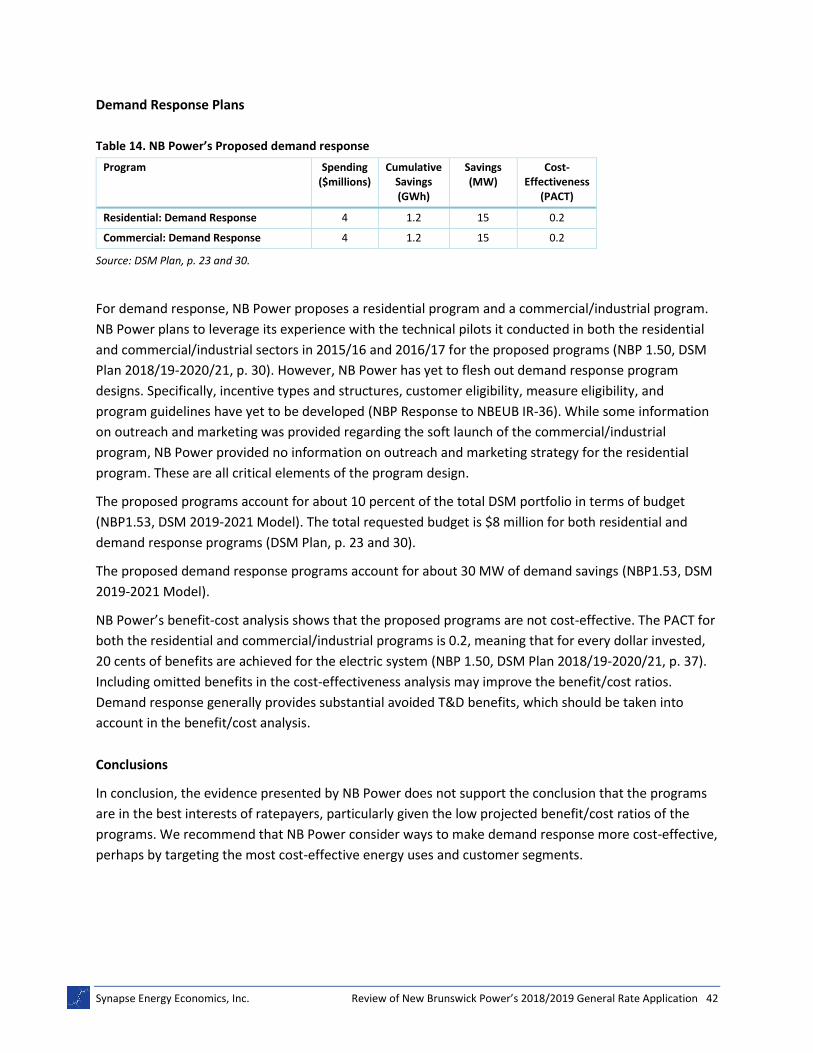
Synapse Energy Economics, Inc. Review of New Brunswick Power’s 2018/2019 General Rate Application 42
Demand Response Plans
Table 14. NB Power’s Proposed demand response
Program Spending ($millions)
Cumulative Savings (GWh)
Savings (MW)
Cost-Effectiveness
(PACT)
Residential: Demand Response 4 1.2 15 0.2
Commercial: Demand Response 4 1.2 15 0.2
Source: DSM Plan, p. 23 and 30.
For demand response, NB Power proposes a residential program and a commercial/industrial program.
NB Power plans to leverage its experience with the technical pilots it conducted in both the residential
and commercial/industrial sectors in 2015/16 and 2016/17 for the proposed programs (NBP 1.50, DSM
Plan 2018/19-2020/21, p. 30). However, NB Power has yet to flesh out demand response program
designs. Specifically, incentive types and structures, customer eligibility, measure eligibility, and
program guidelines have yet to be developed (NBP Response to NBEUB IR-36). While some information
on outreach and marketing was provided regarding the soft launch of the commercial/industrial
program, NB Power provided no information on outreach and marketing strategy for the residential
program. These are all critical elements of the program design.
The proposed programs account for about 10 percent of the total DSM portfolio in terms of budget
(NBP1.53, DSM 2019-2021 Model). The total requested budget is $8 million for both residential and
demand response programs (DSM Plan, p. 23 and 30).
The proposed demand response programs account for about 30 MW of demand savings (NBP1.53, DSM
2019-2021 Model).
NB Power’s benefit-cost analysis shows that the proposed programs are not cost-effective. The PACT for
both the residential and commercial/industrial programs is 0.2, meaning that for every dollar invested,
20 cents of benefits are achieved for the electric system (NBP 1.50, DSM Plan 2018/19-2020/21, p. 37).
Including omitted benefits in the cost-effectiveness analysis may improve the benefit/cost ratios.
Demand response generally provides substantial avoided T&D benefits, which should be taken into
account in the benefit/cost analysis.
Conclusions
In conclusion, the evidence presented by NB Power does not support the conclusion that the programs
are in the best interests of ratepayers, particularly given the low projected benefit/cost ratios of the
programs. We recommend that NB Power consider ways to make demand response more cost-effective,
perhaps by targeting the most cost-effective energy uses and customer segments.

Synapse Energy Economics, Inc. Review of New Brunswick Power’s 2018/2019 General Rate Application 43
6.3. Evaluation, Measurement, and Verification
Evaluation Plan
NB Power proposes to update evaluation plans every three years (NBP 1.51, DSM EMV Plan 2019-2021,
p. 2). Program developments that call for modification to the original EM&V plan would be handled
during the program’s planning phase, as needed (NBP Response to NBEUB IR-70).
The EM&V plan contains a reasonable amount of information on planned evaluation studies. For
example, the plan provides information on study objectives, data collection methods, and the type of
studies schedule to be conducted.
However, the plan misses some key information such as descriptions of evaluation study methodologies
(except for a few programs), study-specific budgets, and information about evaluators (if known) or
evaluator selection method.13 In addition, the plan did not include any evaluation plans for several
programs, including the residential and commercial new construction and demand response programs
(NBP 1.51, DSM EMV Plan 2019-2021, p. 35-36; NBP (NBEUB) IR-71 and 80). According to NB Power, this
is because program designs for these programs have not been developed yet (NBP (NBEUB) IR-71 and
IR-80). NB Power should develop high-level evaluation plans for these programs as soon as its program
designs are developed.
In response to our information request, NB Power provided some additional information on study
methodologies (e.g., NBP (NBEUB) IR-68 through IR-80). For example, NB Power stated that study
methodologies will be similar to the past studies for a few existing programs (e.g., Low Income, Energy
Efficient Product Rebates, Commercial Building Retrofit Program) and provided the past studies as
attachments. NB Power also provided a chart that summarizes all of the evaluation schedules over the
next three years (NBP (NBEUB) IR-71 c).
NB Power proposed to allocate a budget of $1.5 million over a course of three years from 2018/2019 to
2020/2021, along with an additional $140,000 budget for EM&V activities not yet determined at this
point (NBP 1.51, DSM EMV Plan 2019-2021, p. 1). This budget level represents about 2 percent of the
total three-year DSM budget. NB Power acknowledges that this level is lower than best practices and
that individual plans usually fall within the 3–5 percent range with an average of 3.5 percent in Canada
and the United States as shown in Figure 3 (NBP 1.51, DSM EMV Plan 2019-2021, p. 11). Despite this
concern, NB Power maintains this budget level seemingly because “all of the programs in market by the
second year of this plan will have been evaluated at least once by the end of the plan” according to NB
Power (NBP 1.51, DSM EMV Plan 2019-2021, p. 11).
13 A best practice report on program impact evaluation by the State and Local Energy Efficiency Action Network (SEE Action)
titled “Energy Efficiency Program Impact Evaluation Guide” provide a list of key evaluation activities that need to be included in a portfolio cycle evaluation plan. The report is available at https://www4.eere.energy.gov/seeaction/system/files/documents/emv_ee_program_impact_guide_0.pdf

Synapse Energy Economics, Inc. Review of New Brunswick Power’s 2018/2019 General Rate Application 44
Figure 3. Share of Evaluation Budget over the Total Program Budget
Source: NBP 1.51, DSM EMV Plan 2019-2021, Figure 2, p. 11.
We concur with NB Power’s concern. The State and Local Energy Efficiency Action Network (SEE Action)
states in its 2012 report that “[w]hile it is difficult to generalize, common practice suggests that a
reasonable spending range for evaluation (impact, process, and market) is 3% to 6% of a portfolio
budget” (SEE Action. 2012, p. 7-14). When the size of the entire portfolio is large relative to other
jurisdictions, an ideal evaluation budget can be set at the lower side of this range. Having mature and
stable programs with sufficient evaluation history also helps keep the evaluation budget low.
Collaborating with other jurisdictions on joint studies is another approach. However, given the relatively
small size of NB Power’s DSM program, a 2 percent evaluation budget may not be sufficient to conduct a
sufficient number of robust evaluation studies or to cover other necessary studies. For example, the
evaluation budget does not include any budget for studies on energy efficiency potential, net-to-gross
ratio, and measure costs.
We also found the allocated budget per study may not sufficient.14 NB Power allocated a budget of
about $0.9 million to conduct about 20 studies15 excluding budget for pilot program evaluation, rapid
fire/intercept surveys, and plan administration. This results in about $50,000 per study on average.
Other jurisdictions tend to spend more dollars per study. For example, Massachusetts—a leading state
on energy efficiency—conducts robust evaluation studies, and typically spends more than $100,000 per
study for impact and process evaluations (Massachusetts Program Administrators and EEAC Consultants.
2017).
NB Power indicated that it is not currently considering doing joint evaluation studies with neighboring
jurisdictions because of differences in power rates, temperature regions, and heating system fuel types
(NBP Response to NBEUB IR-71). In the future, NB Power should consider whether it makes sense to
conduct joint evaluation studies in order to minimize the program evaluation budget.
Currently, there is no formal oversight of NB Power’s evaluation plans and studies, except during a rate
case. To ensure that study results are unbiased and robust, it is important to implement a transparent
14 NB Power did not develop study-specific budget, but provided an evaluation budget for each program.
15 Impact, process, and market studies are counted separately.
Synapse Energy Economics, Inc. Review of New Brunswick Power’s 2018/2019 General Rate Application 45
and independent oversight process where an independent third party oversees selection of vendors,
development of evaluation plans, and implementation of evaluation studies. For example,
Massachusetts has a statewide energy efficiency collaborative called the Energy Efficiency Advisory
Council (EEAC) composed of members that represent various sectors with expertise in energy efficiency.
The EEAC consultants in Massachusetts work collaboratively with the program administrators to hire
contractors, plan and implement the evaluations, and determine how results are applied to energy
savings, incentive payments, and future program assumptions (Energy Futures Group et al., 2016, 55).
Technical Reference Manual
NB Power provided an update to its Technical Reference Manual (TRM) in Appendix AC (NBP 1.52, DSM
Plan 2019-2021 Technical Reference Manual). A TRM provides a single, comprehensive resource on
savings calculations for all programs in a jurisdiction. TRMs provide transparency regarding deemed
savings estimates, a relatively simple and low-cost way of estimating energy efficiency savings (ACEEE,
2015, 9).
The scope of our review does not cover measure-specific data (e.g., whether certain savings estimates
are reasonable or not). Instead, we conducted a high-level review of the TRM and concluded that NB
Power’s TRM contains sufficient amounts of data. The TRM clearly presents key information and data for
energy efficiency measures such as measure description, energy and demand savings values and
calculation formula, measure cost, and effective useful life, along with data sources. Measure-specific
data should be investigated in a separate proceeding or forum with the type of thorough stakeholder
review process typically done in many other jurisdictions. When used appropriately, a TRM “can be very
useful for program planning purposes and can reduce M&V costs, create certainty, and simplify
evaluation procedures” (SEE Action, 2012, 4-9). However, some TRMs draw on algorithms from other
jurisdictions; these borrowed deemed values should be updated based on the results of the
jurisdiction’s own evaluation studies as soon as available. Also, there is a risk that TRMs become quickly
outdated as technologies change.
For this reason, TRMs should be updated periodically (e.g., every year) to reflect best available
information. NB Power does plan to update its TRM annually (NBP Response to NBEUB IR-81). However,
there is no plan in New Brunswick for oversight of the TRM update, and other stakeholders should be
afforded the opportunity to provide input. New Brunswick should establish a formal process for
updating the TRM, with defined timelines, stakeholder roles, and an independent entity responsible for
managing the update process.16
TRMs should be coupled with an EM&V plan that addresses any gaps identified through the TRM
development process. For example, NB Power currently derives demand savings for efficiency measures
using demand-to-energy consumption ratios from evaluations and literature reviews of similar
16 For more information on the TRM update process, see Synapse, PEI EE, 2016.

Synapse Energy Economics, Inc. Review of New Brunswick Power’s 2018/2019 General Rate Application 46
jurisdictions. NB Power plans to refine initial assumptions as the pilot projects are completed and
evaluated (NBP 1.51, DSM EMV Plan 2019-2021, p. 7).
Conclusions
NB Power’s evaluation plan and other information provided in this rate case provide a reasonable
amount of information for the Company’s evaluation activities, but lacks some key information. The
proposed evaluation budget may not be sufficient to conduct the planned evaluation studies. It is
certainly not enough to cover other types of evaluation studies that are not included in the evaluation
plan, but which may be needed for New Brunswick. While a measure-level review is outside of our
scope, the TRM clearly presents sufficient information and data for energy efficiency measures. The
TRM does not have any specific schedule for updates or does not have any formal process for a
stakeholder review.
6.4. Opportunities for Future Plans
As described in Chapter 2, energy efficiency and demand response programs provide a significant
opportunity for the Company to reduce revenue requirements, thereby assisting with both goals of
maintaining low rates and reducing debt. And as described in Chapter 4, there remains a large
opportunity for increasing energy efficiency and demand response programs to reduce electricity costs
and defer or avoid the need for expensive new capital projects. Energy efficiency and demand response
programs will become increasingly important, and increasingly cost-effective, once NB Power is assessed
higher and higher carbon charges over time.
Consequently, NB Power should investigate all opportunities to expand upon its Smart Habits programs
over time, with the goal of implementing all cost-effective efficiency and demand response programs. In
this section, we provide recommendations for how the Smart Habits programs can be improved and
expanded in the future.
Energy Efficiency
Energy efficiency program participation rates, budgets, and savings could be increased considerably over
time. If carbon mitigation and other avoided costs were properly accounted for, then all of the energy
efficiency programs would be more cost-effective. Moreover, the relatively high PACT ratio suggests
that there may be additional efficiency resources that NB Power can tap before efficiency costs exceed
benefits.
Regarding the potential for achieving more savings, there has not been a potential study completed
since 2012. However, NB Power has not tapped even close to the remaining achievable potential. From
2013/14 to 2017/18 (projected), NB Power reports total savings of 142 GWh, as compared to Dunsky’s
estimate of 388 GWh per year in 2017 for base achievable potential (NBP Response to NBEUB IR-61;
NBP Response to NBEUB IR-61 a) Attachment, slide 37; and NBP Response to NBEUB IR-85 Attachment).
We recommend that NB Power complete a new potential study as planned. This study will reveal
Synapse Energy Economics, Inc. Review of New Brunswick Power’s 2018/2019 General Rate Application 47
technologies and market segments where NB Power can expand its efforts. NB Power should continue
to explore opportunities for non-lighting savings as the lighting market transforms.
Demand Response
We encourage NB Power to consider ways to further investigate demand response programs to explore
ways to make them for successful and more cost effective. NB Power has identified some ways that it
may be able to improve the cost effectiveness of its demand response programs. These include
investigating an upstream approach with manufacturers to integrate load control devices into the
product upon purchase, and concentrating the commercial/industrial demand response program budget
in incentives, in order to send a stronger price signal to participants (NBP (NBEUB) IR-219).
Future Regulatory Policy and Guidance
Experience in other jurisdictions indicates that energy efficiency programs are most successful if they
are supported by clear, comprehensive regulatory guidance and policies. As NB Power expands its Smart
Habits programs it will be increasingly important for the Board to provide the Company with guidance
regarding the key issues of program design, budgets, savings, cost-effectiveness, EM&V, and more.
Further, as the potential costs and benefits of the Smart Habits programs expand, it will become
increasingly important to allow stakeholder input regarding those programs.
Many states and provinces have established regulations or guidelines describing how energy efficiency
programs should be planned for, reviewed, and implemented.17 Establishing criteria and principles to
comprehensively and appropriately evaluate DSM plans would significantly enhance the development of
energy efficiency resources in New Brunswick.
Some of the key regulatory policy features that are particularly valuable in promoting successful energy
efficiency resources include the following:
• Clear, stable, and long-term regulatory guidance and support.
• Robust stakeholder engagement, e.g., through a collaborative process or an energy efficiency advisory council.
• A policy mandate to implement all cost-effective energy efficiency, accompanied by a clear definition of what this means.
• Regulatory guidance on appropriate cost-effectiveness test(s) for screening efficiency programs and which costs and benefits to include.
• Guidance on proper estimation and presentation of avoided costs, including avoided energy, capacity, transmission, distribution, losses, and costs of compliance with environmental regulations.
17 Attachment 2 provides the Rhode Island Least Cost Procurement Standards as an example of what is typically included in
energy efficiency regulations or guidelines. Rhode Island is frequently ranked as one of the leading states in energy efficiency performance.

Synapse Energy Economics, Inc. Review of New Brunswick Power’s 2018/2019 General Rate Application 48
• Establishment of sound IRP practices and processes.
• Guidance on reasonable analysis and management of bill impacts, particularly where energy efficiency budgets are constrained due to concerns with rate impacts.
Further information on regulatory policy features to support implementation of energy efficiency is
available in Synapse’s Prince Edward Island energy efficiency report (Synapse, IRAC EE, 2016).
6.5. Recommendations
The 2018/2018 Smart Habits Programs
We recommend that the Board approve the energy efficiency programs, budgets, and savings targets
proposed by the Company for the 2018/2019 year. The proposed energy efficiency programs are well-
designed, cover a reasonable range of end-uses and customers, achieve a reasonable amount of savings,
are generally cost-effective, and are consistent with legislative goals, Company objectives, and industry
practices.
We recommend that the Board reject the demand response programs, budgets, and savings targets for
the 2018/2019 year. The demand response program designs are not sufficiently developed and the
proposed programs are not expected to be cost-effective even by the Company’s analysis.
We recommend that the Board approve the current evaluation plan. NB Power’s evaluation plan and
other information provided in this rate case provide reasonable amount of information for the
Company’s evaluation activities, but lacks some key information.
Opportunities for Future Smart Habits Programs
We recommend that the Board direct NB Power to file in its next rate case a revised DSM plan that
addresses the deficiencies identified in this report, particularly regarding the demand response
programs, the program design descriptions, and the evaluation plans. The Company and the Board
should not wait for three years to address these important deficiencies.
We recommend that the Board direct the Company to include in the revised DSM plan new demand
response programs. The description of new demand response programs should (a) provide sufficient
detail on program designs; (b) address the limitations identified in this report (e.g., by accounting for
avoided transmission and distribution costs); and (c) demonstrate that the programs will be cost-
effective.
We recommend that the Board direct the Company to file more complete program information in all
future DSM Plans. This should include, for each program, the following:
• incentive design and covered measure types: dollar incentive levels or formulas for determining incentive levels, incentive strategy (early retirement or replace-on-burnout), description of how incentive level was determined relative to certain price points (e.g., incremental cost, total project cost, project payback, etc.), required efficiency and other specifications of measures

Synapse Energy Economics, Inc. Review of New Brunswick Power’s 2018/2019 General Rate Application 49
• marketing strategy: planned and potential outreach, marketing, advertising efforts and strategies
• target customers and customer eligibility: customer classes and income thresholds targeted by the programs, and requirements to participate
• annual budgets
• annual savings, lifetime savings, and peak demand savings: incremental and cumulative
• evaluation plans: budgets, type of evaluation, strategy, schedule (for individual programs and as a portfolio)
• demonstration of cost effectiveness: present value of costs, present value of benefits, total net present value benefits, and ratio, using a test that reflects the priorities of the province and best practices in resource valuation
We recommend that the Board direct NB Power to provide in all future DSM Plans the following
additional pieces of information for each evaluation study: (a) high-level description of study
approach/methodology, (b) budget for each program, (c) evaluator name (if known) or evaluator
selection method. We also recommend that the Board direct NB Power to allocate additional budget to
future evaluation plans, to ensure that they are sufficiently robust to support increased energy
efficiency and demand response implementation.
Future Regulatory Policy and Guidance
We recommend that the Board notify the Company that the Board places a high priority on the Smart
Habits programs, because of their ability to reduce costs, reduce bills, defer new capital investments,
reduce the debt-to-equity ratio, and reduce the costs of GHG constraints. In order to demonstrate that
the Board places a high priority on the Smart Habits programs, we recommend that the Board direct the
Company to achieve all cost-effective energy efficiency and demand response resources.
An additional way for the Board to demonstrate that it places a high priority on the Smart Habits
program is to establish guidelines defining how energy efficiency and other distributed energy resources
should be planned for, reviewed, and implemented in the future.
We recommend that the Board develop guidelines for distributed energy resources. The DER guidelines
should ideally be developed through a separate proceeding. Alternatively, the guidelines could be
developed as a part of the Company’s next rate case filling. Either way, the process should allow for
meaningful stakeholder input in the drafting, discussion, and approval of IRP guidelines. The
establishment of DER guidelines should be coordinated with the establishment of IRP guidelines, either
by preparing them in parallel or including the DER guidelines within the IRP guidelines.
We recommend that the DER guidelines address at least the following topics:
1. Program planning and review processes. This includes establishing a continuous cycle
encompassing planning, implementation, evaluation, and reporting. This includes
incorporating standardized data table templates and metrics for plans and reports, to
facilitate comparisons of plans to reports and performance from year to year.

Synapse Energy Economics, Inc. Review of New Brunswick Power’s 2018/2019 General Rate Application 50
Program design. This includes describing the breadth of customer types and end use markets to
be targeted by energy efficiency programs. The portfolio should include all “core” energy
efficiency programs, to include, at a minimum, the following: residential (new construction,
single-family retrofits, and products and appliances); low income (new construction, single-
family retrofits, and multi-family retrofits); commercial and industrial (new construction, small
businesses, large businesses prescriptive, large businesses custom, and multi-family buildings).
This also includes reflecting long-term policy goals, and program designs that are consistent with
those goals.
Cost-effectiveness screening. This includes specifying that the Company should seek to
implement all cost-effective distributed energy resources. This includes describing how avoided
costs should be presented and calculated. Avoided costs should include avoided energy,
capacity, transmission, distribution, losses, and costs of compliance with environmental
regulations. This should also incorporate state-of-the-art practices, including the principles and
methodologies in the National Standard Practice Manual (NESP, 2017). This also includes
specifying inputs and methodologies for assessing rate and bill impacts of DER programs.
Multi-year planning and savings targets. This includes identifying energy efficiency program
budgets and savings targets in three-year plans.. Program budgets and targets should be
updated on an annual basis. This also includes guidance for NB Power to ramp-up savings
targets by an additional 0.4 percent of retail sales each subsequent year, to reach savings levels
consistent with achieving all cost-effective energy efficiency in the province.
Cost recovery and budgeting. This includes establishing rules for NB Power to shift funding
across programs within a sector as needed to meet the needs of customers in a timely manner.
The guidelines should set limits regarding the amount that can be shifted (e.g. less than 25
percent) within a program year without Board approval. This should also include requirements
for tracking categories of spending and budgets to allow for comparison with other jurisdictions,
e.g. costs of saved energy or savings as a percent of retail sales.
Stakeholder input. The guidelines should establish an ongoing, permanent DER stakeholder
process to allow for meaningful input on program design, implementation, and evaluation.
Members of the collaborative should include customers from different sectors and of different
sizes, consumer advocates, energy efficiency experts, and environmental groups. Stakeholders
should have unfettered access to information, fair ground rules for deliberations, and recourse
to adjudicated proceedings or other regulatory intervention. The process should allow for
independent DER experts to advise the stakeholders, to be funded through the DSM portfolio
budget.18
18 For examples of effective stakeholder processes, see information on the Massachusetts Energy Efficiency Advisory Council at
http://ma-eeac.org/; the Rhode Island Energy Efficiency and Resource Management Council at https://rieermc.ri.gov/; and the Connecticut Energy Efficiency Board at https://www.energizect.com/connecticut-energy-efficiency-board.
Synapse Energy Economics, Inc. Review of New Brunswick Power’s 2018/2019 General Rate Application 51
Evaluation. The guidelines should establish a formal process for updating evaluation plans and
the TRM, with defined timelines, stakeholder roles, and an independent entity responsible for
managing the update process.

Synapse Energy Economics, Inc. Review of New Brunswick Power’s 2018/2019 General Rate Application 52
7. SMART GRID
Smart Grid investments and activities form a core component of NB Power’s plans for the test year, and
of the Company’s vision throughout the planning period reflected in the 10-Year Plan, the Strategic Plan,
and the IRP. NB Power rightly recognizes that new technologies can be deployed throughout its
operations to improve customer service and cost-effectiveness. The Company recognizes that these new
technologies will require changes in processes and utility approach throughout its organization. Smart
Grid also provides enabling technology to improve the delivery of Smart Habits and Smart Solutions
programs.
Smart Grid has many components, but the largest by far is the proposed combined investment in AMI
and the Digital Communications Network that will enable the collection of data from the new meters.
These two pieces of technology and the associated process changes are combined in NB Power’s AMI
capital investment proposal. Because the Board has the explicit responsibility to approve or disapprove
of this investment in this case, we have focused our report on evaluating this proposal. We conclude this
section with a brief examination and recommendations regarding the non-AMI portions of NB Power’s
Smart Grid program.
7.1. Advanced Metering Infrastructure
NB Power proposes to deploy advanced meters throughout the province. It also proposes to implement
the necessary communication system to collect the data from those meters and the software tools
(meter data management system, or MDMS) to effectively use the data and integrate it with existing
systems (such as billing). Meter deployment would begin in 2019 and extend for three years. NB Power
identifies that this deployment will cost $153.8 million, which is in excess of the $50 million threshold
for Board review and approval of a capital project under subsection 107(1) of the Electricity Act. Of the
total cost, $62.2 million is the cost of the meters and their installation; $42.5 million of capital
investment will pay for the communications system, integrations with existing systems, meter data
management, procurement services, and pre-engineering costs; and $49 million will support operations
and maintenance costs associated with the deployment (including the $16 million cost of the social
benchmarking energy conservation program).
NB Power has presented a cost-benefit analysis for the AMI deployment which shows that the project
would result in a net cost, on a present value basis, to NB Power ratepayers between now and 2033. The
present value cost in its analysis is $122.7 million, while the benefits total $121.4 million. NB Power has
quantified benefits from:
• an energy conservation program utilizing social benchmarking ($28.9 million);
• avoided meter replacement costs ($23.5 million);
• reduced manual meter reading costs ($19.6 million);
• reduced meter visits including for connection and disconnection ($10.3 million);

Synapse Energy Economics, Inc. Review of New Brunswick Power’s 2018/2019 General Rate Application 53
• increased meter accuracy ($5.8 million);
• a portion of the savings from a future conservation voltage reduction (CVR) program ($5.3
million);
• the remaining net book value of the AMI investment at the end of the study period ($5.3
million); and
• seven other smaller impacts which each provide $1.1 million or less in present value benefits.
NB Power has assumed for its analysis that each new meter will have a 15-year life. We believe this
assumption strikes an appropriate balance between the possible hardware life of the meters themselves
and the likely rapid pace of technological advancement that may spur a faster replacement cycle than
for traditional meters.
Costs of the AMI Proposal
NB Power partnered with Nova Scotia Power, Emera Maine, and Tampa Electric Company for a joint
procurement process. This allowed NB Power to share the cost of the procurement process itself
(including for the services of the consultants which helped the consortium with its procurement), draw
on the joint expertise and experience of the four utilities, and take advantage of economies of scale
associated with a larger number of meters and communications infrastructure procured together. This
procurement process appears to have been successful, and NB Power has received competitive and
appropriate bids for the system. We believe it is unlikely that NB Power could have achieved this cost for
AMI deployment if it had undertaken this process alone.
We have examined AMI business cases filed by other utilities in order to evaluate whether the all-in cost
that NB Power proposes is reasonable. We will make comparisons on a non-discounted basis because
AMI costs tend to be clustered at the start of analysis period and it allows us to compare without
worrying about different discount rates. NB Power’s non-discounted proposed cost is $153.8 million.
None of these comparison utilities are deploying the same set of technologies as NB Power proposes.
Rather, they include some additional items but exclude some of what NB Power proposes. However,
they do indicate that NB Power’s proposed costs are reasonable.
• BC Hydro filed a smart meter infrastructure plan in 2010 to serve its 1.9 million customers. It
included both metering and communication systems (as well as investments in in-home devices
and targeted at energy theft reduction). The total proposed cost was $930 million, including
reserve and contingency (BC Hydro, 2010, p. 10). Scaled to the size of NB Power’s proposed
deployment, the equivalent cost would be $173.8 million. Subtracting the reserve and the
conservation tools, the equivalent cost would be $145 million.
• AEP Ohio filed in 2013 to deploy 894,000 advanced meters. It also included associated
communications infrastructure and circuit control technology, along with distribution circuit
automation and Volt-VAR optimization for a number of circuits. The cost listed was $US465
million (AEP Ohio, 2013, p. 10). Scaled to the size of NB Power’s proposed deployment and using
an exchange rate of 1.33, the equivalent cost would be $245.6 million.
Synapse Energy Economics, Inc. Review of New Brunswick Power’s 2018/2019 General Rate Application 54
• Consolidated Edison (New York) filed in 2015 to deploy 3.5 million electric meters and 1.2
million gas communications modules for a total cost of $US1.285 billion (New York Public
Service Commission, 2016, p. 4 and 6). Scaled to the size of NB Power’s proposed deployment
and using an exchange rate of 1.33, the equivalent cost would be $129 million. This assumes
that gas meters and electric meters have the same cost. In practice, however, the gas
deployment is only of communications modules to add to existing meters. We can provide an
upper bound on a scaled cost by counting only electric meters. This results in a scaled
comparison cost of $173.3 million.
While the initial costs of NB Power’s proposal appear reasonable, we disagree with NB Power’s
treatment of future costs in its cost-benefit analysis. NB Power chose to conduct the analysis for a 15-
year period that ends just as its AMI meter fleet is approaching the end of its life. NB Power’s current
meter fleet has an average age of 13 years and an expected lifetime of 22 years and 7 months (domestic
meters) or 24 years and 6 months (power meters) (NBP (NBEUB)IR-31). Therefore, at the start of the
analysis period, NB Power has a meter fleet with an average of at least 9.6 years of remaining life. At the
end of the analysis period, in contrast, NB Power’s meter fleet will have a remaining life of just 1.3 years:
the average meter will be 13.7 years old compared with an expected lifetime of 15 years (NBP (NBEUB)
IR-31).
One way to see this cost is that the net book value of NB Power’s meters (and associated hardware,
software, MDM, etc.) will fall from $18.5 million to $12.5 million from the start to the end of the analysis
period.19 (This includes the write-down of the existing meters.) NB Power counts the remaining value of
$12.5 million as a benefit of the AMI deployment, instead of counting the reduction in net book value by
$6 million as a cost. Correcting this results in an increase in the net cost of AMI deployment by $7.8
million. In other words, remove the $5.3 million benefit and replace it with a $2.5 million cost.
Accelerated depreciation of the existing meters also creates a net cost to ratepayers. Instead of paying
off these sunk costs over the remaining hardware life of the meters (an average of more than nine
years), NB Power is asking ratepayers to pay for them over the next five years. Since we don’t have the
full data for a depreciation study, we have had to be necessarily simplistic in estimating these costs.
Nevertheless, we have calculated them as having a present value of roughly $3.8 million.
Benefits of the AMI Proposal
We have examined NB Power’s claimed benefits from AMI deployment. Most appear reasonable, and
we do not doubt that AMI would deliver substantial benefits to the province’s ratepayers. However,
three claimed benefits of AMI are problematic: the social benchmarking conservation program, CVR, and
the remaining book value. The claimed remaining book value benefit was discussed above; we believe it
is more appropriate to recognize the decline in net book value as a cost.
19 For consistency, we are using the net book value of meters as identified in the AMI Investment Rationale ($18.5 million),
rather than the higher value ($20.1 million) identified in NB Power’s Response to NBEUB IR-160. The implied base case (no AMI deployment) is that the net book value of the meters will stay level as meters age out and are replaced consistently.

Synapse Energy Economics, Inc. Review of New Brunswick Power’s 2018/2019 General Rate Application 55
Social benchmarking
NB Power’s largest claimed benefit from AMI deployment is $28.9 million in present value benefit from
“kWh Reduction with Customer Programs.” These customer programs are described and modeled
entirely as “social benchmarking” programs similar to the Oracle Home Energy Report program that NB
Power currently uses to engage more than 120,000 customers regarding their energy use. As NB Power
is currently demonstrating, AMI is not necessary for implementing a social benchmarking-based
conservation program. NB Power has assumed that AMI will enable substantial additional savings but
has not presented evidence to support that claim. In fact, the evidence indicates that additional savings
from AMI may be small to nonexistent.
First, let us examine the calculation of NB Power’s claimed benefit. NB Power assumes that more than
312,000 customers (consisting of about 300,000 residential customers and 12,000 general service
customers) will reduce their consumption by an average of 141 kWh/year as a result of the program (0.9
percent savings), with 30 Watts of peak savings per participant. This results in net savings at generation
of 46.7 GWh per year, and almost 10 MW on peak. Once multiplied by the avoided costs of energy and
peak demand, this results in savings in excess of $3 million per year, and a present value through 2033
of $28.9 million. NB Power assumes that it will be able to implement such a program for a cost of $3.50
per year per participant, adjusted for inflation. The 2022 cost is $1.1 million, and the present value of
the cost over the analysis period is $9.5 million. The claimed net benefit from the program is therefore
$19.4 million.
The Home Energy Report program that NB Power proposes to implement from 2018 to 2021 is
projected to reduce energy use by 38.3 GWh and peak by 5.2 MW. The program aims to engage 170,000
customers with mailed reports at a cost of $2.3 million per year ($13.50 per participant). NB Power
explains that it “took care to not double count the benefits attributed to the Home Energy Report in the
2019–2021 DSM Plan and the potential future social benchmarking program attributed to the AMI
business case. Since it is assumed that a full roll-out of the AMI meters is not expected until after 2021,
the next DSM Plan would include an enhanced Home Energy Report program with the benefits of AMI
included (i.e. lower cost and/or higher impact) or an alternative social benchmarking program that
leverages AMI” (NBP Response to NBEUB IR-172(c)).
There are two ways to interpret NB Power’s proposed conservation program and associated value. The
first is that NB Power is proposing to replace its existing Home Energy Reports program with the
program characterized in the AMI business case. This interpretation is supported by NBP (NBEUB) IR-
172(c), in which the Company uses the lack of overlap in time between the proposed program and the
current program as evidence that savings are not double-counted. The problem with this interpretation
is that without AMI, NB Power could continue to provide the same level of social benchmarking
conservation program it does today, or expand that program to serve the larger universe of customers
envisioned by the AMI proposal. Therefore, the only net benefits attributable to AMI must be those that
are additional to the non-AMI case. Setting aside the possibility to expand the non-AMI program, the
difference from the proposed DSM plan would be 8.4 GWh energy use reduction per year
(46.7−38.3=8.4) and 4.8 MW on peak (10−5.2=4.8), along with a reduction in program cost from $2.3
million to $1.1 million per year. Such a dramatic reduction in program cost would require further
Synapse Energy Economics, Inc. Review of New Brunswick Power’s 2018/2019 General Rate Application 56
justification. Regardless, these net benefits do not equal NB Power’s claimed net benefits from an AMI-
associated conservation program. If program replacement is the correct interpretation, NB Power must
recalculate the net benefits for inclusion in the cost-benefit analysis.
The second interpretation is that the claimed benefits are in addition to the baseline case of Home
Energy Report continuation. This means that NB Power would be claiming that the addition of AMI will
allow the Company to more than double the savings from social benchmarking, while reducing its cost
per customer served. If we take NB Power’s analysis in this light, the Company is claiming that with AMI
it will be able to save 85 GWh per year (46.7+38.2=85), along with 15.1 MW on peak (10+5.2=15.1).20
The cost would be about $3.4 million per year (2.3+1.1=3.4). This would be a remarkable program: It
would be inducing customers to reduce their consumption more than 1.6 percent every year at a cost
per customer of less than $11 (about 20 percent less than the current program). NB Power has claimed
in NBP (NBEUB) IR-172(b) that AMI will increase program impact and reduce costs, so we must seriously
evaluate a claim that AMI will result in dramatic improvements in savings and program costs.
NB Power states that “the social benchmarking program used in the AMI business investment rationale
model was simply an example of a potential program that could be offered” (NBP (NBEUB) IR-172(e)).
NB Power also repeatedly claims that it has been conservative in the development of assumptions
regarding the costs or benefits of the AMI proposal (NBP 11.02, Revised Evidence, p. 196 and 198).
The other social benchmarking programs that NB Power cites by providing their evaluations in
Appendix Y (NBP 1.45, NBP 1.46, and NBP 1.47) do not reliably deliver annual savings at the level that
NB Power assumed:
• The evaluation of Pacific Gas & Electric shows savings between 0.9 percent and 1.5 percent (NBP
1.45, Appendix Y ii, p. 43).
• The evaluation of AEP Ohio shows average savings of 1.99 percent across cohorts that included
only above-average energy use customers, low-income customers, or customers with AMI. AMI
customers saved 1.6 percent (NBP 1.46, Appendix Y iii, p. 13).
• The evaluation of Ameren Illinois shows savings of between 0.92 percent and 1.55 percent
across programs that included only above-average energy use customers who are also dual-fuel
(electric and gas) customers (NBP 1.46, Appendix Y iii, p. 81-82).
• The evaluation of Commonwealth Edison shows average savings of 1.13 percent across a
number of cohorts; the only AMI-specific cohort has savings of 1.21 percent (NBP 1.47,
Appendix Y iv, p. 11).
• The evaluation of San Diego Gas & Electric shows average savings of 1.9 percent (NBP 1.47,
Appendix Y iv, p. 64).
20 Difference is due to rounding.

Synapse Energy Economics, Inc. Review of New Brunswick Power’s 2018/2019 General Rate Application 57
• The evaluation of Puget Sound Energy shows average savings of 3.0 percent among a cohort of
dual-fuel (gas and electricity) customers that use more than 80 MMBtu of energy per year (NBP
1.47, Appendix Y iv, p. 102 and 104).
Of the six programs that NB Power examined, three produce savings below NB Power’s assumption, one
is equal, and two exceed it. NB Power has not yet completed an evaluation of its own non-AMI Home
Energy Report program to see how it compares with these examples.
The programs that NB Power highlighted in its submission generally started with or continue to serve
primarily high-use households. As the authors of the Commonwealth Edison evaluation say, “HER
programs have a well-documented pattern that higher usage customers achieve higher savings from the
program” (NBP 1.47, Appendix Y iv, p. 9). NB Power’s assumed AMI-enabled program would serve all but
7 percent of its customers (4 percent control group and 3 percent opt-out), so it would include both low-
usage and high-usage customers. This means that, all things being equal, we should assume that NB
Power’s near-universal program would underperform compared with these other programs.
In NBP (NBEUB) IR-172(f), the Company makes an adjustment of 20 percent for “active” available
participants. This adjustment was not made in the calculation of the AMI business case. If it were made,
the claimed net cost of AMI deployment would likely increase by about $3.9 million (a 20 percent
reduction in the conservation program’s $19.4 million net benefit). This adjustment would, however, be
a positive corrective step to account for the challenge that home energy report-type programs have
with move-out, seasonal customers, and other mechanisms of attrition from the treatment group. If NB
Power has 322,833 residential customers, processes over 43,000 move-out requests per year, and
serves more than 18,000 seasonal customers (NBP (NBEUB) IR-171), the actual universe of eligible
households for participation in a home energy report program is likely closer to 260,000. After
accounting for opt-out and the need for a control group, residential participation would likely be limited
to about 240,000. This is about 20 percent lower than assumed in the business case.
While NB Power claims that AMI would “[i]ncrease program impact by providing more timely, relevant
data to customers on actions they can take to reduce consumption” (NBP (NBEUB) IR-172(b)), NB Power
has provided no evidence of the extent of this impact in New Brunswick or elsewhere. The only home
energy report evaluations NB Power presented that compare AMI to non-AMI customers (the AEP Ohio
and Commonwealth Edison evaluations) are either imperfect (the AEP Ohio evaluation doesn’t have
comparable groups with and without AMI) or they show a larger effect among non-AMI households (the
Commonwealth Edison evaluation shows 1.68 percent effect for non-AMI households in the same
“wave” as the AMI households that had a 1.21 percent effect).
Summary of social benchmarking critique
NB Power’s largest claimed benefit for AMI is poorly justified and very likely overstated. While claiming
that the program is conservatively defined, NB Power has in fact asked the Board to rely on a large and
uncertain source of value in order to bring the AMI deployment’s benefits close to its costs. Net benefits
are overstated by at least 20 percent due to lower participation, as NB Power has effectively admitted in
NBP (NBEUB) IR-172(f). That alone would be a roughly $3.9 million overstatement. In addition, NB

Synapse Energy Economics, Inc. Review of New Brunswick Power’s 2018/2019 General Rate Application 58
Power has either misstated the baseline (ignoring the existing Home Energy Report program) or claimed
quite aggressive energy and cost savings while claiming conservatism.
Conservation Voltage Reduction
Utilities can deploy CVR without AMI. However, AMI assists with CVR by providing voltage sensors at
every customer’s location. This both increases the quantity of data available to optimize CVR and avoids
the cost of deploying separate voltage sensors. It is appropriate for the AMI deployment analysis to
include a share of the benefits of CVR, and we do not object to the share that NB Power has assumed.
However, NB Power has not committed to CVR and has no specific plan for its implementation (NBP
Response to NBEUB IR-174(a)), so shared benefits from CVR are too uncertain to include in this cost-
benefit analysis.
In addition, NB Power has not sufficiently justified the need to wait for seven years after the AMI meters
are deployed to begin CVR (NBP 11.02, Revised Evidence, p. 200). In fact, in the calculation of the value
of CVR for the purposes of the AMI Investment Rationale (Exhibit NBP 1.48), NB Power assumes that
CVR benefits will begin in 2025, which is only four years after meter deployment is complete. The
Company asserts that CVR is dependent on other technologies “such as Supervisory Control and Data
Acquisition (SCADA), Distribution Management Systems (DMS), AMI, and Digital Communications
Networks” (NBP (NBEUB) IR 174(b)). These other technologies are all envisioned as deployed by 2021.
We are encouraged that NB Power, in NBP (NBEUB) IR-174(b), has indicated an intention to
incrementally deploy CVR. NB Power should develop a plan for CVR, including a detailed timeline that
relates to the timelines for the deployment of enabling technologies. It should submit the plan to the
Board at the next rate case so that the benefits can be appropriately characterized and attributed to the
AMI proposal and to evaluation of other enabling technologies.
AMI Should Be Implemented in a Way that Empowers Customers
AMI has the potential to increase customer engagement and optimization of their energy use. It is also
an enabling technology for third-party service providers who can provide innovative services to utility
customers. For example, the “Green Button” initiative has established standard data formats for the
sharing of smart meter data with service providers.21 Metered energy use data is fundamentally the
customer’s data: Its collection is only possible because of the customer’s financial commitment to
metering, and the customer should have control of that data to share as she sees fit. We are concerned
with NB Power’s response when asked about sharing data with third parties. NB Power revealed an
expectation that data would be shared with the Company’s consultants and contractors, but it failed to
commit to making data available for customer-designated third parties (NBP Response to NBEUB IR-
168). The Board should require NB Power to allow customers and their designees access to time-
resolved usage data through standard formats and protocols.
21 See http://www.greenbuttonalliance.org/ for information about the Green Button Alliance, a partnership of utilities,
technology providers, and government agencies.

Synapse Energy Economics, Inc. Review of New Brunswick Power’s 2018/2019 General Rate Application 59
NB Power has proposed that customers who opt out of having an AMI meter be charged a fee that
corresponds to the costs that their choice causes. While this is appropriate and can be done fairly, we
are concerned that NB Power’s lack of specificity on the method of calculating that fee could result in
unexpected results for the Company, the Board, and customers. NB Power says that it will “develop an
opt-out policy, procedures, and rates in Year 1 of the AMI project” (NBP (NBEUB) IR-26). It does not
know whether the fee will differ based on whether the customer retains an analog versus an AMR
meter, or whether a customer who opts out will be asked to pay for some or all of the AMI deployment
to their fellow customers. In other words, will they pay the direct or net cost of their choice? The Board
should require NB Power to provide a proposed opt-out fee structure, with example or estimated
values, prior to approval of the AMI investment.
AMI Should Be Coupled with Time-Based Prices and Reviewed in the Next Rate Case
As calculated by NB Power, the proposed AMI investment would have a present value net cost to New
Brunswick ratepayers of $1.3 million. AMI would provide some unquantified benefits as well, and NB
Power implies that these unquantified benefits plus the quantified benefits will outweigh the costs, and
thus the Board should approve the capital investment.
However, we have shown that NB Power has significantly understated the costs and overstated the
benefits of its AMI proposal. We suggest several adjustments to the Company’s analysis in order to
address some of our concerns above. In particular, NB Power should:
• Account for loss in net book value of meters: $7.8 million.
• Account for accelerated depreciation: $3.8 million.
• Adjust for overstated net benefits from AMI-enabled social benchmarking: At least $3.9 million, up to $19.4 million.
• Not include the benefits from CVR until NB Power presents an implementation plan: $5.3 million.
These adjustments turn a nearly break-even proposition into a net cost to ratepayers of roughly $22.1 to
$37.6 million.
NB Power could make the AMI initiative more cost-effective by making concrete the non-quantified or
insufficiently concrete benefits they have claimed. In particular, NB Power should:
• Produce a plan for CVR to make those claimed savings real, as discussed above, and
• Propose time-based pricing that empowers customers and enables substantial system-level savings.
Time-based pricing could provide considerable benefits to both participating customers and the body of
ratepayers as a whole. In its Evidence, NB Power provided an example of the net benefit from
implementation of a critical peak price rate in which only 19,000 customers participated: $5 million
present value (NBP 11.02, Revised Evidence, p. 200). If NB Power has to offset a net cost of between $17
to $32 million (presuming that the CVR benefits are subsequently justified), net benefits from time-
based pricing would need only exceed this small-group example by a factor of 3.5 to 6.5.

Synapse Energy Economics, Inc. Review of New Brunswick Power’s 2018/2019 General Rate Application 60
As an example that this kind of benefit is possible, consider the possible impact of a peak-time rebate
rate design as the default rate for all residential customers. Instead of 19,000 participating customers,
there would be nearly 323,000. If one-third of customers opted out of participating at all, and the
remaining customers only changed their behavior by half as much as NB Power’s example critical peak
price program, the net benefit of the program could be around $28 million.22 Data from dynamic pricing
implementations indicate that peak time rebate programs are less effective than critical peak price
programs, but only by about a factor of two (Faruqui and Sergici, 2013, p. 6). That effect may itself be
due to differences in the ratio of prices used in the rate design rather than to fundamental differences in
customer response.
In sum, it might be possible to develop and implement an AMI initiative that turns out to be cost-
effective. However, NB Power has not provided the evidence for a cost-effective AMI initiative in this
docket. In order to develop and justify a cost-effective AMI initiative, the Company would at least have
to first develop time-based rates that could deliver significant benefits, as well as the quantitative details
justifying those benefits.
Recommendations
We recommend that the Board reject the Company’s AMI proposal. The Company’s own analysis
suggests that the proposal is not cost-effective, and that analysis suffers from some fundamental flaws.
Given the Company’s goals of maintaining low and stable rates and reducing debt, spending so much
money on an initiative that is not essential and not cost-effective is unwise. Furthermore, the absence of
a concrete proposal for time-base rates makes it very difficult to assess one of the most significant
potential benefits of AMI.
We also recommend that the Board direct the Company to refile a new AMI proposal in next year’s rate
case. The new AMI proposal should correct for the limitations described in this report, and it should
identify opportunities for achieving net benefits from AMI.
It is our understanding that NB Power and the NBEUB have deferred consideration of time-based pricing
until the next rate case for FY 2019–20. This provides an opportunity for NB Power to file in the next rate
case a complete and revised AMI proposal which:
• addresses the analytical issues we have identified regarding meter book value and accelerated depreciation;
• corrects the deficiencies we have detailed in the analysis of AMI impacts on social benchmarking or other conservation programs;
• provides a plan for CVR earlier than seven years after AMI meter deployment; and
• couples detailed analysis and proposals for time-based rates with the AMI infrastructure necessary to support them.
22 $5 million × 323,000 / 19,000 × 2/3 × 1/2 = $28.3 million

Synapse Energy Economics, Inc. Review of New Brunswick Power’s 2018/2019 General Rate Application 61
We recognize that rejecting the AMI proposal at this time, while inviting an improved proposal next
year, is not without cost. We do not take lightly the disruption that delaying a project can cause.
However, in purely financial terms, NB Power estimated little net cost in the revenue requirement from
a one-year delay, because the avoided capital cost would be balanced by personnel costs as staff remain
mobilized without beginning the project (NBP Responses to NBEUB IR-124 and NBEUB IR-238). These
staff may be productively used during that year improving the AMI proposal for resubmission. A one-
year delay in the AMI capital investment would not substantially impact the long-term pursuit of the
Company’s debt-equity target.
7.2. Non-AMI Smart Grid Proposal
Overview
NB Power has been working closely with Siemens since 2012 on grid modernization and smart grid. NB
Power’s smart grid activities are diverse, and no other new activity approaches the size and scale of the
proposed AMI and Digital Communications Network rollout. However, the Company’s other smart grid
technology plans are not small: Between 2019 and 2028 the Company plans to spend $139 million on
capital to support them, while spending $111 million on AMI and Digital Communications Network (NBP
1.11, Appendix C I, p. 18).
The plan that NB Power is implementing in partnership with Siemens can be described as a set of
activities to update the Company infrastructure in terms of its tools, operations, and approach. Take the
“Smart Organization” domain as an example: This relates to core competencies in information and
operational technology, cybersecurity, relations with stakeholders and the Board, and the procurement
processes necessary to purchase wisely in the modern world. “Smart Asset and Work Management” is
similarly focused on better performing the core activities of a Company such as maintenance and work
management.
Recommendations
In general, the non-AMI initiatives of the Smart Grid proposal appear to be reasonable and consistent
with industry practices, regulatory objectives, and the Company’s long-term goals. Therefore, we
recommend that the Board approve these non-AMI initiatives. However, given the magnitude and the
important role of these initiatives, we recommend that the Board monitor them closely over time and
provide guidance on their implementation.
First, NB Power should constantly evaluate the need, the costs, and the benefits of the non-AMI
initiatives to ensure that they are prudent and that they are implemented as efficiently and cost-
effectively as possible. Those elements that are non-essential and are not expected to produce net long-
term benefits to customers should be carefully scrutinized.
Second, Smart Grid tools for integrating distributed energy resources must be well-coordinated with the
planning and delivery of the Smart Habits and Smart Solutions programs. If the Board orders

Synapse Energy Economics, Inc. Review of New Brunswick Power’s 2018/2019 General Rate Application 62
adjustments to the Smart Habits or Smart Solutions programs, the Company should also make any
related adjustments in Smart Grid initiatives.
Third, NB Power should develop and provide the Board with more specificity regarding its Smart Grid
initiatives. For example, Smart Network Operations will be engaged in laying the groundwork for CVR.
We support NB Power investigating opportunities for cost-effective CVR, to pilot CVR, and to move to
scale across the province. As we discussed above, we believe that NB Power needs a more detailed plan
for CVR, and we recommend that the Board direct the Company to develop such a plan.
Fourth, NB Power should consider actively developing in-house expertise to provide a check on the
Siemens’ recommendations and reduce the need for Siemen’s assistance as time goes on. The use of a
broad and all-encompassing structure like the Siemens Compass means that the Company’s long-term
plan lacks specificity. It also means that there is relatively little transparency for the Board into the
details of processes or decision-making that NB Power is implementing with Siemens’s assistance. A
deep integration with a consultant can be effective, but it can also leave the Company overly-
dependent.
Finally, we highlight the importance of the Smart Organization project on cyber security and privacy. The
goal of this project is to incorporate best practices for cyber security and privacy into tools and
processes through the Company. This should include both operational cyber security (prevention of
outside actors from impacting the delivery of electric service) and data security/privacy (prevention of
the release of collected private customer or Company data). One challenge will be the development of
security practices and protocols that keep data secure yet accessible to customers and their designated
agents. We recommend that the Board consider opening a separate proceeding to establish regulatory
guidelines for cyber security, data privacy, and customer access. Such a proceeding should allow for
stakeholder input and collaborative development of common principles and approaches across all the
province’s electric and gas utilities.

Synapse Energy Economics, Inc. Review of New Brunswick Power’s 2018/2019 General Rate Application 63
8. SMART SOLUTIONS
8.1. New Brunswick Power’s Proposal
Smart Solutions is NB Power’s plan for delivering services that enable customers to manage their energy
consumption and lower their bills. NB Power has several objectives in implementing Smart Solutions:
mitigating the need to invest in new generation assets and/or power purchase agreements, reducing
risk that traditional assets will be stranded, and developing new lines of business and streams of
revenue. The goal of the latter is to offset declines in electric distribution revenues resulting from, for
example, increases in adoption of distributed generation, energy storage, and energy efficiency (NBP
11.02, p. 204-205 and 210). By offering these services, NB Power may be able to increase revenues,
which in turn may enable NB Power to achieve a more balanced debt-to-equity ratio.
Smart Solutions includes near-term investments with benefits accruing in later years. According to NB
Power, the Smart Solutions plan has a benefit-cost ratio of 1.85 and results in a $1.1 billion decrease to
the present value of revenue requirements over the 25-year term of the IRP (NBP Evidence, 2017, p.
205).
Ostensibly, NB Power’s existing initiatives for water heating, exterior lighting, and EV charging fall under
the Smart Solutions umbrella (NBP 11.02, p. 255, lines 25 to 26). In 2017 and 2018, NB Power plans to
focus on entry into the markets for publicly accessible EV charging stations, smart home technologies,
and solar solutions (NBP Evidence, 2017, p. 240). These initiatives are described further below:
• EV chargers. NB Power states that it must adapt to increasing adoption of EVs. EV adoption has
not yet become widespread in New Brunswick but has seen substantial growth elsewhere (NBP
11.02, p. 210). NB Power plans to assess and subsequently launch EV charger business
opportunities, such as in the residential, fleet, and workplace markets NBP 11.02, p. 260). Two
of NB Power’s initiatives are already underway: the SmartTwo EV Chargers and EV DC Level 3
Chargers (NBP 11.02, p. 226).
o SmartTwo EV Charger program is for commercial and general service customers.
Participating customers purchase the charger from AddÉnergie (a third-party partner)
and incur all installation and operating costs. Any increases in revenues from this
program to NB Power arise from increased electricity sales. There are currently
approximately 77 Level 2 chargers in New Brunswick, 16 of which are owned by NB
Power (NBP Response to NB EUB IR-184). Currently, there are plans to enable
installation of 100 or more customer-owned Level 2 chargers (NBP 11.02, p. 240).
o The public EV DC Level 3 charging program seeks to encourage EV adoption in the
province by establishing a network of charging stations. It has a long-term objective of
leveraging EV battery storage to provide energy back to the grid during peak times. The
DC Level 3 chargers are located at strategic locations around the province (NBP (NBEUB)
IR-184). Currently, there are 11 DC fast chargers province-wide, 10 of which are owned
by NB Power (NBP (NBEUB) IR-184 (c)). This year, NB Power plans to expand company-
Synapse Energy Economics, Inc. Review of New Brunswick Power’s 2018/2019 General Rate Application 64
owned chargers with 15 new NBP-owned DC Level 3 chargers along major highways
(NBP 11.02, p. 240).
• Smart Home. NB Power plans to offer a “revenue-based” Smart Home Package to customers. It
includes rental of Wi-Fi enabled gateways, thermostats, light switches, and water heater energy
monitors (NBP 11.02, 2017, p. 226 and 240). NB Power is currently reviewing the business
model to take into account feedback during the “soft” launch of the service (NBP Response to
NB EUB IR-190 (b)).
• Solar. A 2017 study by Dunsky Energy Consulting finds that NB Power has a large technical
potential for full distributed solar deployment—in the range of 1.6 to 5 GW (NBP 1.41, Baseline
and Solar Lease Study). This represents up to 80 percent of demand. Natural uptake of solar
without NB Power programs is projected to result in 250 MW of installed capacity by 2040. The
Dunsky report recommends that NB Power invest in solar development via a solar lease
program to offset losses in sales (NBP 1.41, p. 6-7). A detailed solar business plan and associated
project plans are under development (NBP Response to NB EUB IR-191 (a)).
In 2018 and 2019, NB Power will expand on the EV charger and smart homes initiatives, as well as on
demand response initiatives (discussed in Section 6.2 of this report). In this period, it will also pursue
new business areas, including deployments of solar and storage technologies and launch of a “safety-
related and resiliency” product (NBP 11.02, p. 260).
The Company plans to develop its marketing and sales capabilities to further enable product
deployment, integration, and support. In the evidence, NB Power describes its process for new
product/service development and launch as involving “a progressive investment of time, effort and
financial resources tested at stage gates.” NB Power states that the governance mechanism associated
with the process “allows investments to be curtailed as the product or service viability is considered
throughout the progression” and “minimizes risk and strives for a balanced portfolio of, marketable and
profitable, products and services over many customer segments or rate classes” (NBP 11.02, p. 256-
259).
8.2. Discussion
The initiatives contained in Smart Solutions represent an innovative approach to reducing system costs
and augmenting revenues in the face of declining sales. However, there are two important issues for the
Board to be aware of: the potential for undermining the development of competitive markets and the
potential risks of the various initiatives.
Competitive markets
Several of the Smart Solutions initiatives seek to provide services and products that could be provided
by the unregulated competitors. NB Power has monopoly status in electricity distribution, and this
status likely affords NB Power advantages in related markets as well. NB Power may have the ability to
prevent other suppliers from entering these markets, e.g. by temporarily understating prices, by

Synapse Energy Economics, Inc. Review of New Brunswick Power’s 2018/2019 General Rate Application 65
creating obstacles for competitive providers, or by using regulated activities to subsidize unregulated
initiatives.
In its evidence, NB Power did not present arguments for why it should be permitted to offer these
services and products, instead of competitive providers. Further, NB Power did not provide analyses of
the impacts that NB Power’s presence has or will have on the development of these markets (See, for
example, NBP (NBEUB) EUB IR-190 (c)).
It may be appropriate for a monopoly firm or government agency to offer certain products and services
that are or could be provided by a competitive market. The market has thus far had difficulty supplying
some types of goods and services such as EVs and charging stations. Developing EV charging stations
requires considerable up-front investment. A single publicly accessible EV charging station—which might
easily be supplied by any number of third-party suppliers—would likely do little to encourage consumers
to adopt EVs. On the other hand, a network of chargers, which would be more difficult for the market to
develop, can better support widespread EV adoption. Yet even with these barriers, market entry does
occur and should be encouraged. For example, NB Power expects that other entities will provide EV
charging services as the number of EVs grows in New Brunswick. NB Power is even aware of third parties
with plans to develop chargers in the province (NBP (NBEUB) IR-184 (c)). NB Power should be working
with these third parties to identify the optimal locations for these chargers and to help make the
business case for third-party chargers viable.
As another example, based on NB Power’s discussions with solar installers and customers, NB Power
reports that its entry into the emerging solar market may stimulate growth of this industry in the
province (NBP (NBEUB) IR-191). Nonetheless, the justification for NB Power to directly provide services
and products is generally not clear and has not been articulated in NB Power’s evidence. Utilities can
have a variety of roles in addressing market gaps, from facilitating third-party efforts to directly
providing services or products. While there are market barriers for solar, programs that support the
market have been highly effective in other jurisdictions, such as incentives to reduce up-front costs.
Likewise, the market for home automation services is growing on a wider geographic scale, if not locally,
with likely competition from online retailers. If suppliers are present in these markets, the justification
for NB Power to enter these lines of business is less compelling.
Potential Risks
NB Power’s evidence in this case does not demonstrate that the Company has fully accounted for the
risks associated with these initiatives. For example:
• EV chargers. NB Power is generally aware of the impacts that EVs and EV charging have on the
power system, including increases in electricity demand, operational risk, and the opportunity
for energy storage in vehicle batteries. NB Power asserts that “environmental and economic
forces are pushing increased adoption in other jurisdictions and the continued electrification of
vehicles is inevitable – only the timing of the shift is uncertain” but admits that “New Brunswick-
specific research [on adoption of electric vehicles] is not currently available” (NBP 11.02, p. 210).
It is not clear that NB Power has investigated the local barriers to EV adoption, which may differ
from the barriers experienced elsewhere. Such research could reveal how the barriers would

Synapse Energy Economics, Inc. Review of New Brunswick Power’s 2018/2019 General Rate Application 66
best be addressed. Further, it is not clear how the cost-effectiveness of this effort can be
determined without a baseline from which to measure increased EV adoption. Also absent from
NB Power’s evidence and responses is a comprehensive assessment of risks associated with the
current or expanded EV charger program. Such risks may include underutilization of the
chargers or investing in a standard that ultimately does not become the industry norm.
• My Smart Home. In the response to NB EUB IR-190, NB Power provides a high-level market plan
for My Smart Home (NBP Response to NB EUB IR-190 (a) Attachment). While the confidential
outlook for the program shows projected financial performance, no in-depth or quantitative
analysis of risk exposure (e.g., counterparty risk, technology risk, etc.) has been presented (NBP
(NBEUB) IR-190 (b)).
• Solar initiative. A Dunsky Energy Consulting study conducted for NB Power considered revenue
impacts associated with different types of solar leases relative to a baseline (NBP 1.41, Baseline
and Solar Lease Study). But the study did not consider risks associated with this business
opportunity. A business plan should consider the potential and likelihood that negative
outcomes associated with new business opportunities could overwhelm positive ones and
ultimately place funds at risk, e.g. due to participant default on leases. NB Power stated that it
does not yet have a business plan for solar (NBP (NBEUB) IR-191 (a)). The results of the
confidential market analysis provided by NB Power raise questions about consumer interest in
solar (NBP (NBEUB) IR-191 (a) and (c)).
If the Company expects to use these initiatives to generate revenues, it is important that it account for
and minimize risks associated with greater costs, lower benefits, lower participation than expected, or
greater competition than expected.
8.3. Recommendations
In general, the Smart Solutions initiatives appear to be reasonable and consistent with industry
practices, regulatory objectives, and the Company’s long-term goals. Therefore, we recommend that the
Board approve these initiatives. However, given the magnitude and the important role of these
initiatives, we recommend that the Board monitor them closely over time and provide guidance on their
implementation.
We recommend that the Board direct the Company to provide more details on each of its Smart
Solutions initiatives in future rate cases. First, the Company should provide on-going assessments of the
competitiveness of each of the unregulated markets that it participates in. This should include studies
on current market conditions, technological and other barriers to entry, customer demand, the number
of competitors, and market potential for the product. This should also include analysis of the impacts
that NB Power’s presence will have on the development of the competitive markets, and a plan for
interacting with and supporting competitive, third-party market participants.
Second, we recommend that the Board direct NB Power to provide in future rate cases more detailed
business cases for each of the Smart Solutions initiatives. These business cases should include forecasts
of costs, benefits, customer participation, and revenues; and should analyze and describe the major risks

Synapse Energy Economics, Inc. Review of New Brunswick Power’s 2018/2019 General Rate Application 67
associated with each initiative (including, at a minimum, technology, counterparty, and price volatility
risks).

Synapse Energy Economics, Inc. Review of New Brunswick Power’s 2018/2019 General Rate Application 68
9. PERFORMANCE METRICS AND REPORTS
9.1. The Role of Performance Metrics and Reports
Reducing costs and improving productivity are critical steps that NB Power must take to meet its goal of
20 percent equity while maintaining low rates. However, the current regulatory framework provides NB
Power with little financial incentive to improve performance.
As discussed in Chapter 2, costs related to OM&A and depreciation and amortization are responsible for
almost all of the increases in revenue requirements in the instant proceeding. Further, NB Power has a
history of exceeding its budgeted or approved costs. These facts point to the need for greater cost
containment measures, as well as the need to embrace all opportunities to reduce future revenue
requirements through optimizing the resource mix.
In a competitive market, firms compete to provide high-quality products and services at prices lower
than their competitors. This competition serves as a strong incentive for a firm to operate as efficiently
as possible. Because utilities are monopolies, competition is largely absent and regulators are charged
with ensuring that utility rates are just and reasonable. Regulators have therefore sought to simulate the
incentives provided by the competitive market through other tools such as multi-year rate plans,
financial incentives, benchmarking, and transparency.
In the case of investor-owned utilities, regulators often implement positive or negative shareholder
incentives to encourage the utility to operate as efficiently as possible. This option is not available for
publicly owned utilities. Instead, regulators may rely on performance metrics to provide greater
transparency of utility operations and encourage the utility to improve efficiency and achieve policy
goals.
The purpose of utility performance metrics is to provide the utility, the regulator, and interested parties
a means of measuring in a transparent manner how a utility is performing in key areas that are critical to
a well-functioning utility. Publicly available metrics can leverage regulatory and political pressure as an
effective means of influencing utility management. This ensures that utility management is faced with
the possibility of paying a political cost (or reaping a political reward) for changes in its performance.
Establishing performance metrics has the following effects:
• They provide a useful tool so that regulators can monitor a utility’s performance and identify where progress is or is not being made.
• They help to make regulatory goals explicit and allow regulators to provide specific guidance on important state and regulatory policy goals.
• They allow regulators to focus attention in specific areas where historical performance has been unsatisfactory.
• Where utilities are subject to economic and regulatory cost-cutting pressures, they can encourage utilities to maintain, or even improve, customer service, customer satisfaction, and other relevant performance areas.

Synapse Energy Economics, Inc. Review of New Brunswick Power’s 2018/2019 General Rate Application 69
• They allow regulators to give more attention to whether the desired outcomes are achieved, and spend less time evaluating the specific means to obtain those outcomes.
• They can help provide greater regulatory guidance to address new and emerging issues, such as grid modernization.
These same concepts can be applied in New Brunswick to ensure that NB Power has adequate cost
containment incentives and delivers on the myriad initiatives that it proposes to undertake. While NB
Power currently maintains a variety of performance metrics, the current metrics are relatively limited in
how they are used to inform regulatory decisions. Therefore, we recommend building upon these
metrics to help make NB Power’s operations, productivity, and performance more transparent to the
Board. This will help the Board encourage cost reductions while maintaining service quality.
9.2. Existing Performance Metrics and Reports
The Company’s original evidence filed in this docket provides little information on existing performance
metrics and how they are used. Based on information provided in subsequent discovery responses, it
appears that NB Power has a host of existing performance metrics, apparently presented and used in
several different forums. We summarize these below.
Key Performance Indicators
In Appendix AT, NB Power provides a summary of some of its key performance indicators (KPIs) as they
pertain to its goals, objectives, and strategic initiatives (NBP 1.98, Appendix AT). These are summarized
in Table 15. Appendix AT is not clear whether these are the only KPIs used by the Company.
In addition, NB Power prepares Executive Monthly Management reports that includes another set of
KPIs (NBP (NBEUB) IR-246 (b)). These reports include the same strategic excellence areas as presented in
Appendix AT (safety, customer, organizational, reliability, environmental). However, the KPIs presented
in the Executive Monthly Management reports do not completely align with those in Appendix AT: some
are included while some are missing. The Executive Monthly Management report is not clear on
whether these are the only KPIs used by the Company. The Company notes that its performance
measures and targets are reviewed annually as part of NB Power’s Business Planning process, which
would explain any differences between the KPIs presented in Appendix AT and in the Monthly
Management reports (NBP (NBEUB) IR-246 (b)).
In addition, NB Power has prepared a corporate excellence plan that describes some of its KPIs. The
most recent corporate excellence plan that we were able to find is the NB Power 2017/2018 Corporate
Excellence Plan (CEP), which was filed as part of the Company’s previous rate case (NBEUB IR-127, in
matter 336 NB Power 2017/18 General Rate Application). The 2017/2018 CEP included the same
strategic excellence areas as presented in Appendix AT (safety, customer, organizational, reliability,
environmental). The KPIs in the 2017/2018 CEP do not completely align with those in Appendix AT: some
are included while some are missing.

Synapse Energy Economics, Inc. Review of New Brunswick Power’s 2018/2019 General Rate Application 70
Table 15. NB Power key performance indicators
Strategic Excellence Areas Key Performance Indicator
Safety Excellence Days between high potentials
All injury frequency rate
Lost time injury severity rate
Public/contractor contact with facilities
Customer Excellence Customer uptake in Energy Solutions
Customer satisfaction index
Organizational Excellence Free cash flow
Capital spending
OM&A
Net earnings
Continuous improvement savings
Reliability Excellence SAIDI
SAIFI
Hydro equivalent availability
Belledune equivalent availability
Nuclear equipment reliability index
Nuclear capacity factor
Capital expenditures
Outage preparation readiness
Environmental Excellence In-province energy reduction
Annual peak hour demand reduction
Reduction in internal energy use
In addition, the Energy Smart section of the original filing describes the top five KPIs of Energy Smart NB
(NBP 11.02, pp. 241-241). These include: in-province energy reduction; annual peak hour reduction;
product and service net income; conservation voltage reduction; and meter-to-cash operational savings.
Additional information on these top five AMI KPIs is provided in NBP (PI) IR-47 and NBP (PI) IR-48 (c).
Benchmarking Reports
Since 2011, NB Power has benchmarked its performance against peer utilities in North America across
seven categories of metrics, including reliability, costs, safety, customer satisfaction, and environmental
performance. 23 These categories and the associated metrics are shown in Table 16 below, as described
in NB Power’s 2016 Benchmarking Report. NB Power provides these metrics in a report that summarizes
the utility’s performance over time compared to peer utilities.
23 Customer satisfaction was not part of the original reports, but was introduced in 2014.
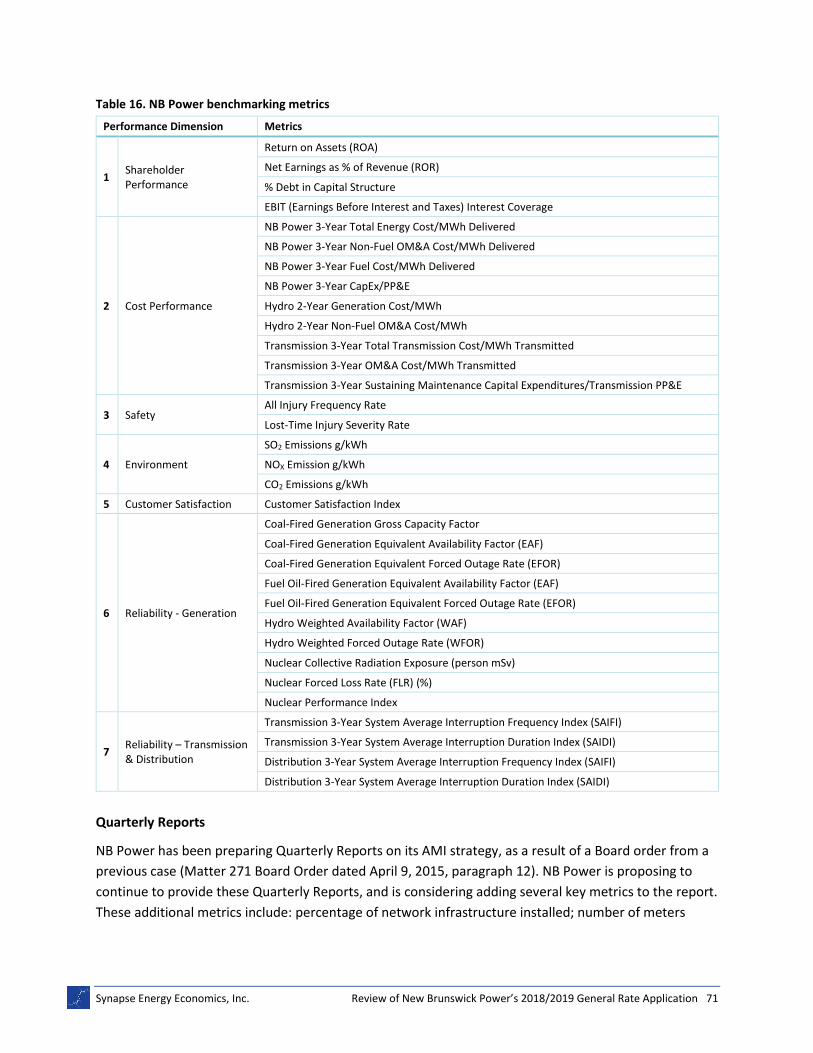
Synapse Energy Economics, Inc. Review of New Brunswick Power’s 2018/2019 General Rate Application 71
Table 16. NB Power benchmarking metrics
Performance Dimension Metrics
1 Shareholder Performance
Return on Assets (ROA)
Net Earnings as % of Revenue (ROR)
% Debt in Capital Structure
EBIT (Earnings Before Interest and Taxes) Interest Coverage
2 Cost Performance
NB Power 3-Year Total Energy Cost/MWh Delivered
NB Power 3-Year Non-Fuel OM&A Cost/MWh Delivered
NB Power 3-Year Fuel Cost/MWh Delivered
NB Power 3-Year CapEx/PP&E
Hydro 2-Year Generation Cost/MWh
Hydro 2-Year Non-Fuel OM&A Cost/MWh
Transmission 3-Year Total Transmission Cost/MWh Transmitted
Transmission 3-Year OM&A Cost/MWh Transmitted
Transmission 3-Year Sustaining Maintenance Capital Expenditures/Transmission PP&E
3 Safety All Injury Frequency Rate
Lost-Time Injury Severity Rate
4 Environment
SO2 Emissions g/kWh
NOX Emission g/kWh
CO2 Emissions g/kWh
5 Customer Satisfaction Customer Satisfaction Index
6 Reliability - Generation
Coal-Fired Generation Gross Capacity Factor
Coal-Fired Generation Equivalent Availability Factor (EAF)
Coal-Fired Generation Equivalent Forced Outage Rate (EFOR)
Fuel Oil-Fired Generation Equivalent Availability Factor (EAF)
Fuel Oil-Fired Generation Equivalent Forced Outage Rate (EFOR)
Hydro Weighted Availability Factor (WAF)
Hydro Weighted Forced Outage Rate (WFOR)
Nuclear Collective Radiation Exposure (person mSv)
Nuclear Forced Loss Rate (FLR) (%)
Nuclear Performance Index
7 Reliability – Transmission & Distribution
Transmission 3-Year System Average Interruption Frequency Index (SAIFI)
Transmission 3-Year System Average Interruption Duration Index (SAIDI)
Distribution 3-Year System Average Interruption Frequency Index (SAIFI)
Distribution 3-Year System Average Interruption Duration Index (SAIDI)
Quarterly Reports
NB Power has been preparing Quarterly Reports on its AMI strategy, as a result of a Board order from a
previous case (Matter 271 Board Order dated April 9, 2015, paragraph 12). NB Power is proposing to
continue to provide these Quarterly Reports, and is considering adding several key metrics to the report.
These additional metrics include: percentage of network infrastructure installed; number of meters

Synapse Energy Economics, Inc. Review of New Brunswick Power’s 2018/2019 General Rate Application 72
installed; percentage of data successfully communicated to the head end system; and percentage of
customers billed from AMI data (NBP (PI) IR-48 (a)).
9.3. Conclusions
It is clear that NB Power has devoted considerable attention in recent years to performance metrics, in
several forums and for several purposes. This effort provides a useful foundation for determining
performance metrics that could be reported to the Board for informing rate case decisions.
In order to be useful for informing rate case decisions, utility performance metrics and reports should
ideally (a) address priority performance areas in the rate case; (b) be provided at the outset of a rate
case; (c) include timely information; (d) be accessible, reviewable, and easily understandable to all
intervenors in the rate case; (e) provide lessons learned on what caused under-performance and how to
improve future performance.
In general, the Company’s current performance metrics and reports do not meet these criteria. First, the
Company’s current performance metrics do not some include some performance information relative to
the rate case process. For example, the current KPIs do not include an indicator on rate case budgeting,
and minimizing the differences between approved costs and actual costs.
Second, the Company’s existing set of performance metrics were not provided in a comprehensive way
at the outset of this rate case. Much of the information described in the previous section was obtained
through discovery requests; the 2017/2018 CEP was obtained from the Company’s previous rate case;
and the 2016 Benchmarking report was obtained through a Google internet search.
Third, some of the information may not be very timely. The benchmarking report in particular uses data
that are two years old by the time the report is released, due to the need to collect benchmarked data
from peer utilities. The benchmarking report also presents the data as three-year rolling averages, which
obscures more recent trends that might be important in a rate case.
Fourth, the information provided by the Company in this rate case on its current performance metrics
cannot be described as accessible, reviewable, or easily understandable. It took a considerable amount
of time for us to simply describe the existing performance metrics in the previous section, and we still
have many questions regarding them. As noted in the previous section, there are many inconsistencies
in the different ways that KPIs are reported, and it is not even clear whether all of the Company’s KPIs
are included in the discussion above.
Fifth, the performance reports that we reviewed provide little to no information regarding lessons
learned on what caused under-performance or strategies being undertaken to improve future
performance.
In sum, NB Power’s current reporting is disjointed and incomplete, leaving regulators and intervenors
with insufficient information with which to assess utility performance and inform ratemaking decisions.
Below we provide recommendations for strengthening performance metrics going forward.

Synapse Energy Economics, Inc. Review of New Brunswick Power’s 2018/2019 General Rate Application 73
9.4. Recommendations
Rate Case Performance Reports
We recommend that the Board direct the Company to build off of its existing performance metrics and
reports to create a Rate Case Performance Report, which would be filed in each rate case and used to
inform the Board’s decision in that case. These modifications include addressing additional performance
areas; providing comprehensive information at the outset of a rate case; providing timely information;
reporting the results in the most effective way; and discussing lessons learned.
Additional Performance Areas
The Rate Case Performance Reports should address several additional performance areas that are not
currently reported. First and foremost, the Company should provide detailed information on its cost
containment practices. This would include tables and charts showing the major variations between the
Company’s forecasted costs and its actual costs. The variations should be presented in enough detail by
type of costs to prevent the Company from placing costs in one category to avoid over-runs in another.
The report should present cost over-runs that exceed a certain threshold amount, along with the
division and the division director responsible for the budgeting and the cost over-run. It should include
data for the five most recent years, as well as for the most recent year. The quarterly cost and over-run
data could be used to alert the Board to anticipated over-runs during the year.
The Company’s performance metrics should also be expanded to present information relevant to the
Company’s Energy Smart programs. This should include a set of metrics for the energy efficiency and
demand response programs in Smart Habits. It should include a set of metrics for AMI, if and when the
Board allows the Company to proceed with an AMI project. Performance metrics can be especially
important for innovative initiatives like AMI, because they can be used to monitor and encourage the
achievement of the proposed benefits over time. The performance metrics should also include metrics
related to the Smart Solutions programs and the development of the EV, distributed generation, and
smart home technologies. They should also include metrics related to customer and third-party support
services, such as distributed generation interconnection, third-party access, and provision of customer
data.24
Presentation of Information
The Rate Case Performance Reports should be provided as part of each rate case filing. They should
present the most important information in a way that is readily accessible and understandable. The Rate
Case Performance Reports should be designed to primarily serve the needs of the Board, but also the
needs of the NB Power Board of Directors, legislators, the Public Intervenor, customers, and other
industry stakeholders.
24 For useful examples of such performance metrics, see Synapse, 2015, Tables 12 and 13.

Synapse Energy Economics, Inc. Review of New Brunswick Power’s 2018/2019 General Rate Application 74
The report should present historical data for the past five years, as well as performance targets for at
least the next three years. Where available, the report should present a comparison of historical
performance targets versus actual outcomes.
The Rate Case Performance Reports should use consistent terminology and structures, to facilitate
understanding of how the KPIs are used by the Company and could be used by the Board. For example,
this could include consistent categorization of KPIs across the key areas of excellence (safety, customer,
organizational, reliability, and environmental).
NB Power should also provide the Rate Case Performance reports on a publicly accessible website with
the most important data presented in graphs and tables that can be downloaded for independent
analysis. The data in the website should be updated at least quarterly.
Timely Information
The Rate Case Performance Reports should include the most recent data available. Ideally, the Company
would collect all the data related to its own performance on a quarterly basis. Quarterly data can be
useful for providing guidance on performance during a year, and can also be useful at the end of the
year to see any variations in the data by quarter. If the benchmarking data for other utilities takes longer
to collect, then the peer reviews can wait until that data is made available; the reporting and
assessment of the Company’s own performance should not wait. Further, the data should not be
aggregated into rolling averages, because this can mask results for specific years, including the most
recent years.25
Lessons Learned
The Rate Case Performance Reports should provide discussion of the key lessons learned in the previous
year and strategies for improvement going forward. This should include an explanation of cost
variations, with an emphasis on significant cost over-runs. It should include a description of the
Company’s plans for addressing any over-runs, including better forecasting practices, productivity goals,
and cost-containment practices. In each rate case the Board should identify those performance areas or
cost types where the Company should provide more detailed lessons learned in the next year’s rate
case.
25 The reports can present rolling averages if the Company finds them to be of use; as long as the annual information is
provided as well.

Synapse Energy Economics, Inc. Review of New Brunswick Power’s 2018/2019 General Rate Application 75
10. REFERENCES
American Council for an Energy Efficient Economy (ACEEE). 2015. How Information and Communications
Technologies Will Change the Evaluation, Measurement, and Verification of Energy Efficiency Programs.
Prepared by E.A. Rogers, E. Carley, S. Deo, and F. Grossberg. Research Report IE1503. p. 9.
http://aceee.org/research-report/ie1503.
America’s Power Plan. 2015. Improving Performance in Publicly-Owned Utilities. Prepared by M. O’Boyle
and S. Aggarwal, Energy Innovation Policy and Technology, LLC. http://americaspowerplan.com/wp-
content/uploads/2015/12/ImprovingPerformancePubliclyOwnedUtilities.pdf.
BC Hydro. 2010. Smart Metering & Infrastructure Program Business Case.
https://www.bchydro.com/content/dam/BCHydro/customer-portal/documents/projects/smart-
metering/smi-program-business-case.pdf.
Canada Department of Environment and Climate Change. 2016. Pan-Canadian Framework on Clean
Growth and Climate Change. Ottawa. ISBN 978-0-660-07023-0.
http://publications.gc.ca/collections/collection_2017/eccc/En4-294-2016-eng.pdf.
---------. 2017. Pan-Canadian Framework on Clean Growth and Climate Change First Annual Report.
Ottawa. https://www.canada.ca/en/services/environment/weather/climatechange/pan-canadian-
framework/first-annual-report.html.
Energy Futures Group, Cx Associates, and Wirtshafter Associates. 2016. “Review of Efficiency Maine
Trust’s 2017 - 2019 Third Triennial Plan.”
Environment and Local Government. 2017. Climate Change Legislation Introduced, December 17.
Faruqui, A. and S. Sergici. 2013. “Arcturus: International Evidence on Dynamic Pricing.” The Electricity
Journal, 26(7): 55-65. https://doi.org/10.1016/j.tej.2013.07.007.
Lawrence Berkley National Laboratory (LBNL). 2016. Performance-Based Regulation in a High Distributed
Energy Resources Future. Prepared by Pacific Economics Group Research and Synapse Energy
Economics. https://emp.lbl.gov/sites/all/files/lbnl-1004130.pdf.
Massachusetts Program Administrators and EEAC Consultants. 2017. 2016-2018 Strategic Evaluation
Plan Update. http://ma-eeac.org/wordpress/wp-content/uploads/2016-2018-Strategic-Evaluation-Plan-
Update.pdf
National Efficiency Screening Project (NESP). 2017. National Standard Practice Manual - for Assessing
Cost-Effectiveness of Energy Efficiency Resources. https://nationalefficiencyscreening.org/wp-
content/uploads/2017/05/NSPM_May-2017_final.pdf.
New Brunswick Electricity Act, RSNB 2013, c.7.
New York Public Service Commission (NY PSC). 2016. Order Approving Advanced Metering Infrastructure
Business Plan Subject to Conditions. Cases 15-E-0050, 13-E-0030, 13-G-0031.
http://documents.dps.ny.gov/public/MatterManagement/CaseMaster.aspx?MatterCaseNo=15-e-0050.
Synapse Energy Economics, Inc. Review of New Brunswick Power’s 2018/2019 General Rate Application 76
Ohio Public Utilities Commission (OH PUC). 2013. Application of Ohio Power Company to Initiate Phase 2
of its gridSMART Project and to Establish the gridSMART Phase 2 Rider. Case No. 13-1939-EL-RDR. AEP
Application. https://dis.puc.state.oh.us/TiffToPDf/A1001001A13I13B70029D86441.pdf.
Regulatory Assistance Project (RAP). 2013. Best Practices in Electric Utility Integrated Resource Planning Examples of State Regulations and Recent Utility Plans. Prepared by Synapse Energy Economics. http://www.raponline.org/wp-content/uploads/2016/05/rapsynapse-wilsonbiewald-bestpracticesinirp-2013-jun-21.pdf.
State and Local Energy Efficiency Action Network (SEE Action). 2012. Energy Efficiency Program Impact
Evaluation Guide. Prepared by Steven R. Schiller Consulting, Inc. www.seeaction.energy.gov.
Synapse Energy Economics, Inc (Synapse). 2012. Best Practices in Energy Efficiency Program Screening:
How to Ensure that the Value of Energy Efficiency Is Properly Accounted For.
http://www.homeperformance.org/sites/default/files/nhpc_synapse-ee-screening_final.pdf.
---------. 2014. Net Metering in Mississippi: Costs, Benefits, and Policy Considerations. Prepared for the
Public Service Commission of Mississippi. http://www.synapse-
energy.com/sites/default/files/Net%20Metering%20in%20Mississippi.pdf.
---------. 2015. Utility Performance Incentive Mechanisms: A Handbook for Regulators, M. Whited, T.
Woolf, and A. Napoleon, prepared for the Western Interstate Energy Board. http://www.synapse-
energy.com/sites/default/files/Utility%20Performance%20Incentive%20Mechanisms%2014-098_0.pdf.
---------. 2016. Evaluation, Measurement, and Verification in Virginia (EM&V). Memorandum regarding
Virginia State Corporation Commission Case PUE-2016-00022, prepared for Clean Energy Solutions.
http://www.synapse-energy.com/sites/default/files/VA-EMV-Memo-15-057.pdf.
---------. 2016. Starting Energy Efficiency Off on the Right Foot: Regulatory Policies to Support Successful
Program Planning and Design (EE IRAC). Prepared for Island Regulatory & Appeals Commission, Prince
Edward Island. http://www.irac.pe.ca/infocentre/documents/UE21406-Synapse-PEI-DSM-Report-
Final_2016.05.03.pdf.
U.S. Department of Energy (US DOE). 2017. State Performance-Based Regulation Using Multi-Year Rate
Plans for US Electric Utilities. Prepared by Lowry and Makos for the US DOE Grid Modernization
Laboratory Consortium.
https://emp.lbl.gov/sites/default/files/multiyear_rate_plan_gmlc_1.4.29_final_report071217.pdf.

Attachment 1
Synapse Energy Economics, Inc. Review of New Brunswick Power’s 2018/2019 General Rate Application 77
STATE OF RHODE ISLAND AND PROVIDENCE
PLANTATIONS PUBLIC UTILITIES COMMISSION
LEAST COST PROCUREMENT
STANDARDS JULY 28, 2017
CHAPTER 1 – Energy Efficiency Procurement
1.1. Introduction
A. Energy Efficiency (EE) Procurement, as mandated by §39-1-27.7, is intended to
complement system reliability and supply procurement as provided for in §39-1-
27.8, with the common purpose of meeting electrical and natural gas energy needs
in Rhode Island in a manner that is optimally cost-effective, reliable, prudent, and
environmentally responsible.
B. In order to adhere to the principles set forth in §39-1-27.7, and to meet Rhode
Island’s energy system needs in a least cost manner, the EE Standards set forth
guidelines for the development of least cost energy efficiency plans.
1.2. Definitions
A. Energy Efficiency
i. Energy efficiency is defined as the reduction of energy consumption or
strategic and beneficial management of the time of energy use within a
defined system. A system may be a residence; a place of business; a public
accommodation; or an energy production, delivery, and end-use
consumption network.
ii. Energy Efficiency Plans should be designed, where possible, to
complement the objectives of Rhode Island’s energy efficiency; renewable
energy; and clean energy programs, and describe their interaction with them,
including, but not limited to, the System Reliability Procurement Plan; the
Renewable Energy Standard; the Renewable Energy Growth Program; the
Net Metering Program; and the Long-Term Contracting for Renewable
Energy Standard. Energy Efficiency Plans should also be coordinated,