nuclear power in world energy future with slides nuclear power in world energy future_with...
TRANSCRIPT
05/22/08 Nuclear Power in World Energy Future_with slides.doc 1
Nuclear Power in World Energy Future_with slides.doc
Nuclear Power in the World’s Energy Futureby
Richard L. [email protected] www.fas.org/RLG/
Felice Ippolito LectureRome, Italy
May 22, 2008
Nuclear power is still a miracle of nature, science, and technology. In this talk I want toindicate where we are and where we might be in the use of nuclear power to supplyenergy to society, taking into account other sources of energy and the requirements ofsafety, economy, environmental protection, and the availability of an adequate fuelsupply. Slide 1 is the title of the Ippolito Lecture, as presented.
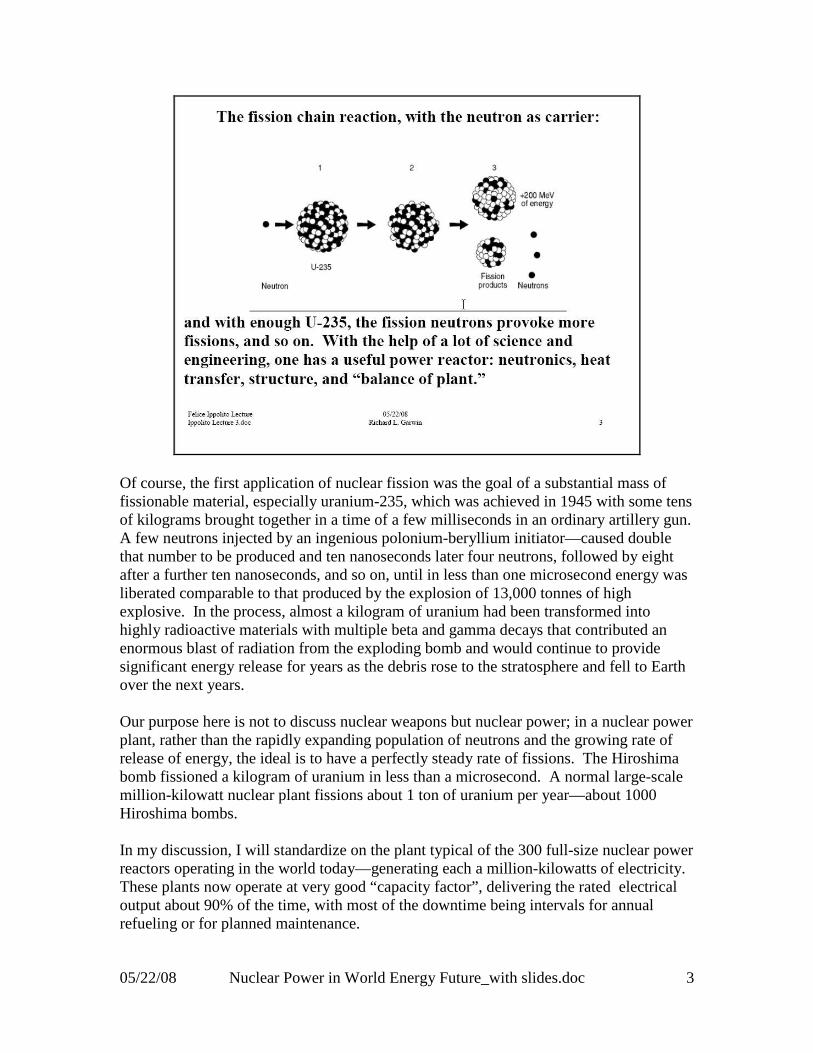
All here know that Enrico Fermi and his colleagues “I ragazzi di Via Panisperna” in 1934found a bewildering array of radioactivity when they turned to investigate uranium withtheir marvelous new tool of slow neutron capture. Not until 1938 was it realized thatthey had caused fission of uranium, breaking the heavy nucleus into two, typically oneless than and the other considerably more than half its mass, with the emission of anamount of energy enormous on the nuclear scale—some 30 times that of the ordinaryradioactive decay. Soon after the recognition of fission, in 1939, it was established thateach fission in uranium caused by the absorption of a neutron led to the emission ofseveral neutrons, and the dream of Leo Szilard of 1932 was in sight. Now it could beimagined that one could have a neutron chain reaction, which for the production of power

05/22/08 Nuclear Power in World Energy Future_with slides.doc 2
would have an almost unimaginable number of neutrons each second reproducingthemselves on the average, accompanied by the destruction of a modest mass of uraniumand the corresponding production of heat to be turned by normal engineering methodsinto electricity. Some examples of nuclear power plants in France and Japan are shownin Slide 2 and the fission reaction is pictured in Slide 3.
05/22/08 Nuclear Power in World Energy Future_with slides.doc 3
Of course, the first application of nuclear fission was the goal of a substantial mass offissionable material, especially uranium-235, which was achieved in 1945 with some tensof kilograms brought together in a time of a few milliseconds in an ordinary artillery gun.A few neutrons injected by an ingenious polonium-beryllium initiator—caused doublethat number to be produced and ten nanoseconds later four neutrons, followed by eightafter a further ten nanoseconds, and so on, until in less than one microsecond energy wasliberated comparable to that produced by the explosion of 13,000 tonnes of highexplosive. In the process, almost a kilogram of uranium had been transformed intohighly radioactive materials with multiple beta and gamma decays that contributed anenormous blast of radiation from the exploding bomb and would continue to providesignificant energy release for years as the debris rose to the stratosphere and fell to Earthover the next years.
Our purpose here is not to discuss nuclear weapons but nuclear power; in a nuclear powerplant, rather than the rapidly expanding population of neutrons and the growing rate ofrelease of energy, the ideal is to have a perfectly steady rate of fissions. The Hiroshimabomb fissioned a kilogram of uranium in less than a microsecond. A normal large-scalemillion-kilowatt nuclear plant fissions about 1 ton of uranium per year—about 1000Hiroshima bombs.
In my discussion, I will standardize on the plant typical of the 300 full-size nuclear powerreactors operating in the world today—generating each a million-kilowatts of electricity.These plants now operate at very good “capacity factor”, delivering the rated electricaloutput about 90% of the time, with most of the downtime being intervals for annualrefueling or for planned maintenance.

05/22/08 Nuclear Power in World Energy Future_with slides.doc 4
The world’s 400+ power reactors contribute now almost 16% of the energy in the world.I can’t show you a picture of a nuclear power plant in Italy to compare with those inFrance or Japan. In the United States, 103 reactors produce some 20% of the electricalpower. The plant itself is normally innocuous, but is obviously connected to powertransmission lines for delivering its valuable product and periodically must receivenuclear fuel, typically about 25 tons each year of uranium containing 4.4% U-235, incontrast with the 0.7% U-235 in natural uranium.
The usual power reactor is a very concentrated source of power, producing electricity tosustain about a million people. This can readily be seen from the numbers I provided—100+ reactors provide 20% of electrical power for a United States of 300 million people;500 reactor-equivalents would provide ALL of the power for 300 million people, so asingle reactor would empower about 0.6 million U.S. residents.
In our discussion of world energy futures, we’ll note the enormous disparity between thedeveloped world and the less developed world, even India and China. But now I want tocharacterize the reactor as a node in a system of supply of fuel, delivery of electricity, andcreation of “spent nuclear fuel.”
The 25-ton annual reload of uranium fuel to a power reactor could, conceptually, fiteasily in a single railway freight car. Similarly the spent fuel from the reactor which is 1kg lighter according to Einstein, because of the mass that has been absolutely convertednot only into electrical energy of a million kilowatts for 8000 hours, but also into the heatthat constitutes twice as much energy and is dissipated typically to cooling water in aneighboring lake or river.
Following this a bit farther, though, the 25 tons of uranium at 4.4% U-235 is derivedfrom about eight times that much (200 tons) of natural uranium, that, itself, with auranium ore concentration of 0.1%, corresponds to about 200,000 tons of ore mined inAustralia, Canada, Russia, or one of the other sources of crude uranium, an article ofcommerce known as “yellow cake”.
In contrast, a coal-fired plant requires about 3 million tons of coal to be delivered eachyear to the power plant, and results in almost 10 million tons of carbon dioxide—CO2—ejected into the atmosphere each year. It is clear that the transport of nuclear fuel is farless a burden than the transport of coal, as was evidenced by the impact of unusualsnowstorms in China on the transport of coal to fuel the electrical generating andindustrial plants of China in January 2008.
Indeed the disposition of ash from conventional coal-fired plants is also a problem,constituting as much as 10% of the 3 million-ton annual feed (at this point, we resort to amore compact notation in which a million is represented as “M” so that 3 million tons is3 MT) and the ash requires perhaps 0.3 MT of transport capacity annually.

05/22/08 Nuclear Power in World Energy Future_with slides.doc 5
No matter what is done with the ash (much of it made into concrete) it does requiretransport of enormous magnitude compared with the transport of fresh or spent nuclearfuel.
But the ash from a coal-fired plant is inert; once having cooled from the fiery temperatureof the boiler to room temperature, it is like any other material, although it may containtoxic elements to some extent. The “ash” from a nuclear plant has nothing in commonwith that. At 25 tons per year it is perhaps 10,000 times less massive or voluminous thanthe ash from a coal-fired plant, but the comparison stops there.
Fresh fuel for a normal reactor consists of thin-walled metal tubes filled with smallpellets of uranium oxide ceramic containing about 4% fissile U-235 and 96% U-238.Spent fuel, removed after 4 years in the reactor has about 4% fission products 0.9%residual U-235, 1% plutonium (about 65% fissile Pu-239 and Pu-241) and about 0.1%non-Pu transuranic elements. Pu-239 is formed by non-fission capture of neutrons on U-238. The U-235 in spent fuel would seem to be valuable, present in larger concentrationthan in natural uranium (0.7%), but in fact uranium from spent fuel sells for a lower pricethan does natural uranium, in view of the U-236 that is present, and a relatively smallamount of U-234. The major problems though with the spent nuclear fuel are in thefission products which are highly radioactive, with the longest-life dominant componentsSr-90 and Cs-137, each, coincidentally, of half-life about 30 years. The Sr-90 is a “purebeta” emitter, so requires very little shielding to be transported, but Cs-137 has an intensegamma ray and a tiny fraction of the annual production is used as an artificial source ofvery high energy “X rays” for medical diagnosis or treatment. Together with the otherfission products, these 30-year half-life elements produce heat, and as a result a fuelelement downloaded from a nuclear reactor, even after two years of ‘cooling” in a deeppool at the reactor, if lifted into the air by a hoist or crane glows red hot within minutesbecause of the heat produced by the continuing decay of the fission products. About 10%of the mass of fission products have radioactive lifetimes exceeding a million years.
Despite the self-heating from radioactive decay, the spent fuel, after two or five years ofcooling at the reactor (in the French model) can safely be transported in heavy-walledcasks for ultimate deposition in a mined underground repository, or, in the case of Franceand soon-to-be Japan, to a reprocessing plant where the uranium, plutonium, and residualcomponents of the spent fuel are separated. Being less valuable than natural uranium, therecovered uranium is often simply stored, with little radioactivity involved. Theplutonium is separated in order to be recycled into mixed-oxide fuel (MOX) in whichtypically 5% Pu is diluted with uranium left over from the enrichment process (“depleteduranium”) to form fuel elements that are essentially equivalent to the enriched uraniumelements used in reactors (sometimes called UOX).
The fission products, intensely radioactive and containing as presently practiced the“transuranics” beyond plutonium, are vitrified with an appropriate glass-forming materialand cast into stainless-steel containers, welded closed and cleaned. These are then storedwith airflow to cool them, until they can be deposited into a mined-geologicalrepository—MGR. Although this process is advertised in France and Japan as essential
05/22/08 Nuclear Power in World Energy Future_with slides.doc 6
because these nations are without fossil fuel resources or native supplies of uranium, themaximum saving of fresh uranium is 20%, and the saving is achieved at a cost equivalentto $700 or so per kg of natural uranium. Traditionally uranium has been available at acost of $30/kg, although it has spiked to $100/kg recently.
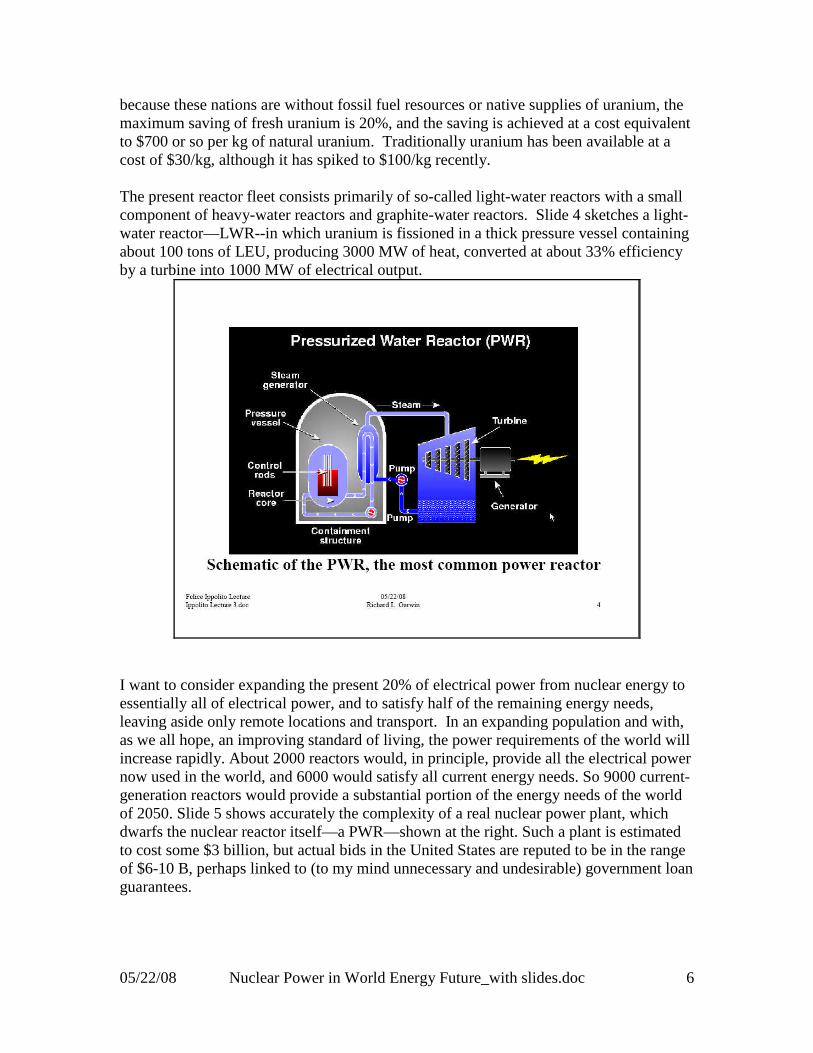
The present reactor fleet consists primarily of so-called light-water reactors with a smallcomponent of heavy-water reactors and graphite-water reactors. Slide 4 sketches a light-water reactor—LWR--in which uranium is fissioned in a thick pressure vessel containingabout 100 tons of LEU, producing 3000 MW of heat, converted at about 33% efficiencyby a turbine into 1000 MW of electrical output.
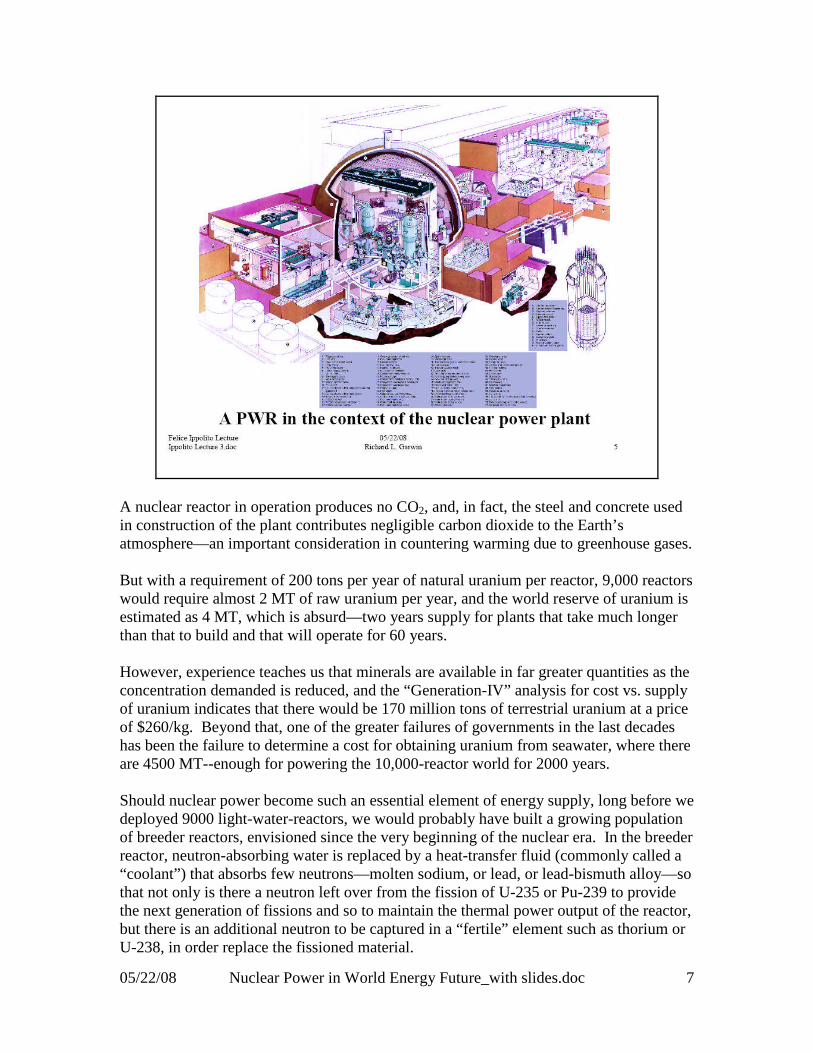
I want to consider expanding the present 20% of electrical power from nuclear energy toessentially all of electrical power, and to satisfy half of the remaining energy needs,leaving aside only remote locations and transport. In an expanding population and with,as we all hope, an improving standard of living, the power requirements of the world willincrease rapidly. About 2000 reactors would, in principle, provide all the electrical powernow used in the world, and 6000 would satisfy all current energy needs. So 9000 current-generation reactors would provide a substantial portion of the energy needs of the worldof 2050. Slide 5 shows accurately the complexity of a real nuclear power plant, whichdwarfs the nuclear reactor itself—a PWR—shown at the right. Such a plant is estimatedto cost some $3 billion, but actual bids in the United States are reputed to be in the rangeof $6-10 B, perhaps linked to (to my mind unnecessary and undesirable) government loanguarantees.
05/22/08 Nuclear Power in World Energy Future_with slides.doc 7
A nuclear reactor in operation produces no CO2, and, in fact, the steel and concrete usedin construction of the plant contributes negligible carbon dioxide to the Earth’satmosphere—an important consideration in countering warming due to greenhouse gases.
But with a requirement of 200 tons per year of natural uranium per reactor, 9,000 reactorswould require almost 2 MT of raw uranium per year, and the world reserve of uranium isestimated as 4 MT, which is absurd—two years supply for plants that take much longerthan that to build and that will operate for 60 years.
However, experience teaches us that minerals are available in far greater quantities as theconcentration demanded is reduced, and the “Generation-IV” analysis for cost vs. supplyof uranium indicates that there would be 170 million tons of terrestrial uranium at a priceof $260/kg. Beyond that, one of the greater failures of governments in the last decadeshas been the failure to determine a cost for obtaining uranium from seawater, where thereare 4500 MT--enough for powering the 10,000-reactor world for 2000 years.
Should nuclear power become such an essential element of energy supply, long before wedeployed 9000 light-water-reactors, we would probably have built a growing populationof breeder reactors, envisioned since the very beginning of the nuclear era. In the breederreactor, neutron-absorbing water is replaced by a heat-transfer fluid (commonly called a“coolant”) that absorbs few neutrons—molten sodium, or lead, or lead-bismuth alloy—sothat not only is there a neutron left over from the fission of U-235 or Pu-239 to providethe next generation of fissions and so to maintain the thermal power output of the reactor,but there is an additional neutron to be captured in a “fertile” element such as thorium orU-238, in order replace the fissioned material.
05/22/08 Nuclear Power in World Energy Future_with slides.doc 8
A plutonium-uranium breeder reactor, on balance, could be fed with natural uranium oreven depleted uranium. The plutonium from its fuel would be recycled, so that thegreater amount of plutonium from its fuel would provide the next load of fresh fuel forthe breeder, while the small amount of excess plutonium would contribute to fueling anadditional breeder reactor.
In fact, the French system was originally created with the expectation that the reprocessedplutonium would be loaded into breeder reactors. The net result, for our purposes, is thatalmost all of the raw uranium is ultimately fissioned in the breeder reactor, comparedwith about 0.5% in the light-water reactor, and even terrestrial uranium would be enoughfor many centuries of operation of a breeder economy. It is important to determine soonwhether costly seawater uranium for once-through reactors is cheaper than costly breederreactors with minimal uranium demands.
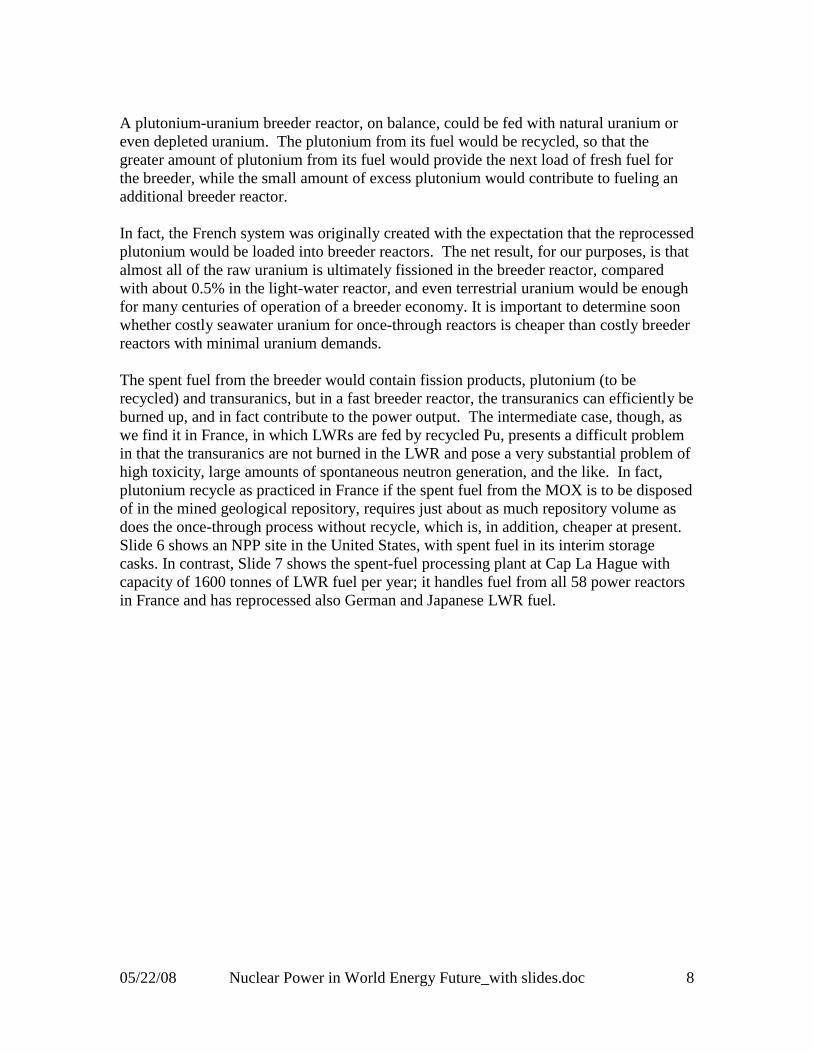
The spent fuel from the breeder would contain fission products, plutonium (to berecycled) and transuranics, but in a fast breeder reactor, the transuranics can efficiently beburned up, and in fact contribute to the power output. The intermediate case, though, aswe find it in France, in which LWRs are fed by recycled Pu, presents a difficult problemin that the transuranics are not burned in the LWR and pose a very substantial problem ofhigh toxicity, large amounts of spontaneous neutron generation, and the like. In fact,plutonium recycle as practiced in France if the spent fuel from the MOX is to be disposedof in the mined geological repository, requires just about as much repository volume asdoes the once-through process without recycle, which is, in addition, cheaper at present.Slide 6 shows an NPP site in the United States, with spent fuel in its interim storagecasks. In contrast, Slide 7 shows the spent-fuel processing plant at Cap La Hague withcapacity of 1600 tonnes of LWR fuel per year; it handles fuel from all 58 power reactorsin France and has reprocessed also German and Japanese LWR fuel.
05/22/08 Nuclear Power in World Energy Future_with slides.doc 9
Other reactor types are possible and are under development, including those in which thefuel itself is microencapsulated and the tiny spherules (about 0.5 mm diameter) arehoused in graphite spheres or blocks. Operating probably at somewhat less output powerthan the current reactors, these microencapsulated-fuel reactors promise improved safetyin that they can be passively cooled by airflow or radiation, rather than requiringemergency core cooling water.

05/22/08 Nuclear Power in World Energy Future_with slides.doc 10
Now we turn to the world energy problem and the world energy future, in which nuclearpower, in my opinion, should play a role.
Slide 8 shows the data-rich nature of the world energy problem. This indicates theestimated U.S. energy usage in 2006, totaling about 100 quadrillion BTU or about100 EJ—exajoule.
On the left are the primary energy sources for the U.S. in that year, dominated clearly byOil, Coal, Natural gas, and Nuclear. On the right is a gross categorization of UnusedEnergy and Useful Energy, although much of the Useful Energy is degraded into heat, asis the case of the Unused Energy. In the middle are aggregations of various sectors,Electricity, Residential, Industrial, Cars, Freight, and Aviation. Note that almost no oil isused in the United States to make electricity, and only oil feeds transport—cars, freight,and aviation.
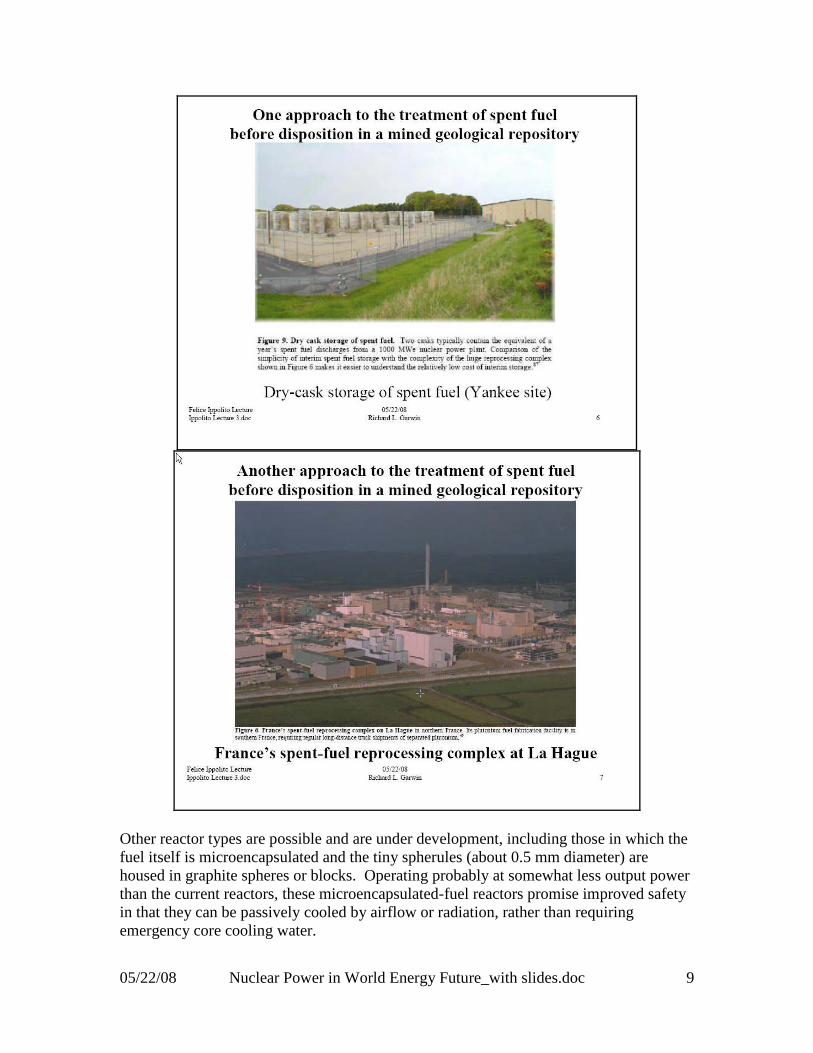
Slide 9 is much simpler, indicating the trend in U.S. energy use per capita and per dollarof gross domestic product—GDP—for a period of 50 years. Energy use per dollar isincreasingly driven by the higher cost of energy, but, as we shall see, efficient use ofenergy can sometimes be achieved with savings in investment in addition to savings inenergy cost.
05/22/08 Nuclear Power in World Energy Future_with slides.doc 11
Slide 10 broadens this to show primary energy per capita plotted against GDP per capitafor various nations, with the United States using far more energy per capita than anyother nation. The evolution over 24 years is indicated. Note the astonishing increase inGDP per capita for Ireland over the last ten years.

05/22/08 Nuclear Power in World Energy Future_with slides.doc 12
Slide 11 shows 23 years of energy demand by region, with the year redundantly coded incolor and position. Just concentrate on the line-like nature of the top of each stack. Themillion tonnes of oil equivalent is a unit equal to 0.042 EJ, and at the foot of the slide thebarrel of oil equivalent is defined as 6.12 GJ, and one million barrels per day as2.24 EJ/year.
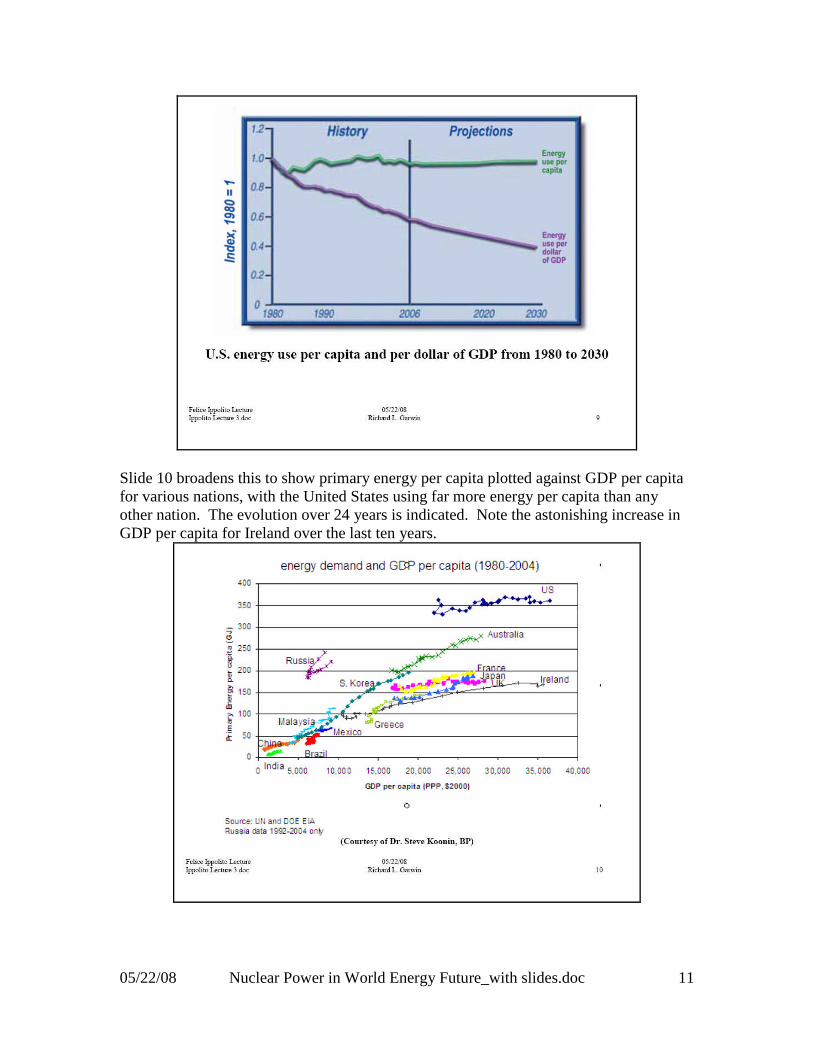
Slide 12 shows the projection of growing world energy demand by sector, and Slide 13the recent historical trend for composition of the global primary energy source.
05/22/08 Nuclear Power in World Energy Future_with slides.doc 13
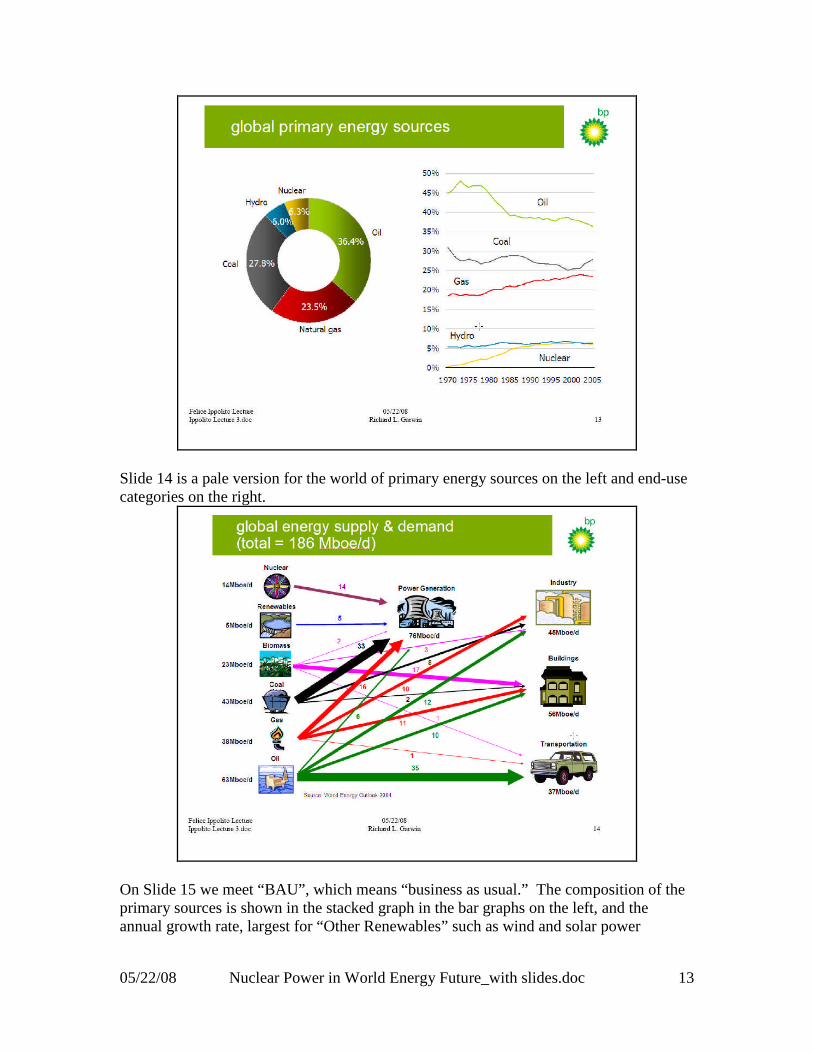
Slide 14 is a pale version for the world of primary energy sources on the left and end-usecategories on the right.
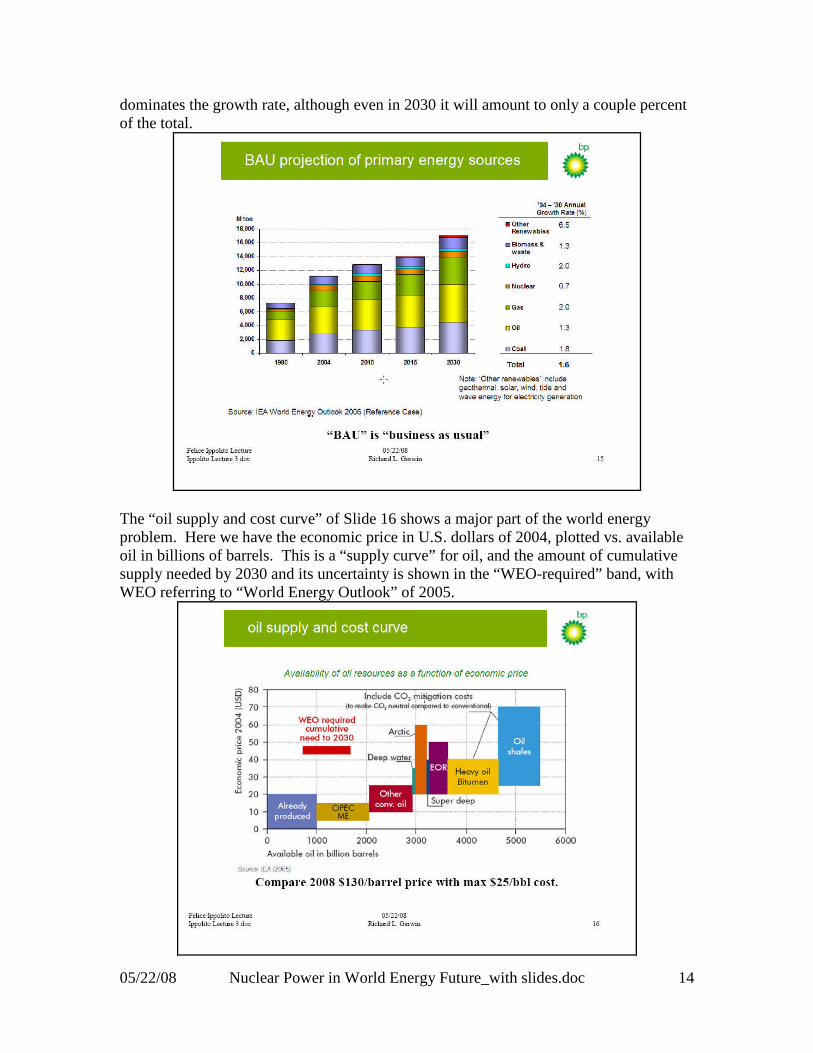
On Slide 15 we meet “BAU”, which means “business as usual.” The composition of theprimary sources is shown in the stacked graph in the bar graphs on the left, and theannual growth rate, largest for “Other Renewables” such as wind and solar power
05/22/08 Nuclear Power in World Energy Future_with slides.doc 14
dominates the growth rate, although even in 2030 it will amount to only a couple percentof the total.
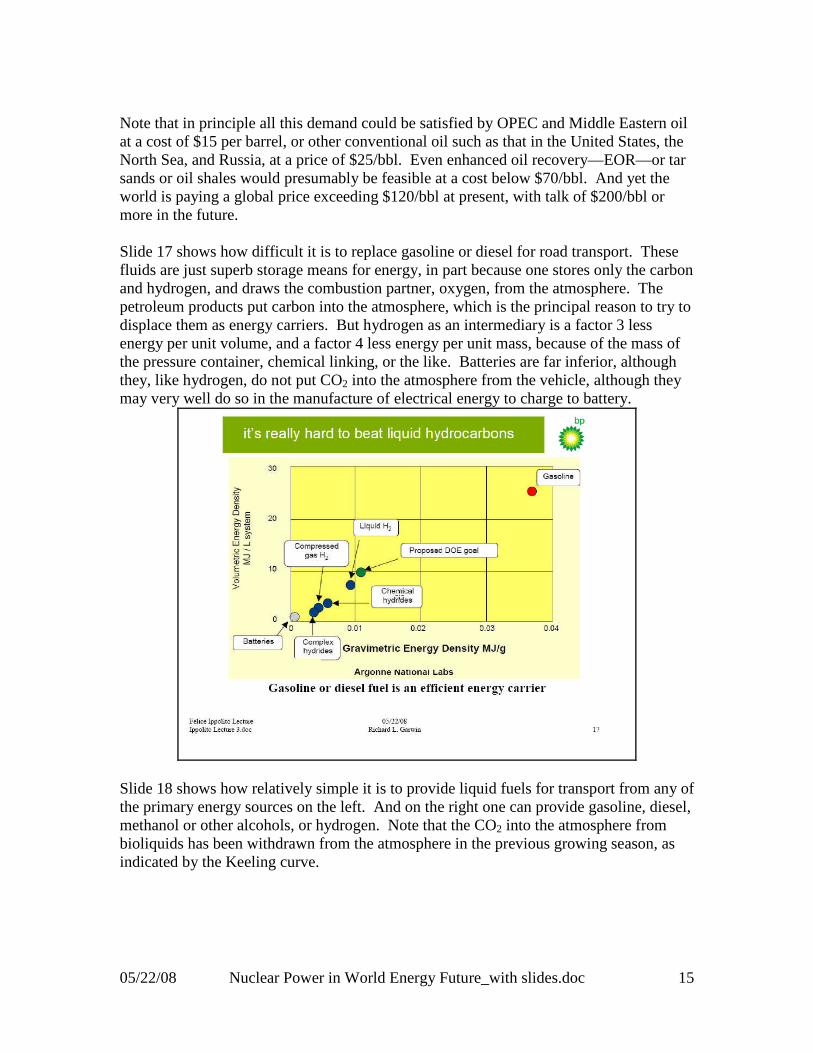
The “oil supply and cost curve” of Slide 16 shows a major part of the world energyproblem. Here we have the economic price in U.S. dollars of 2004, plotted vs. availableoil in billions of barrels. This is a “supply curve” for oil, and the amount of cumulativesupply needed by 2030 and its uncertainty is shown in the “WEO-required” band, withWEO referring to “World Energy Outlook” of 2005.
05/22/08 Nuclear Power in World Energy Future_with slides.doc 15
Note that in principle all this demand could be satisfied by OPEC and Middle Eastern oilat a cost of $15 per barrel, or other conventional oil such as that in the United States, theNorth Sea, and Russia, at a price of $25/bbl. Even enhanced oil recovery—EOR—or tarsands or oil shales would presumably be feasible at a cost below $70/bbl. And yet theworld is paying a global price exceeding $120/bbl at present, with talk of $200/bbl ormore in the future.
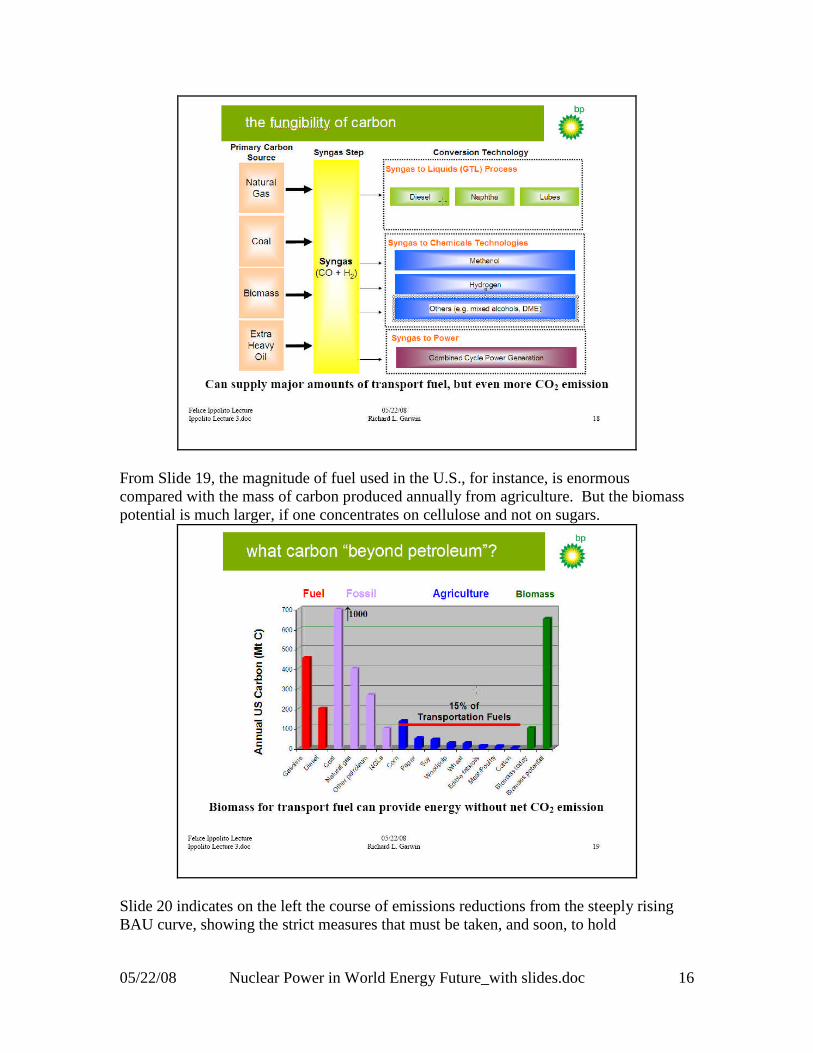
Slide 17 shows how difficult it is to replace gasoline or diesel for road transport. Thesefluids are just superb storage means for energy, in part because one stores only the carbonand hydrogen, and draws the combustion partner, oxygen, from the atmosphere. Thepetroleum products put carbon into the atmosphere, which is the principal reason to try todisplace them as energy carriers. But hydrogen as an intermediary is a factor 3 lessenergy per unit volume, and a factor 4 less energy per unit mass, because of the mass ofthe pressure container, chemical linking, or the like. Batteries are far inferior, althoughthey, like hydrogen, do not put CO2 into the atmosphere from the vehicle, although theymay very well do so in the manufacture of electrical energy to charge to battery.
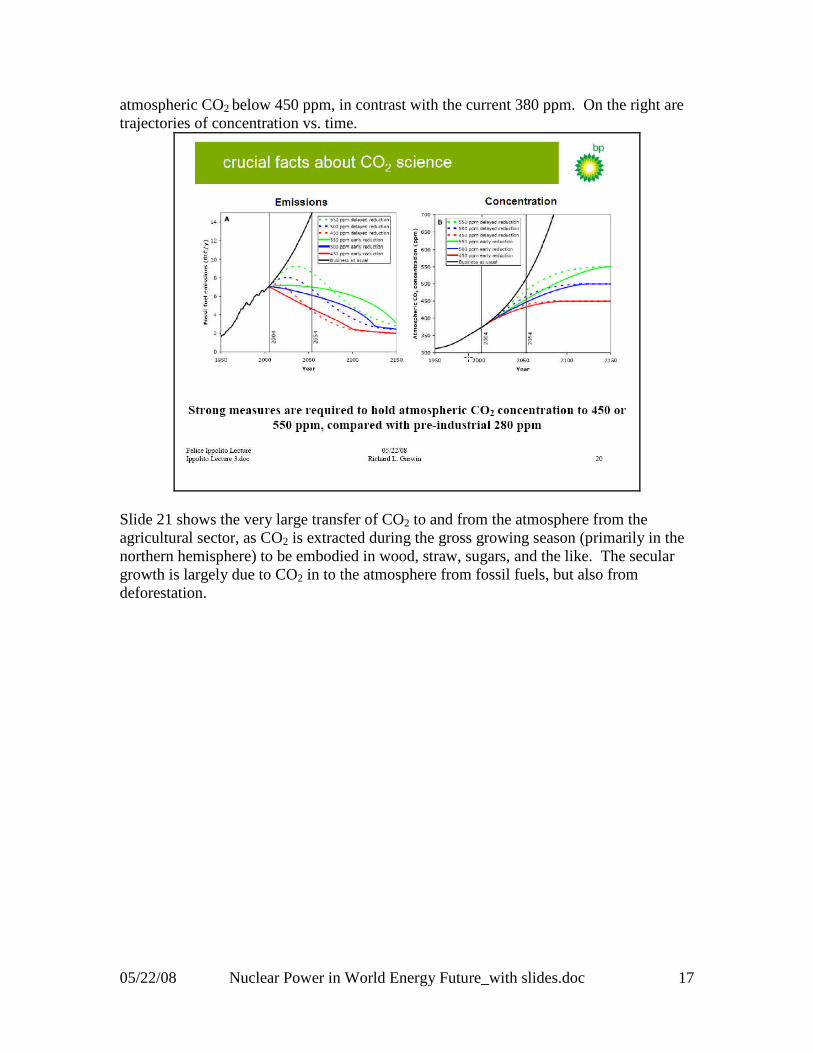
Slide 18 shows how relatively simple it is to provide liquid fuels for transport from any ofthe primary energy sources on the left. And on the right one can provide gasoline, diesel,methanol or other alcohols, or hydrogen. Note that the CO2 into the atmosphere frombioliquids has been withdrawn from the atmosphere in the previous growing season, asindicated by the Keeling curve.
05/22/08 Nuclear Power in World Energy Future_with slides.doc 16
From Slide 19, the magnitude of fuel used in the U.S., for instance, is enormouscompared with the mass of carbon produced annually from agriculture. But the biomasspotential is much larger, if one concentrates on cellulose and not on sugars.
Slide 20 indicates on the left the course of emissions reductions from the steeply risingBAU curve, showing the strict measures that must be taken, and soon, to hold
05/22/08 Nuclear Power in World Energy Future_with slides.doc 17
atmospheric CO2 below 450 ppm, in contrast with the current 380 ppm. On the right aretrajectories of concentration vs. time.
Slide 21 shows the very large transfer of CO2 to and from the atmosphere from theagricultural sector, as CO2 is extracted during the gross growing season (primarily in thenorthern hemisphere) to be embodied in wood, straw, sugars, and the like. The seculargrowth is largely due to CO2 in to the atmosphere from fossil fuels, but also fromdeforestation.

05/22/08 Nuclear Power in World Energy Future_with slides.doc 18
The “energy problem” would be severe without regard to CO2; the “CO2 problem” wouldbe severe without an energy crisis. Together they may be the largest problem the worldfaces.
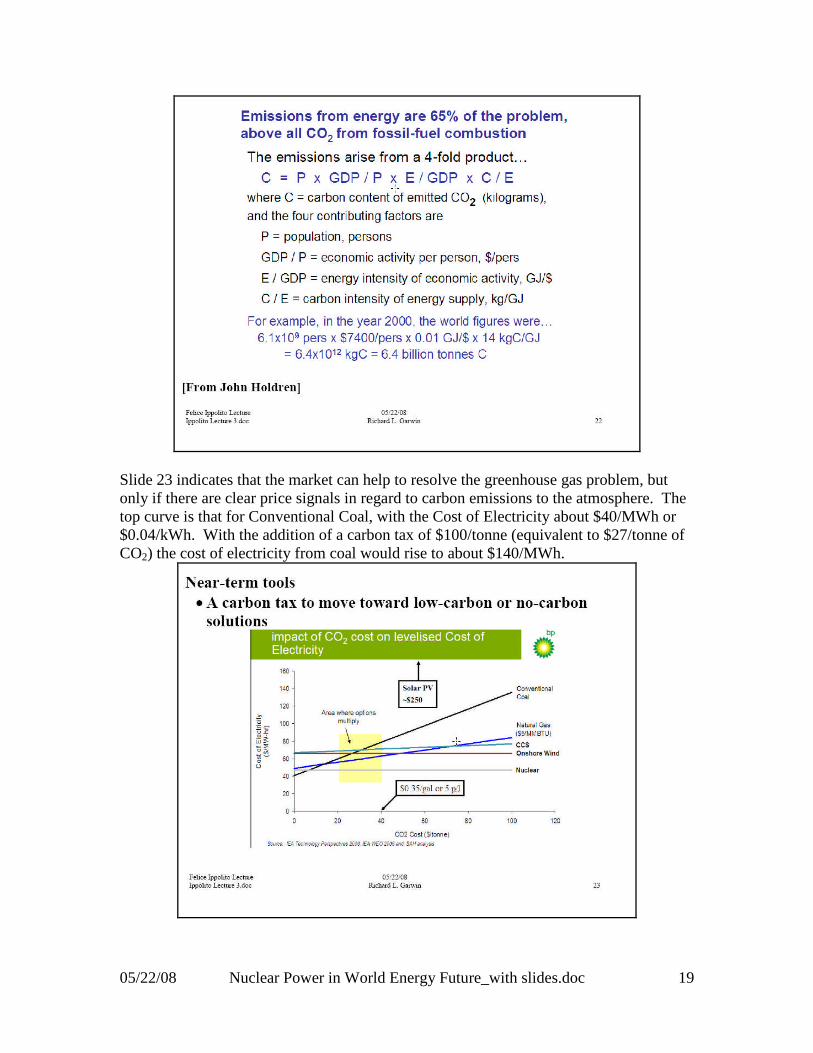
Slide 22, from John Holdren, allows one to calculate from assumptions as to population,economic activity per person, energy intensity or content of the economic activity, andthe carbon intensity of the energy supply the emissions at any future time, based onassumptions of these four factors. As an example, in the year 2000 the world figureswork out to 6.4 GT of C per year.
05/22/08 Nuclear Power in World Energy Future_with slides.doc 19
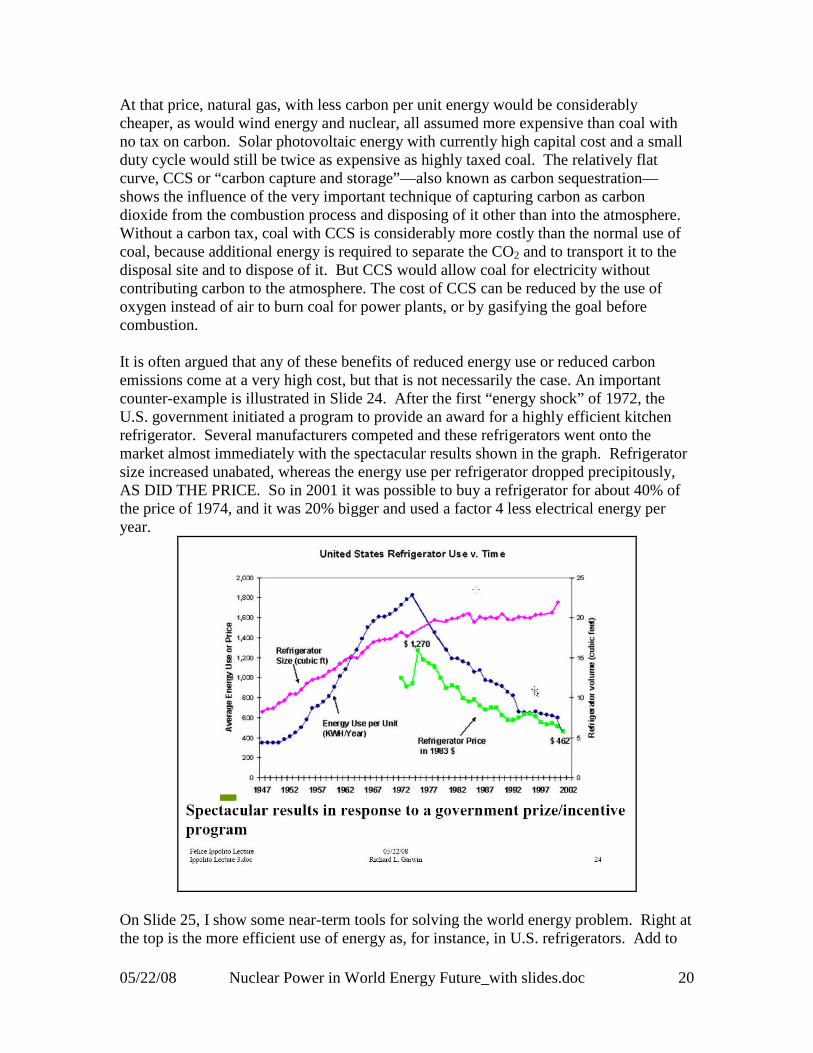
Slide 23 indicates that the market can help to resolve the greenhouse gas problem, butonly if there are clear price signals in regard to carbon emissions to the atmosphere. Thetop curve is that for Conventional Coal, with the Cost of Electricity about $40/MWh or$0.04/kWh. With the addition of a carbon tax of $100/tonne (equivalent to $27/tonne ofCO2) the cost of electricity from coal would rise to about $140/MWh.
05/22/08 Nuclear Power in World Energy Future_with slides.doc 20
At that price, natural gas, with less carbon per unit energy would be considerablycheaper, as would wind energy and nuclear, all assumed more expensive than coal withno tax on carbon. Solar photovoltaic energy with currently high capital cost and a smallduty cycle would still be twice as expensive as highly taxed coal. The relatively flatcurve, CCS or “carbon capture and storage”—also known as carbon sequestration—shows the influence of the very important technique of capturing carbon as carbondioxide from the combustion process and disposing of it other than into the atmosphere.Without a carbon tax, coal with CCS is considerably more costly than the normal use ofcoal, because additional energy is required to separate the CO2 and to transport it to thedisposal site and to dispose of it. But CCS would allow coal for electricity withoutcontributing carbon to the atmosphere. The cost of CCS can be reduced by the use ofoxygen instead of air to burn coal for power plants, or by gasifying the goal beforecombustion.
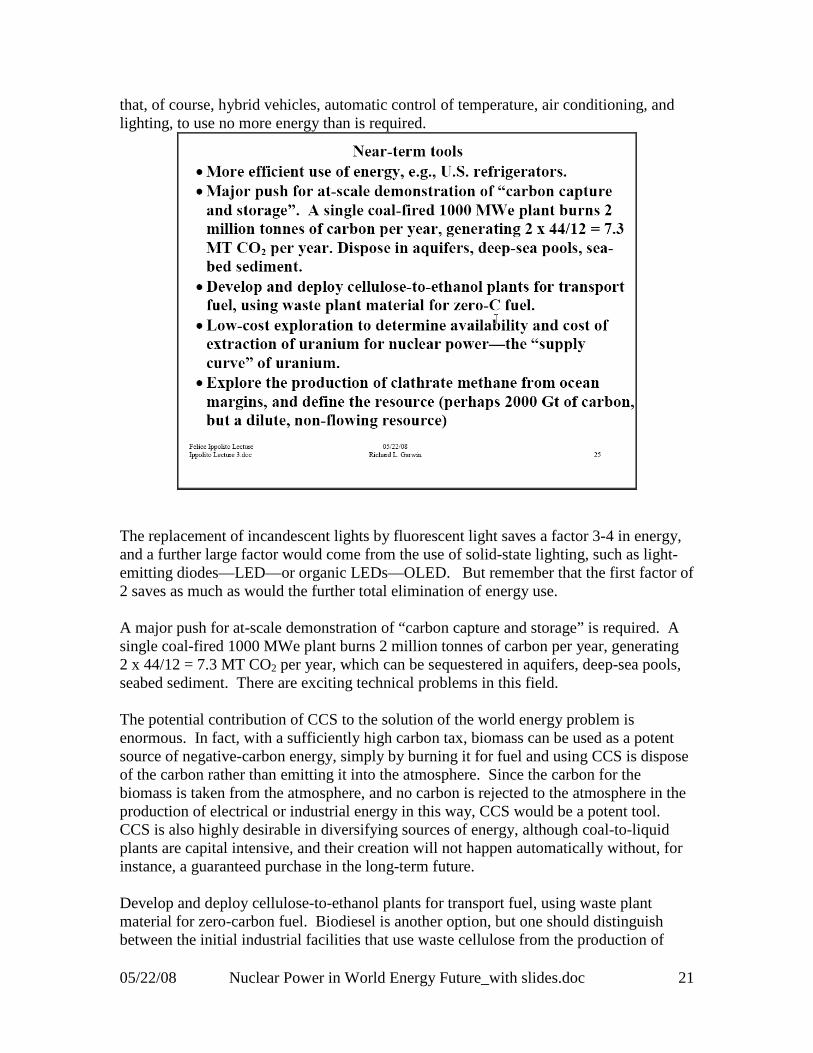
It is often argued that any of these benefits of reduced energy use or reduced carbonemissions come at a very high cost, but that is not necessarily the case. An importantcounter-example is illustrated in Slide 24. After the first “energy shock” of 1972, theU.S. government initiated a program to provide an award for a highly efficient kitchenrefrigerator. Several manufacturers competed and these refrigerators went onto themarket almost immediately with the spectacular results shown in the graph. Refrigeratorsize increased unabated, whereas the energy use per refrigerator dropped precipitously,AS DID THE PRICE. So in 2001 it was possible to buy a refrigerator for about 40% ofthe price of 1974, and it was 20% bigger and used a factor 4 less electrical energy peryear.
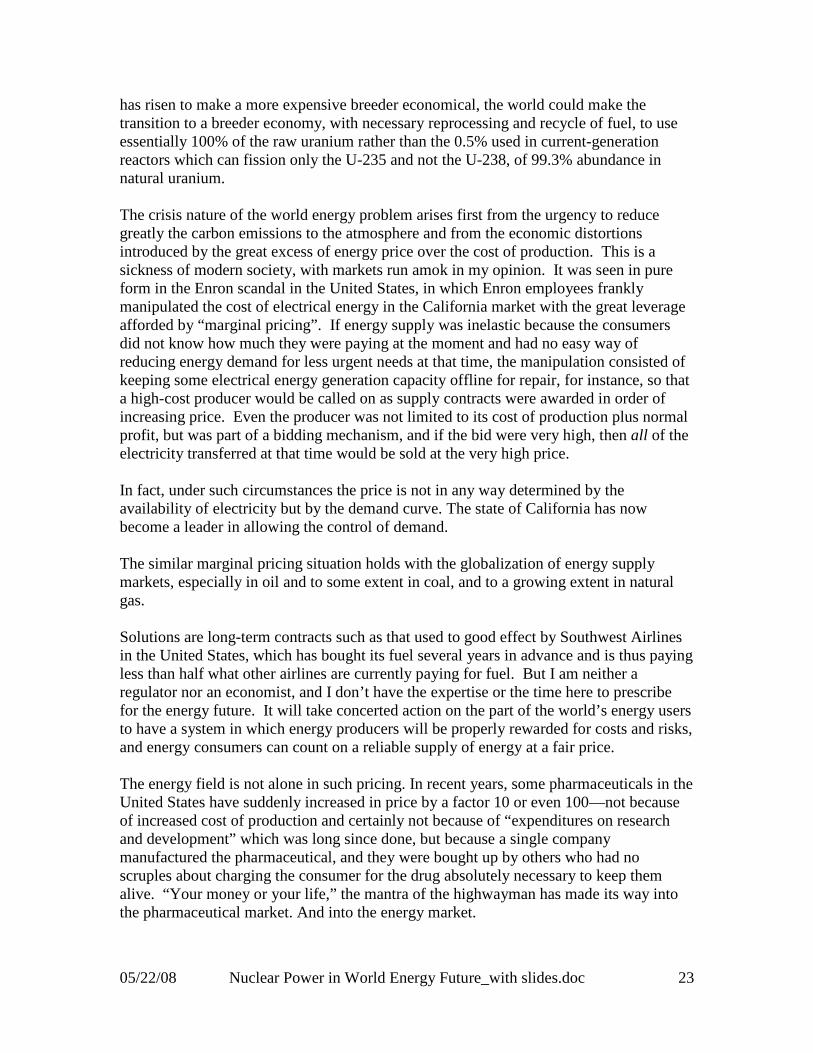
On Slide 25, I show some near-term tools for solving the world energy problem. Right atthe top is the more efficient use of energy as, for instance, in U.S. refrigerators. Add to
05/22/08 Nuclear Power in World Energy Future_with slides.doc 21
that, of course, hybrid vehicles, automatic control of temperature, air conditioning, andlighting, to use no more energy than is required.
The replacement of incandescent lights by fluorescent light saves a factor 3-4 in energy,and a further large factor would come from the use of solid-state lighting, such as light-emitting diodes—LED—or organic LEDs—OLED. But remember that the first factor of2 saves as much as would the further total elimination of energy use.
A major push for at-scale demonstration of “carbon capture and storage” is required. Asingle coal-fired 1000 MWe plant burns 2 million tonnes of carbon per year, generating2 x 44/12 = 7.3 MT CO2 per year, which can be sequestered in aquifers, deep-sea pools,seabed sediment. There are exciting technical problems in this field.
The potential contribution of CCS to the solution of the world energy problem isenormous. In fact, with a sufficiently high carbon tax, biomass can be used as a potentsource of negative-carbon energy, simply by burning it for fuel and using CCS is disposeof the carbon rather than emitting it into the atmosphere. Since the carbon for thebiomass is taken from the atmosphere, and no carbon is rejected to the atmosphere in theproduction of electrical or industrial energy in this way, CCS would be a potent tool.CCS is also highly desirable in diversifying sources of energy, although coal-to-liquidplants are capital intensive, and their creation will not happen automatically without, forinstance, a guaranteed purchase in the long-term future.
Develop and deploy cellulose-to-ethanol plants for transport fuel, using waste plantmaterial for zero-carbon fuel. Biodiesel is another option, but one should distinguishbetween the initial industrial facilities that use waste cellulose from the production of

05/22/08 Nuclear Power in World Energy Future_with slides.doc 22
food and fiber, and the growth of energy crops such as miscanthus grass, which wouldthen compete with agriculture for arable land.
Low-cost exploration is long overdue to determine availability and cost of extraction ofuranium for nuclear power—the “supply curve” of uranium—to provide a rational basisfor the introduction of breeder reactors. France now recycles plutonium from its light-water reactor fuel, and if the cost of this activity is assumed to be devoted to the saving ofuranium consumption, that comes at a cost of about $700/kg of raw uranium—very muchmore than historical prices over the years that France has been doing this and much morethan current prices for uranium.
Explore the production of methane hydrate from ocean margins, and define the resource(perhaps 2000 Gt of carbon, but a dilute, non-flowing resource). There is another largeresource of fuel, widely distributed on the margins of the oceans—methane held in theform of hydrate in a so-called clathrate or “claw” structure. At suitable ocean depth onthe order of 1 km, methane is believed to fill a few percent of the pore space of thesediment, amounting to perhaps 2000 gigatonnes of carbon but in the form of a dilute,non-flowing resource. Looking again at Slide 16, now Slide 26, this would be a verylarge contribution to world energy resources if it could be economically produced.
As for nuclear power, my recommendation is to deploy plants of current design, such asthe evolutionary power reactor for which the prototype is being built in Finland and inFrance, not without delays and difficulties. In principle, other reactors could be evensafer such as those involving micro-encapsulated fuel, in carbide spheres of the order of0.5 mm diameter, consolidated into tennis-ball-sized “pebbles” or into prismatic blocks.Such reactors ought to be developed and tested and deployed if economical. Ultimately,either when a breeder reactor is as inexpensive as an LWR or the actual cost of uranium
05/22/08 Nuclear Power in World Energy Future_with slides.doc 23
has risen to make a more expensive breeder economical, the world could make thetransition to a breeder economy, with necessary reprocessing and recycle of fuel, to useessentially 100% of the raw uranium rather than the 0.5% used in current-generationreactors which can fission only the U-235 and not the U-238, of 99.3% abundance innatural uranium.
The crisis nature of the world energy problem arises first from the urgency to reducegreatly the carbon emissions to the atmosphere and from the economic distortionsintroduced by the great excess of energy price over the cost of production. This is asickness of modern society, with markets run amok in my opinion. It was seen in pureform in the Enron scandal in the United States, in which Enron employees franklymanipulated the cost of electrical energy in the California market with the great leverageafforded by “marginal pricing”. If energy supply was inelastic because the consumersdid not know how much they were paying at the moment and had no easy way ofreducing energy demand for less urgent needs at that time, the manipulation consisted ofkeeping some electrical energy generation capacity offline for repair, for instance, so thata high-cost producer would be called on as supply contracts were awarded in order ofincreasing price. Even the producer was not limited to its cost of production plus normalprofit, but was part of a bidding mechanism, and if the bid were very high, then all of theelectricity transferred at that time would be sold at the very high price.
In fact, under such circumstances the price is not in any way determined by theavailability of electricity but by the demand curve. The state of California has nowbecome a leader in allowing the control of demand.
The similar marginal pricing situation holds with the globalization of energy supplymarkets, especially in oil and to some extent in coal, and to a growing extent in naturalgas.
Solutions are long-term contracts such as that used to good effect by Southwest Airlinesin the United States, which has bought its fuel several years in advance and is thus payingless than half what other airlines are currently paying for fuel. But I am neither aregulator nor an economist, and I don’t have the expertise or the time here to prescribefor the energy future. It will take concerted action on the part of the world’s energy usersto have a system in which energy producers will be properly rewarded for costs and risks,and energy consumers can count on a reliable supply of energy at a fair price.
The energy field is not alone in such pricing. In recent years, some pharmaceuticals in theUnited States have suddenly increased in price by a factor 10 or even 100—not becauseof increased cost of production and certainly not because of “expenditures on researchand development” which was long since done, but because a single companymanufactured the pharmaceutical, and they were bought up by others who had noscruples about charging the consumer for the drug absolutely necessary to keep themalive. “Your money or your life,” the mantra of the highwayman has made its way intothe pharmaceutical market. And into the energy market.

05/22/08 Nuclear Power in World Energy Future_with slides.doc 24
*I have shown the “supply curve” for oil—which I should now title “fundamental supplycurve”—the cost as a function of cumulative demand. Here it is again (Slide 16/26). Theclassic supply curve of the college course in economics shows increasing cost ofproduction as the cumulative demand increases—after all, why not buy and consume thelow-cost commodity first? But oil was produced in the United States domestically andelsewhere and sold at a profit over the cost of production, before global oil companiesdiscovered and produced oil in Saudi Arabia at less than $2/bbl.
It took years to establish a global market and transport system for oil, and then the worldwas faced in the 1970s with the formation of OPEC and the nationalization of oilresources and facilities owned and built by these international companies.
We are now faced with the classic confrontation of suppliers who wish to charge morefor a unit of their commodity (barrel of crude oil) and consumers who wish to pay less.But the consumers in many cases are not the ultimate consumers but intermediaries—some of whom, like the US refiners, are subsidiaries of the US domestic producers of oil.The US domestic production is still 5 million bbl/day, of a total consumption of 21MBpd, and the US producers/refiners have no incentive to demand lower prices. Asshown by Slide 16/26 their own production is at a cost of some $25/bbl, and the profitmade by being able to sell at the marginal price of $120 bbl/day so far exceeds anybenefit they might achieve by increasing production that their interest—in the service oftheir stockholders—is clearly in maintaining tight markets and restricted supply.*
Slide 27 suggests what would be needed if the petroleum consuming states were to getserious about the problem of price of crude oil.

05/22/08 Nuclear Power in World Energy Future_with slides.doc 25
They would create an Organization of Petroleum Importing States, of which the UnitedStates, with its large domestic production, would not be a leader.
They would establish a virtual World Energy Laboratory, with elements modeled on theEnergy and Resources Group at the University of California, Berkeley, and the Center forBuilding Science at the Lawrence Berkeley laboratory, established by Arthur Rosenfeldthat has shown the way to hundreds of billions of dollars in energy savings. A centralNuclear Energy Laboratory might be the exception to the virtual organization.
Alternatives to conventional petroleum should be supported by a long-term contract fortheir product—not a guarantee of profit—in order to guard against collapse of petroleumprice and to mobilize private initiative to reduce costs below the fixed selling price.
Finally, in recognition of the fact that the enormous jump in crude oil prices of the lasttwo years has not brought increased production but only a moderation of demand, theOPIS nations should institute a large consumption tax on the order of $60/bbl or$1.50/gallon (about Euro 0.35 per liter) on all uses of petroleum in order to reducedemand without the enormous transfer of wealth to the petroleum producers. Theproblem will be to maintain discipline among the consuming states.