ntm-dly gas resm%oir detection ,optimization
TRANSCRIPT
,.
#=-----
.
Ntm-dly htctured~ight ~fi$
Gas Resm%oir Detection ,Optimization
Prepared for:
U.S. Department of EnergyFederal Energy ~eclmology Center
Contract No, DE-AC21-93MC30086
Quarterly i%atys Report_.. .__.———————
Period of Performance: January 1,1999- March 31,1999
Date of Submission: April 30, 1999
Prepared by:
Advanced Resources International, Inc.
....
1110 N. Glebe Road, Suite 600Arlington, VA 2220
.*
.-
DISCLAIMER
This report was prepared as an account of work sponsoredby an agency of the United States Government. Neitherthe United States Government nor any agency thereof, norany of their employees, make any warranty, express orimplied, or assumes any legal liability or responsibility forthe accuracy, completeness, or usefulness of anyinformation, apparatus, product, or process disclosed, orrepresents that its use would not infringe privately ownedrights. Reference herein to any specific commercialproduct, process, or service by trade name, trademark,manufacturer, or otherwise does not necessarily constituteor imply its endorsement, recommendation, or favoring bythe United States Government or any agency thereof. Theviews and opinions of authors expressed herein do notnecessarily state or reflect those of the United StatesGovernment or any agency thereof.
DISCLAIMER
Portions of this document may be illegiblein electronic image products. Images areproduced from the best available originaldocument.
Quarterly Status Report
CONTRACT NO.: CONTRACTOR
DE-AC21-93MC3 0086 Advanced Resources International, Inc.1110 N. Glebe Road, Suite 600Arlington, VA 22201
CONTRACT NAME: CONTRACT PERIOD:
Naturally Fractured 9/30/93 - 4/30/99Tight Gas ReservoirDetection Optimization
CONTRACT OBJECTIVE: No change.
TECHNICAL APPROACH CHANGES: No change.
FIELD PERFORMANCE TEST PLAN:
Introduction
In March, work continued on characterizing probabilities for determining natural fracturingassociated with the GGRB for the Upper Cretaceus tight gas plays. Structural complexity, basedon potential field data and remote sensing da% was completed. A resource estimate for the Frontierand Mesa Verde play w=” also completed. Further, work was also conducted to determine thresholdeconomics for the play based on limited current production in the plays in the Warnsutter Ridgearea. These analyses culminated in a presentation at FETC on 24 March 1999 where quantifiednatural fracture domains, mapped on a partition basis, which establish “sweet spot” probability fornatural fracturing, were reviewed. That presentation is reproduced here as Appendix 1.
The work pkm for the quarter of January 1, 1999- March31, 1999 comprised five tasks:
1. Evaluation of the Gt3113 partitions for structural complexity that can be associatedwith natural fractures,
2. Continued resource analysis of the balance of the partitions to determine areas withhigher relative gas richness,
3. Gas field studies,
IAD2234.wpd -1-
[q~~~f~~,~
JAN0 Cz~~f4. 9$$?7Threshold resource economics to determine which partitions would b th & s
prospective.5. Examination of the area around the Table Rock 4H well
The following sections describe the tasks performed during this quarter as part of the GGRBanalysis effort.
TaskL Evaluationof the GGRB Pati”tionsfor StructuralComplm”ty That Can BeAssociatedwithNaturalFractures
As an integral part of identifying potential “sweet spots” of enhanced natural fracturingwithin the Greater Green River basin, Advanced Resources derived an index of structuralcomplexity associated with natural fracture intensity, created based on the analysis of LandsatThematic Mapper (TM) multispectral satellite imagery and potential field dat~ as follows:
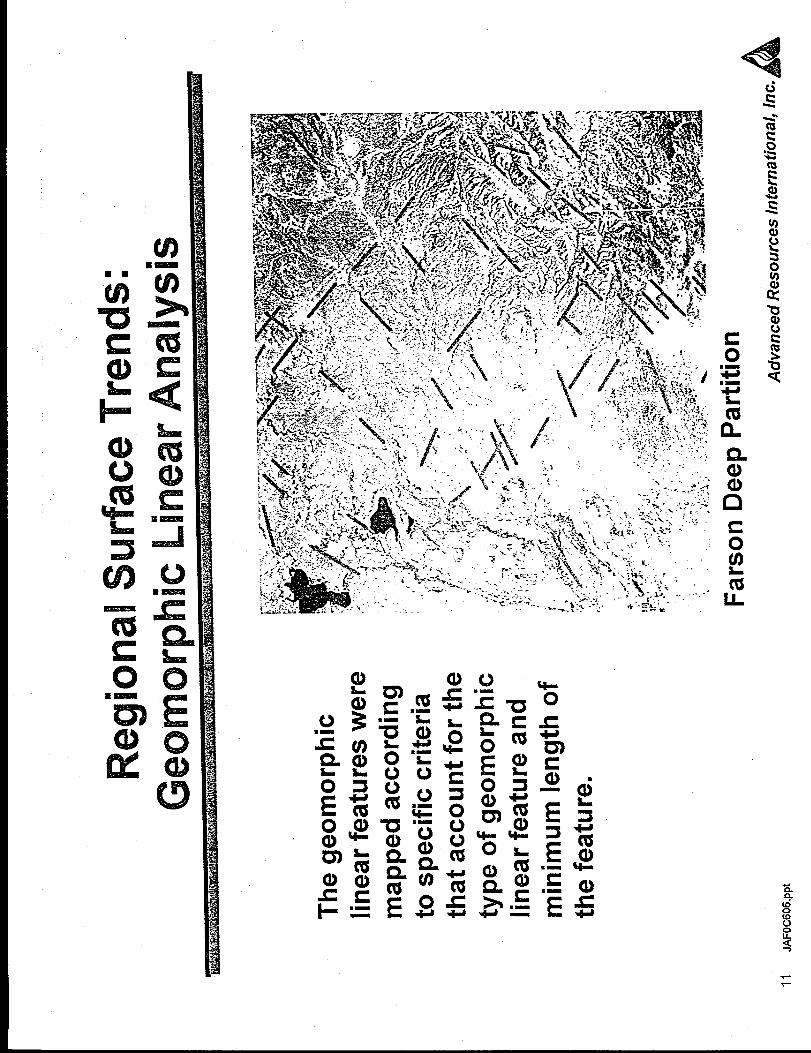
This task was accomplished by applying a strict set of photogeologic criteria to mapgeomorphic features that indicate structural control of topography. Anomalous geomorphicfeatures, such as straight linear valleys, ridges, or streambeds, indicate the presence of underlyingfractures - fauks or joints -in the bedrock, that affect erosion and landform morphology. Straighttopographic features were interactively mapped on the satellite imagery using widely acceptedtec~lques for photogeologic analysis. We separated linear features into three categories: straightescarpments, straight valley, and straight stream channels. Features were computer-mappedonscreen at a working scale of approximately 1;100,000 (at larger scales, individual TM imagepixels become obvious, and no additional geologic detail is apparent). To minimize confusion withcultural influences - roads, fencelines, plowing patterns, etc. - no features shorter than about onekilometer were mapped. Two separate rounds of quality control review were conducted to refinethis primary dataset.
lB.
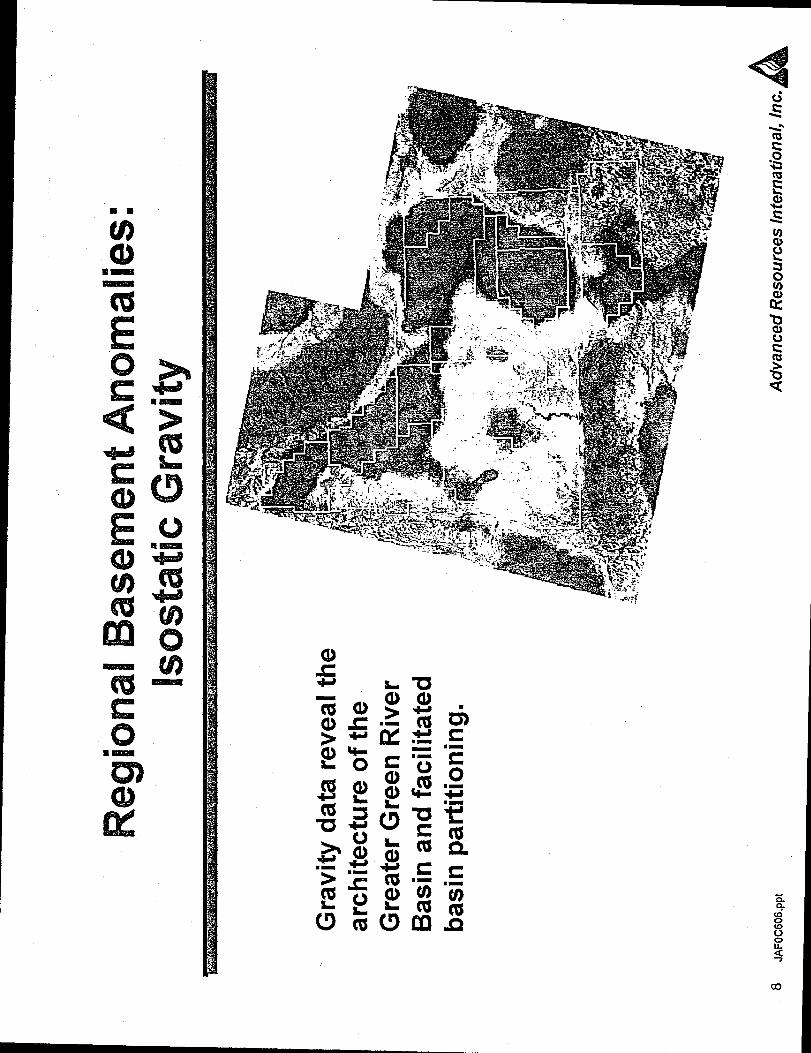
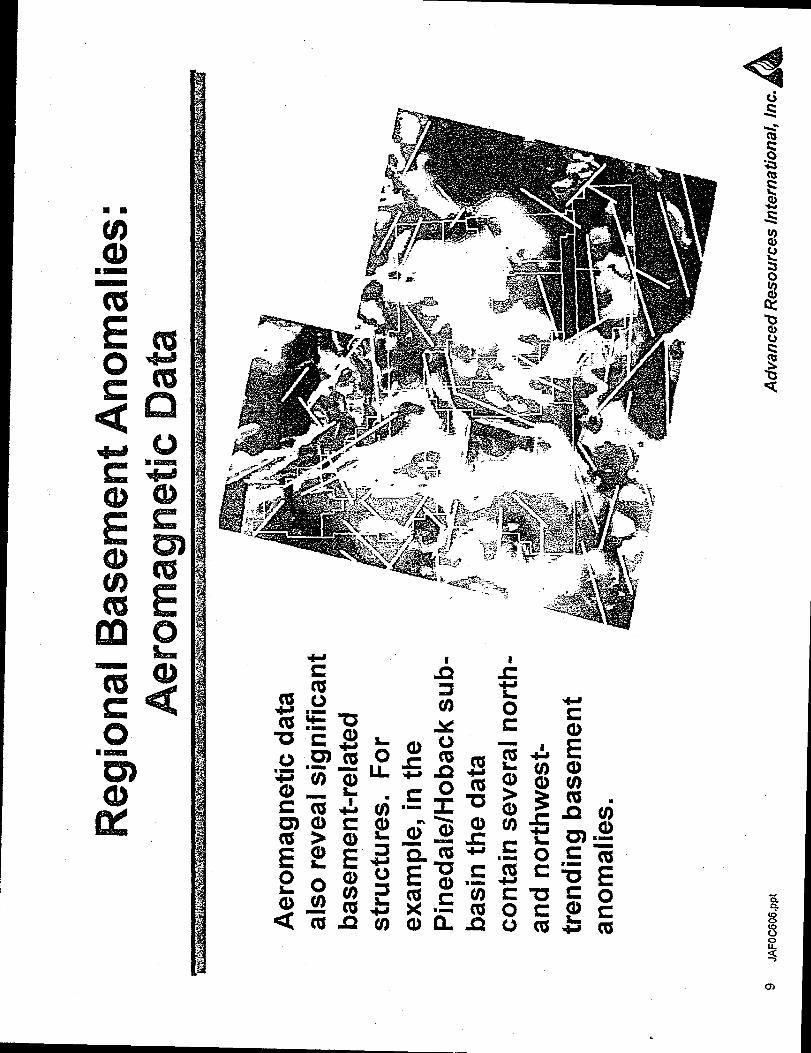
The struct&d importance of sin-face linear features is assessed by comparing them with ananalysis of the underlying basement configuration. For thk study, Advanced Resources usedregional aeromagnetic and isostatic residual gravity data from the U. S. Geological Survey, DigitalData Series 9. These data show variations in magnetic susceptibility and density of the crust.Low-frequency variations reveal changes in depth-to-basement or in basement composition. Abruptchanges create steep gradients in the potential field data that suggest the presence of a physicalbo~dary in the basement, such as a major fault or shear zone that has juxtaposed different crustalblocks or caused a vertical offset in basement topography. The spatial coincidence of abruptpotential field gradients with surface linear features indicates the presence of an important structuralfeature that has affected the physical properties of the basement and the present-day land surface,
L4D2234.wpd -2-
and presumably the intervening strat~ includlng the reservoir rocks. To integrate the surface and
basement analyses, we mapped the aeromagnetic and gravity databy assigning an 8-bit “rainbow”of colors to the range of data values found within the study area. Low magnetic intensity ornegative gravity anomaly appears purple; high magnetic intensity or positive gravity anomalyappears red. The color-coded potential field data were then digitally merged with the satellite
imagery for easier refwence. Regionally extensive, abrupt gradients in the basement properties areshown by sharp changes in color. These gradients were delineated onscreen to show significantaeromagnetic and gravity alignments.
3C. . .al Coqk@@mhg
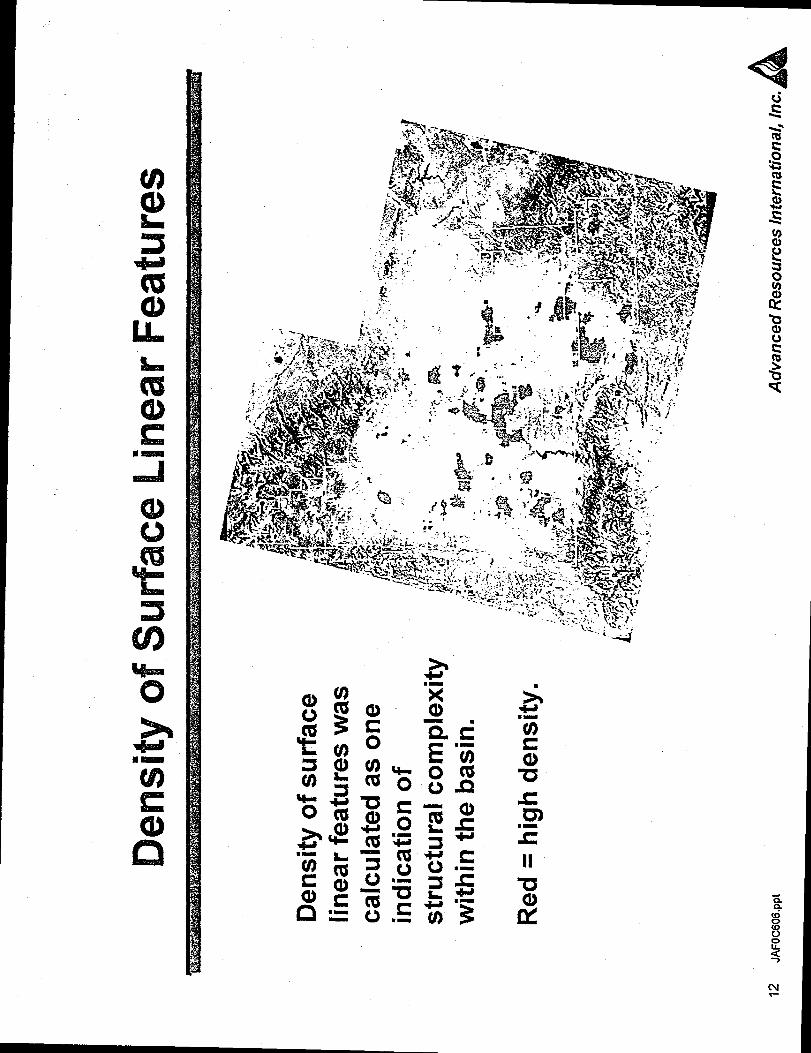
Structural complexity was then determined by township. To determine the index ofstructural complexity (ISC), the presence or absence of abrupt potential field gradients within agiven township was determined and weighted by a value of two-thirds. Surface linear features weresummed for each township and weighted by a value of one-third. The township values were binnedby ISC ranking with the highest 10% categorized as “best”, the next 20% categorized as “good”, thenext 30°/0 categorized as moderate and the 40°/0 balance categorized as “poor”.
Task2. ContinuedResourceAnalysisof theBalanceof thePartitionsto Determ”neAreaswithHigherRelati”veGasRichness
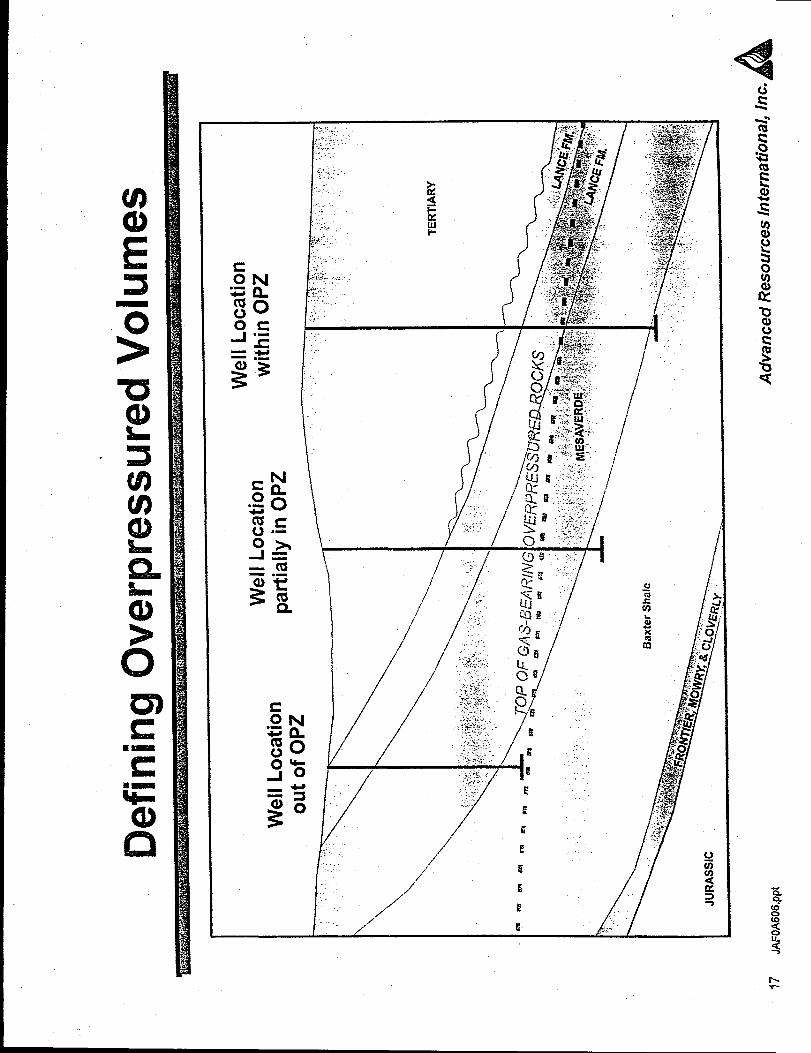
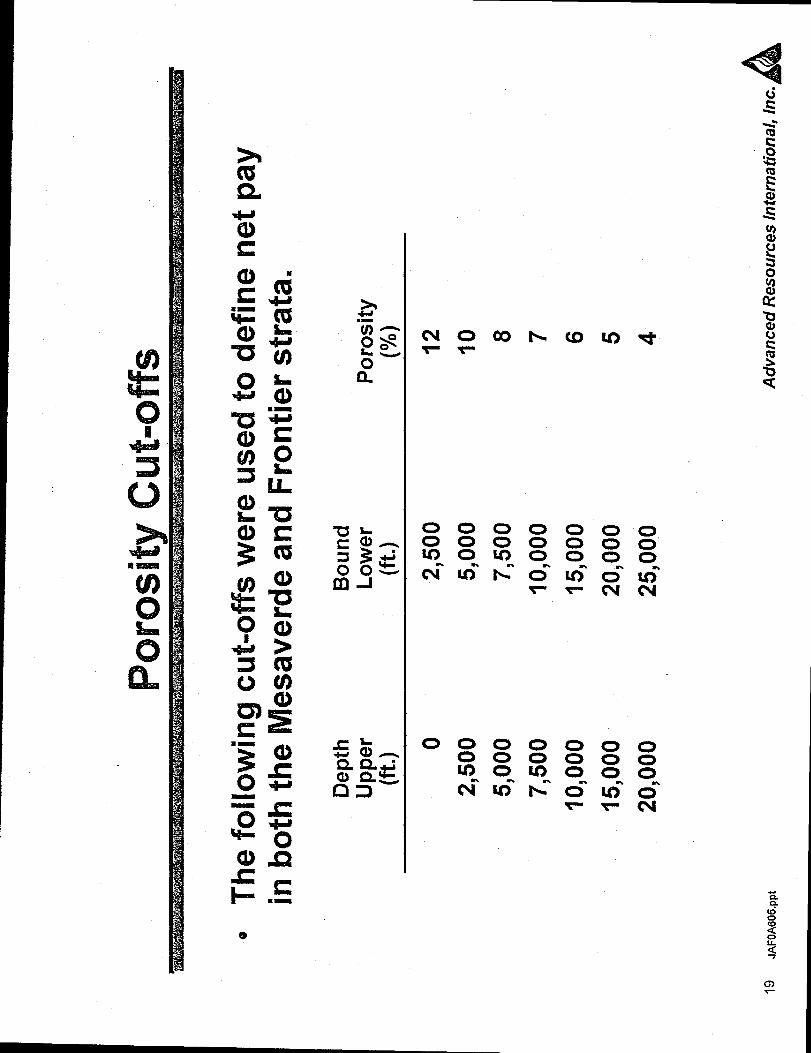
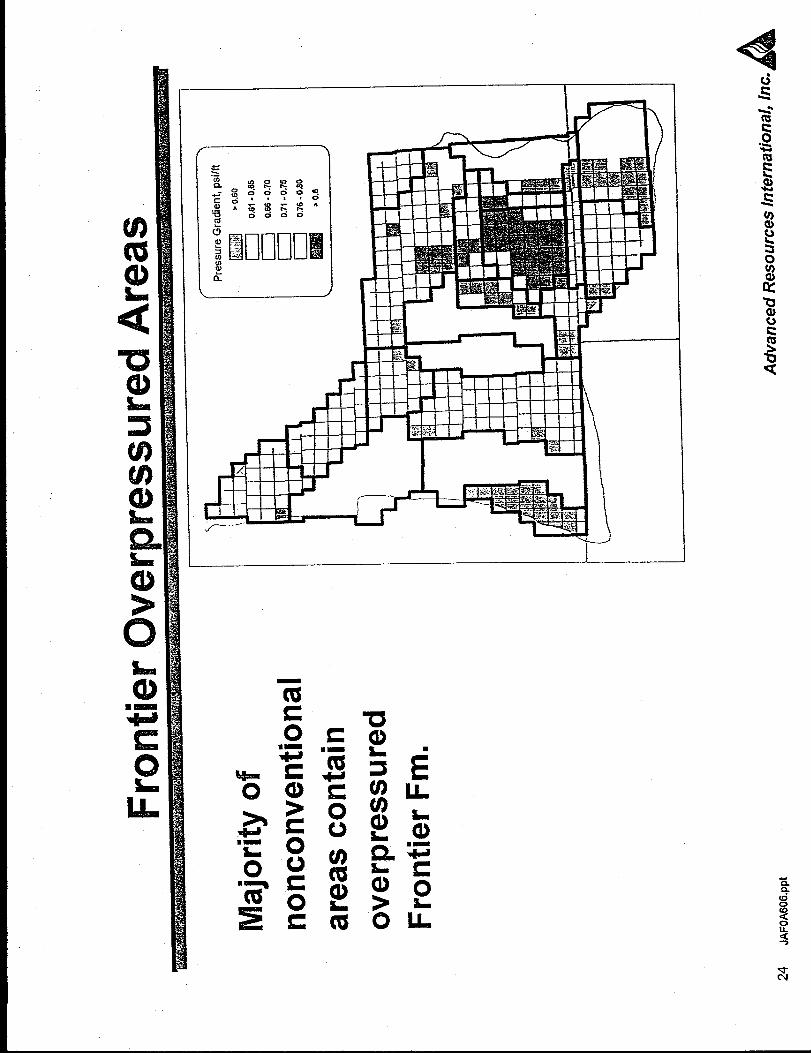
Using the partitions previously defined (see Appendix I), analysis for this task during thisquarter culminated in a determination of the relative resource richness in the G(3RB UpperCretaceus tight gas play in overpressured areas. The purpose of the effort was to highlight thoseareas that would be most prospective for exploration. Work included fi,u-ther determination of theoverpressured portions of the basin. Over 300 wells were analyzed as part of the investigation todefine net pay, porosity, and other parameters necessary to the resource calculation.
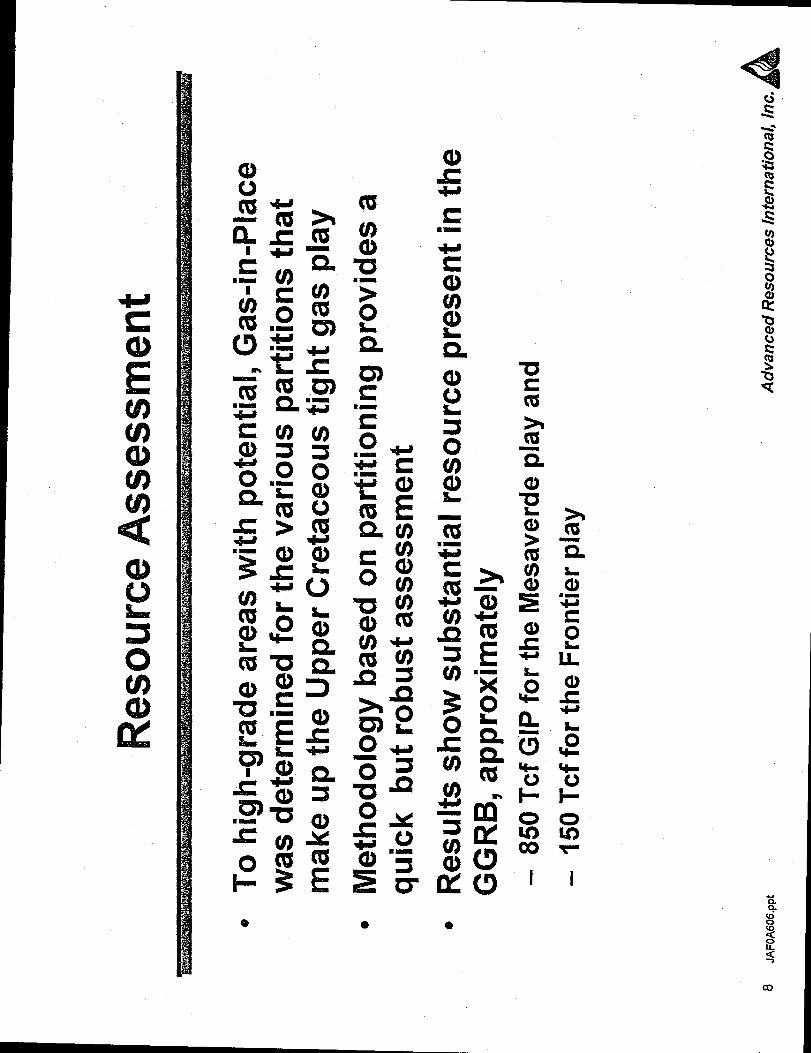
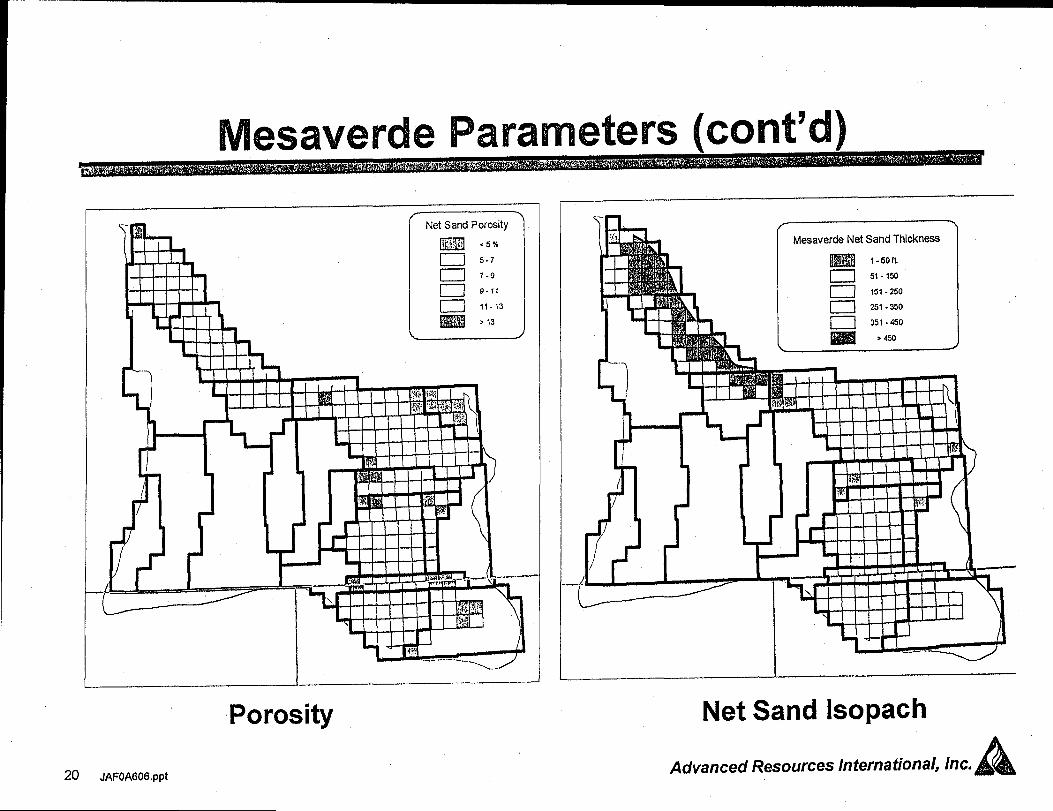
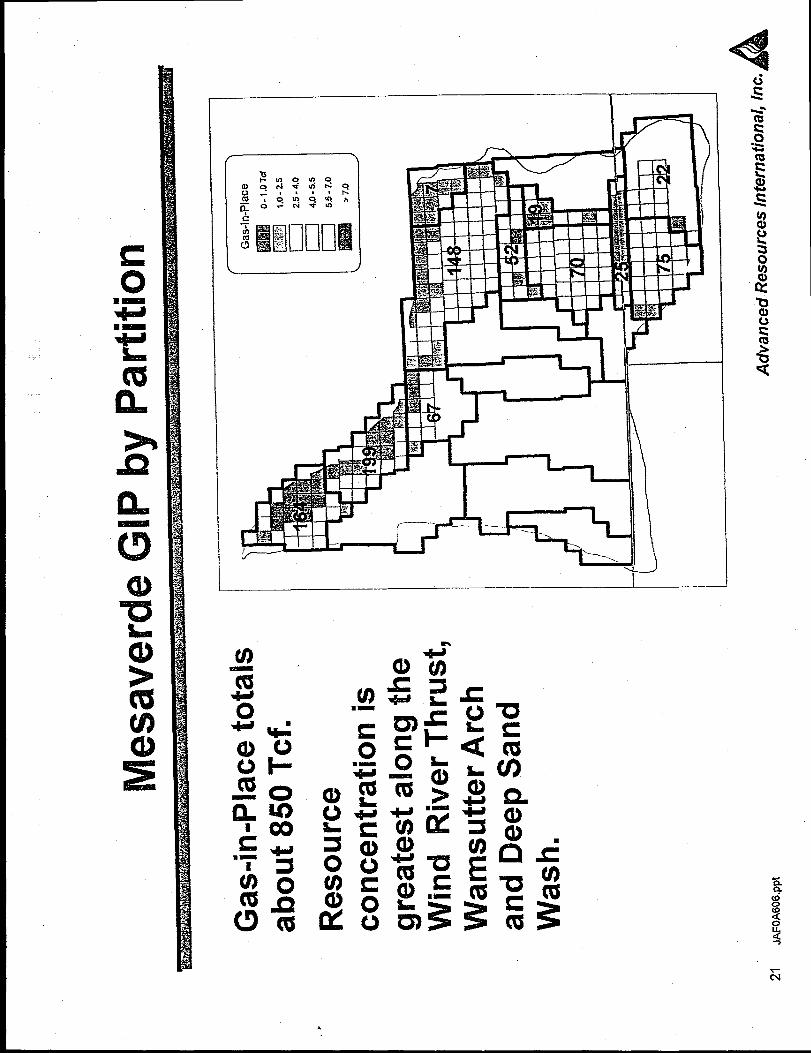
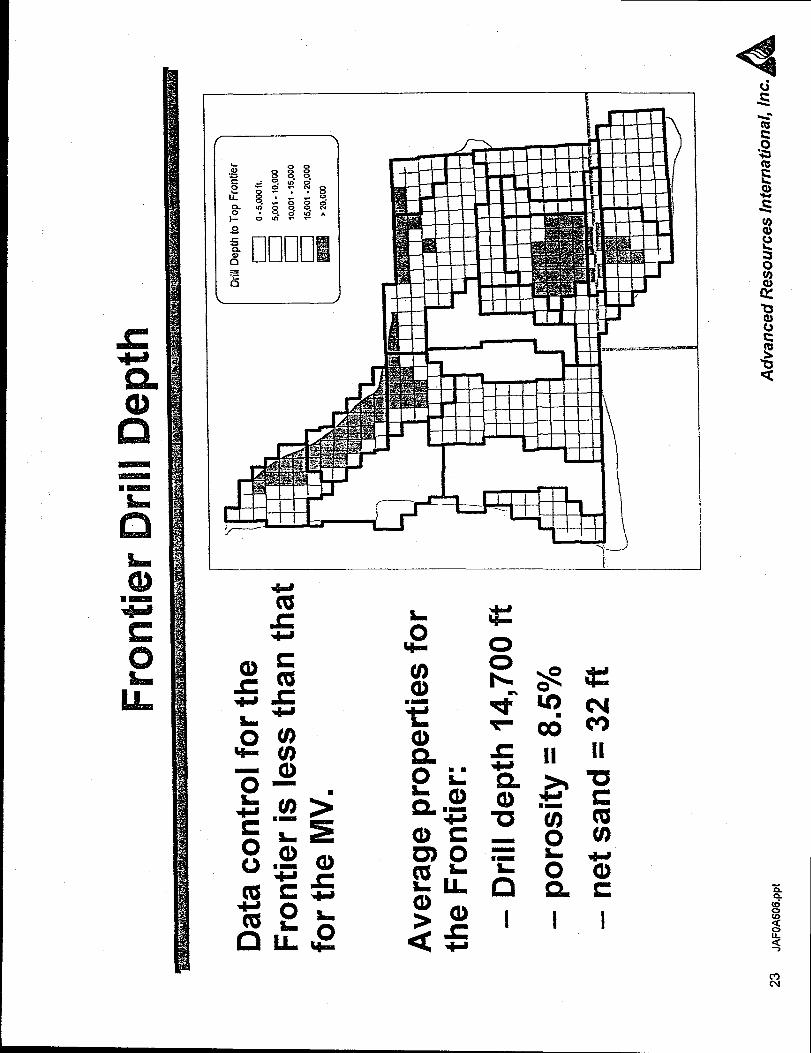
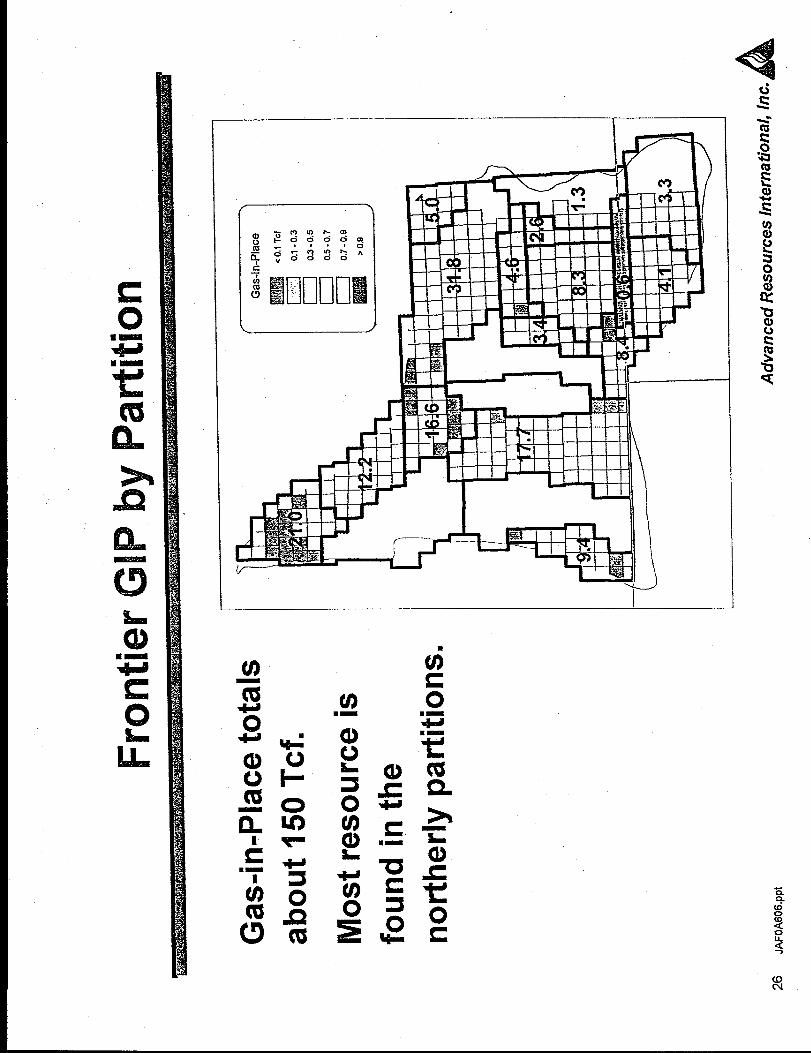
Results show substantial resource present in the GGRB, approximately 850 Tcf Gil? for theMesa Verde play andl 50 Tcf for the Frontier play. Results show that the Mesa Verde has anaverage drill depth of 10,300 fi porosity of 9.5 ‘XO,and net sand thickness of 275 ft in the play. TheFrontier has an average drill depth of 14,700 ft, porosity of 8.5 ‘%0,and net sand thickness of 32 ftin the play.
Task3. GasFieldStudies
Further field studies were conducted to examine the reservoir settings for gas accumulation in the
Upper Cretaceus section in the GGRB. During the quarter, we examined the Table Rock Jonah,Siberia Ridge and Yampa-Lay fields.
IAD2234.wpd -3-
Task4. ThresholdResourceEconom”cstoDeterm”neWhichPti”tions WouldBe theMostProspective
On the basis of the partitions, natural fracture ranking was reltated to resource richness for
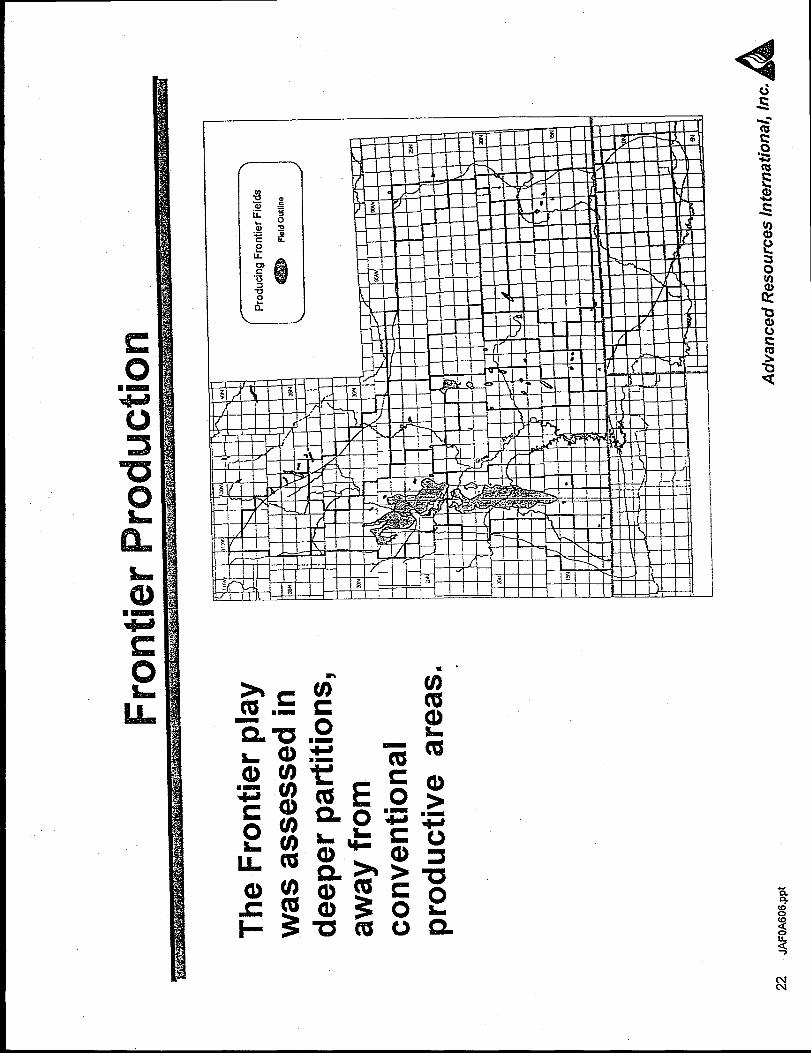
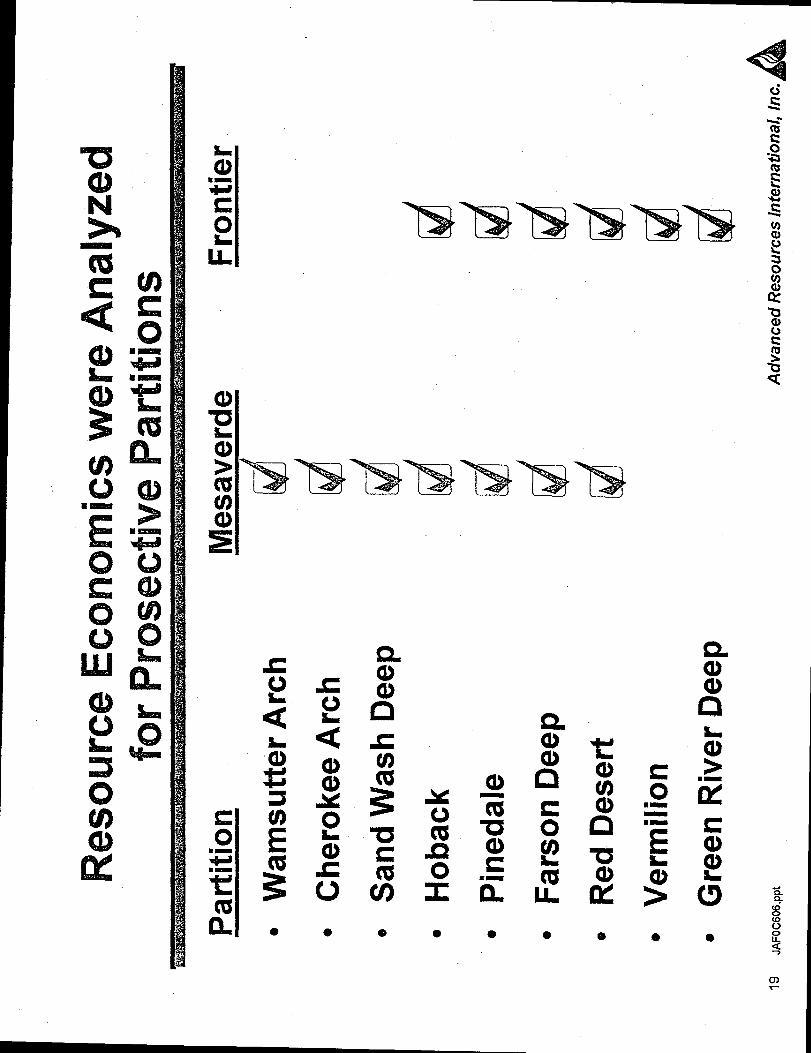
the GGRB. Resource recovery economics were run for the Mesa Verde and Frontier plays based oncurrent technology (Case 1), advanced technology (use of advanced completions and horizontalwells, Case 2), and advanced technology with natural fracture ranking (Case 3). Among the mostprospective partitions are the Pinedale, Farson Deep Sand Wash Deep and Wamsutter Archpartitions for the Mesa Verde play. For the Frontier play, prospective partitions include the FarsonDeep, Sand Wash Deep, Pinedale and Green River Deep partitions.
Task5. Exanu”nationof the GeologyandFaultSystemsNearthe TableRock 4H Well
A full 3D seismic data set that covers approximately 36 sections was extracted from theTable Rock and Continental Divide 3D surveys. It was decided to apply a coherency filter to furtherenhance the data. The coherency processing brings out in finer detail the fault-relateddiscontinuities in the seismic data allowing for better analysis and fault mapping.
Using the filly processed 3D dam the thrust and strike-slip fault system north of Table Rockwas shown in great detail. Furthermore, two small splay faults were identified in the data that occurin the region of the horizontal drilling location.
Using the more complicated fault system geometry, a geomechanical model was petiormed.This new model showed regions of possible tensile failure associated with the smaller faults. It ispossible that the Table Rock 4H horizontal well may have crossed into one of these tensile failurezones. The success’ of the horizontal well in encountering clusters of natural fractures near smallfaults is in agreement with the fault mapping and geomechanical model.
IAD2234.wpd -4-
L4D2234.wpd
Appendix 1
-5-
Sa!41nc)
u’)u)a)cl)(2LIQIEico
8Emm
63Sk?5c)
4
outline
o Greater Green River Basin Regional Partitioningand Fligh-Grading
— Resource-in-Place
Structural Characterization
Resource Recovery Economics
~ Prospect Delineation
– Table Rock Horizontal Drilling Project
o Conclusions & Discussion
2 JAFOA606.ppt Advanced Resources International, Inc. A<
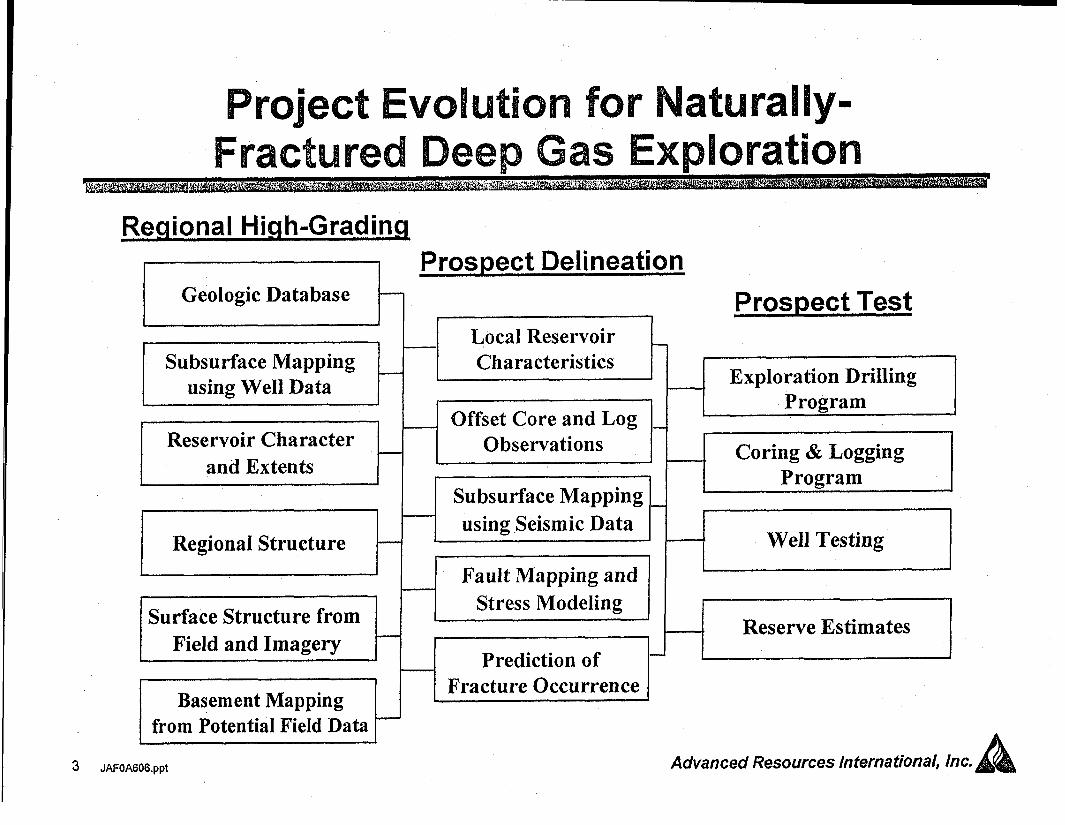
Project Evolution forNaturally”
Fractured Deep Gas Exploration
Regional Hiqh-Grading
Geologic Databaset
Regional Structuret-
$urface Structure fromField and Imagery I
Basement Mappingfrom Potential Field Data I
3 JAFOA606.@
Prospect Delineation
Prosnect TestLocal ReservoirCharacteristics t
-1Subsurface Mapping _using Seismic Data
i
Fault Mapping andStress Modeling
I Exploration Drilling IProgram J
~ Coring& LoggingProgram
-iWell Testing
--iReserve Estimates
i
Prediction of “Fracture Occurrence
Advanced Resources lntemat~onal, km.A
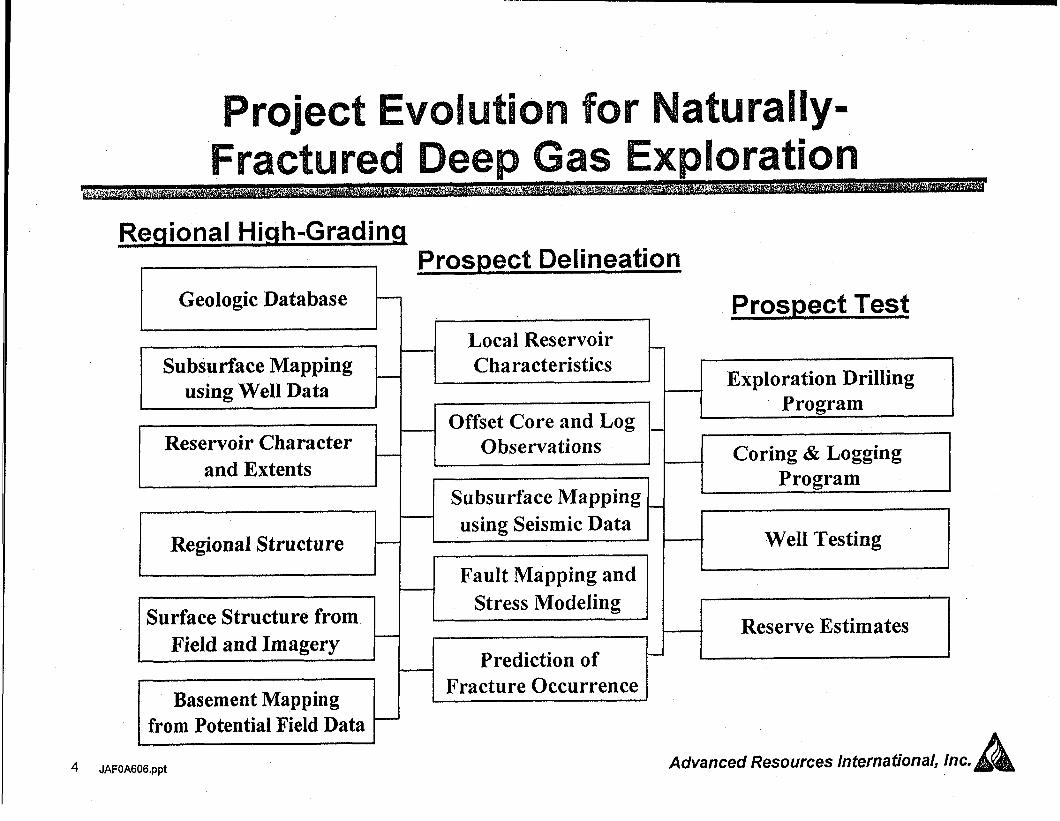
Project Evolution forNaturally-
Fractured Deep Gas Exploration
Regional Hiqh-GradingProspect Delineation
I Geologic Databaset-
Subsurface Mapping Lusing Well Data
Reservoir Characterand Extents t
I Regional Structurer
ISurface Structure from I
I Field and Imagery
Basement Mappingfrom Potential Field Data }
-b$EzE_t
4 Subsurface Mapping _using Seismic Data
i
Fault Mapping andStress Modeling
Prospect Test
Exploration DrillingProgram
~
Well Testing
-1 Reserve Estimates
Advanced Resources International, inc.AJAFOA606.ppt
I
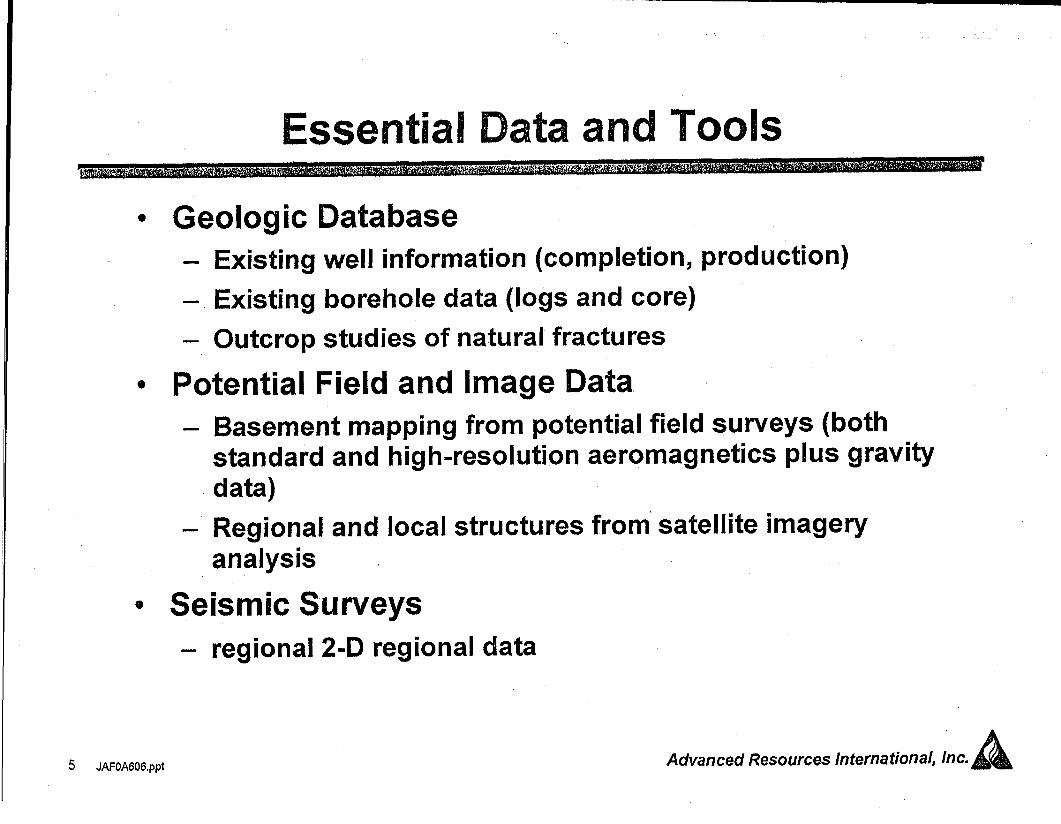
Essential Data and ToolsI
~ Geologic Database– Existing well information (completion, production)
- Existing borehole data (logs and core)
– Outcrop studies of natural fractures
I o Potential Field and Image Data– Basement mapping from potential field surveys (both
standard and high-resolution aeromagnetics plus gravitydata)
– Regional and local structures from satellite imageryanalysis
~ Seismic Surveysregional 2-D regional data
5 JAFOA606.p@ Advanced Resources International, Inc.‘A
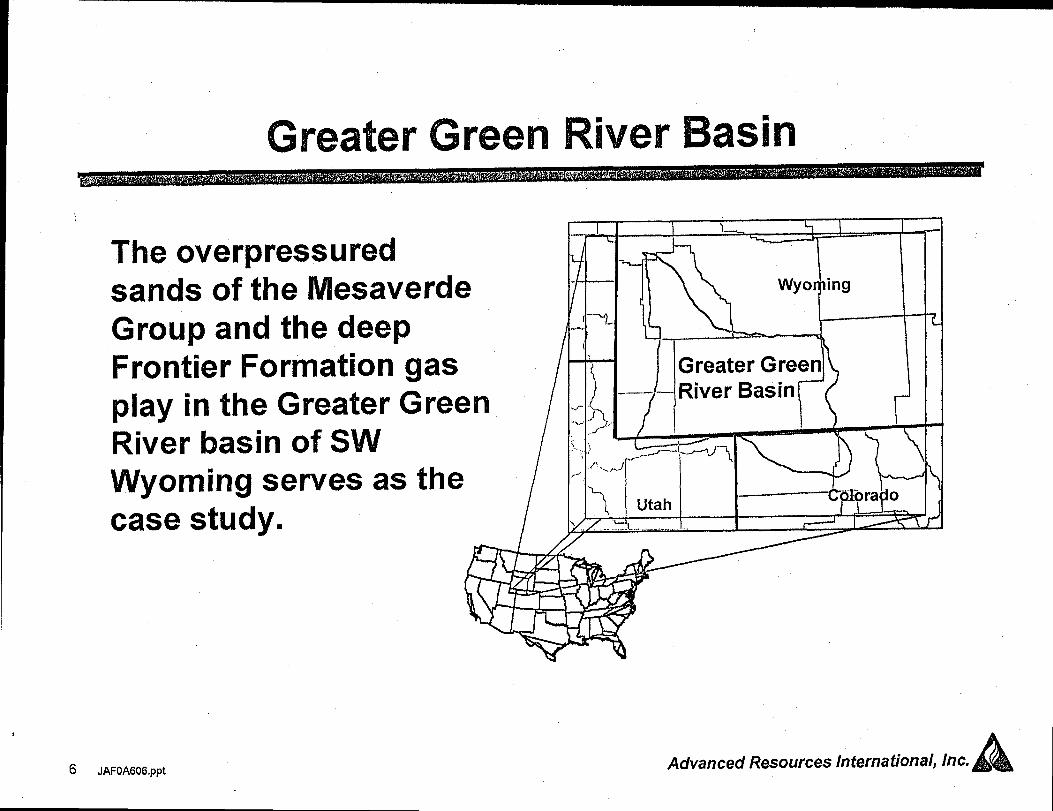
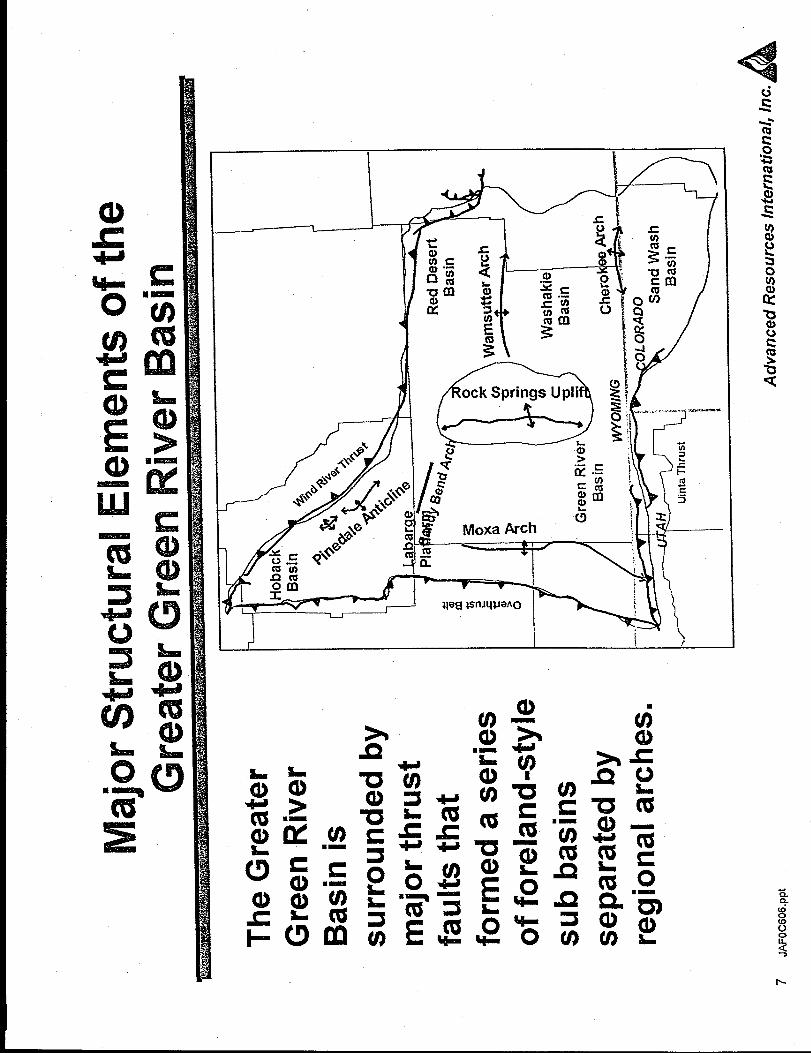
Greater Green River Basin
\ , I 1I
The overpressured Y
Group and the deepFrontier Formation gasplay in the Greater GreenRiver basin of SWWyoming serves as thecase study.
,
6 JAFOA606.@ Advanced Resources International, Inc.A
I
sm-
u)m
m
Slm
sa)d)L
t!)La)me!)L
(9
ms
B-
-cl63!&i
CGCL
4
a)um m s
E-LS&
■-Rcos
scl)
u)mm 0
k
(!) QB
E m
C5U)
30u)a)L
u’)CD
fn30 E
u)Q Em>a
U)8-
30
L L
Q83
S9
CLEL
QQcoCG
n
m
uc!)C9
9e u)-
u)
I I
e * ●
co
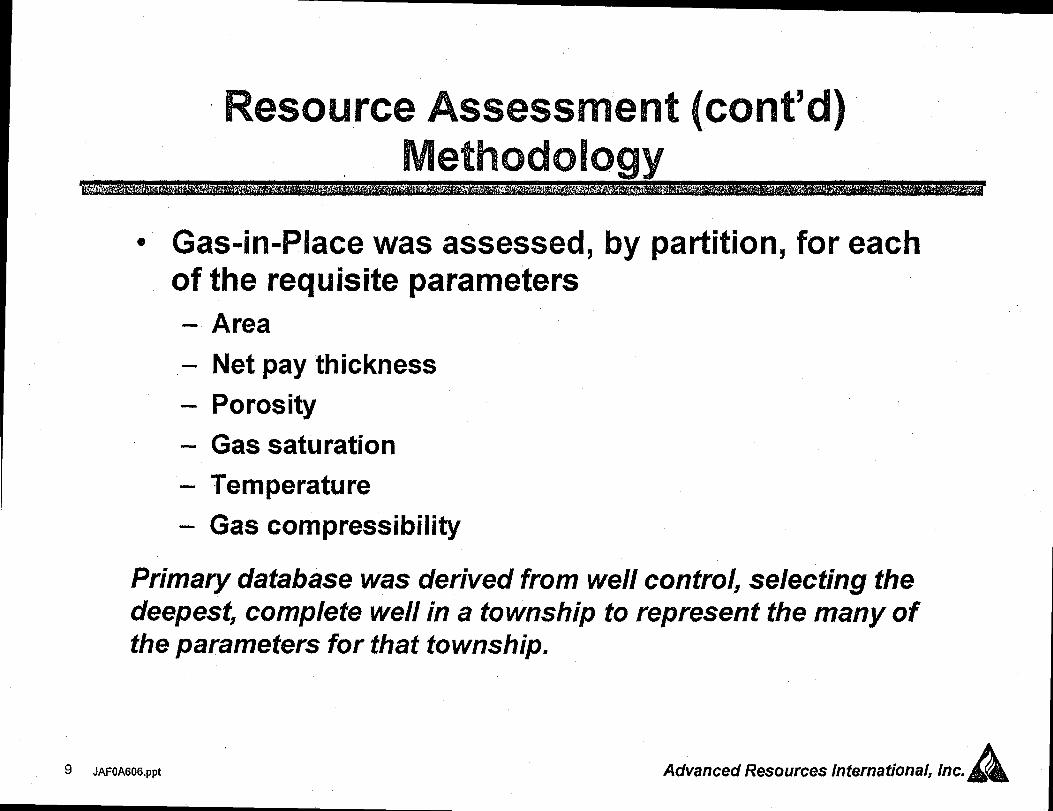
Resource Assessment (Cent’d)Methodology
e Gas-in-Place was assessed, by partition, for eachof the requisite parameters
Area
Net pay thickness
Porosity
Gas saturation
Temperature
Gas compressibility
Primary database was derived from weli control, selecting thedeepest, complete well in a township to represent the many ofthe parameters for that township.
9 JAFOA606.ppt Advanced Resources International, Inc.A
‘T3“*so0
ccl)
Eu)u)a)(nm4e!)uS6a
3c1coc1)Clfc
\
— -—..- ...
I__..1 -----
.—. —-
j? ‘---3!->
/ ---a-1.. G%% “k=-%
z~\ -.-c-l . . r. .’ -
‘1
!I
. . ..T. —-— .—. _.L ._
u)m3coQ
Eu)ss0
‘5u)sala)E
m
E
s0
0
.
cCD
Ecoa)a)u)u)
<(laoSli9s?#>e)u)al)I!3c
>
C3c)
J. .
./-’
—r/
EwiiL I -T=r IAd
—-—-—-—._._._-
“--—-—-—---—-—L-r-—-—-
r-’-A ‘<.1=. ~ ‘~-.-) ‘ii,]
0g)
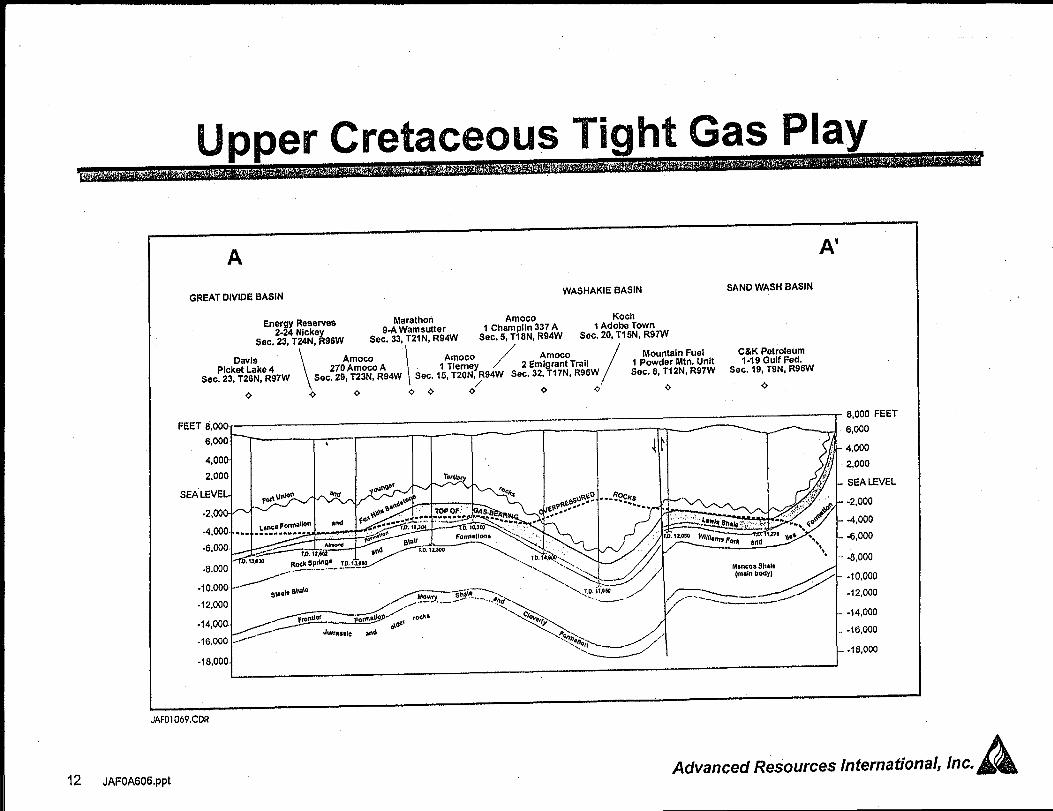
Upper Cretaceus Tight Gas Play
A A’
Ener y Reserves Merathon Amoco Koch
2-?4 Nlckek
9.,4 Wamsutter 1 Champlin 337A 1 Adobe Town
Sec. 23, T24N, 96W Sec. 33, T21N, R94W Sec. 5, T18N, R94W Sec. 20, TI 5N, R97W
Davis
\
Amoco
\
Amoco/
Amoco
/
Mountain Fuel C&K Petroleum
Picket Lake 4 270 Amoco A 1 Tlerney 2 Emigrant Trail 1 powder Mtn, Unit 1.19 Gulf Fed,
See, 23, T26N, R97W Sec. 29, T23N, R94W Sec. 15, T20N, R9~W Sec. 32, T17N, R96WSec. O,TI 2N, R97W Sec. 19, T9N, R96W
,
4 e Q 9+ c.’ Q + + 4
FEET 8,00
6,000I ‘ -r-n-r-r-m
A
GREAT DIVIDE BASINWASHAKIE BASIN SAND WASH BASIN
4,00cq I II Ill’ I I I2,00
SEA LEVE
.2,00
-4,00
-6,00
-8,00
.1 0+00
-12,00
.14,00
-16,00
-18,000-=%___.--’ I
8,000 FEET
6,000
4,000
2,000
SEA LEVEL
-2,000
-4,000
-6,000
-8,000
-10,000
-12,000
-14,000
.16,000
.-18,000
JAFO1O69.CDR
12 JAFOA606.@Advanced Resources International, Inc.A
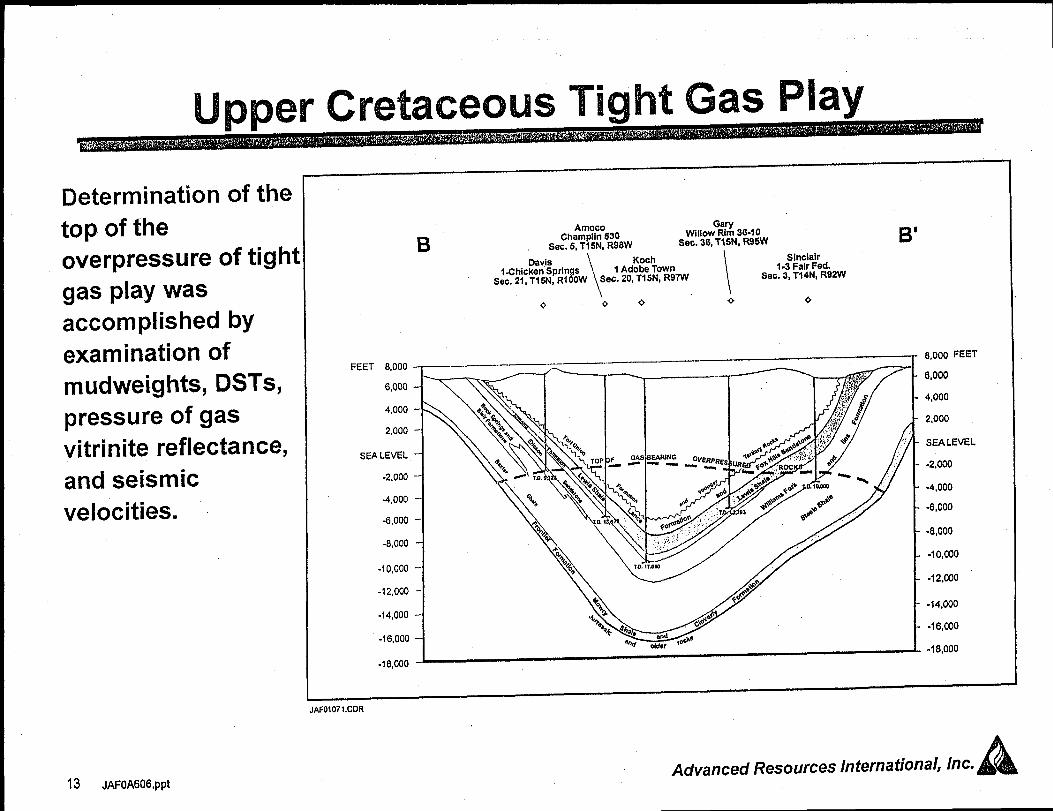
Upper Cretaceus Tight Gas Play
Determination of thetop of the
overpressure of tightgas play wasaccomplished byexamination ofmudweights, tlSTs,pressure of gasvitrinite reflectance,and seismicvelocities.
Amoco
BChamplkr 530 willowG% 36-1o
Sec. 36, T15N, R95W B’Sec. 6, T15N, R98W
Davis
\
Koch
\
Sinclslr
1Zhicksn Springs 1 Adobe Town 1-3 Feir Fed.
SeC. 21, TISN, RIOOW Sec. 20, T15N, R97WSec. 3, T14N, R92W
FEET 8,000 1 ,- —
‘O’O-t-rYKrl4,000
2,000
sEA LEVEL
-2,000
4,000
-6,000
-8,000
-10,000
-12,000
.14,000
-16,000
r
-18,000 -1—
8,000 FEET
6,000
4,000
2,000
SEA LEVEL
-2,000
-4,000
-6,000
-8,000
-10,000
-12,CQ0
-14,000
-16,(XJO
-18,000
AFO1O71.CDR
I
Advanced Resources International, Inc.A13 JAFOA606,p@
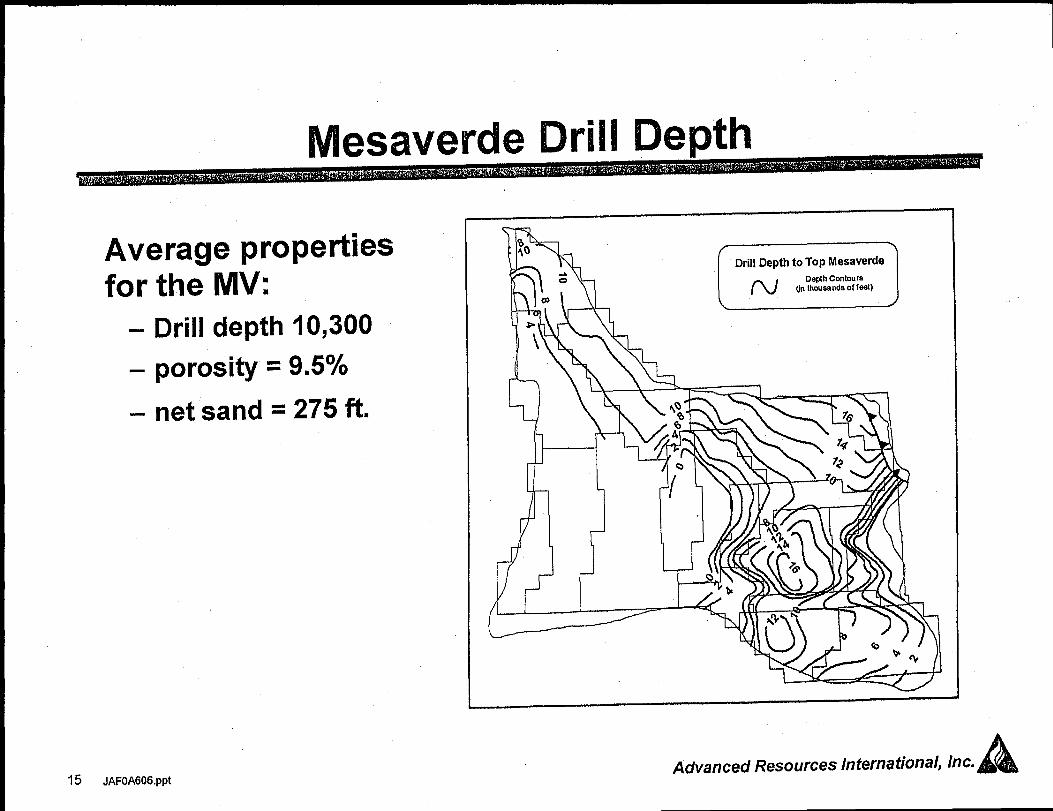
Mesaverde Drill Depth
Average propertiesfor the MV:
Drill depth 10,300
porosity = 9.5%
net sand = 275 ft.
15 JAFOA606.pptAdvanced Resources International, Inc.A
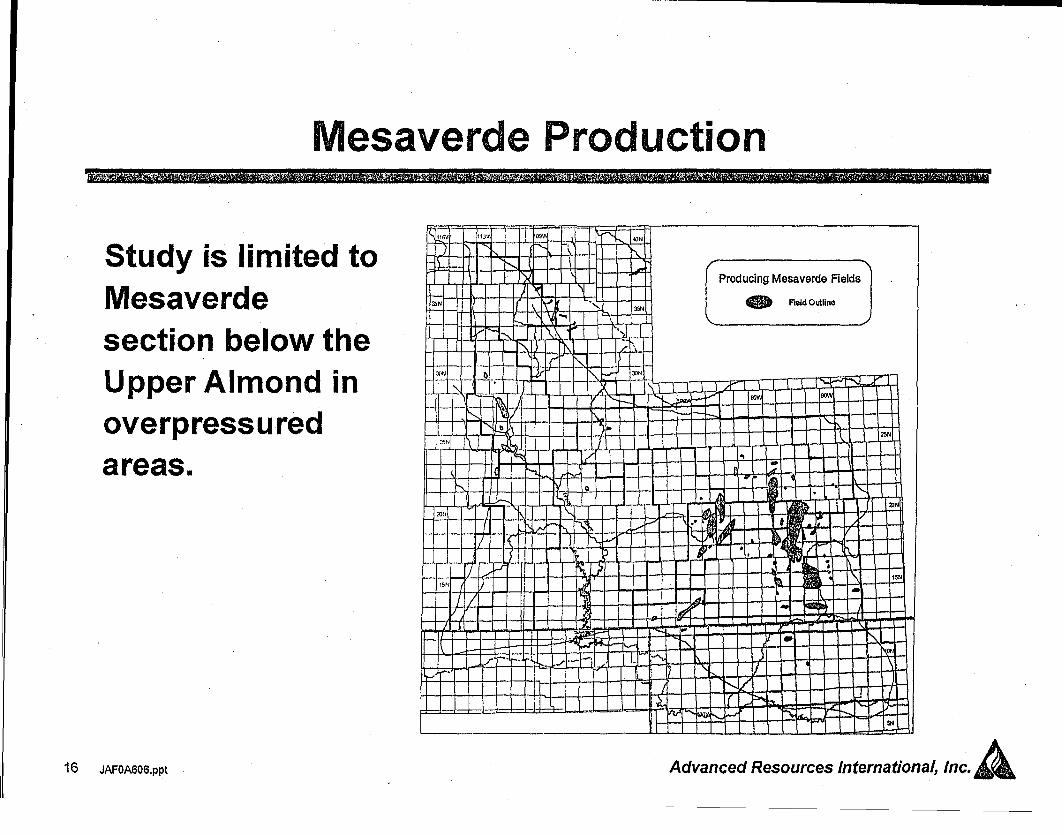
Mesaverde Production
Study is limited toMesaverdesection below theUpper Almond inoverpressu redareas,
16 JAFOA606.p@
I-. 10 ! I ].\_l—L_Ll-u--u-
—
I t-–-1-LLLLL&La
I I I 1 kI I I I
I,, H--l!-! F tl+—++~~ 0
1 1 +-u
Advanced Resources International, Inc.A
0>7sa)SralM3u)(inCDL
Sia
4
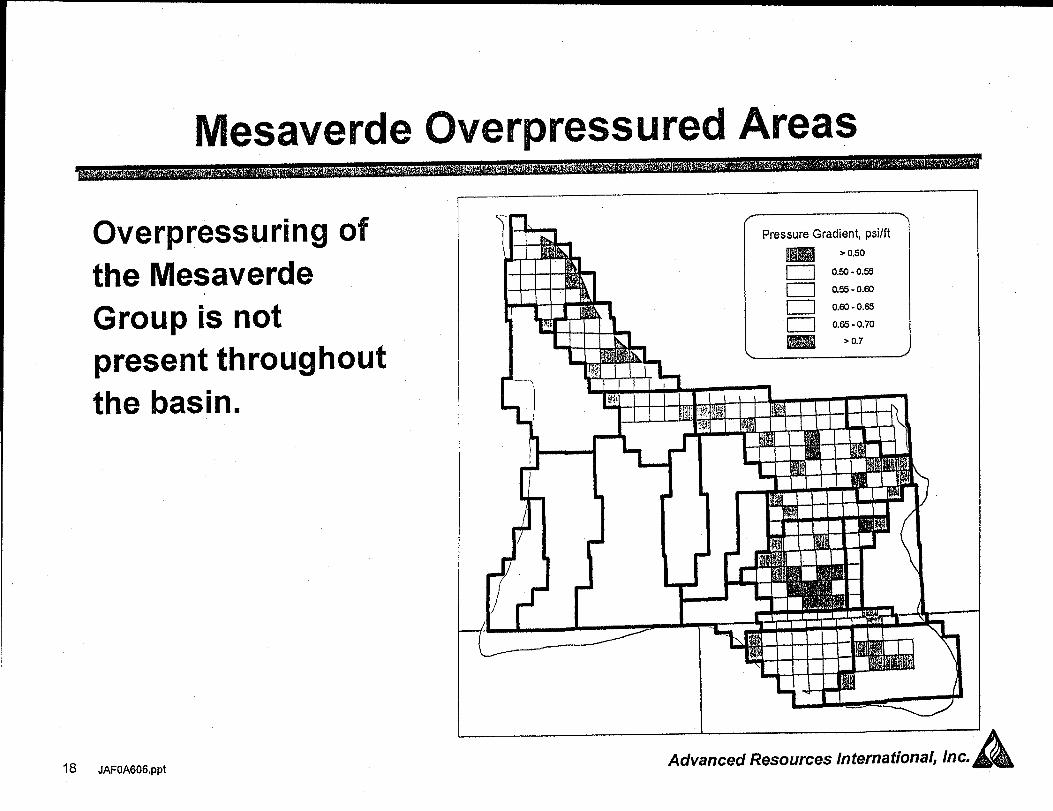
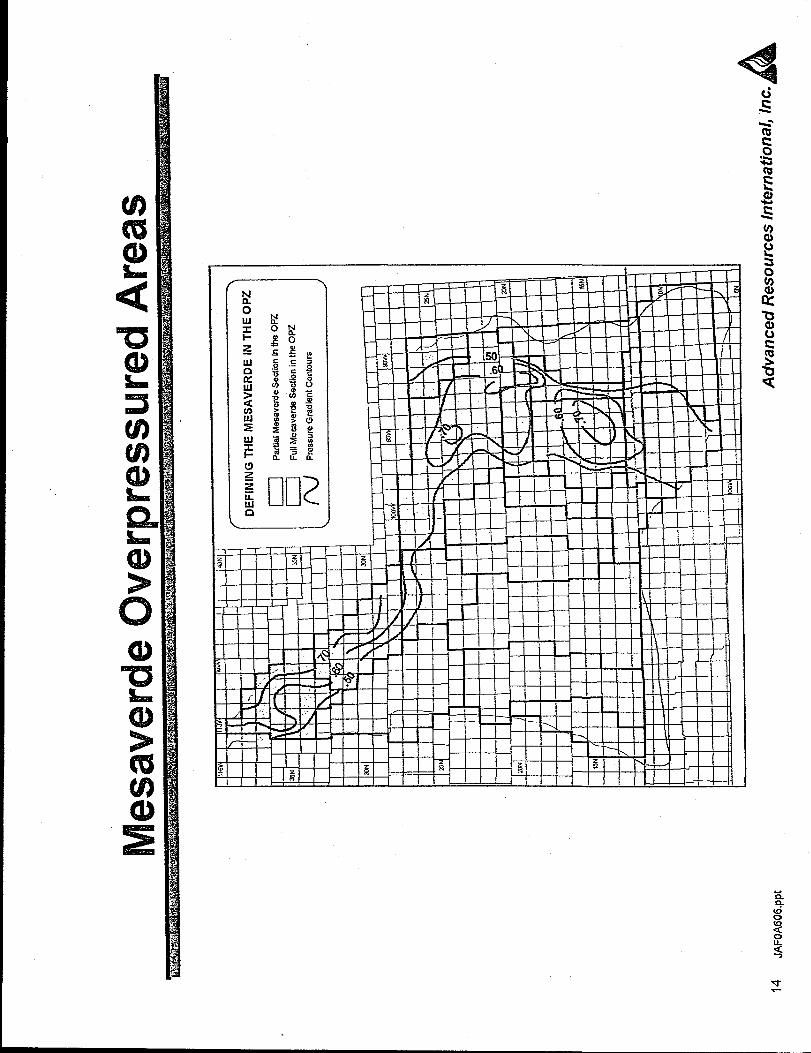
IMesaverde (34erpressured Areas
Overpressuring ofthe MesaverdeGroup is not
present throughoutthe basin.
18 JAFOA606,@
~ O,m-o.w
m O.= . ..70
L!.--.,L-1-l IA r
)I I [ 1 I
1 I I I 1 l-r I\
1
L J
Advanced Resources International, Inc.A
>
cooST5c)CL
99mCL
L
N
00u)N“
0
0
m ‘5%
n 5.7
m ~.g
n 9-tl
Net Sand Porosity
\ /
Mesaverde Parameters (cent’d)
m 11-13
m ,13 I
i
r
II
Iu- (t..
%
I —-.-...
IE?LJ%L ! Mesaverde Net Sand Thickness
_ l-5ort
m S1.150
m 151.250
h 1“ ~ 351.450
L4 I m 251.350
\
1 I I 11 I I 1 1 1 I f. I
IL L Y 1 r ‘.iNW~}I I I I I I ,
–L
(- I I 1 I
I III L I I 1
.
Net Sand Isopach
20
Porosity
JAFOA606.@Advanced Resources International, Inc.A
.
❑ E
Saa
mL
na
-1
/
(nCG
.
I
om-
(92
c)L
9’
oa,
Lu)El’-
-
a)
‘a0LQi9
EQ
ID0
20‘27
OJN
EC
CLa)
Ir
mI I
/&----- h-\
Cg
C5n
cou)a)
u)1-
L
Q
mw
u)mcl)L
4‘?3CDkitm
=
(n -u)a)LC2i!SsiR
(1)>
4
0La)
‘= %c .c)Sm
LLu 4:
1%
‘“+-JI
s8-
u)ma)L
m
■
EIL
us
I
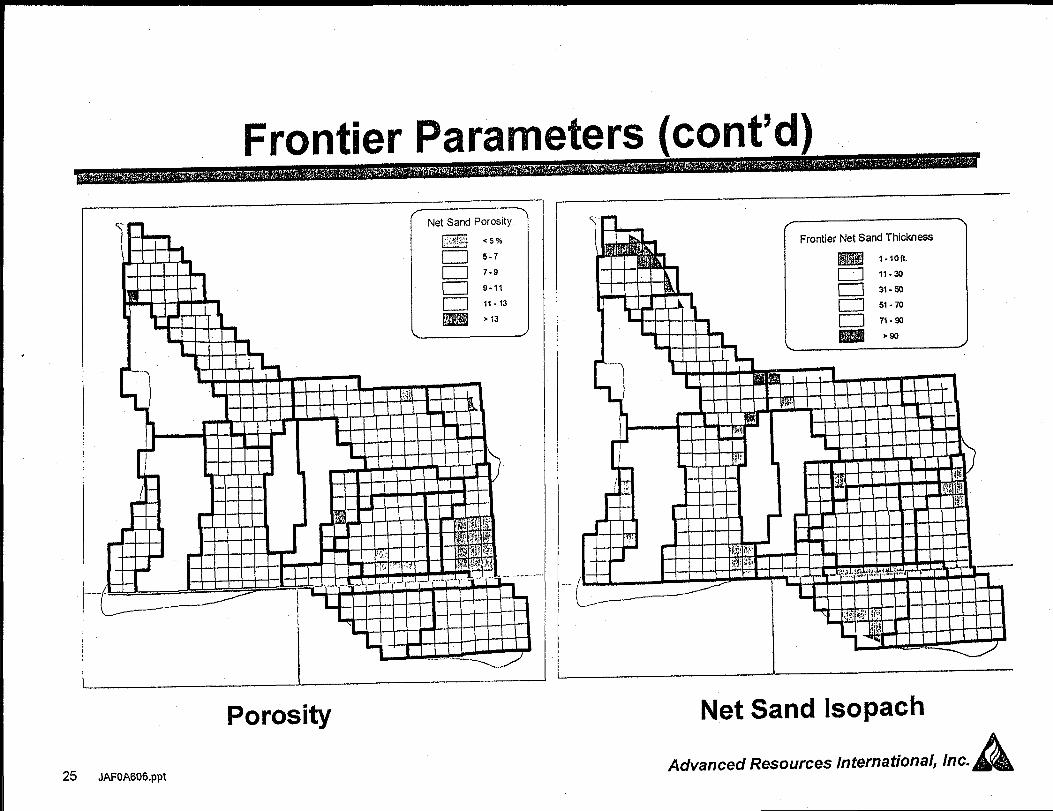
Frontier IIParameters (cent’d)
>
25
IiEbl..,.
I
Net Sand Porosity
m ‘“m 5-7—_-
11 U
u 7-9
m 9.11
m 11-13
= >13
Ji!iI
l+-++ d+H–HT’–
Porosity
JAFOA606.ppt
I
Net Sand Isopach
Advanced Resources International, Inc.A
o
mCL
L
oL
LL9
.W
s
0s
a) aL
zs0
Q)s3
s-
420U)
a)
0 a)Q
mn
u’)m?3)
a)EC’!5u)
CGa)L
Cf3 U)mm
I●
r=N
Greater Green River E3asinRegionalPatiitioning and High-Grading
Structural Characterization
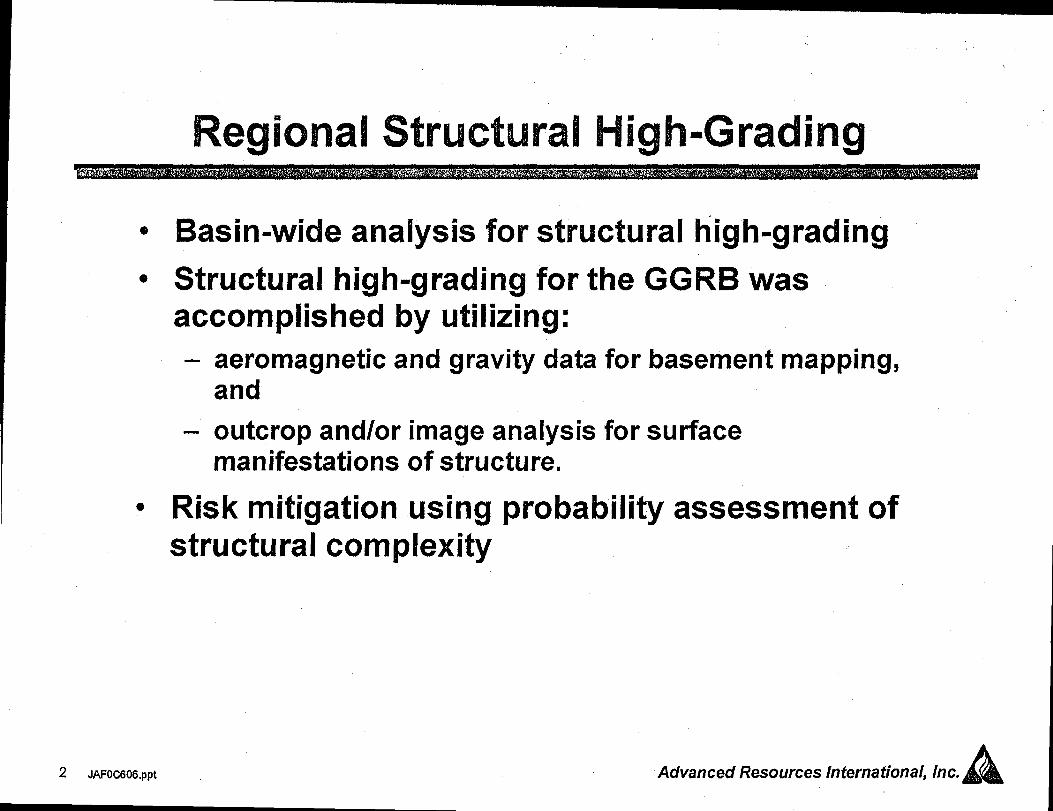
Regional Structural High-Grading
o Basin-wide analysis for structural high-grading
~ Structural high-grading for the G(3RB wasaccomplished by utilizing:
aeromagnetic and gravity data for basement mapping,and
outcrop and/or image analysis for surfacemanifestations of structure.
● Risk mitigation using probability assessment ofstructural complexity
2 JAFOC606.ppt Advanced Resources International, Inc.A
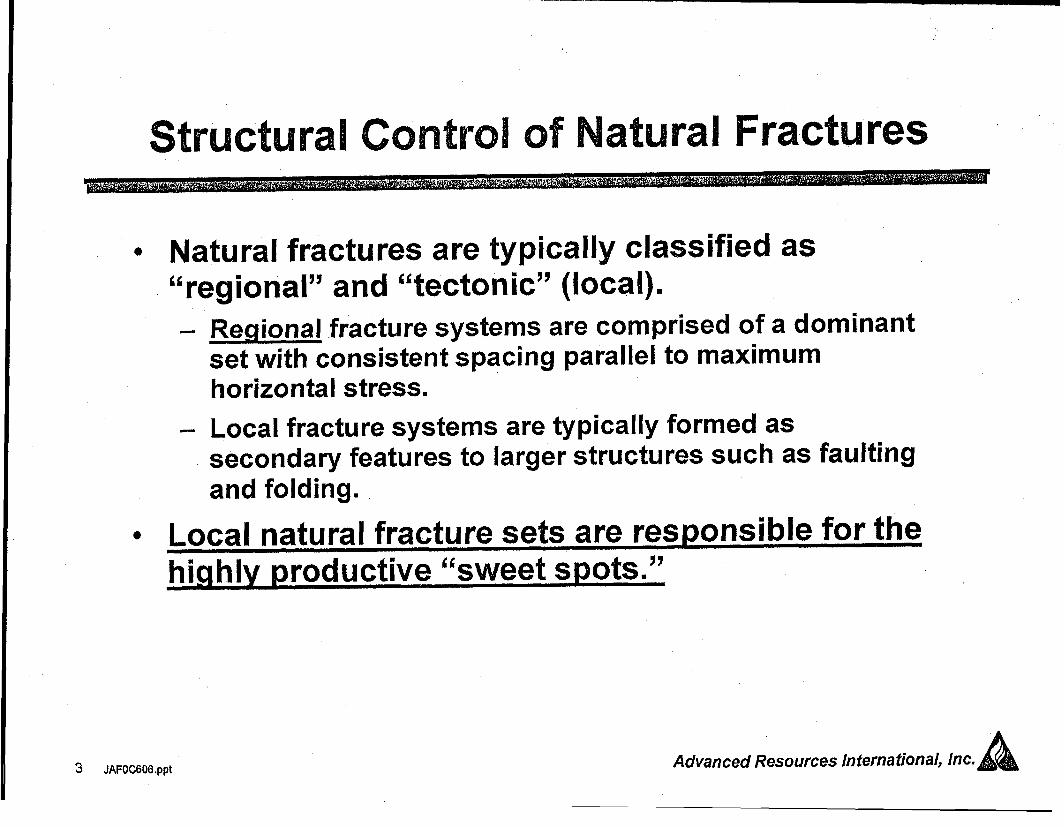
Structural Control of Natural Fractures
● Natural fractures are typically classified as“regkmal”and“tectonic”(local).
-
Regional fracture systems are comprised of a dominantset with consistent spacing paraUel to maximumhorizontal stress.
Local fracture systems are typically formed assecondary features to larger structures such as faultingand folding.
● Local natural fracture sets are responsible for thehighly IPreductive “sweet spots.”
3 JAFOC606.p@ Advanced Resources International, Inc.A
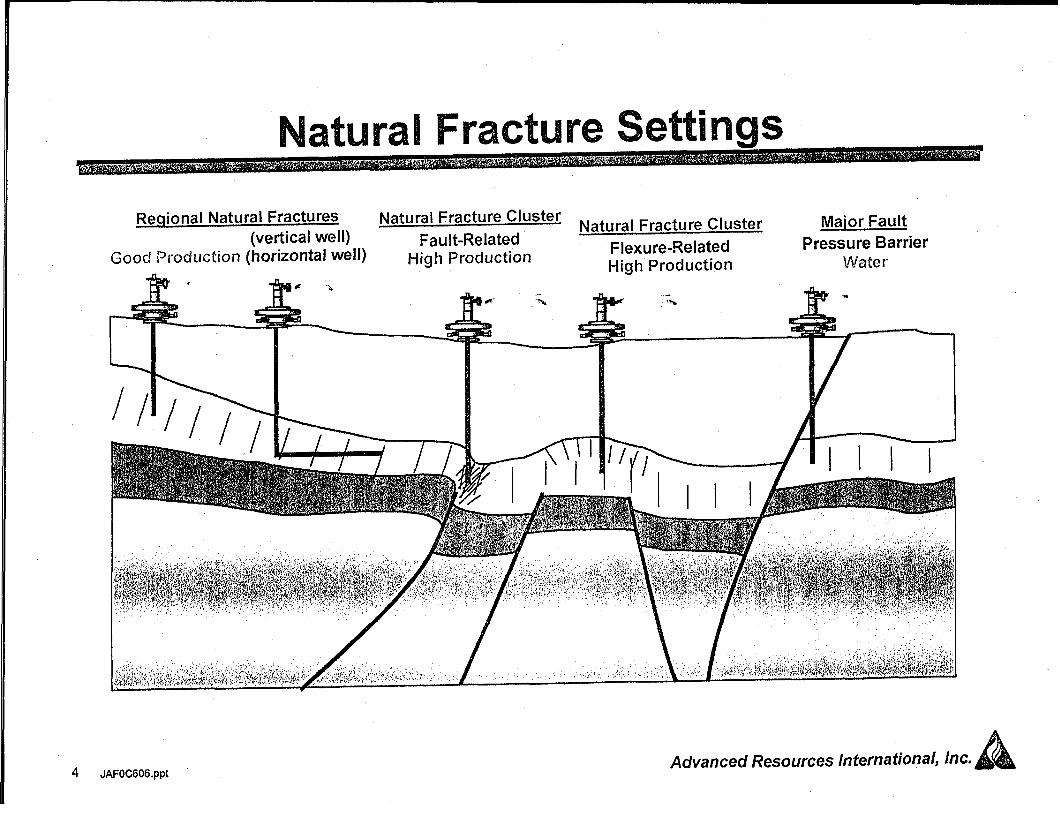
Natural Fracture Settings
Reqional Natural Fractures(vertical well)
Good Production (horizontal well),
r//
Natural Fracture Cluster Natural Fracture Cluster Maior FaultFault-Related
High Production
Fd ‘-< .
Fiexure-Related Pressure Barrier
High Production ~J~ater
* ,% *.
4 JAFOC606,pptAdvanced Resources International, Inc.A
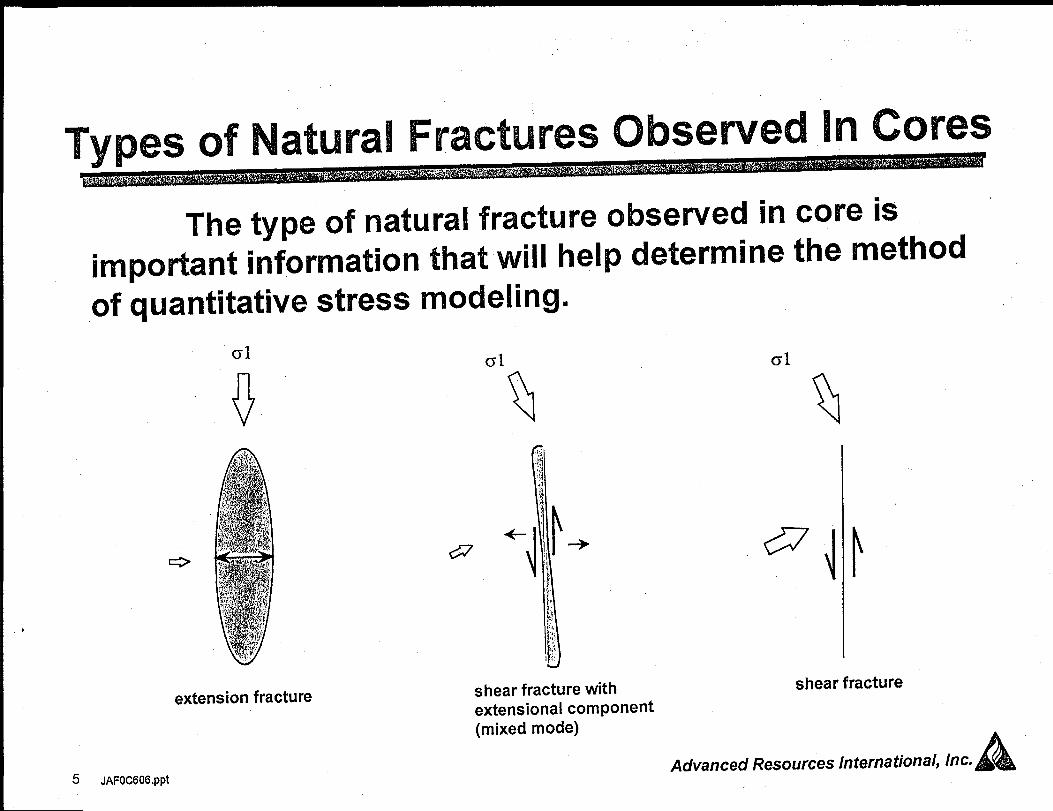
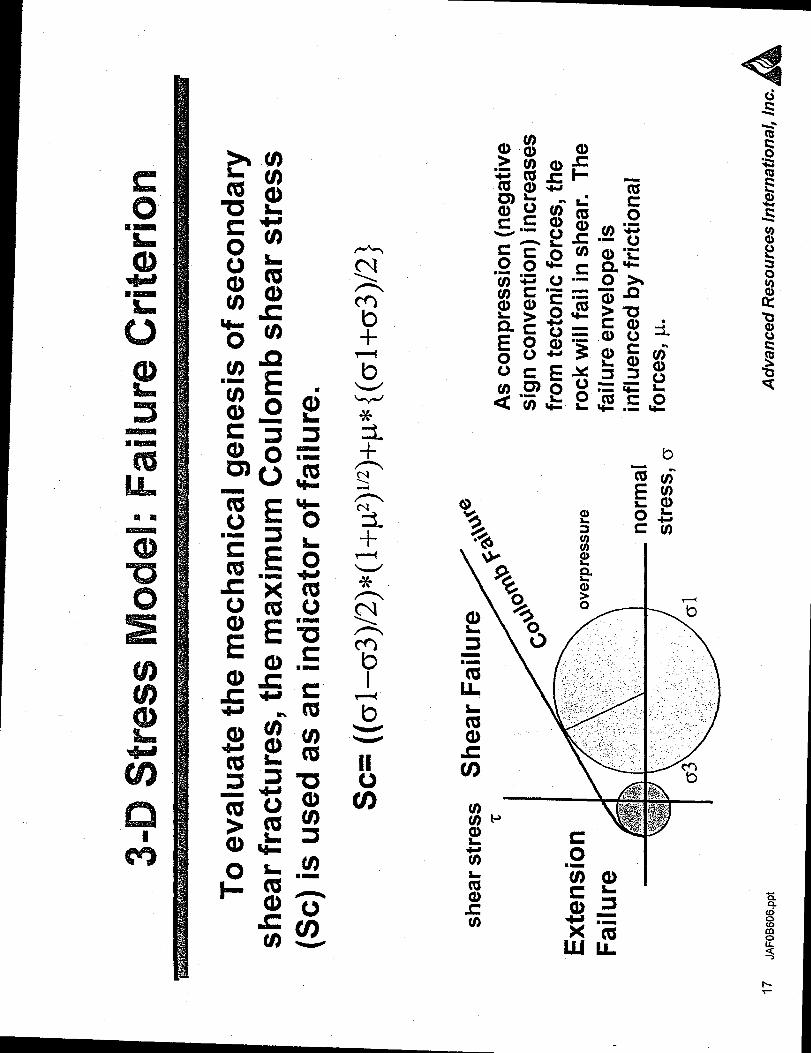
Types ofNatural Fracttires Obsemed In Cores
The type of natural fracture observed in core isimportant information that will help determine the methodof quantitative stress modeling.
extension fracture
5 JAFOC606.ppt
shear fracture withextensional component(mixed mode)
01
Q
shear fracture
Advanced Resources International, Inc.
Structural High~Grading
- Delineate regions of significant structural “complexity.”
~ Rationale
Since local natural fracture development is directlyrelated to local structural features, mapping regionswith significant occurrences of basement and surfacestructures identify areas prone to local naturalfracturing.
Q Results
– Regions graded by density and correlation of significantstructures.
6 JAFOC606,@ Advanced Resources International, Inc.A
a)EC
0u)
s%al)
EQ)
LLl
cm6
u?mmL
a)>
06
ti
ca)(DL
aLCD
ma)L
:Moxa i%ch - l..l.—s——
u)a-
8-
U)mal
?)m
0
(i)
-
tos
■-U)mms2Q3u)
■ ■
U)c1)
mm
cu)m
m
4
8
ms1,
c0
su)m
Q
co
■ ■
u)Qi)
n-
Cls
E0c4ca)
E0U)asm
mmae)
mmism
CDcm
C6
Ec)L
a)<
E
so
ILmcl)w
.
a)
0sCG
E0u
0)
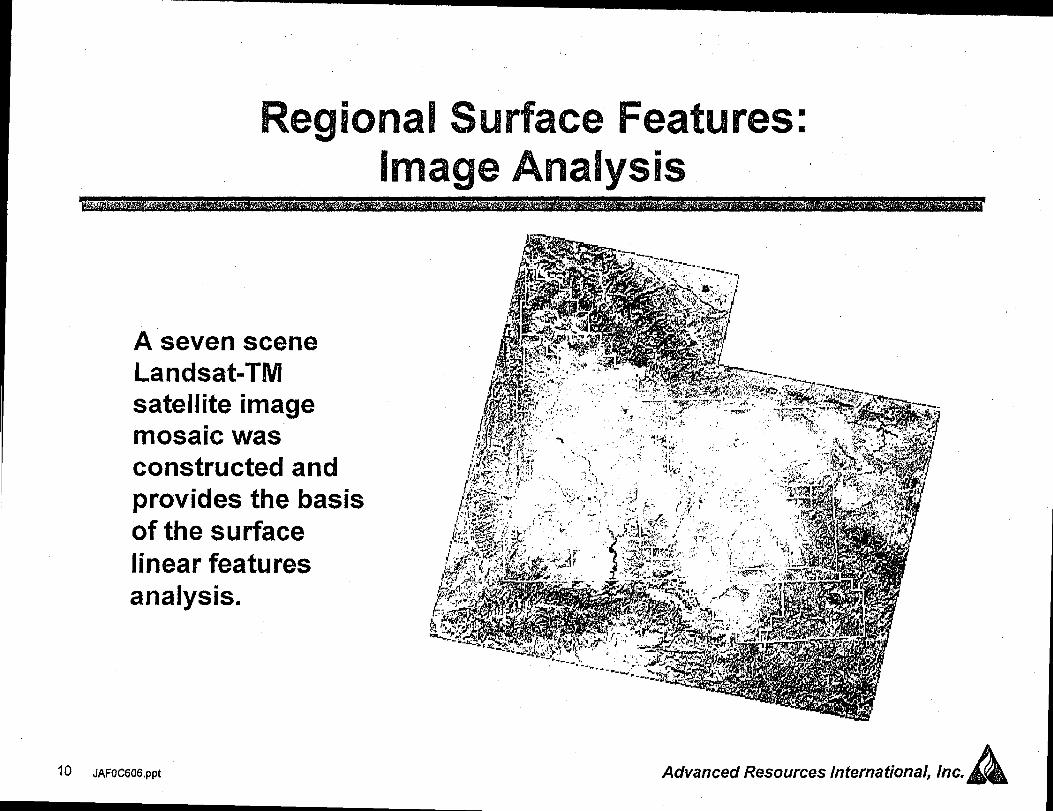
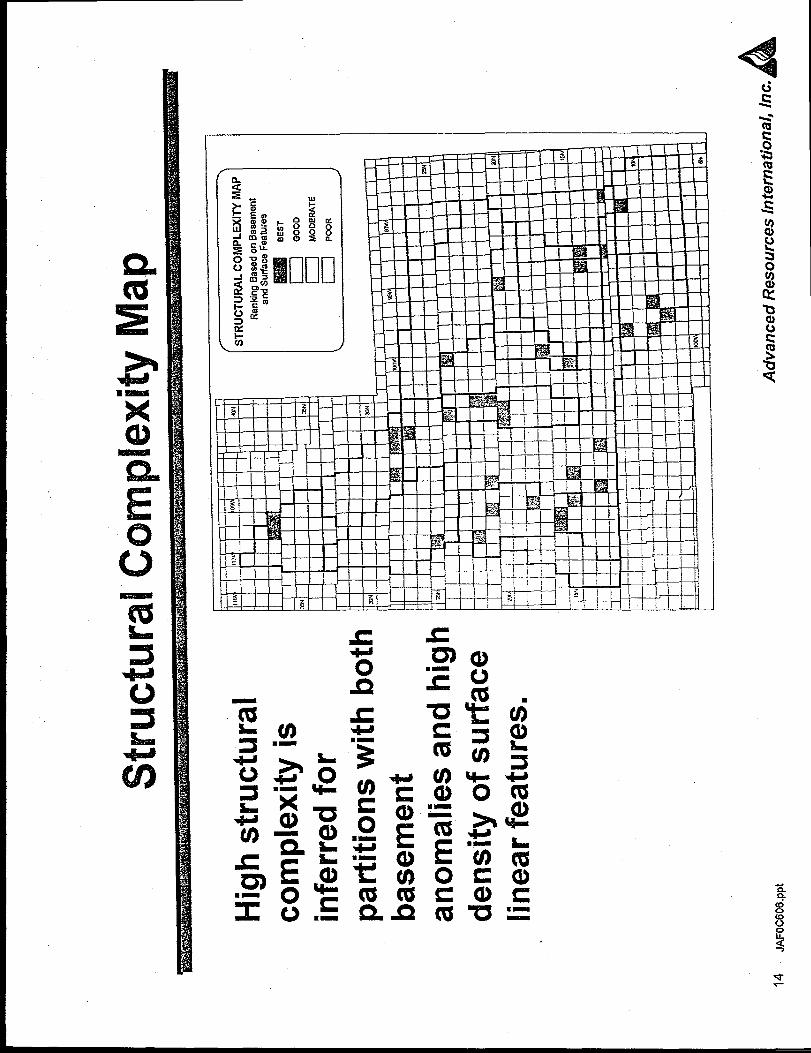
Regional Surface Features:Image Analysis
A seven sceneLandsat-TMsatellite imagemosaic wasconstructed andprovides the basisof the surfacelinear featuresanalysis.
I o JAFOC606.ppt Advanced Resources International, h. ‘1
❑ m
(&3
73
c
c1)
Smm
F-’
Q)
cl)
m
SEsm
3
m
tn
aso
Uail
mt
ou)m ‘5
E vi
‘“L4
:,
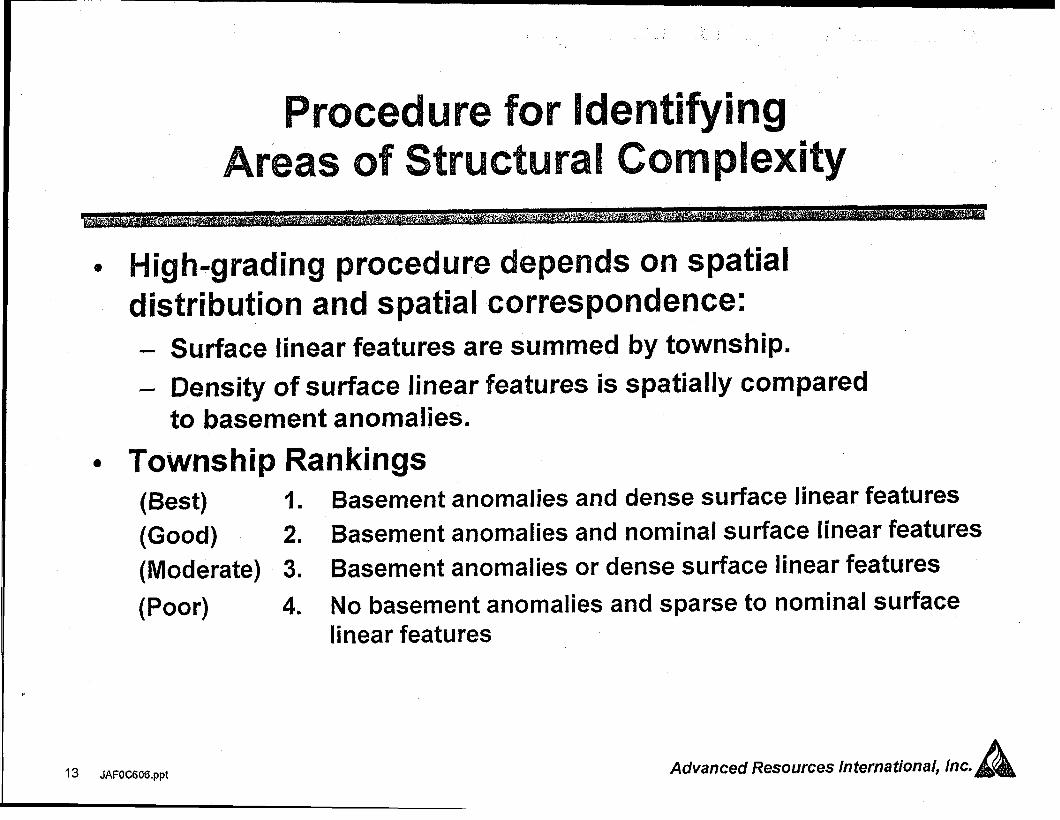
Procedure for IdentifyingAreas ofStructural Complexity
6 High-grading procedure depends on spatialdistribution and spatial correspondence:– Surface linear features are summed by township.
- Density of surface linear features is spatially comparedto basement anomalies.
c Township Rankings(Best) 1. Basement anomalies and dense surface linear features
(Good) 2. Basement anomalies and nominal surface linear features
(Moderate) 3. Basement anomalies or dense surface
(Poor) 4. No basement anomalies and sparse tolinear features
linear features
nominal surface
~3 JAFOC606.ppt Advanced Resources International, Inc.A
QCG
CL
Eo(u)
UI
m& u’)8-
QE0
a)s
E-
mmQQ
73sCGma)
9-
m
Patiition Structural Characteristics
● As the final step in the structural high-grading,the distribution of structural ranks in eachpartition is ~alculated.
Q Distribution is analogous to EUR distributionsince well productivity is related to local fracturesystems.– This distribution is necessary for developing
appropriate wellespecially those
15 JAFOC606,ppt
distribution for each partition,partitions with limited well information.
Advanced Resources International, Inc.A
.“
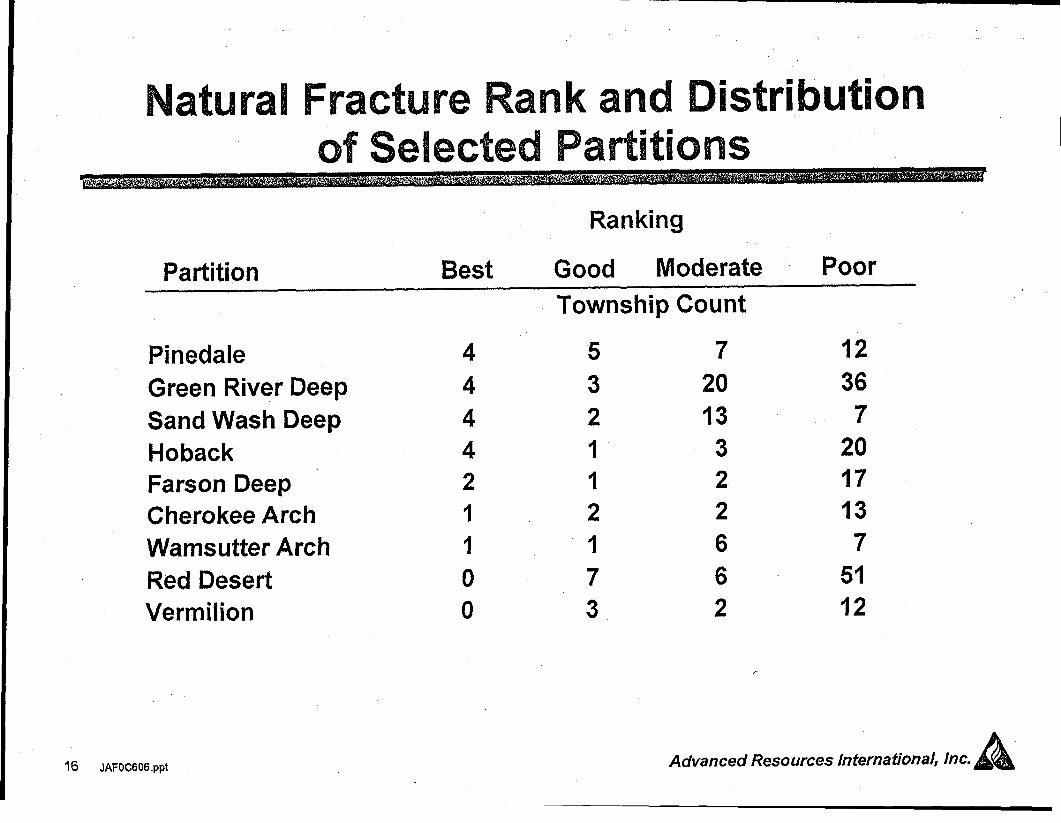
Natural Fracture Rank and DistributionI
ofSelected Partitions I
Ranking
Partition Best Good Moderate Poor
Township Count
Pinedale
Green River DeepSand Wash DeepHobackFarson DeepCherokee ArchWamsutter ArchRed DesertVermilion
444421100
532112173
72013
322662
1236
72017137
5112
16 JAFOC606.ppt Advanced Resources International, Inc.A
Greater Green River Basin RegionalPatiitioning and li-ligh=Grading
Resource Recovery Economics
integration ofNatural FractureProspectivity with Resource Assessment
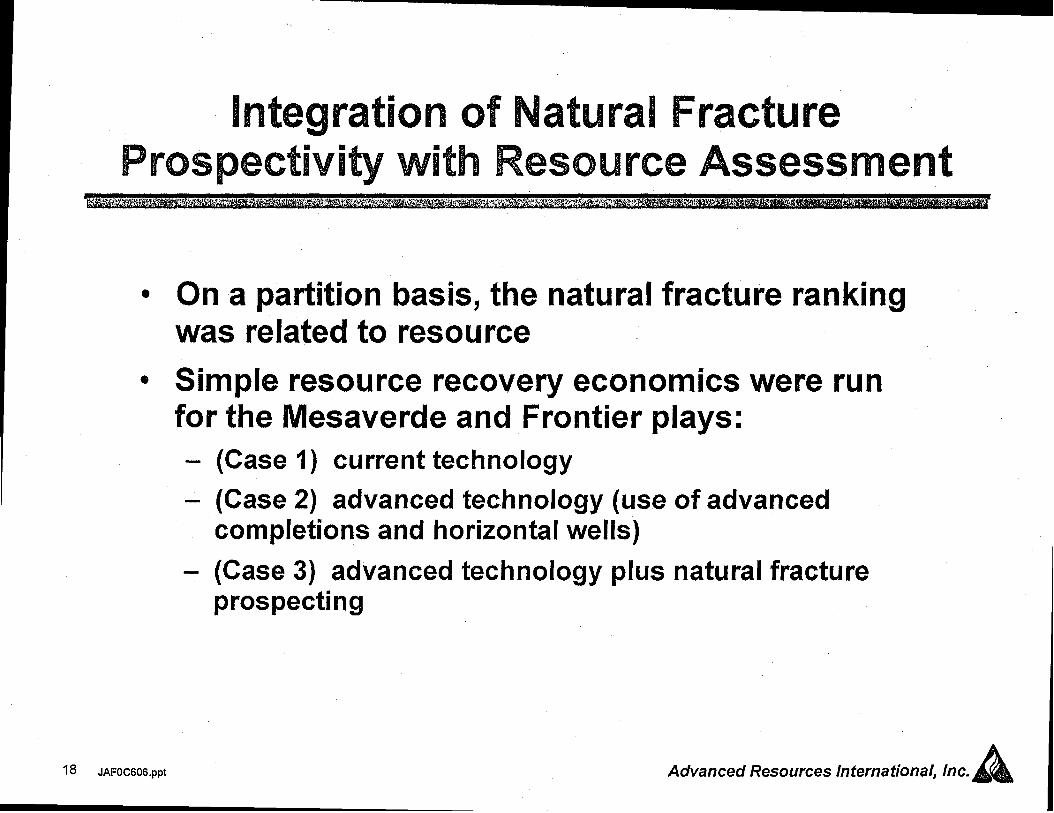
* On a partition basis, the natural fracture rankingwas related to resource
Q Simple resource recovery economics were runfor the Mesaverde and Frontier plays:
f 8 JAFOC606.Ppt
(Case 1) current technology
(Case 2) advanced technology (use of advancedcompletions and horizontal wells)
(Case 3) advanced technology plus natural fractureprospecting
Advanced Resources International, Inc.A
73a)Nh
Q)1-
E
a)z=a)s8-
&
●
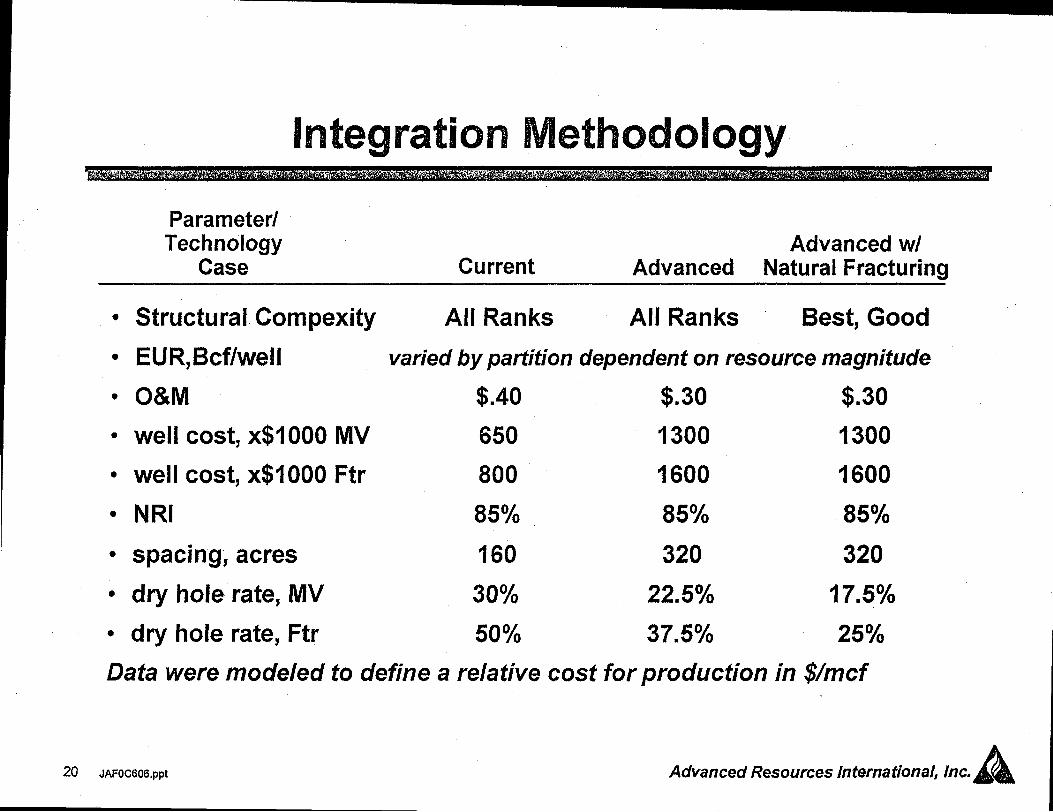
Integration Methodology
ParameterTechnology Advanced WI
Case Current Advanced Natural Fracturing
●
●
●
●
●
●
●
●
●
Structural Compexity All Ranks All Ranks Best, Good
EUR,Bcflwell varied by partition dependent on resource magnitude
O&M $.40 $.30 $.30
well cost, x$1000 MV 650 f300 1300
well cost, x$1000 Ftr 800 1600 1600
NRI 85% 85% 85%
spacing, acres 160 320 320
dry hole rate, MV 30% 22.5% 17.5%
dry hole rate, Ftr 50% 37.5% 25%
Data were modeled to define a re[ative cost for production in $/mcf
20 JAFOC606.ppt Advanced Resources International, he.A
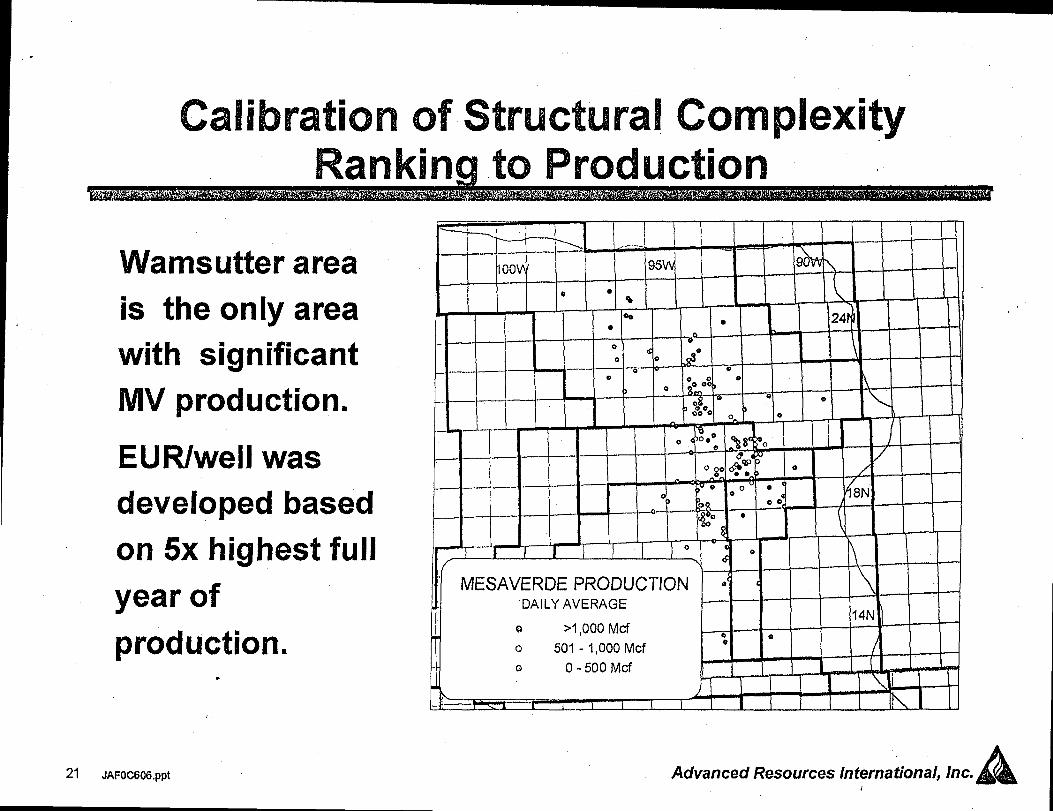
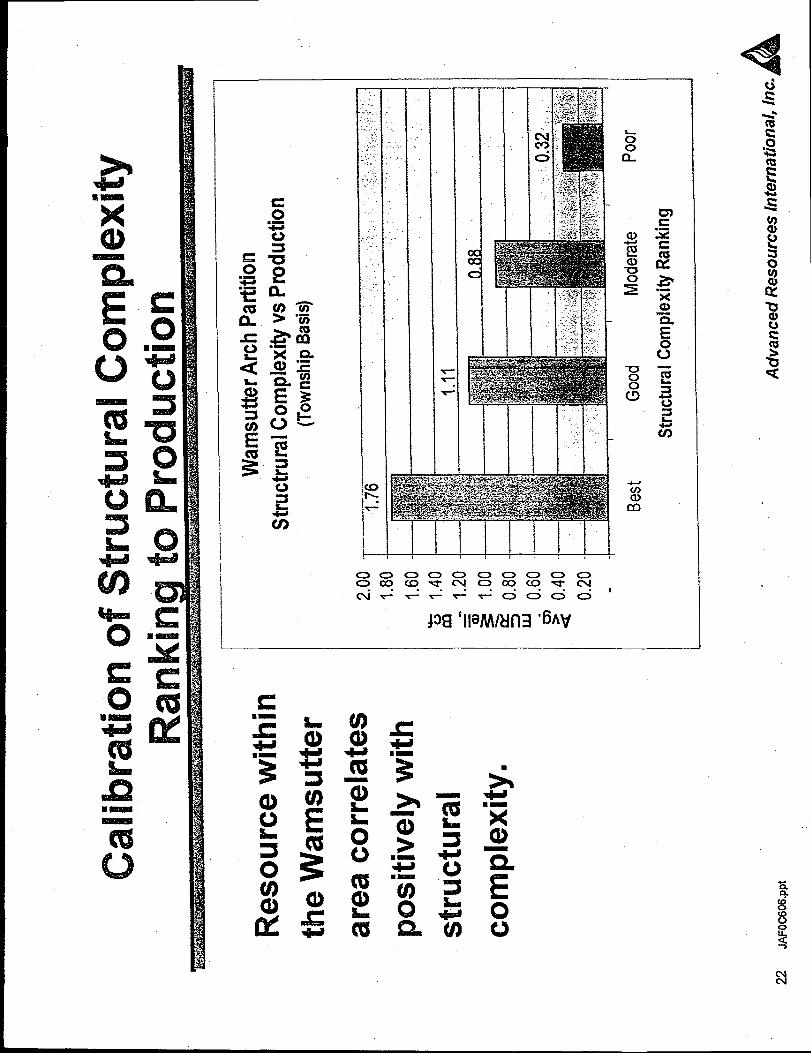
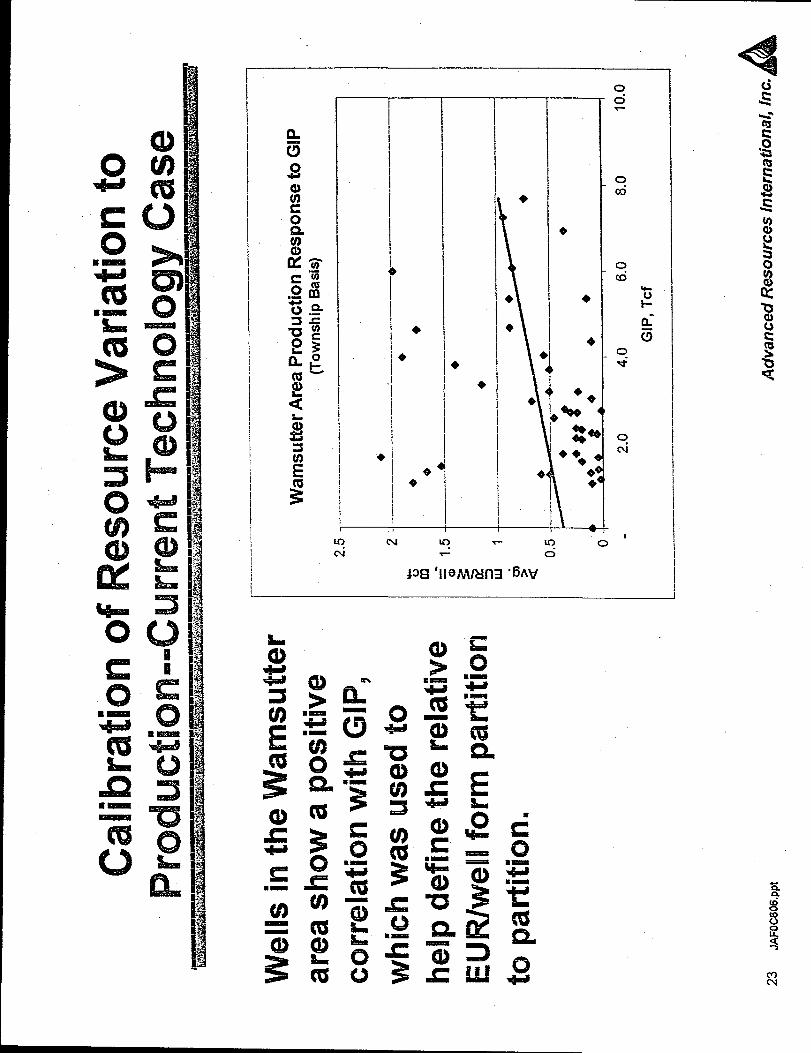
Calibration of Structural ComplexityRankina to Production
Wamsutter area
is the only area
with significant
MV production.
ElJR/well was
developed based
on 5x highest full
year of
production.,
21 JAFOcX06.ppt
1
-f----- ‘ ‘:--J_ ~ .—J . I—.—.—-1Oow~ 95W 9 \ I
e ●
%%
● 1.● n@Q G0 e a—F4 u e
Q e 0
> 0~o 0%
I
am
.8e e e
o~ooa ~ $9 \
0
—
e— .— —
?—
-~ I ! I0
MESAVERDE PRODUCTIONDAILY AVERAGE
Q >1,()()()Mcf
o 501-1,000 Mcf
0 0-500 Mcf
J—.— 1 I I
Advanced Resources International, Inc.Ad
xa)
CL
Ec)Call
c)
Uis2m6
1t I
00000000 00arx)m-a-o.locom *GJ
a)
CD9s
alm
o
D-
aEn
Siuaes>a!)CzJ!kiFa
0v)CDI13iz
—
o
om-
mSsuu
Ec2m5
m(5)
o0
0m-
0&
0-+
1
C#)-
CD
i!=
0
h
u=0
Q75G 0 m
N
m
ad)—
c)&l!4i
u)%DI13i!t
e)
S3i
as%s)
toCDcoCG(E+)
0
a)+
al)?3cm
—-zii!%
o
CJ?)
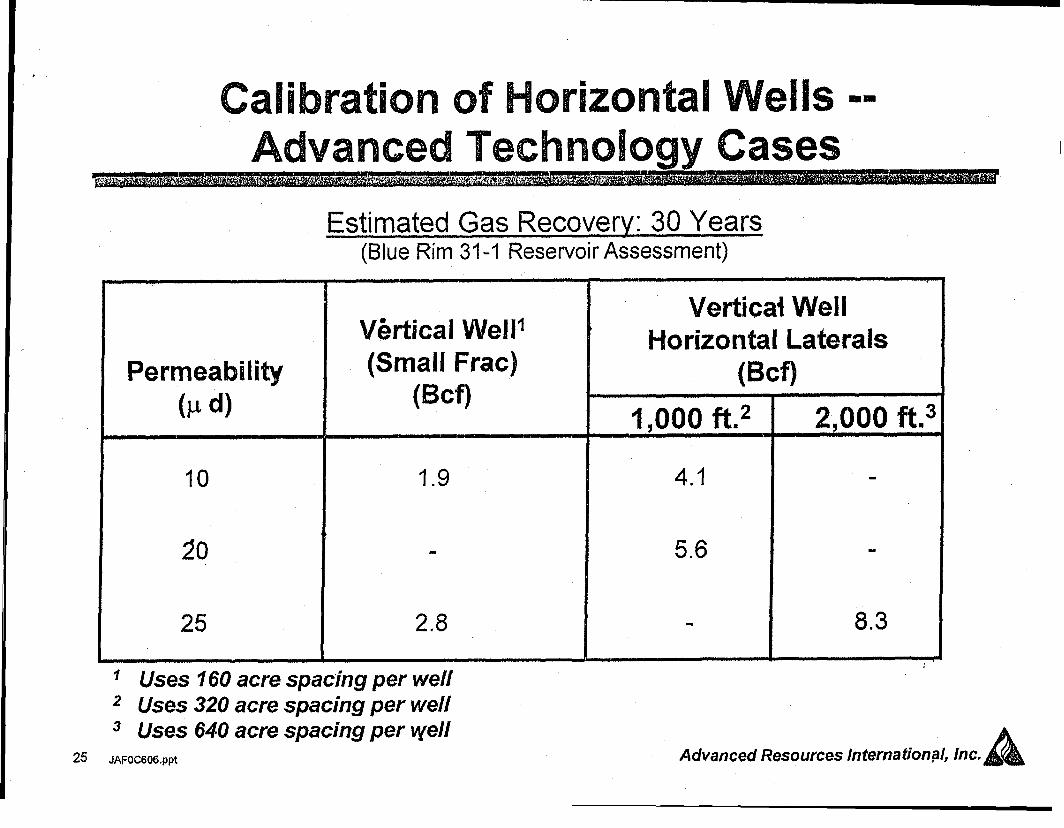
Calibration ofHorizontal WellsAdvanced Technology cmiixi?s
Estimated Gas Recovery: 30 Years(Blue Rim 31-7 Reservoir Assessment)
Vertical WellV&tical VWellf Horizontal Laterals
Permeability (Small Frac)(Bcf)
(Bcf)(~ d)
1,000 ft.2 2,000ft”310 1.9 4.1
5.6
25 2.8 8.3
20
7 Uses 760 acre spacing per well2 Uses 320 acre spacing per well3 Uses 640 acre spacing per yell
25 JAFOBOQ@ Advanced Resources International, Inc.A
1,000
750
500
250
0
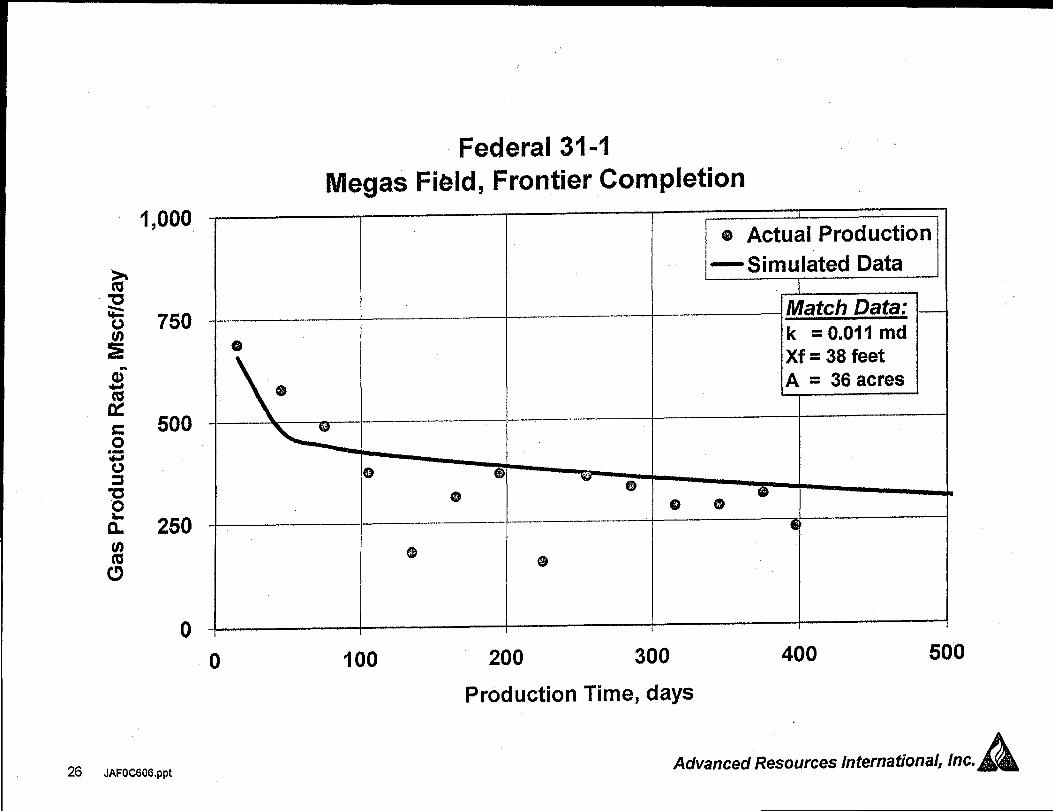
Federal 31-1
Megas Field, Frontier Completion
o
26 JAFOC606.ppt
I
o Actual Production—Simulated Data
Match Data: —_— .—k
4?= 0.011 md
Xf = 38 feetA = 36 acres
—.—.
at@ 4! )49
.—— —.. a‘
@ @
100 200 300 400 500
Production Time, days
Advanced Resources International, inc.A
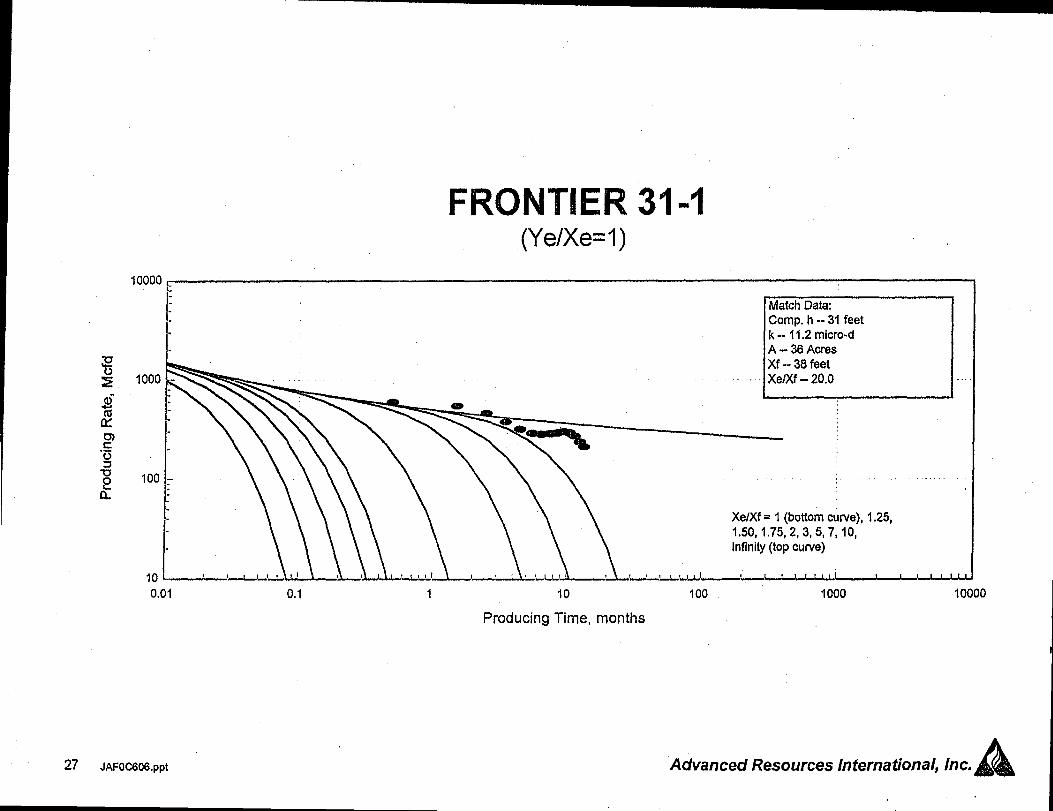
FRONTIER 31-1(YelXe=l)
10000 ~
MatchData:Comp. h -31 feetk-- 11.2 micro-dA-36 Acres
Xf --38 feet
Xe/Xf -20.0 .
100 - . . . . . .
Xe/Xf = 1 (bottom curve), 1.25,1,50,1,75,2,3,5,7,10,Infinity (top curve)
10 ~‘-1—LLLL~—~~
0.01 0.1 1 10 100 1000 10000
Producing Time, months
27 JAFOC606.ppt Advanced Resources international, Inc.A
5
4
3
2
1
0
.
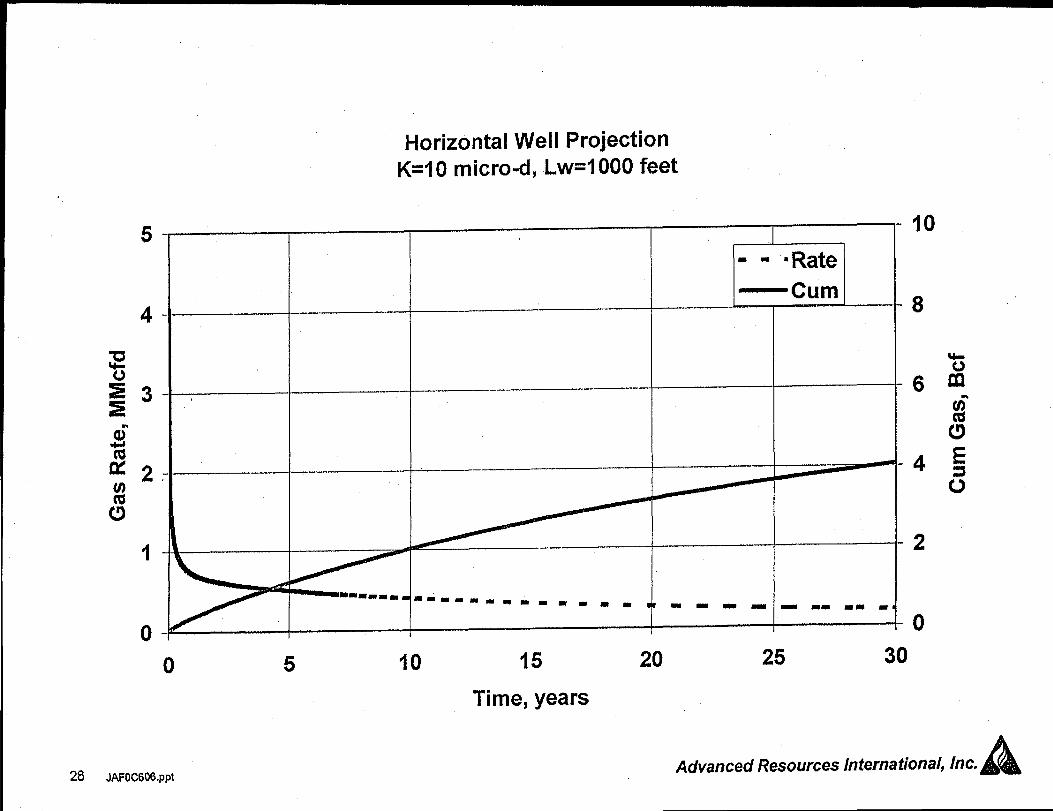
Horizontal Well ProjectionK=l O micro-d, Lw=l 000 feet
0
28 JAFOC606.ppt
10 15 20
Time, years
25 30
10
8
6
4
2
0
Advanced Resources international, Inc.A
E
1
\
E
a9
0m
u)N
0N
m
0
U3
0
(nN
0
30 JAFO@@5,pPt
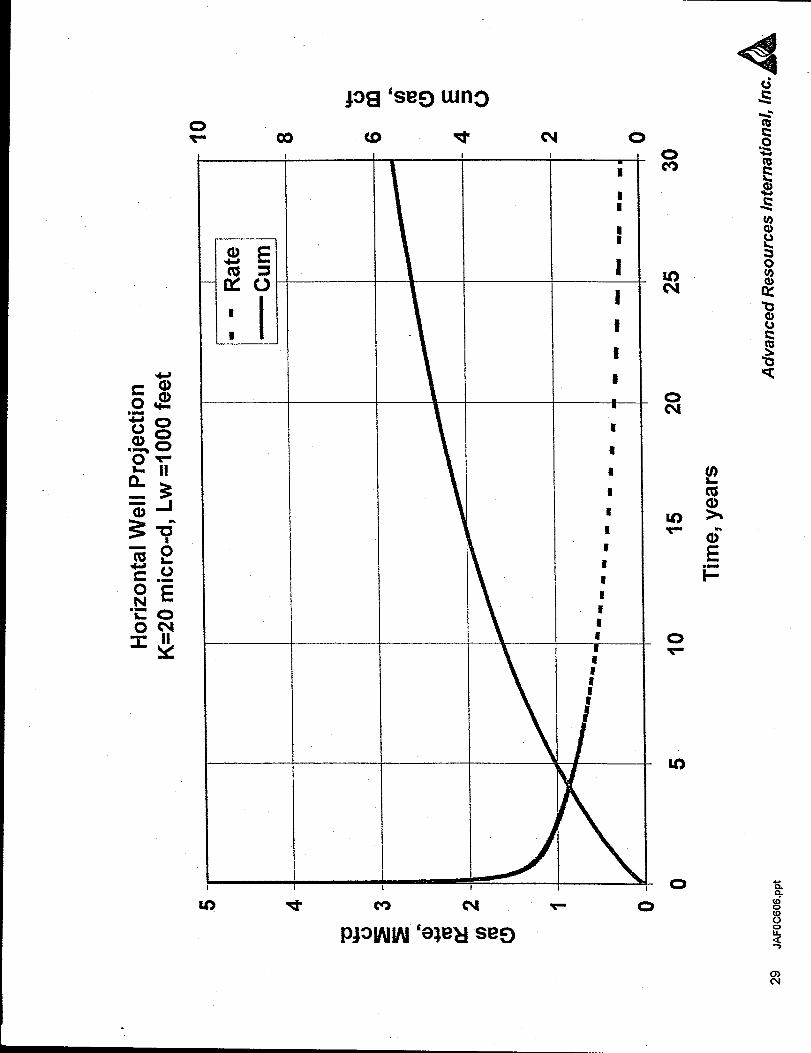
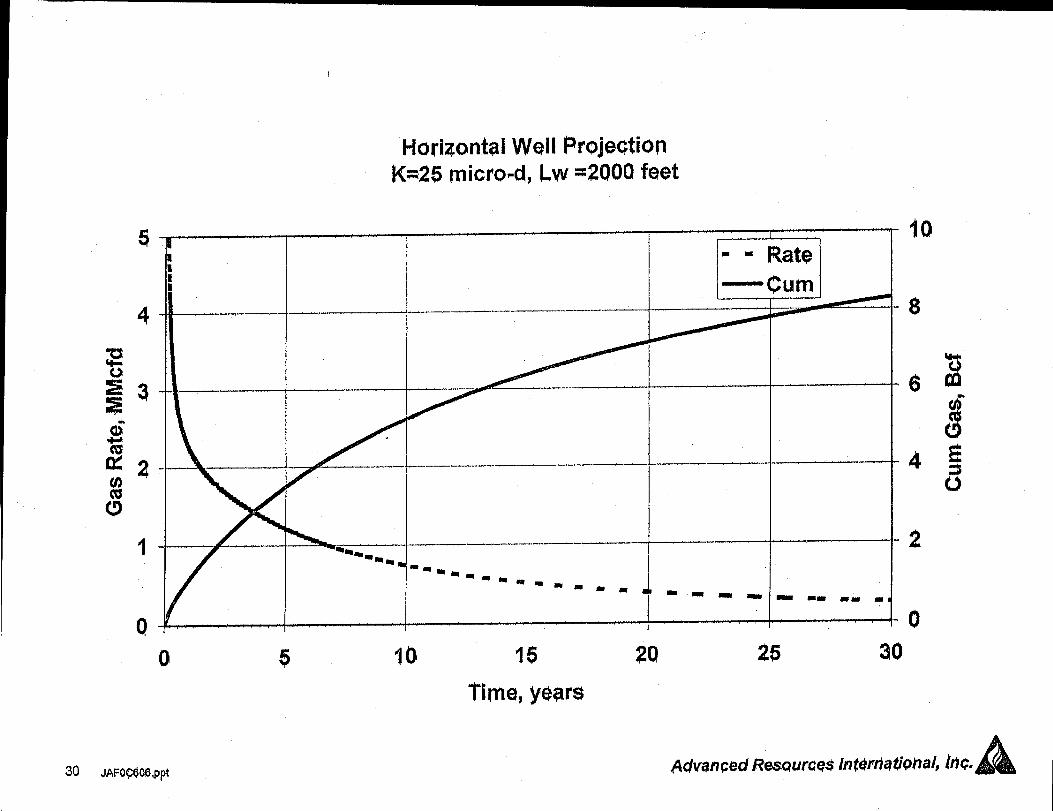
Ilariaonttd WQIIProjectionIW$ tnicrchd, M =2000 feet
1 . ;2-mm Rat@—qlm
.—.—. _.— . ...-———-----—- — ...
—-. L ——.
~ ~~——-— -..——.—---- —--—.—. ———
..-———.—.——-—-.-%. -118m-~mmmm-98- mm”” a1 m--- - mmmm-
-10
:-8
--6
-4
--2
1-0
16 2Q 25
$Mfw?ced R?SQWW$ ln@wk#tiphal, b)c.
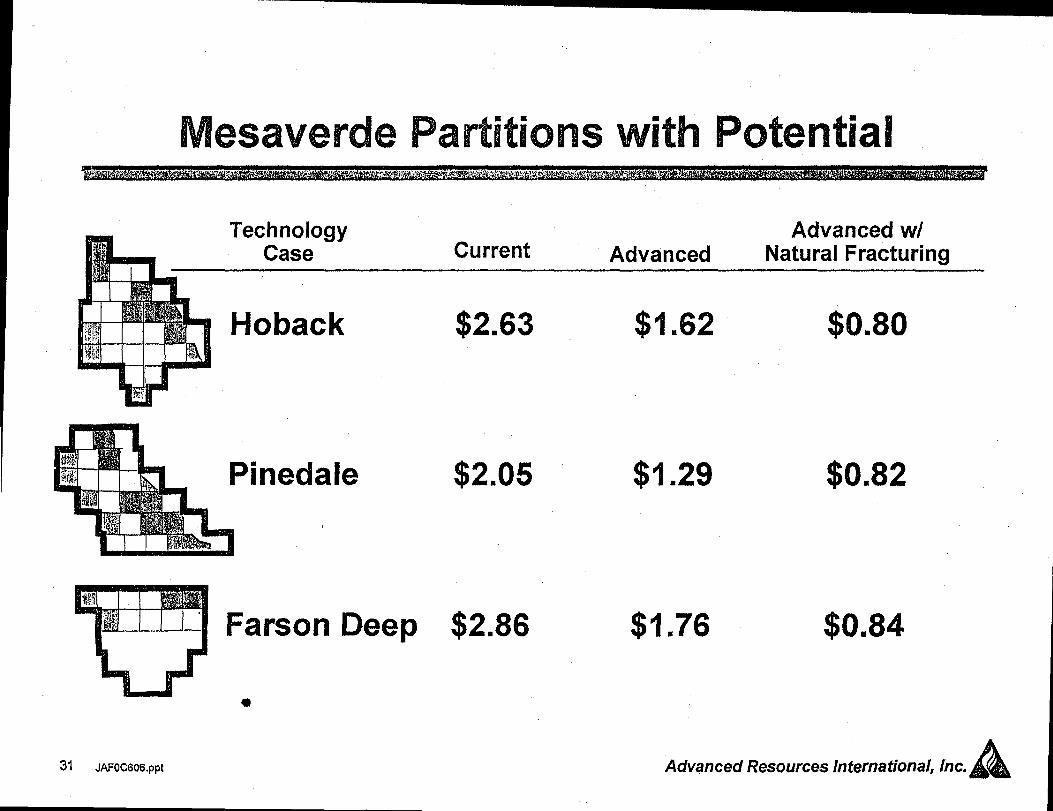
Mesaverde Patiitions with Potential
kTechnology Advanced wt
Case Current Advanced Natural Fracturing
h Hoback $2.63
inedaleI
$2.05
Farson Deep $2.86
●
31 JAFOC606,ppt
$1.62
$1.29
$0.80
$0.82
$1.76 $0.84
Advanced Resources international, Inc.A
mu)
i“-OmN*
-mC’9
CQ
om,m*
od’
9
4.g
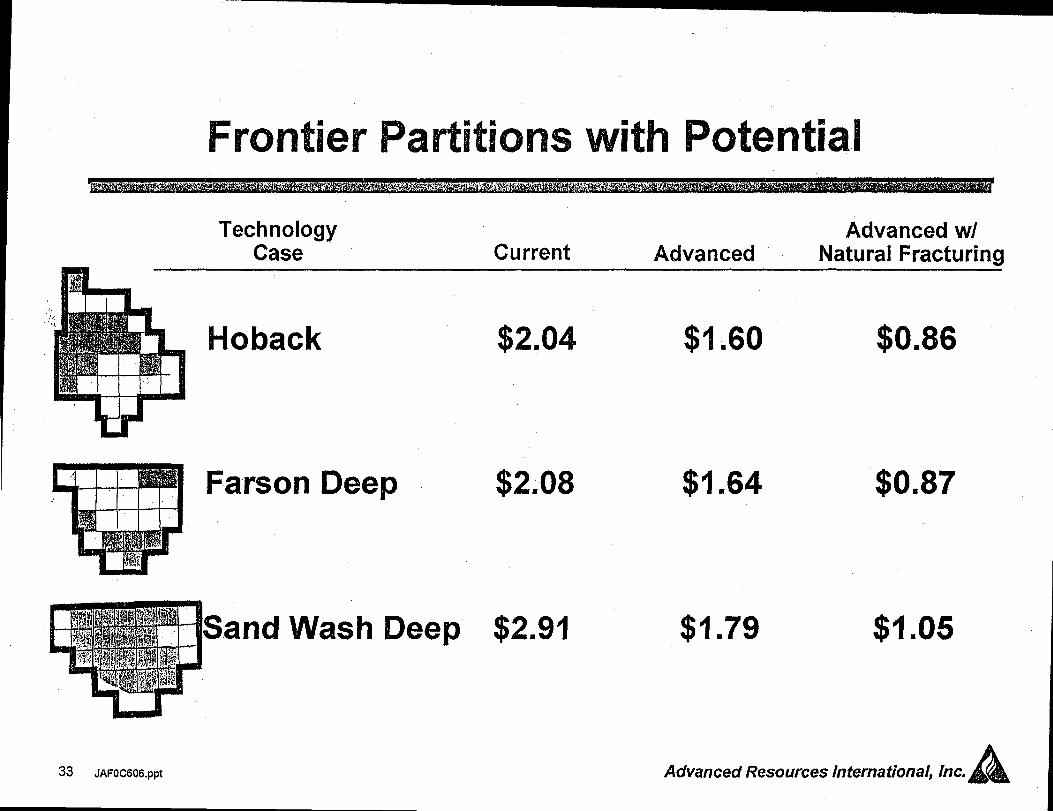
Frontier Patiitions with Potential
Technology Advanced WICase Current Advanced Natural Fracturing
m.,..’;’
Hoback $2.04 $1.60 $0.86
Farson Deep
Sand Wash Deep
33 JAFOC606.ppt
$2.08
$2.91
$1.64 $0.87
$1.79 $1.05
Advanced Resources International, k. A
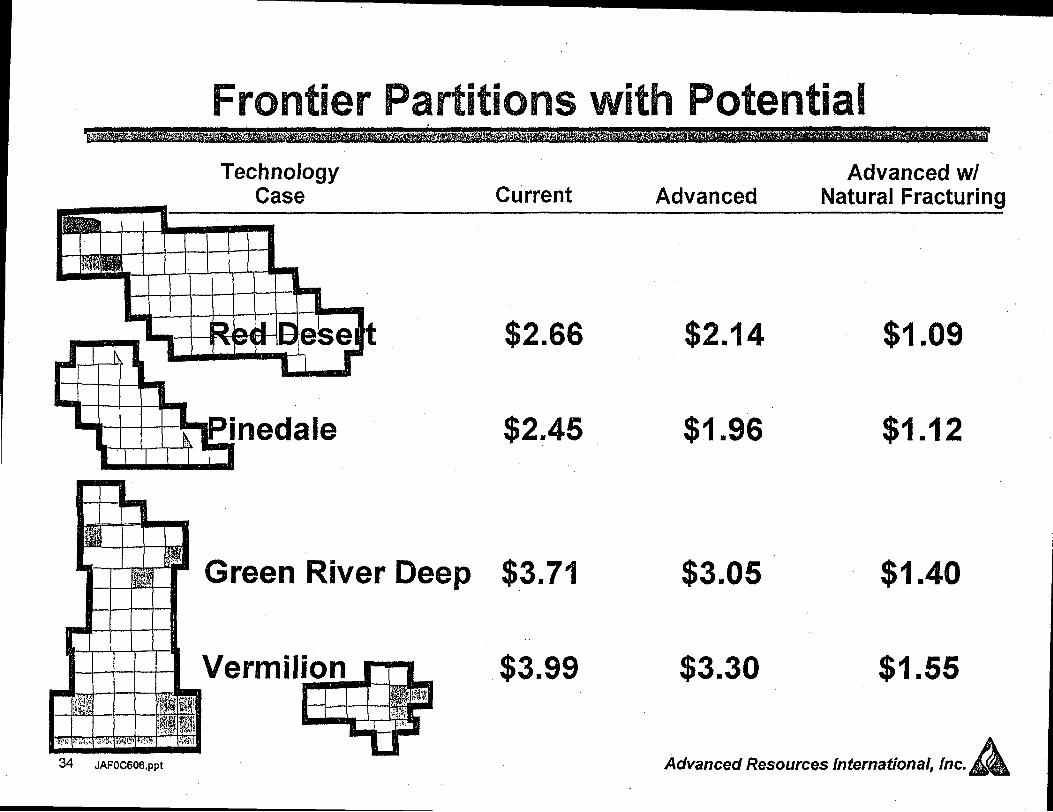
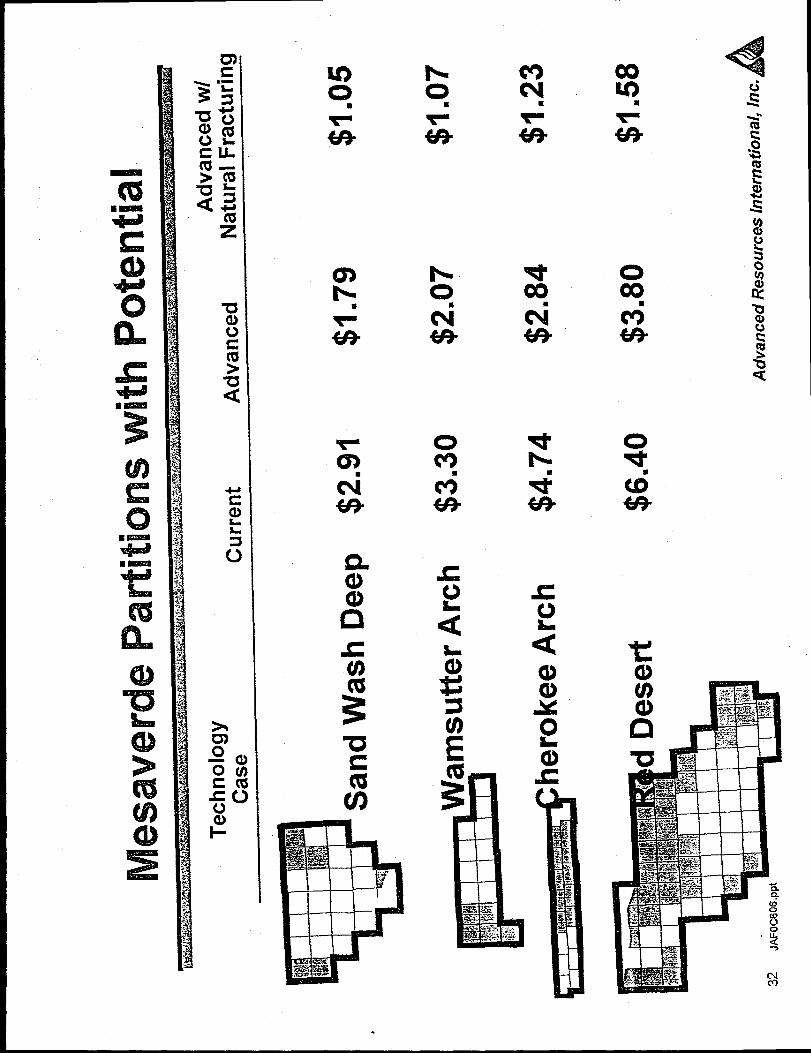
Frontier Patiitions with Potential
TechnologyCase
nedale
Green River Deep
Vermil-
34 JAFOC606,ppt
Advanced WICurrent Advanced Natural Fracturing
$2.66
$2.45
$3.71
$3.99
$2.14
$1.96
$1 “09
$1.12
$3.05 $1.40 ,
$3.30 $1.55
Advanced Resources [international, lnc,

& tin
73a
-aE 3
0($) 0
Ea)u)mm
m
Cna)
?3m-
u)C’GC3
Em
m-c
e
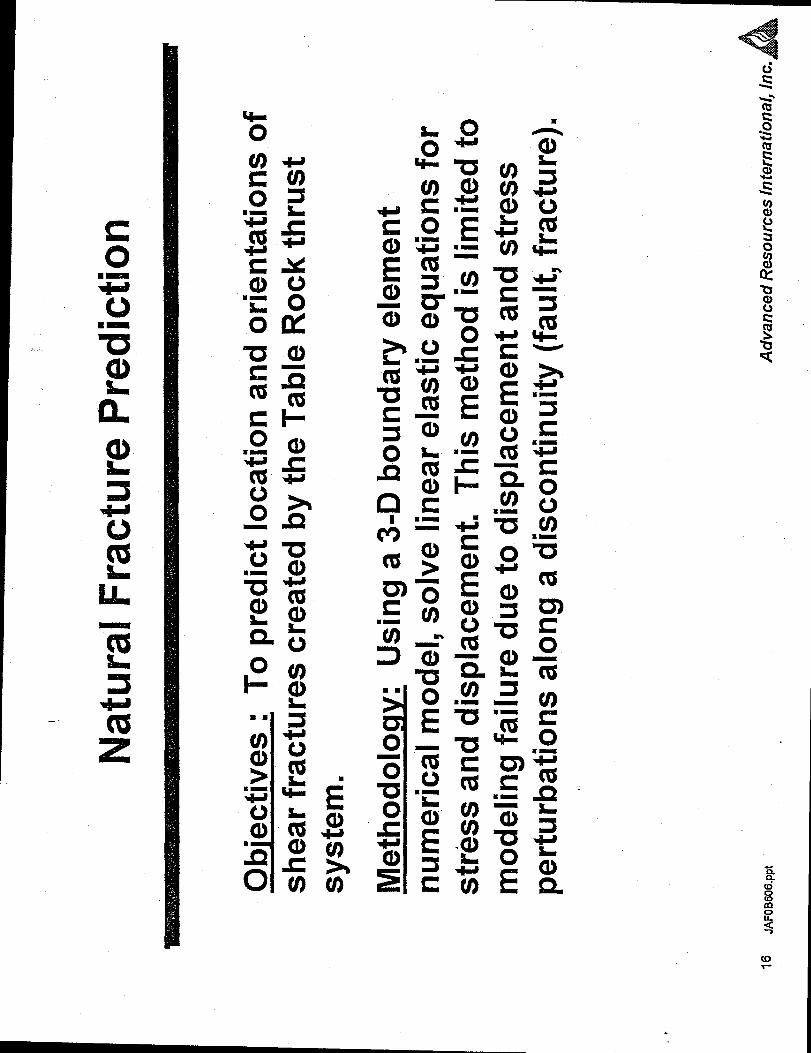
Prospect Delineation
Table Rock Horizontal Drilling Project
I
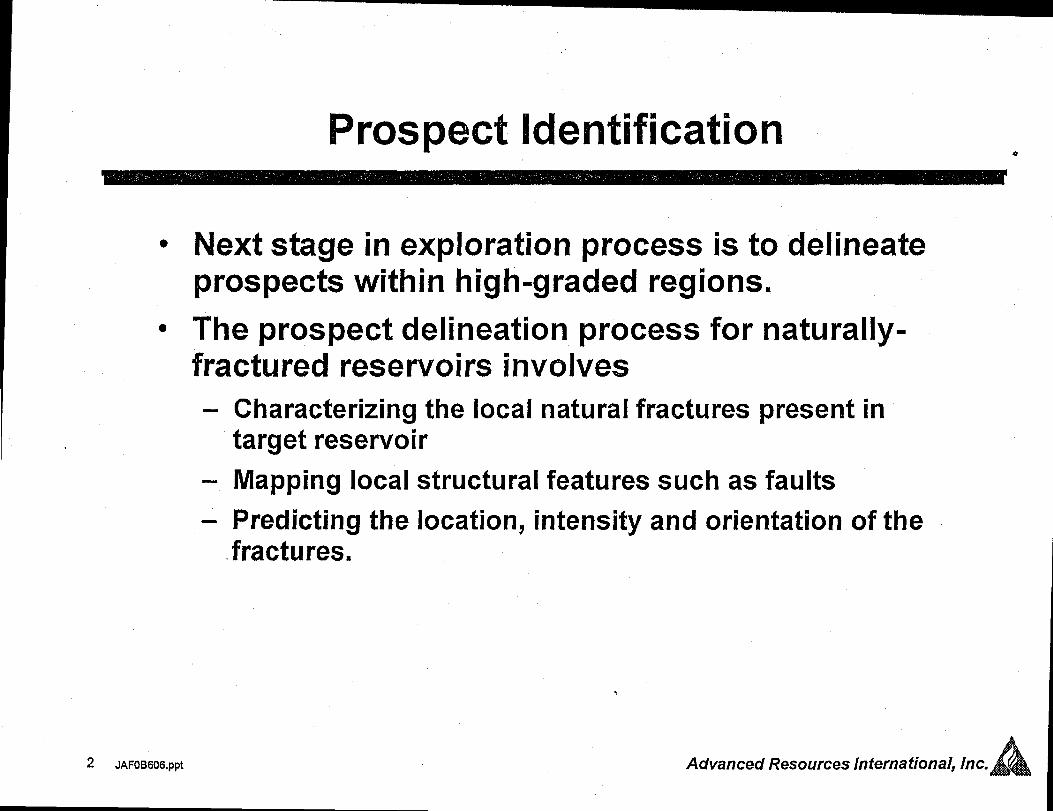
Prospect Identification*
● Next stage in exploration process is to delineateprospects within high-graded regions.
o The prospect delineation process for naturaHy -fractured reservoirs involves
I
2 JAFOB606,ppt
Characterizing the local natural fractures present intarget reservoir
Mapping local structural features such as faults
Predicting the location, intensity and orientation of thefractures.
.
Advanced Resources International, Inc.
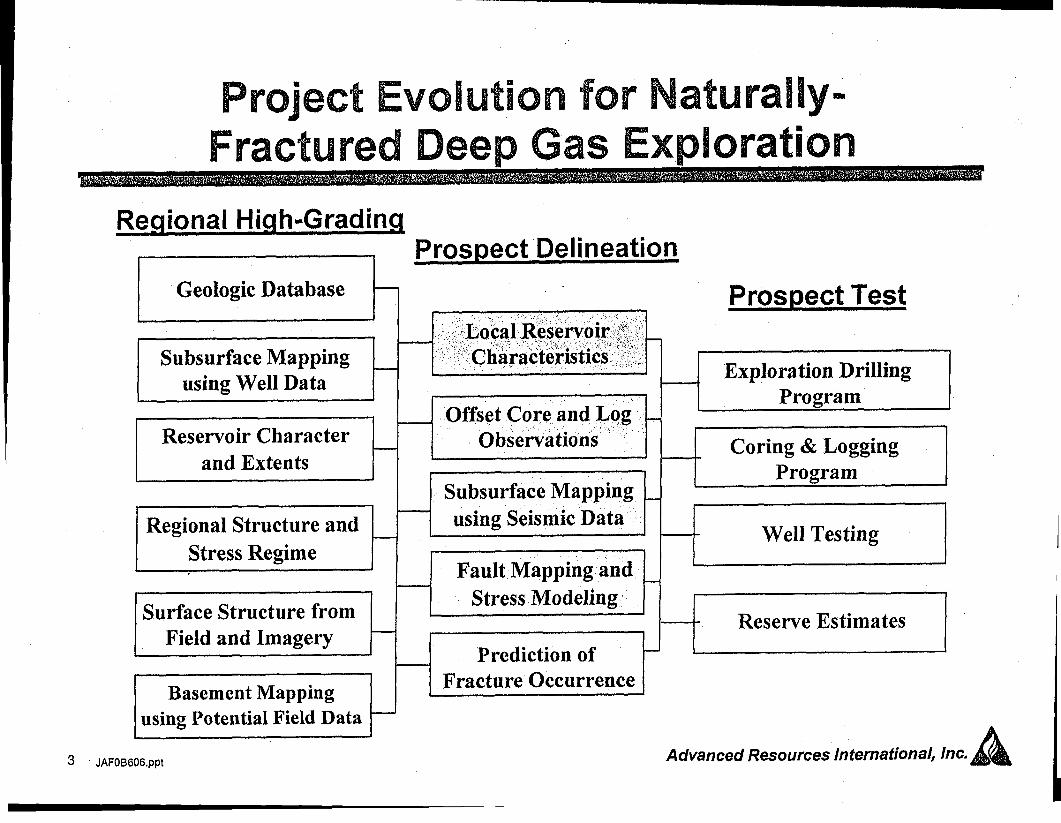
Project Evolution forNaturallym
Fractured Deep Gas Exploration
Regional Hiqh-Gradinq
I Geologic Databaset
Subsurface Mappingusing Well Data t
1
Reservoir Characterand Extents }
Regional Structure andStress Regime
t
Surface Structure fromField and Imagery I
3 JAFOB606,ppt
Prospect Delineation
I ‘l--
Prospect Test
I 1 l---t-v. . ..-. —-
= Xm’u3
4 Subsurface Mappingusing Seismic Data‘t
-1Fault Mapping and,Stress Modeling t
-.-1 Prediction ofIFracture Occurrence [
I Chrina & TAW
I Pro~ram I
Well Testing
-tReserve Estimates I
Y I I
Advanced Resources International, Inc.A1
(nc)L
Ciailxc)c)Itl!cc1)
es2CcfP-
●
I
I
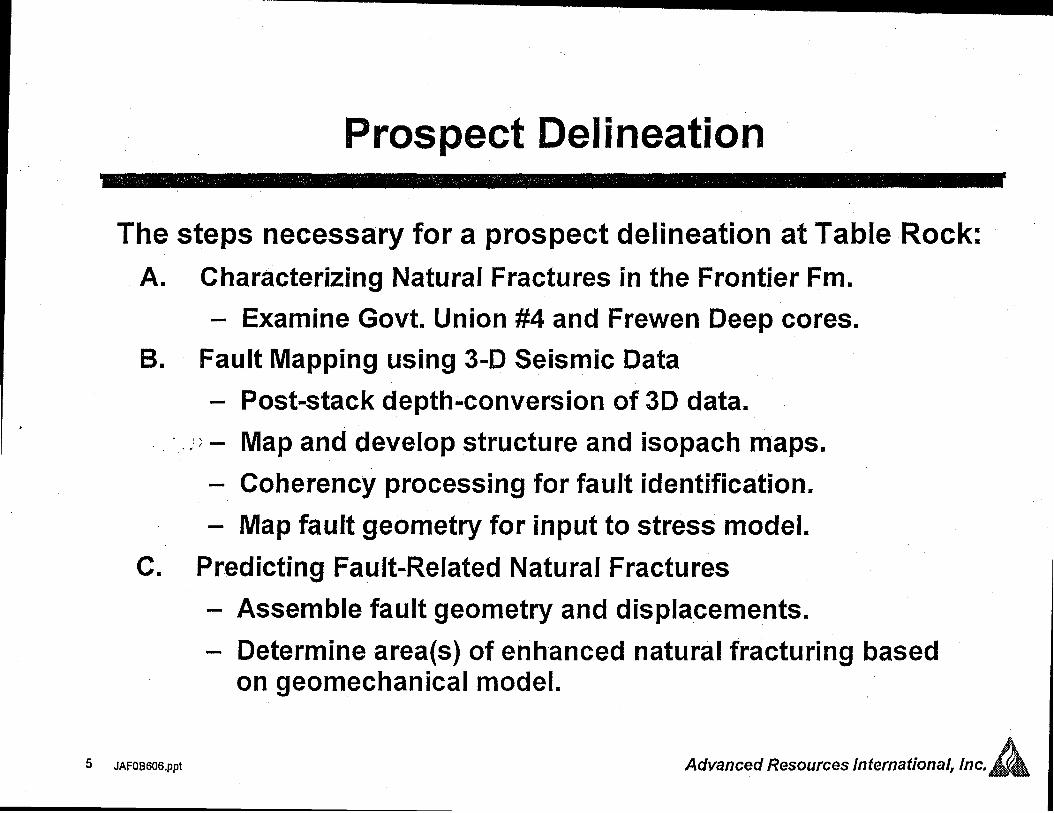
Prospect Delineation
The steps necessary for a prospect delineation at Table Rock:
A. Characterizing Natural Fractures in the Frontier Fm.
- Examine Govt. Union #4 and Frewen Deep cores.
B. Fault Mapping using 3-D Seismic DataI
*i .,.,. -,
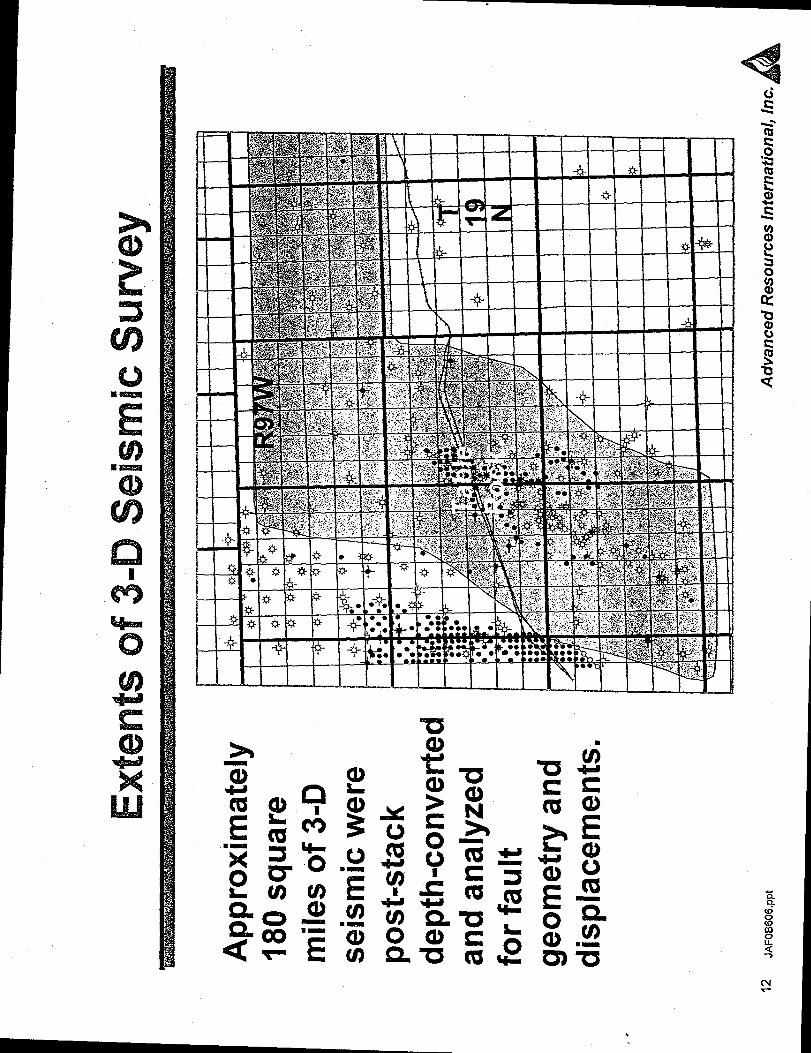
Post-stack depth-conversion of 3D data.
Map and develop structure and isopach maps.
Coherency processing for fault identification.
Map fault geometry for input to stress model.
C. Predicting Fault-Related Natural Fractures
- Assemble fault geometry and displacements.
- Determine area(s) of enhanced natural fracturing basedon geomechanical model.
5 JAFOB606.pPt Advanced Resources lnternaf;onal, Inc.
IIUaturallFractures Observedh Frontier Fm. Core
Types of natural fractures identified in the Govt.Union #4 core include:
●
o
0
●
G JAFOB606.ppt
Shear fractures with an extensionalcomponent exhibiting oblique-reverse slip
Large voids located between overlappingshear fractures
Bitumen-filled splay fractures
Minor calcite- and quartz-filled extensionalfractures
Advanced Resources International, inc.
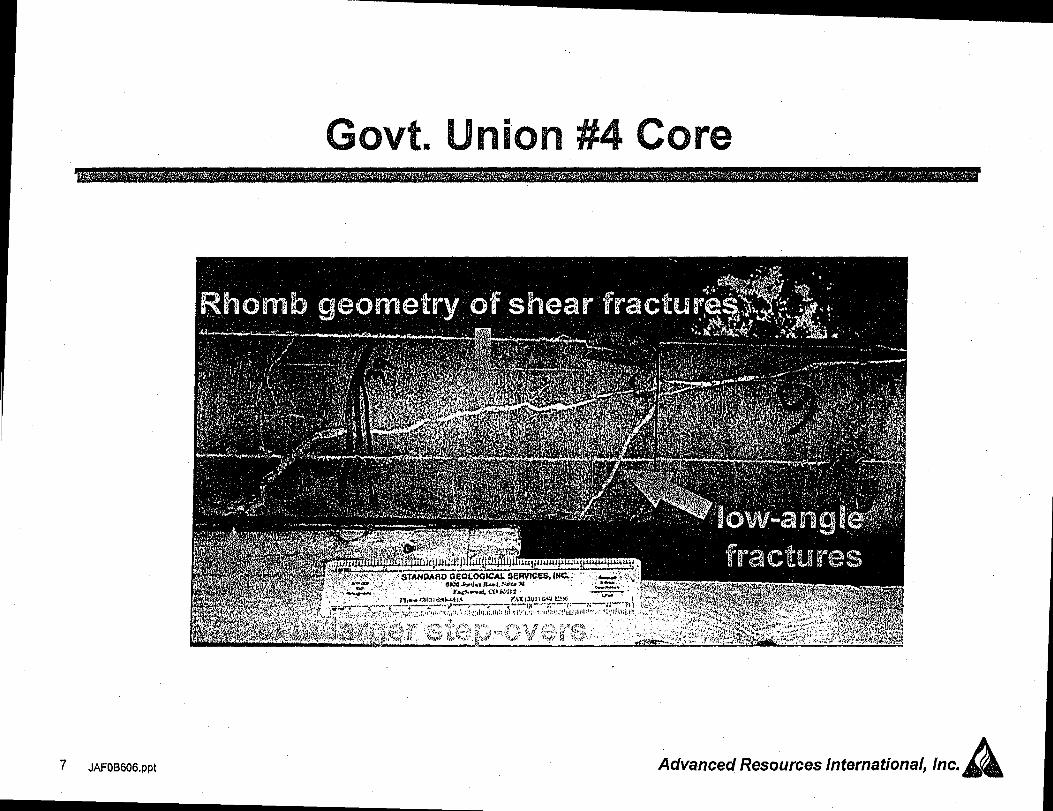
Govt. union#4 core
7 JAFOE160fj,ppt Advanced Resources International, Inc. A
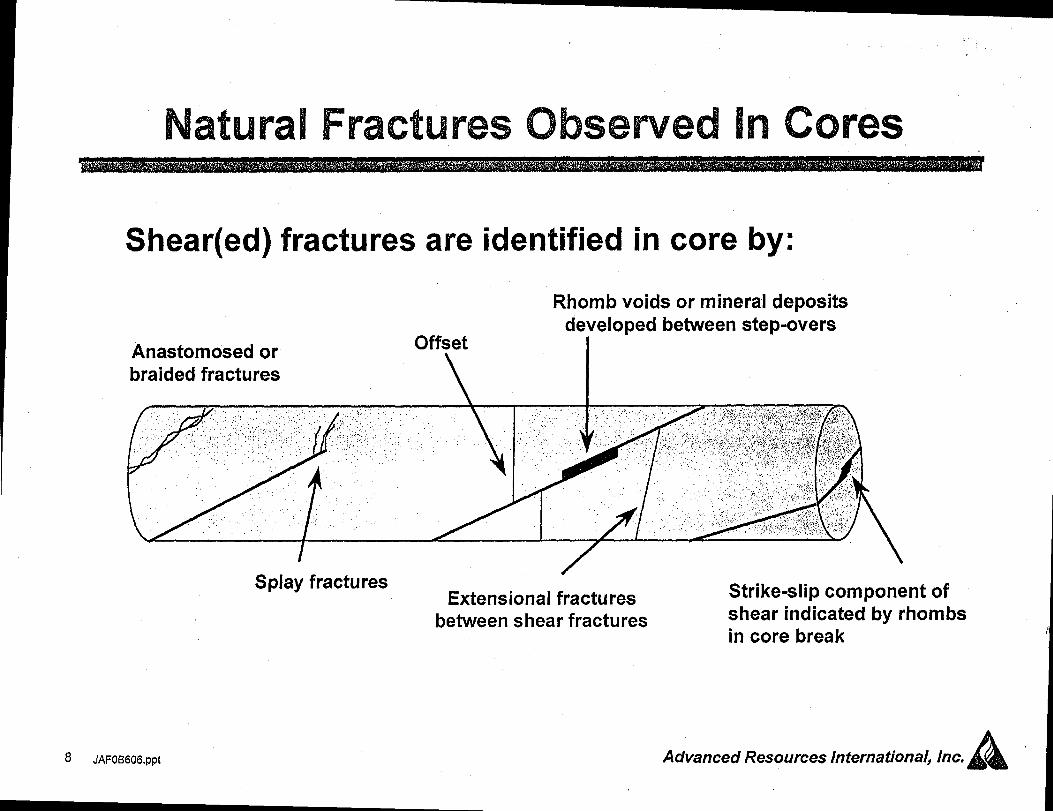
Natural Fractures Obsewed In cores
Shear(ed) fractures are identified in core by:
Rhomb voids or mineral depositsdeveloped between step-overs
Anastomosed or Offset
braided fractures\
8 JAFOB606.ppt
Splay fracturesw
Extensional fracturesbetween shear fractures
Strike-slip component ofshear indicated by rhombsin core break
Advanced Resources International, Inc.A
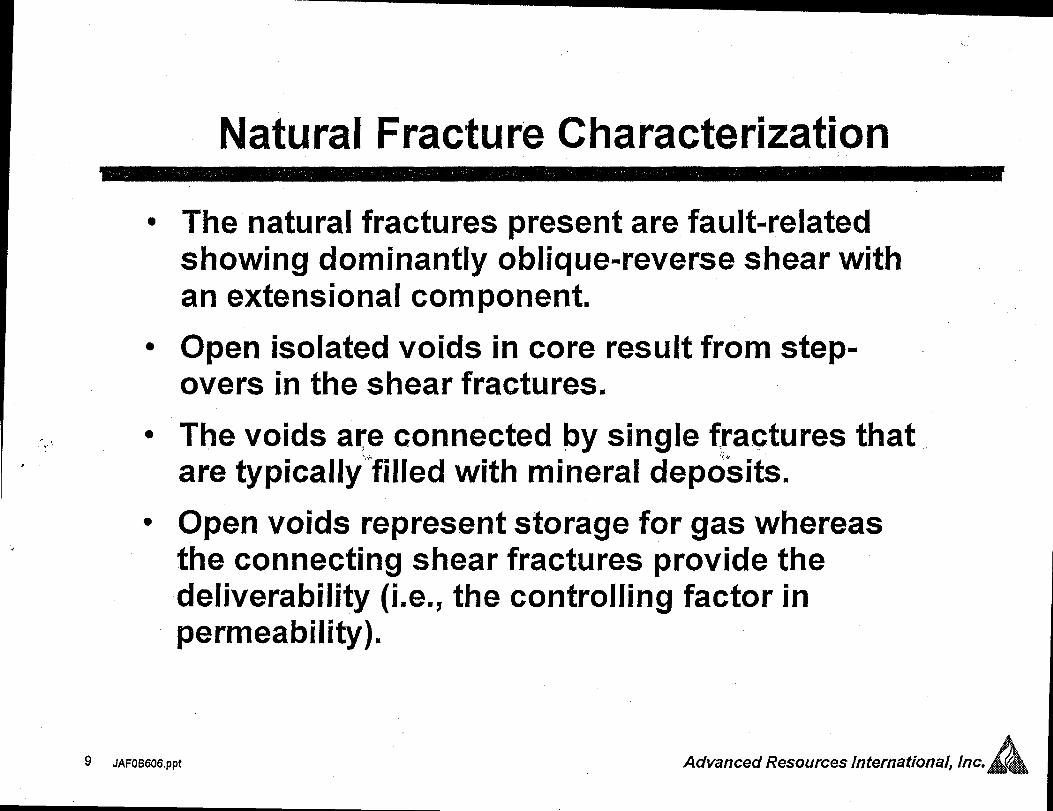
INatural Fracture Characterization
● The natural fractures present are fault-relatedshowing dominantly oblique-reverse shear withan extensional component
I ● Open isolated voids in core result from step-overs in the shear fractures.
● The voids are connected by single fractures that.* are typically filled with mineral deposits.
o Open voids represent storage for gas whereasIthe connecting shear fractures provide thedeliverability (i.e., the controlling factor inpermeability).
9 JAFOB606.ppt AAdvanced Resources International, Inc. /
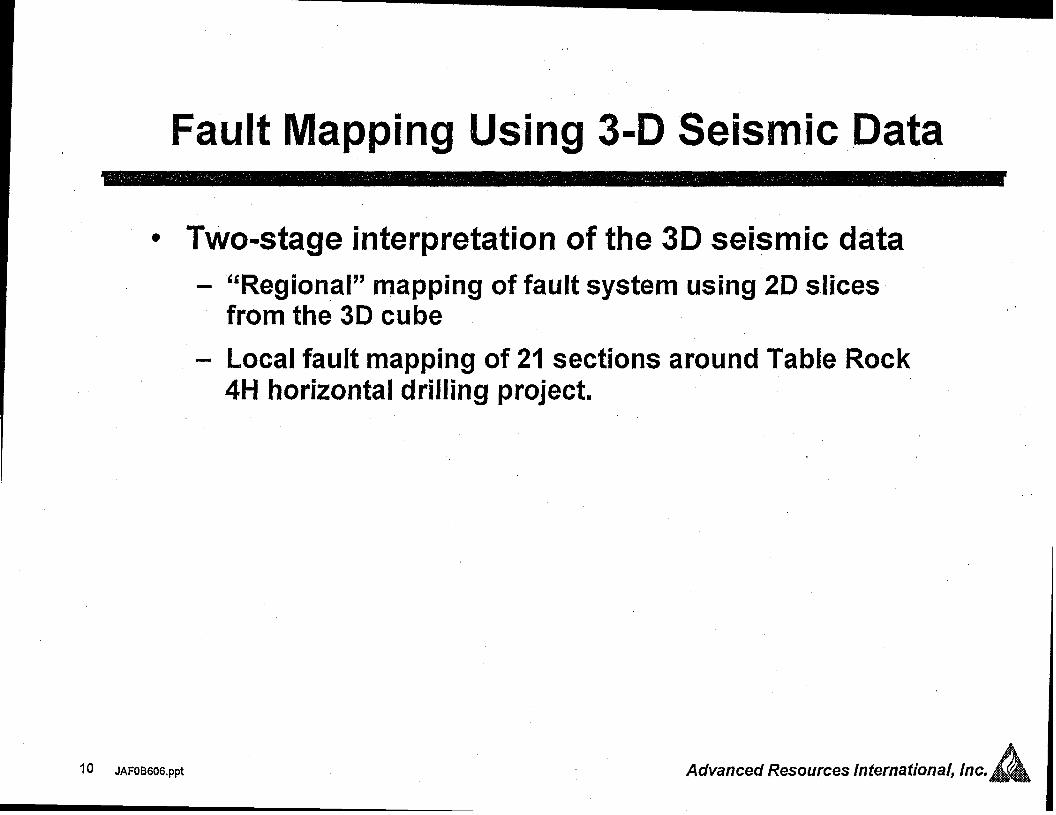
Fault Mapping Wing 3.D Seismic Data
● Two-stage interpretation of the 3D seismic data
- “Regional” mapping of fault system using 2D slicesfrom the 3D cube
- Local fault mapping of 21 sections around Table Rock4H horizontal drilling project.
I o JAFOB606,ppt Advanced Resources International, Inc.
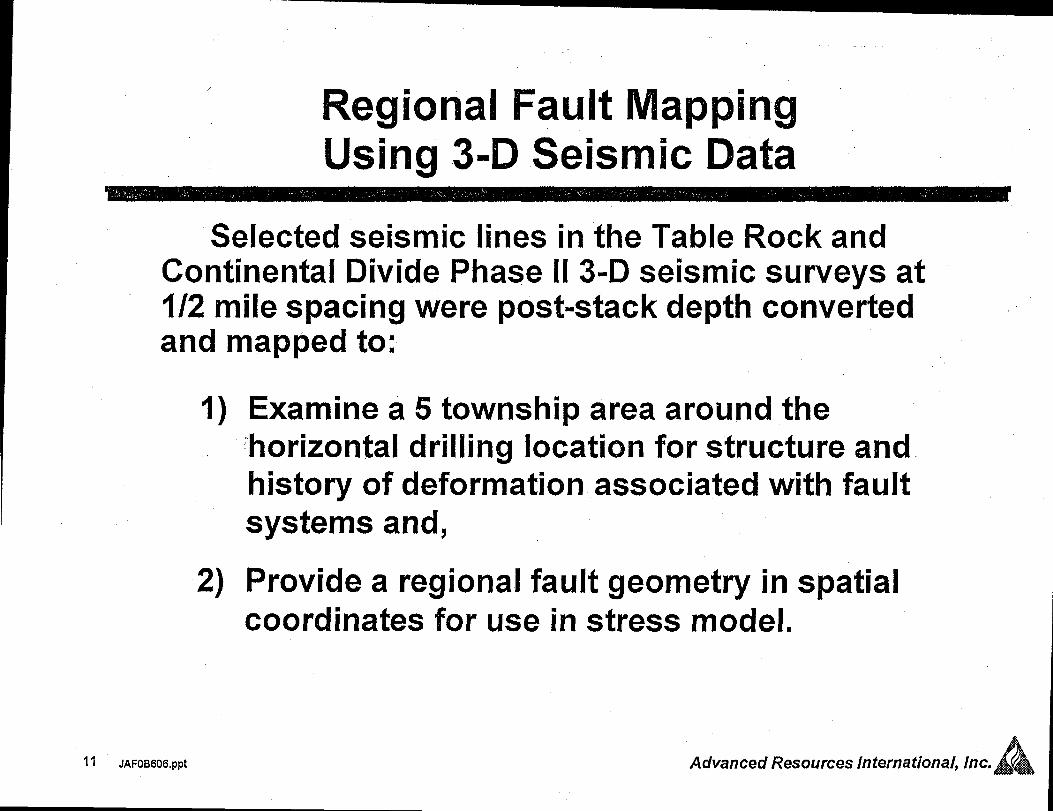
Regional Fault MappingIJsing 3-D Seismic Data
Selected seismic lines in the Table Rock andContinental Divide Phase II 3-D seismic surveys at1/2 mile spacing were post-stack depth convertedand mapped to:
1)
2)
If JAFOB606.ppt
Examine a 5 township area around thehorizontal drilling location for structure andhistory of deformation associated with faultsystems and,
Provide a regional fault geometry in spatialcoordinates for use in stress model.
Advanced Resources International, inc.
CJ
E
o($)
c1)
xiLLJ
C+RjQ=
<w-
nCA
u)co
E
m
,b.
I
m
m
3m
L
I 1 I I I ! I I
Qal-”a)
S1- m
C9
,,
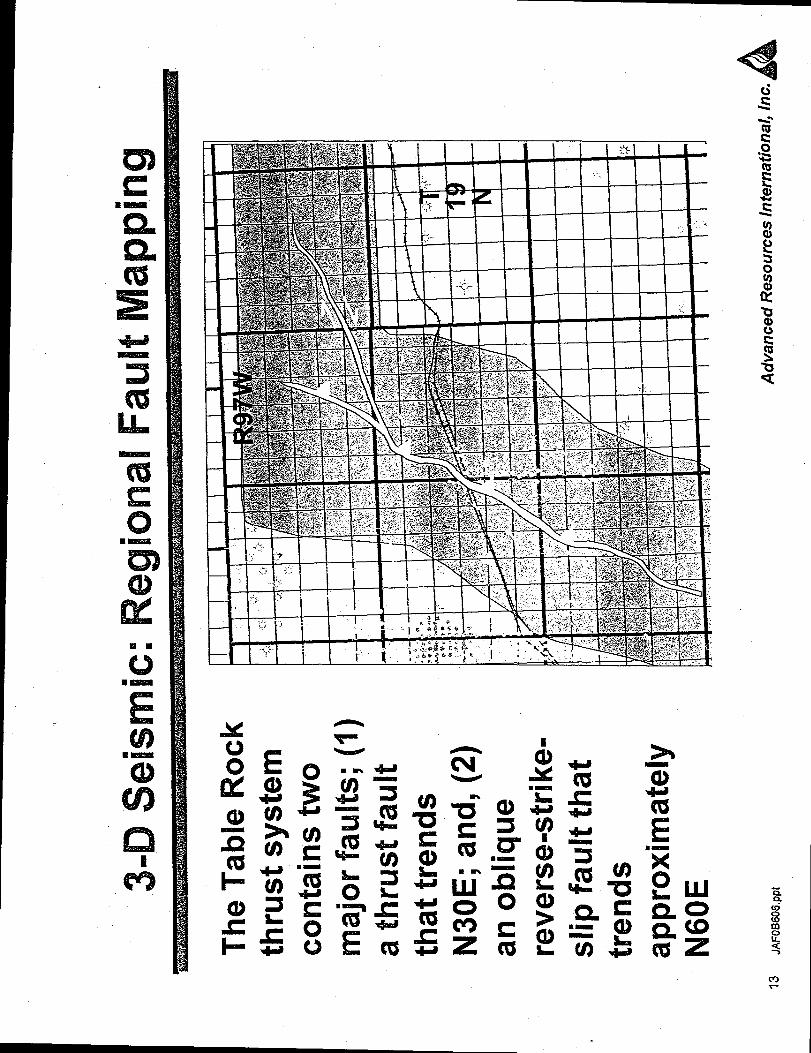
s-r) seismic:Regional Fault Mapping
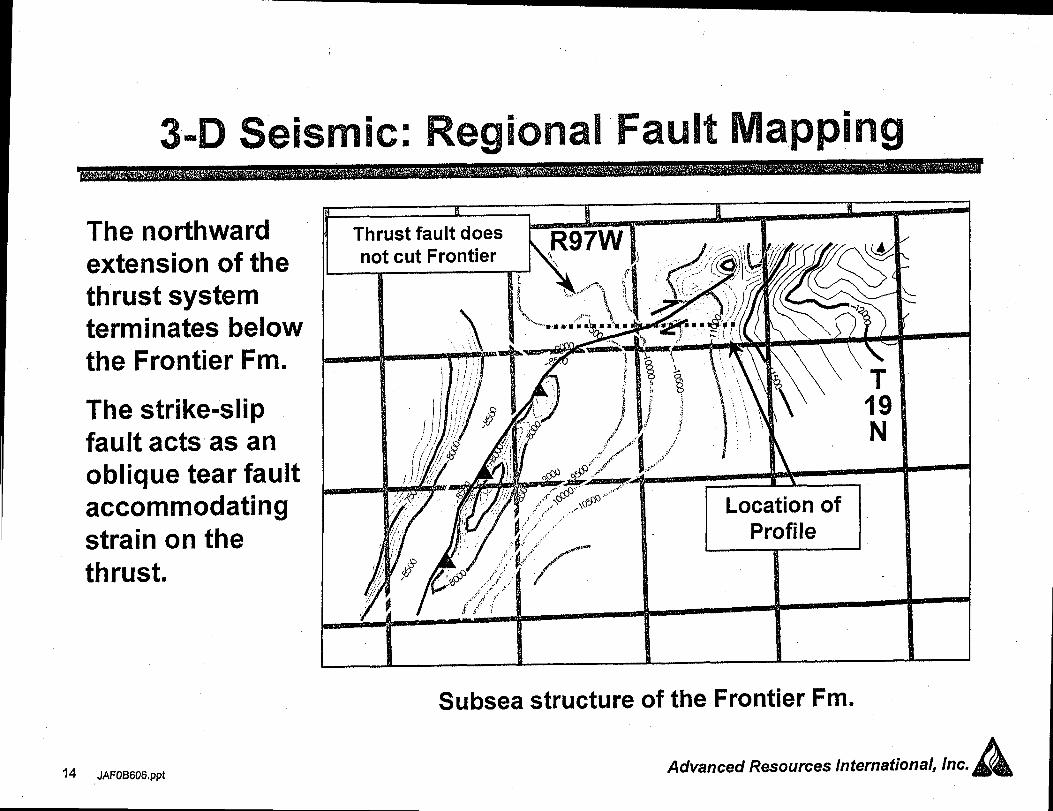
The northwardextension of thethrust systemterminates belowthe Frontier Fm.
The strike-slipfault acts as anoblique tear faultaccommodatingstrain on thethrust.
M M
Subsea structure of the Frontier Fm.
r14 J#4FfJE160&ppt
Advanced Resources International, Inc.A
3ailL
%,-
E0L
IL
s0co%
c,- u)m=a)
0
2s
80
*0z
In
‘5u)s0
s-
‘&s0t) a)
-
QC6
I-EL =
s1-0 L
esa)c
In
s0n
C&‘; 0a)
CGEIliL ms0
s1-
E—-
1-
L
Es
E
CG>a)
S&
m
3+b
‘FJb
t=
I
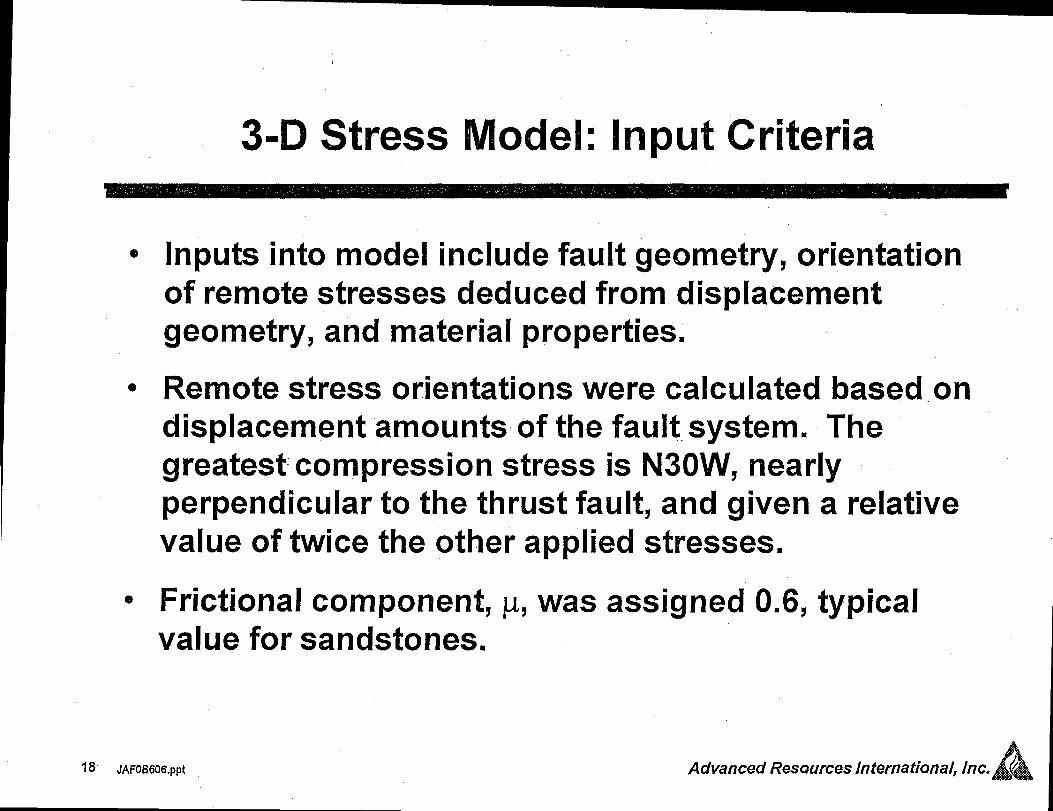
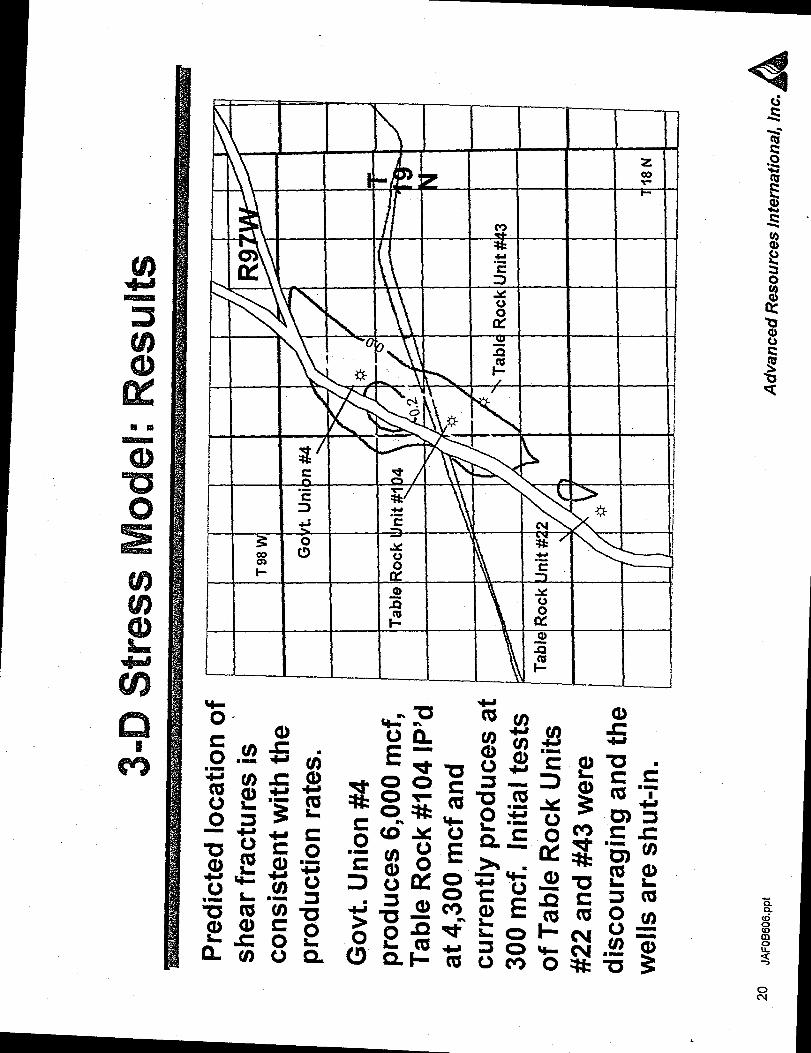
3-I) Stress Model: Input Criteria
o Inputs into model include fault geometry, orientationof remote stresses deduced from displacementgeometry, and material properties.
● Remote stress orientations were calculated based ondisplacement amounts of the fault system. Thegreatest compression stress is N30W, nearlyperpendicular to the thrust fault, and given a relativevalue of twice the other applied stresses.
o Frictional component,value for sandstones.
18 JAFOB606.ppt
p, was assigned 0.6, typical
Advanced Resources International, Inc.
$4 0(
w’
-/z.-s-*
v
A?a)
~
1-
.
m
Em
U?U9a)S&a9
co
Cax
.
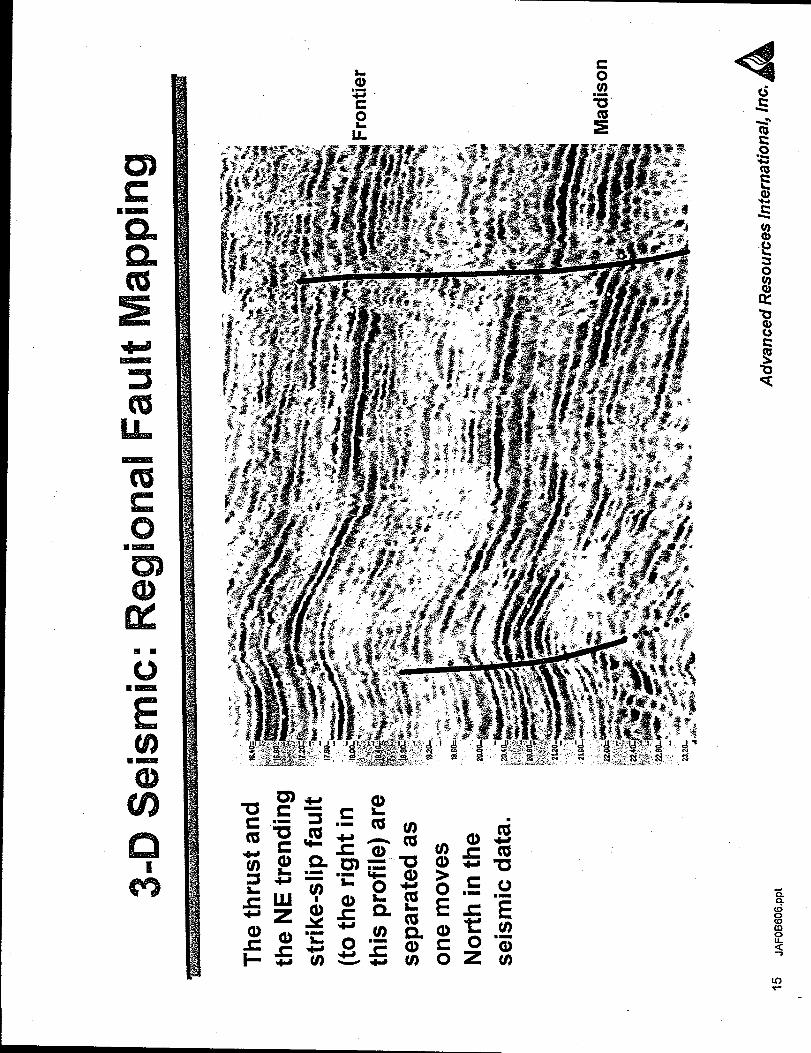
3=D Seismic: IRegionallFault MappingConclusions
● Analysis of seismic and structural data suggest atwo-stage deformation.
—
21 JAFOB606.ppt
The strike-slip fault moved once the level of thrust”related strain needed accommodating.
The accommodation occurred on a pre-existingbasement shear zone, causing the strike-slip tear to beslightly oblique to the thrust fault.
A mechanically-connected geometry of the thrust andstrike-slip faults should be used in the stress model andthe northern continuation of the thrust ignored.
Advanced Resources International, inc.
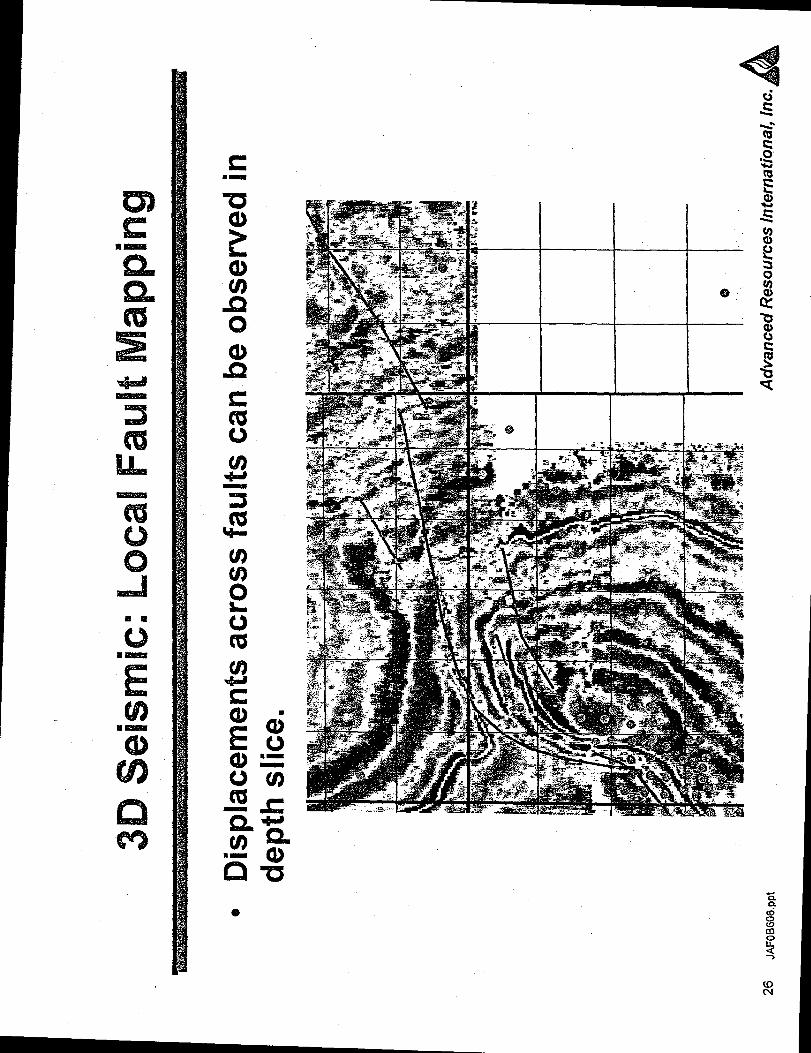
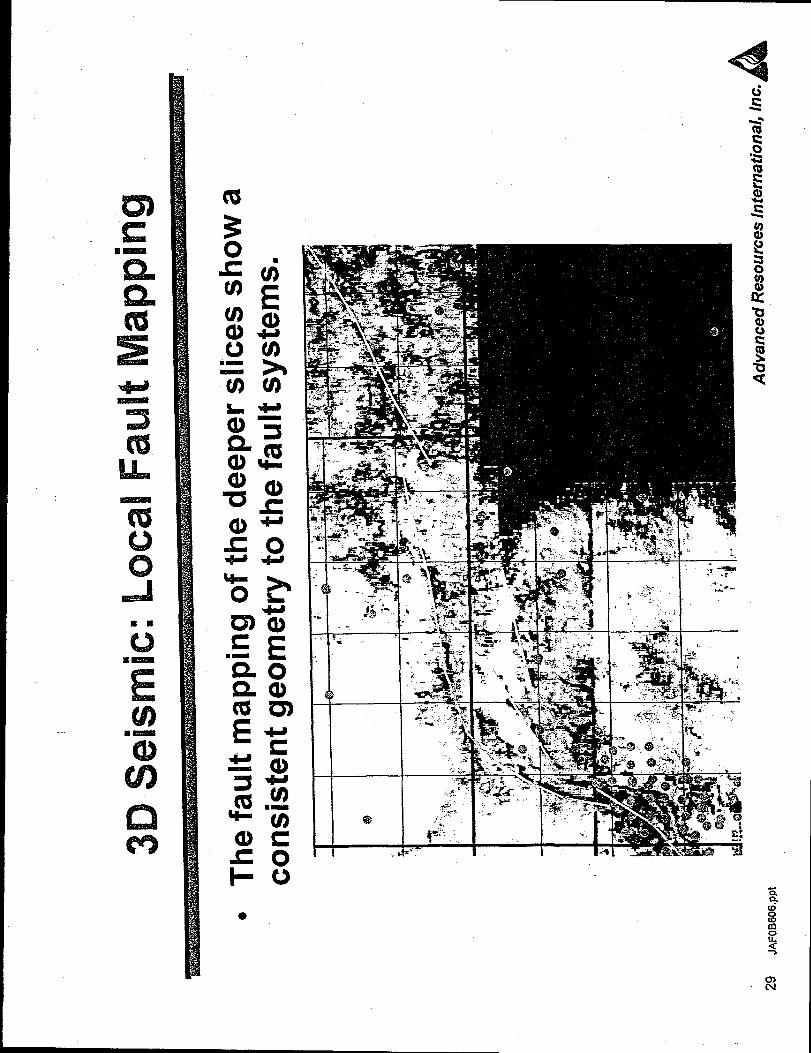
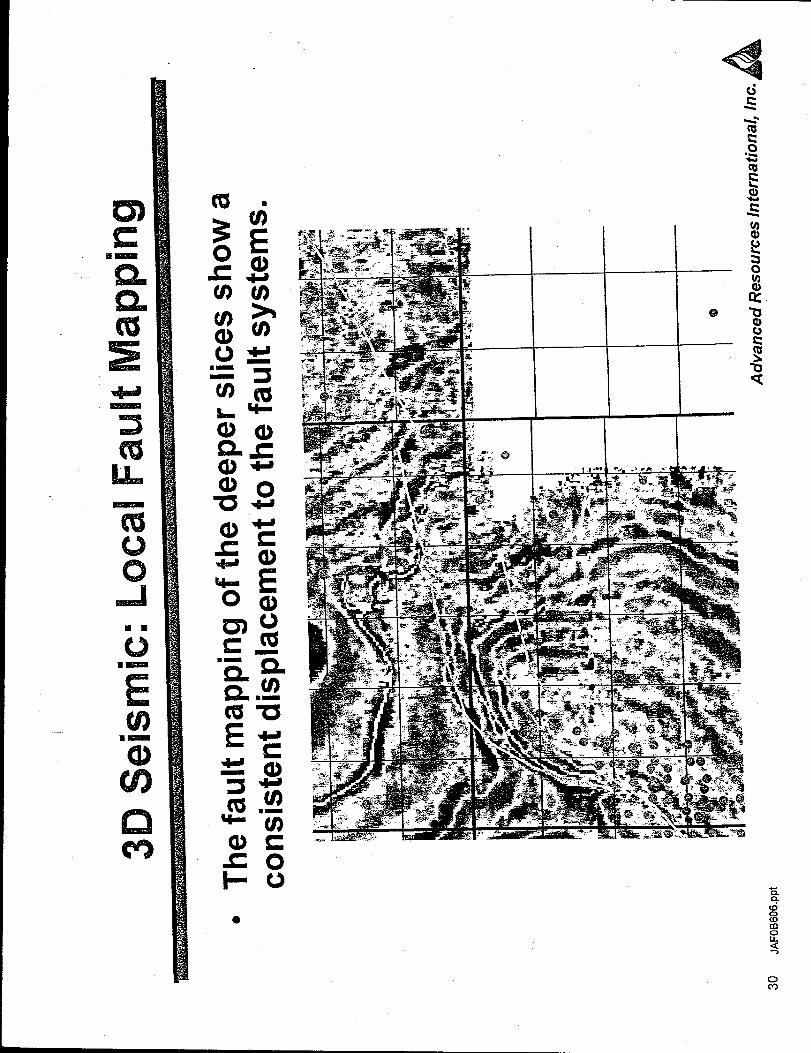
3-D Seismic: Local Fault Mapping
s A full 3D data set was extracted around thehorizontal drilling location to map the local faultgeometry.
- Depth-converted to map faults in space rather than time.
– Use coherency processing to optimize fault identification.
● Local geometry of fault systems permit theprediction of local natural fracture development.
22 JAFOB606,ppt Advanced Resources International, Inc.
I
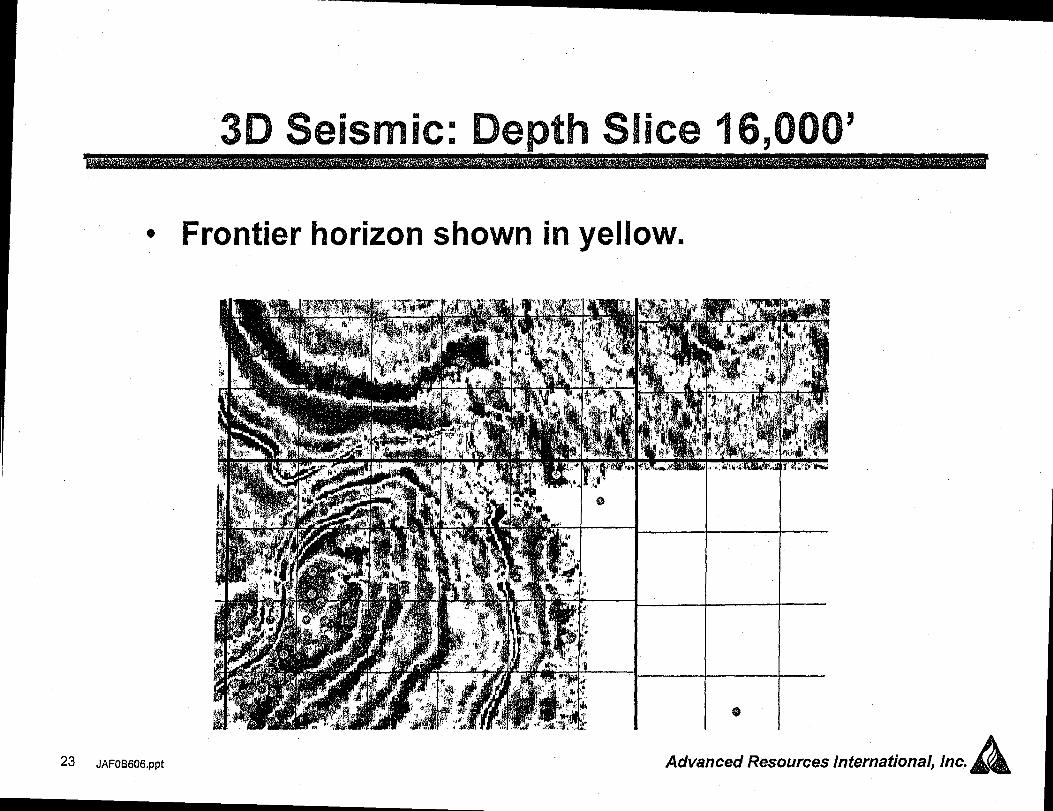
3D Seismic: Depth slice 16,000’
0 Frontier horizon shown in yellow.
23 JAFOB606.ppt
mAdvanced Resources International, Inc.A
@
ea)
co ‘ms-
E16
m-
COY
m ‘:
e
.

3mL
-“ E
0
L
m%!3o
A
c)
u)m5
U3C2!lc%)
I
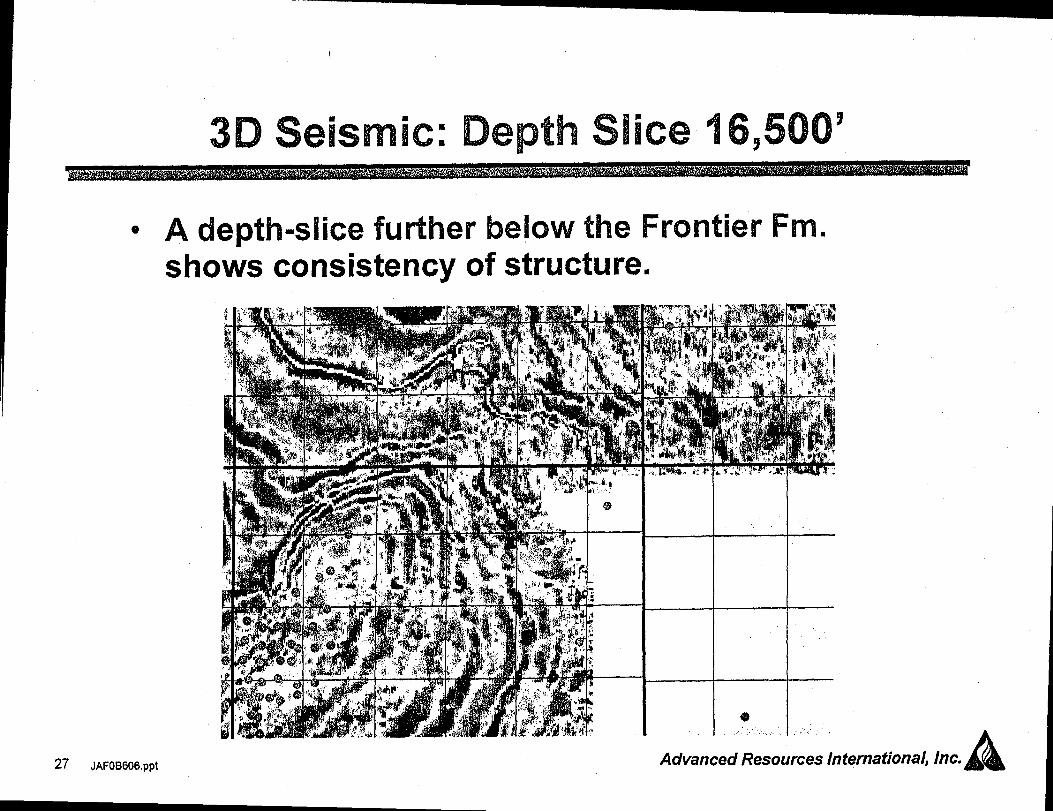
3D seismic:Depth slice 16,500’
0 A depth=slice further below the Frontier Fm.shows consistency of structure.
27 JAFOB606.ppt Advanced Resources In@-n#ona],Inc.A

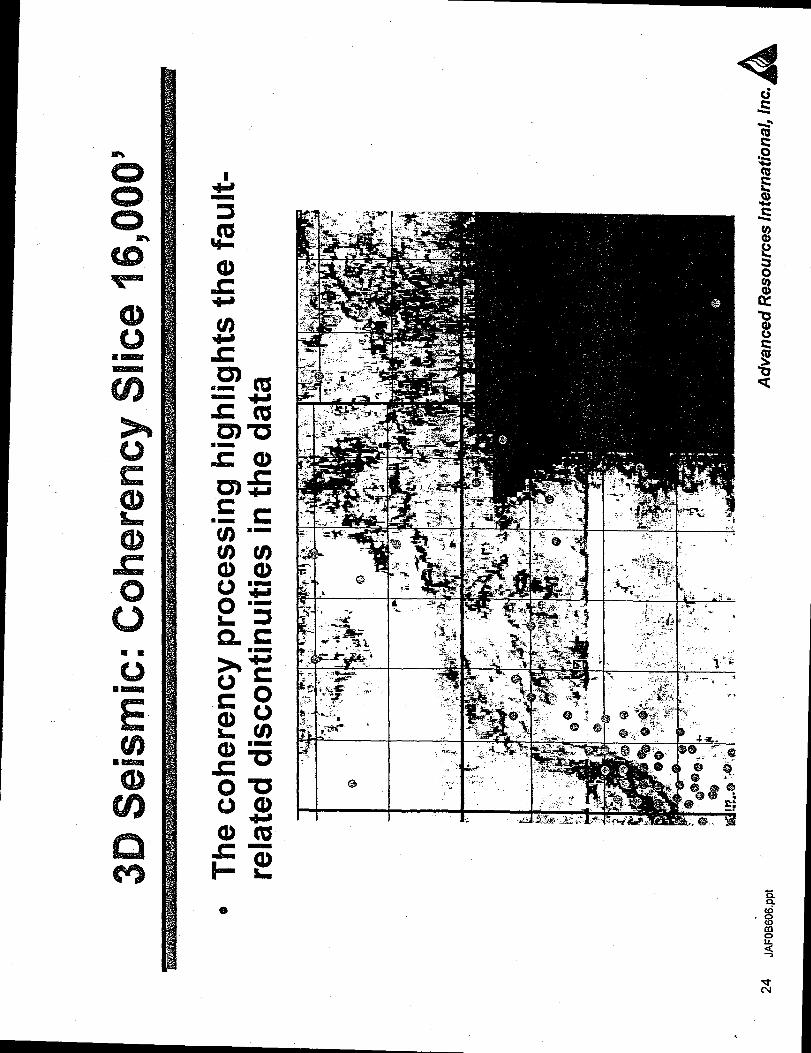
3D Seismic: Coherency Slice 16,500’
● Again, the faults are detected by the coherencyprocessing.
, 28 JAFf)B606.Pf.)t
.
.
.“,,
ii AAdvanced Resources International, Inc.
..
a
●
0sEol-u
0
0‘m
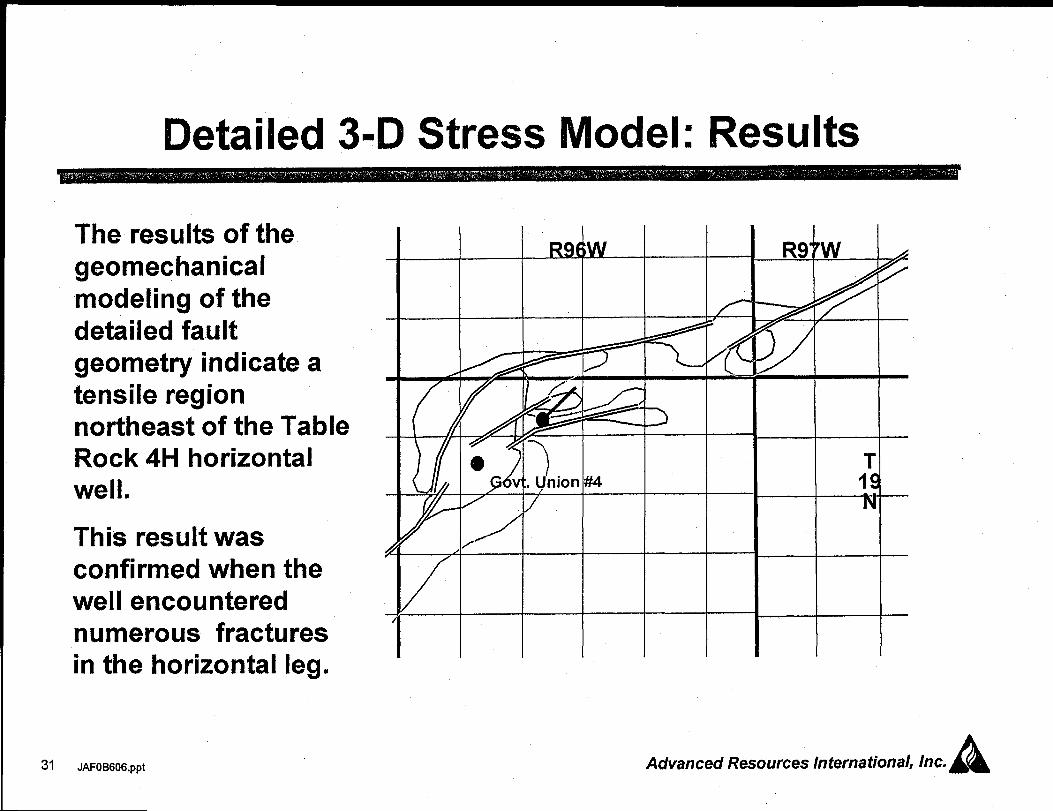
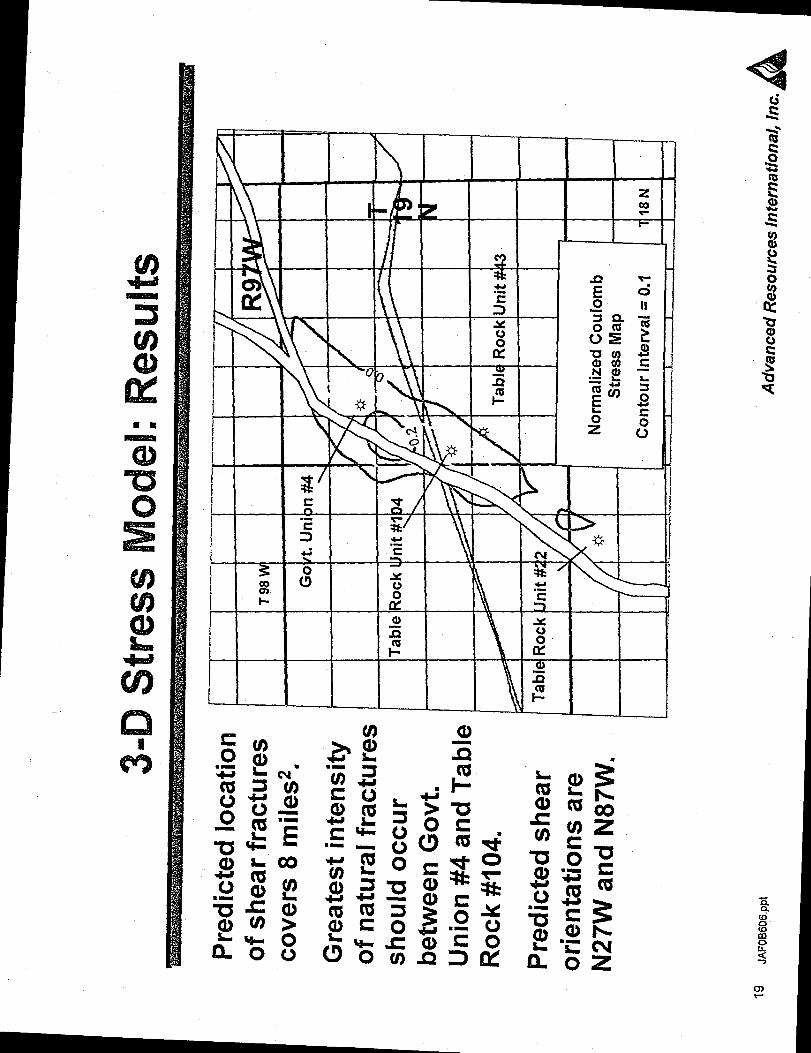
Detailed 3-D Stress Model: Results
The results of thegeomechanicalmodeling of thedetailed faultgeometry indicate atensile regionnortheast of the TableRock 4H horizontalwell.
This result wasconfirmed when thewell encounterednumerous fracturesin the horizontal leg.
31 JAFOB606.ppt Advanced Resources /nternationa/, k. A
I
Summary of Prospect Delineation at Table Rock
● Depth-converted 3-D seismic data shows aconnected thrust and strike-slip fault system inthe region of Table Rock Field.
● Regional analysis of fault-related stressconcentrations, using a quantitative numericalmodel, predicts that natural fractures exist in aprospective area of 8 milez for the Frontier Fm. at13,500’ to 15,500’.
32 JAFOB606.ppt Advanced Resources International, Inc.
II>
Summary of Prospect Delineation at Table Rock
o Detailed analysis of 3D data, aided by coherencyprocessing, reveals a complex fault geometry:- small northwest-trending faults in the vicinity of Table Rock
horizontal well.
o Geomechanical tnodelling this more complex systemindicates a more diverse and expanded potential fornaturally fractured “sweet Spots’y
33 JAFt)B606,ppt
It is predicted that the Table Rock horizontal well hasencountered an area of increased probability for tensilefractures.
Other prospects are indicated such as Section 36 of T20N,R97W
Advanced Resources International, Inc.
Conclusion
I
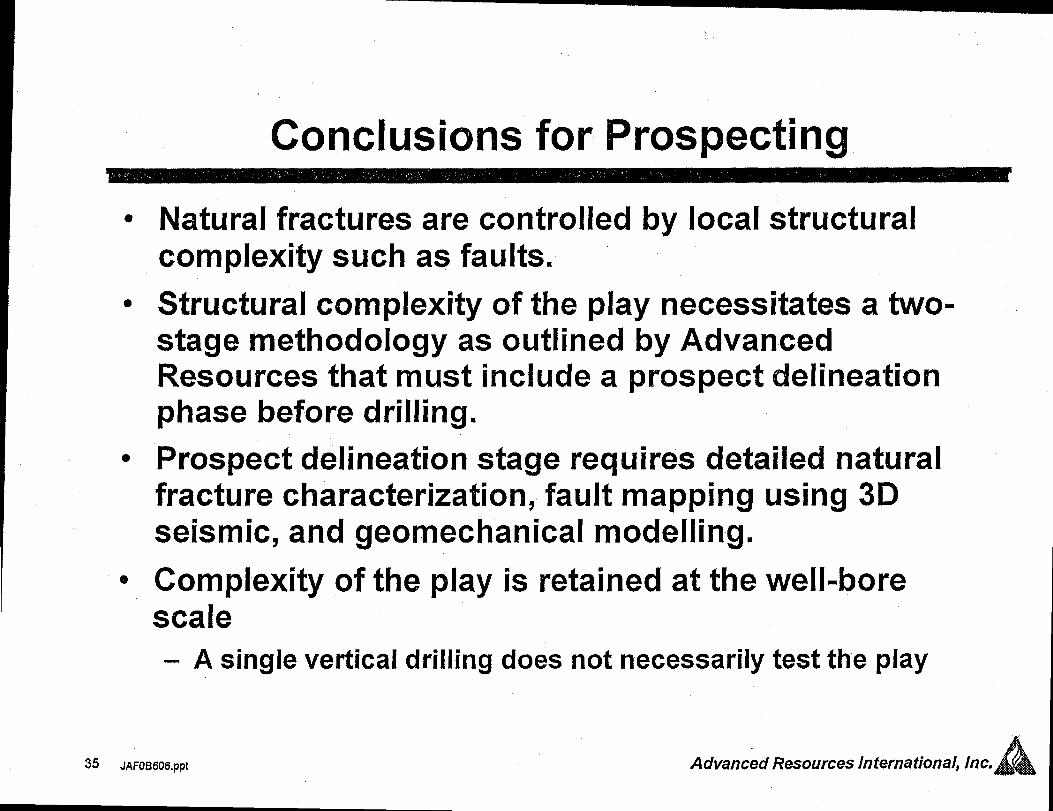
Conclusions for Prospecting
e Natural fractures are controlled by local structuralcomplexity such as faults.
● Structural complexity of the play necessitates a two”stage methodology as outlined by AdvancedResources that must include a prospect delineationphase before drilling.
● Prospect delineation stage requires detailed naturalfracture characterization, fault mapping using 3Dseismic, and geomechanical modelling.
o Complexity of the play is retained at the well-borescale- A single vertical drilling does not necessarily test the play
35 JAFOB606.ppt Advanced Resources International, Inc.
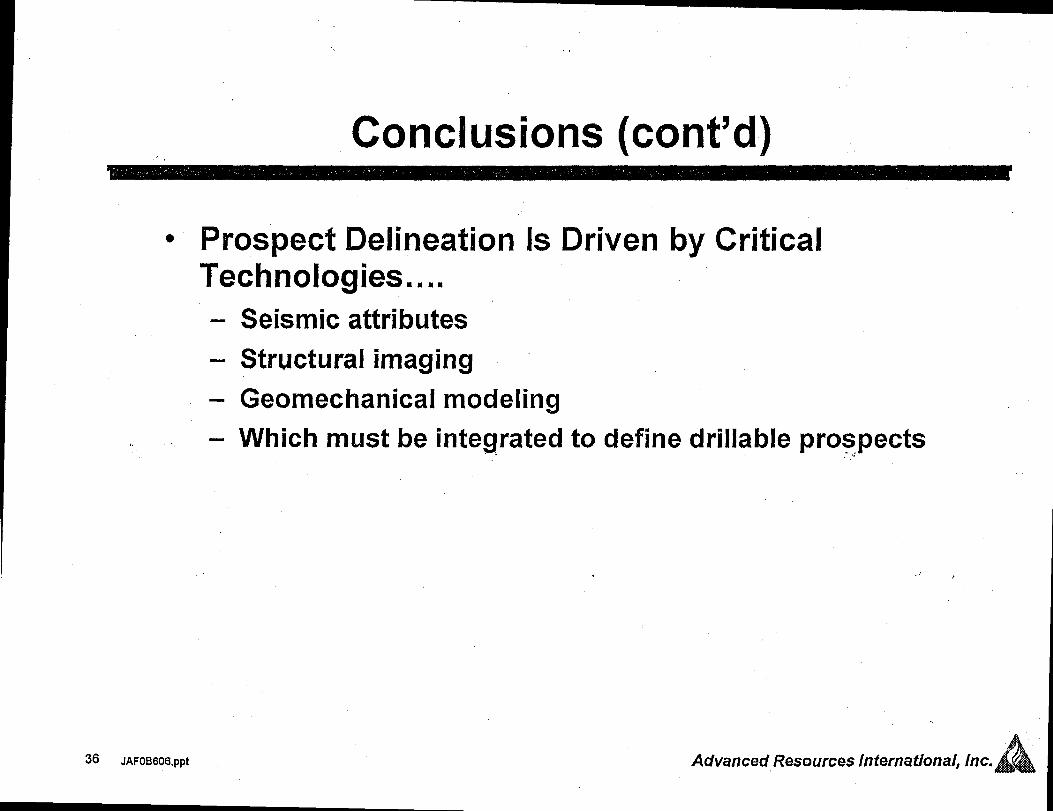
Conclusions (cent’d)
● Prospect Delineation Is Driven by CriticalTechnologies . . ..- Seismic attributes
– Structural imaging
- Geomechanical modeling
- Which must be integrated to define drillable prospects
I
,
36 JAFOB61)6.ppt Advanced Resources international, Inc.
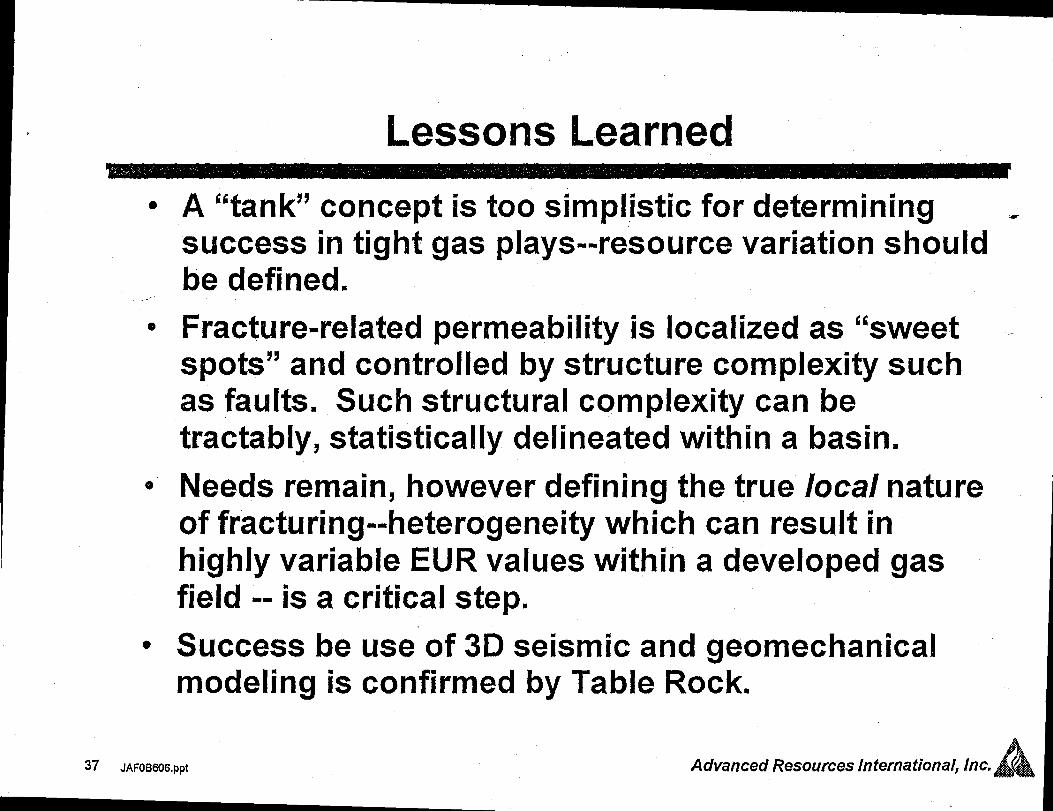
Lessons Learned
A “tank” concept is too simplistic for determiningsuccess in tight gas plays--resource variation should *be defined.
Fracture-related permeability is localized as “sweetspots!’ and controlled by structure complexity suchas faults. Such structural complexity can betractably, statistically delineated within a ba~in.
Needs remain, however defining the true local natureof fracturing--heterogeneity which can result inhighly variable EUR values within a developed gasfield -- is a critical step.
Success be use of 3D seismic and geomechanicalmodeling is confirmed by Table Rock.
37 JAFOB606,ppt Advanced Resources International, Inc.