nsw energy prices july 2021
TRANSCRIPT

NSW Energy Prices July 2021An update report on the NSW Tariff-Tracking Project
St Vincent de Paul & Alviss Consulting | July 2021
New South Wales Energy Prices July 2021An Update Report on the NSW Tariff-Tracking Project
May Mauseth Johnston, October 2021 Alviss Consulting Pty Ltd
www.alvissconsulting.com www.vinnies.org.au twitter.com/AlvissC twitter.com/VinniesAust
Contact: Gavin Dufty Manager, Social Policy Unit VictoriaSt Vincent de Paul Society Phone: (03) 98955816 or 0439 357 129 twitter.com/gavindufty
© St Vincent de Paul Society and Alviss Consulting Pty LtdThis work is copyright. Apart from any use permitted under the Copyright Act 1968 (Ctw), no parts may be adapted, reproduced, copied, stored, distributed, published or put to commercial use without prior written permission from the St Vincent de Paul Society.

NSW Energy Prices July 2021: An update report on the NSW Tariff-Tracking Project
DisclaimerThe energy offers, tariffs and bill calculations presented in this report and associated workbooks should be used as a general guide only and should not be relied upon. The workbooks are not an appropriate substitute for obtaining an offer from an energy retailer. The information presented in this report and the workbooks is not provided as financial advice. While we have taken great care to ensure accuracy of the information provided in this report and the workbooks, they are suitable for use only as a research and advocacy tool. We do not accept any legal responsibility for errors or inaccuracies. The St Vincent de Paul Society and Alviss Consulting Pty Ltd do not accept liability for any action taken based on the information provided in this report or the associated workbooks or for any loss, economic or otherwise, suffered as a result of reliance on the information presented. If you would like to obtain information about energy offers available to you as a customer, go to Australian Energy Regulator’s “Energy Made Easy” website or contact the energy retailers directly.
AcknowledgementsThis project was funded by Energy Consumers Australia (www.energyconsumersaustralia.com.au) as part of its grants process for consumer advocacy projects and research projects for the benefit of consumers of electricity and natural gas.
The views expressed in this document do not necessarily reflect the views of Energy Consumers Australia.
St Vincent de Paul & Alviss Consulting | July 2021
Table of Contents
The NSW Tariff-Tracking Project: purpose and outputs 1Key findings 21. Energy price changes 42. Market offers July 2021 10
2.1 Electricity market offers July 2021 102.1.1 Potential savings - Differences between electricity offers 12
2.2 Gas market offers July 2021 162.2.1 Potential savings - Differences between gas offers 18
3. The Default Market Offer (DMO) and market changes 204. Network charges 22
4.1 Electricity network charges 224.2 Gas network charges 24
5. Solar offers 266. Total cost of energy by area 32
5.1 Inner Sydney, Northern Sydney, Swansea, Newcastle, Maitland, Cessnock Singleton and Upper Hunter 325.2 Western Sydney, Wollongong, Blue Mountains, Lithgow, Kandos, Moss Vale, Nowra, Ulladulla 335.3 Rural and Regional NSW 34
NSW Energy Prices July 2021: An update report on the NSW Tariff-Tracking Project 1
The NSW Tariff-Tracking Project: purpose and outputs
To date, this project has tracked electricity and gas tariffs in NSW from July 2009 to July 2021, and developed a spreadsheet-based tool that allows consumer advocates to build on the initial analysis and continue to track changes as they occur.1 The first report for the NSW Tariff-Tracking project was published in August 2011 and this is the eight up-date report focusing on price changes that have occurred over the last year. A more recent addition to the Tariff-Tracking project is market offers available to new solar customers. The workbook allows users to calculate annual bills based on retailers’ rates, feed in tariffs offered and additional discounts. Again, the user can enter consumption level as well as choosing to run the bill calculation based on 1.5 kW or 3 kW solar systems.
We have developed five workbooks that allow the user to enter consumption levels and analyse household bills for NSW gas and electricity offers. Workbook 1: Regulated electricity offers July 2008 – July 2021Workbook 2: Regulated gas offers July 2009 – July 2021Workbook 3: Electricity market offers July 2011 – July 20212
Workbook 4: Gas market offers July 2011 – July 2021Workbook 5: Solar market offers July 2016 – July 2021
The jurisdictional update reports will be followed by a NEM comparison report that discusses market issues and customer impacts in more detail as well as making recommendations.
All workbooks and reports are available at www.vinnies.org.au/energy
1 The regulated electricity offers workbook also contains the 2008 rates2 All market offers are published offers and do not include special offers that retailers market through door-knocking campaigns or brokers. We use the retailers’ websites to collect market offer for the Tariff-Tracking tool. If the retailer has more than one market offer we use the offer with the best rates/discounts that do not require direct debit arrangements.

St Vincent de Paul & Alviss Consulting | July 20212
Key findings l In terms of general trends, the NSW tariff analysis found that:
l The current DMO price is lower than all of the standing offers that the incumbent electricity retailers (Energy Australia and Origin) offered in 2018/19 prior to the DMO taking effect. The DMO price taking effect in July 2021 is also lower compared to last year. See charts 1 and 2 in section 1 below.3
l The maximum price spread (the difference between the best and the worst DMO) is highest in Endeavour at $390. In Essential the price spread is $245 and in Ausgrid it is $225.4 The maximum price spread between DMO offers is higher than last year when the difference was between $145 and $220 (depending on network area).5 See chart 5 in section 1 below.
l Gas prices decreased by almost $90 per annum (8%) in Sydney (AGL/Jemena) post July 2021. The annual bill is now around $1,000 per annum for households using 24,000 MJ.6 In the gas zones where Origin is the incumbent retailer, standing offer prices have increased by between 8 to 14%. In ActewAGL’s gas zones, standing offer customers have only experienced slight price changes.7 See table 3 in section 1.
l Households with typical electricity consumption (7,200kWh) can save $610 - $725 per annum (depending on their network area) if switching from the incumbent retailer’s standing offer to the best market offer.8 See section 2.1.
l The average electricity market offer (including guaranteed and pay on time discounts) produces an annual bill of $2,265 in the Essential Energy network, $1,890 in Ausgrid and $1,870 in Endeavour.9 See section 2.1.
l In July 2021, the average market offer for households consuming 7,200 kWh per annum decreased by -4% in Essential and by -7% in Endeavour and Ausgrid.10 See section 2.1.
l The difference between electricity market offers continues to be significant. The difference between the best and the worst market offer ranges $630 (in Ausgrid’s area) to $765 (in Essential’s area) for customers with typical consumption levels.11 See section 2.1.
l Typical consumption gas customers in Jemena’s Sydney price zone can potentially save $300 on their annual gas bill (including pay on time discounts) by switching from AGL’s standard offer to the best market offer.12 See section 2.2.
3 Based on the incumbent retailers’ standing offers as of July 2018 and the DMO for each network area. This bill comparison is based on the consumption levels used for setting the DMO price.4 Based on a comparison of all DMO offers (single rate) for households consuming 7,200 kWh per annum.5 As new retailers enter the market and some retailers exit, many of the retailers included in this year’s analysis did not offer electricity to NSW consumers in July 2020 and we have therefore not compared 2020 and 2021 standing offer prices across all retailers.6 Based on households consuming 24,000Mj per annum on AGL’s standing offer.7 These bill calculations are based on the incumbent retailers’ published standard offer as of July 2020 and July 2021.8 Based on the incumbent retailer’s standing offer (single rate) and the best of the published market offers (including additional discounts and/or pay on time discounts).9 Based on the average market offer (all retailers) for each network area, single rate and inclusive of pay on time discounts.10 Ibid. Post July 2021 offers compared to post July 2020 offers. 11 Households using 7,200kWh per annum (single rate) and all market offer bills include additional discounts and/or pay on time discounts. 12 Based on AGL’s standing offer and the best of the published market offers (including pay on time discounts).

NSW Energy Prices July 2021: An update report on the NSW Tariff-Tracking Project 3
l Compared to electricity offers, the difference between the best and the worst gas market offers is quite small. The difference between the best and the worst market offers is $200 per annum. See section 2.2.
l 21 out of the 25 retailers that changed their offers between July 2020 and July 2021 in the Ausgrid network reduced their base rates.13 Only one retailer significantly increased its base rates during this period. Furthermore, in terms of bills inclusive of pay on time discounts, there is also only one retailer that has an offer that produces a higher bill post July 2021 compared to last year despite barely changing its base rate. This is a significant change compared to 2019 (when the DMO took effect) when many retailers reduced their discounts as well as their base rates (resulting in low overall bill reductions for many customers). See section 3.
l Since the introduction of the DMO in July 2019, many electricity retailers have moved away from pay on time discounts to offer guaranteed discount or no discount at all. Consequently, the difference between a bill paid late versus on time is now typically low. See section 3.
l Only two retailers, Diamond Energy and 1st Energy, still offer significant pay on time discounts. Diamond Energy, for example, offers a 7% discount off the bills if customers pay on time and this discount, combined with a late payment fee of $15, means that a late paying customer can be $260 worse off per annum in the Essential network.14 Furthermore, as mandatory monthly billing is becoming increasingly common, customers that always pay late can be charged significant amounts in late payment fees by retailers that apply these fees as well as insisting on monthly billing. See section 3.
l As of July 2021, the electricity network charges increased in Ausgrid and Essential while it decreased in Endeavour. The network proportion of the retail bill is currently 33% in Ausgrid and Endeavour and 42% in Essential. See section 4.1.
l For gas, the distribution charges increased in July 2021.15 Gas distribution charges as proportion of bills also increased in July 2021 as the retail bill decreased while the DUOS increased. The DUOS proportion of gas retail bills is currently 24% (up from 21% last year). See section 4.2.
l The average annual bill for new solar customers (using 7,200 kWh/annum) with 3kW systems installed is around $685 to $795 less compared to non-solar customers. See section 5.
l Some retailers now offer a relatively high FIT rate for a set amount of kWh exported each day and a much lower FIT rate for any export above that. A declining FIT rate can have significant impact on households with a moderate export capacity. A Sydney household exporting 604 kWh per quarter, for example, would receive a quarterly FIT credit of approximately $360 on Red Energy’s declining FIT rate of 18 cents and 6 cents. The same household would have received a quarterly FIT credit of around $410 if they were on AGL’s Solar Saver offer with a single FIT rate of 17 cents. See section 5.
l Dual fuel households in greater Sydney have received the greatest reductions to energy costs as gas prices have decreased in the Jemena network combined with a (state-wide) decrease in electricity prices. For many locations in rural and regional NSW, however, an increase in gas prices off-sets much of the savings obtained from reduced electricity costs. See section 6.
13 Note that this analysis only includes retailers that had published market offers in July 2020 as well as July 2021, and that changed their offers over this period.14 Based on households using 7,200 kWh per annum, single rate and inclusive of GST.15 Based on the Jemena gas zone in greater Sydney.
St Vincent de Paul & Alviss Consulting | July 20214
1. Energy price changes16
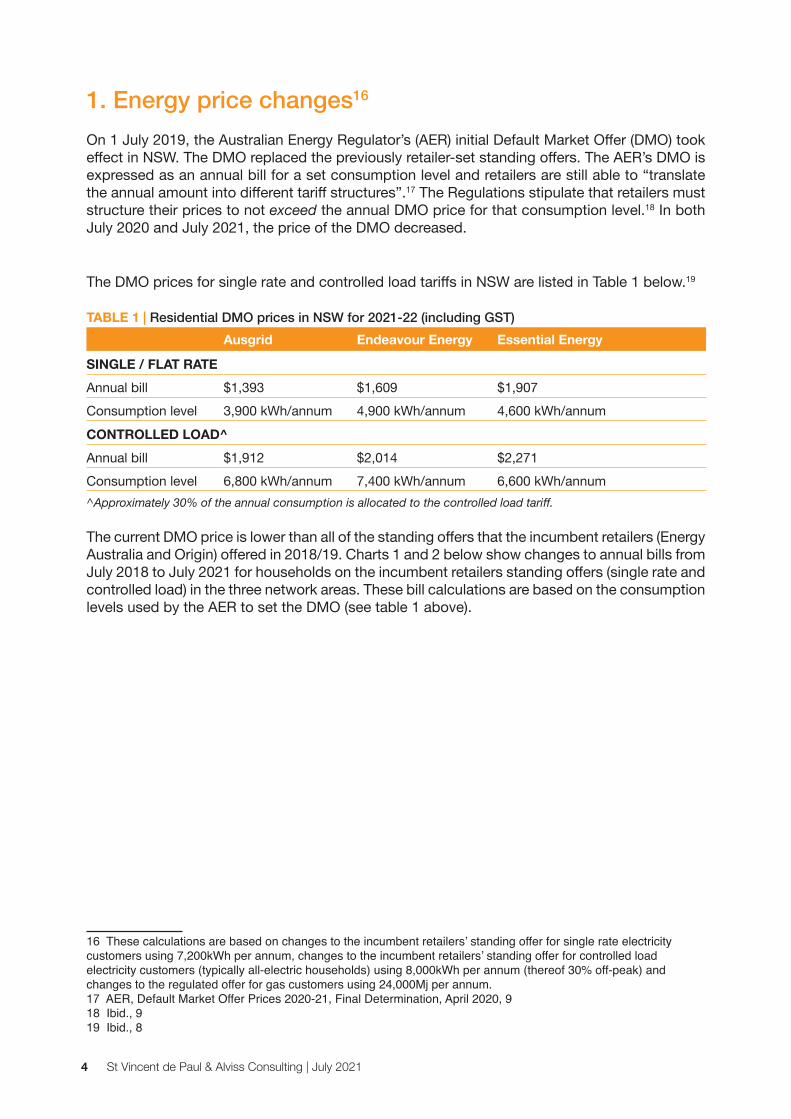
On 1 July 2019, the Australian Energy Regulator’s (AER) initial Default Market Offer (DMO) took effect in NSW. The DMO replaced the previously retailer-set standing offers. The AER’s DMO is expressed as an annual bill for a set consumption level and retailers are still able to “translate the annual amount into different tariff structures”.17 The Regulations stipulate that retailers must structure their prices to not exceed the annual DMO price for that consumption level.18 In both July 2020 and July 2021, the price of the DMO decreased.
The DMO prices for single rate and controlled load tariffs in NSW are listed in Table 1 below.19
TABLE 1 | Residential DMO prices in NSW for 2021-22 (including GST)Ausgrid Endeavour Energy Essential Energy
SINGLE / FLAT RATEAnnual bill $1,393 $1,609 $1,907Consumption level 3,900 kWh/annum 4,900 kWh/annum 4,600 kWh/annumCONTROLLED LOAD^Annual bill $1,912 $2,014 $2,271Consumption level 6,800 kWh/annum 7,400 kWh/annum 6,600 kWh/annum^Approximately 30% of the annual consumption is allocated to the controlled load tariff.
The current DMO price is lower than all of the standing offers that the incumbent retailers (Energy Australia and Origin) offered in 2018/19. Charts 1 and 2 below show changes to annual bills from July 2018 to July 2021 for households on the incumbent retailers standing offers (single rate and controlled load) in the three network areas. These bill calculations are based on the consumption levels used by the AER to set the DMO (see table 1 above).
16 These calculations are based on changes to the incumbent retailers’ standing offer for single rate electricity customers using 7,200kWh per annum, changes to the incumbent retailers’ standing offer for controlled load electricity customers (typically all-electric households) using 8,000kWh per annum (thereof 30% off-peak) and changes to the regulated offer for gas customers using 24,000Mj per annum. 17 AER, Default Market Offer Prices 2020-21, Final Determination, April 2020, 918 Ibid., 919 Ibid., 8
NSW Energy Prices July 2021: An update report on the NSW Tariff-Tracking Project 5
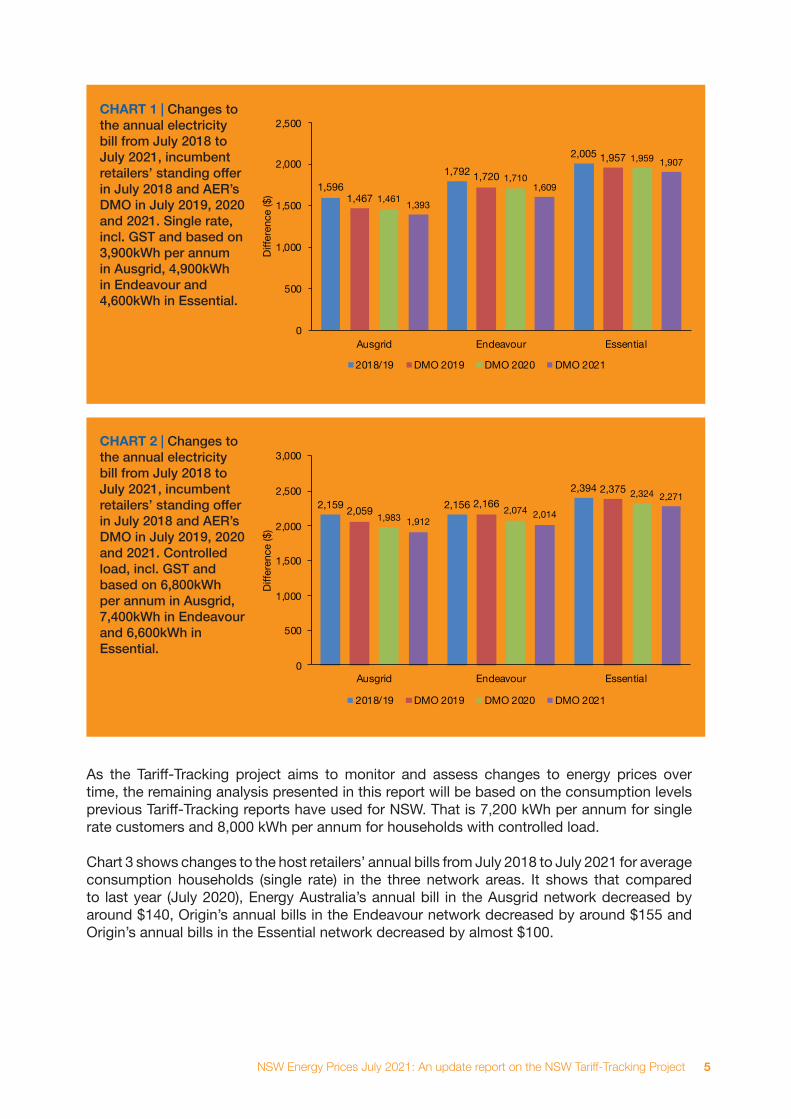
CHART 1 | Changes to the annual electricity bill from July 2018 to July 2021, incumbent retailers’ standing offer in July 2018 and AER’s DMO in July 2019, 2020 and 2021. Single rate, incl. GST and based on 3,900kWh per annum in Ausgrid, 4,900kWh in Endeavour and 4,600kWh in Essential.
CHART 2 | Changes to the annual electricity bill from July 2018 to July 2021, incumbent retailers’ standing offer in July 2018 and AER’s DMO in July 2019, 2020 and 2021. Controlled load, incl. GST and based on 6,800kWh per annum in Ausgrid, 7,400kWh in Endeavour and 6,600kWh in Essential.
As the Tariff-Tracking project aims to monitor and assess changes to energy prices over time, the remaining analysis presented in this report will be based on the consumption levels previous Tariff-Tracking reports have used for NSW. That is 7,200 kWh per annum for single rate customers and 8,000 kWh per annum for households with controlled load.
Chart 3 shows changes to the host retailers’ annual bills from July 2018 to July 2021 for average consumption households (single rate) in the three network areas. It shows that compared to last year (July 2020), Energy Australia’s annual bill in the Ausgrid network decreased by around $140, Origin’s annual bills in the Endeavour network decreased by around $155 and Origin’s annual bills in the Essential network decreased by almost $100.
1,5961,792
2,005
1,467
1,720
1,957
1,461
1,710
1,959
1,393
1,609
1,907
0
500
1,000
1,500
2,000
2,500
Ausgrid Endeavour Essential
Diffe
renc
e ($
)
Chart 1
2018/19 DMO 2019 DMO 2020 DMO 2021
2,159 2,1562,394
2,059 2,1662,375
1,9832,074
2,324
1,9122,014
2,271
0
500
1,000
1,500
2,000
2,500
3,000
Ausgrid Endeavour Essential
Diffe
renc
e ($
)
Chart 2
2018/19 DMO 2019 DMO 2020 DMO 2021

St Vincent de Paul & Alviss Consulting | July 20216
CHART 3 | Changes to the annual electricity bill from July 2018 to July 2021, incumbent retailers’ standing offer incl GST based on 7,200kWh per annum for single rate
Chart 4 shows changes to the host retailers’ annual bills from July 2018 to July 2021 for average consumption households with controlled load. It shows that compared to last year (July 2020), Energy Australia’s annual bill in the Ausgrid network decreased by approximately $130 and Origin’s annual bills in the Endeavour and Essential networks decreased by around $70.
CHART 4 | Changes to the annual electricity bill from July 2018 to July 2021, incumbent retailers’ standing offer incl GST based on 8,000kWh per annum, thereof 30% controlled load
Chart 5 shows estimated annual bills for standing offer/DMO customers (single rate, 7,200kWh/annum) in each of the three network areas. The average standing offer is highest in Essential’s area (approximately $2,635) while Endeavour and Ausgrid’s average standing offer are roughly $2,175 and $2,255 respectively. The maximum price spread (the difference between the best and the worst offer) is highest in Endeavour at $390. In Essential the price spread is $245 and in Ausgrid it is $225.20
20 As new retailers enter the market and some retailers exit, many of the retailers included in this year’s analysis did not offer electricity to NSW consumers in July 2020 and we have therefore not compared 2020 and 2021 standing offer prices across all retailers. Furthermore, Sumo Power did not list a standing offer for the Essential network and Powerclub did not have one in the Endeavour network.
2,6612,477
2,819
2,446 2,376
2,749
2,437 2,364
2,754
2,297 2,207
2,656
0
500
1,000
1,500
2,000
2,500
3,000
Ausgrid Endeavour Essential
Diffe
renc
e ($
)
Chart 3
Jul-18 Jul-19 Jul-20 Jul-21
2,4772,301
2,771
2,2892,113
2,751
2,275 2,215
2,688
2,144 2,144
2,619
0
500
1,000
1,500
2,000
2,500
3,000
Ausgrid Endeavour Essential
Diffe
renc
e ($
)
Chart 4
Jul-18 Jul-19 Jul-20 Jul-21

NSW Energy Prices July 2021: An update report on the NSW Tariff-Tracking Project 7
CHART 5 | Electricity standing offers as annual bills, July 2021, based on 7,200kWh per annum for single rate, incl GST.
The three standard gas retailers are AGL, ActewAGL and Origin Energy. Jemena’s Sydney zone (AGL) is the largest in terms of customer numbers. Origin is the incumbent retailer in seven pricing zones while ActewAGL is in three.
TABLE 2 | Gas supply areas in NSW NSW Gas Zones and incumbent retailers
Jemena Sydney (AGL) Sydney, Newcastle, Wollongong, Blue Mountains
Jemena Regional (ActewAGL) Boroowa, Goulburn, Yass and Young
Envestra (Origin) Cooma and BombalaTemora*, Holbrook, Henty, Culcairn and Walla WallaTumut and GundagaiWagga Wagga and UranquityAlbury, Moama and JinderaMurray Valley Towns
Central ranges (Origin) Tamworth
ActewAGL (ActewAGL) Queanbeyan and BundgendoreShoalhaven
* Temora has been under the same pricing zone as Holbrook, Henty etc. since July 2013
The difference between winter and summer consumption will vary significantly from household to household (depending primarily upon usage of gas space heating). The charts below do not adjust for increased winter consumption but assume consistent consumption levels throughout the year. Because of the seasonality of gas consumption and gas tariffs the annual bill calculations presented in this report are indicative only, and their primary purpose is to track changes over time and analyse differences between gas zones.
1,500
1,700
1,900
2,100
2,300
2,500
2,700
2,900
AGL
Alint
a En
ergy
Cova
UDi
amon
d En
ergy
Dodo
Pow
er &
Gas
Ener
gyAu
stra
liaM
ojo
Pow
erM
omen
tum
Ene
rgy
Orig
in E
nerg
yPo
wer
dire
ctPo
wer
shop
Red
Ener
gySi
mpl
y En
ergy
1st E
nerg
yRe
Ampe
d En
ergy
Pow
erclu
bEn
ova
Ener
gyDi
scov
er E
nerg
yFu
ture
X P
ower
Nect
rO
VO E
nerg
ySu
mo
Pow
erTa
ngo
Ener
gy
$ pe
r ann
um
Chart 5
Ausgrid Endeavour Essential
St Vincent de Paul & Alviss Consulting | July 20218
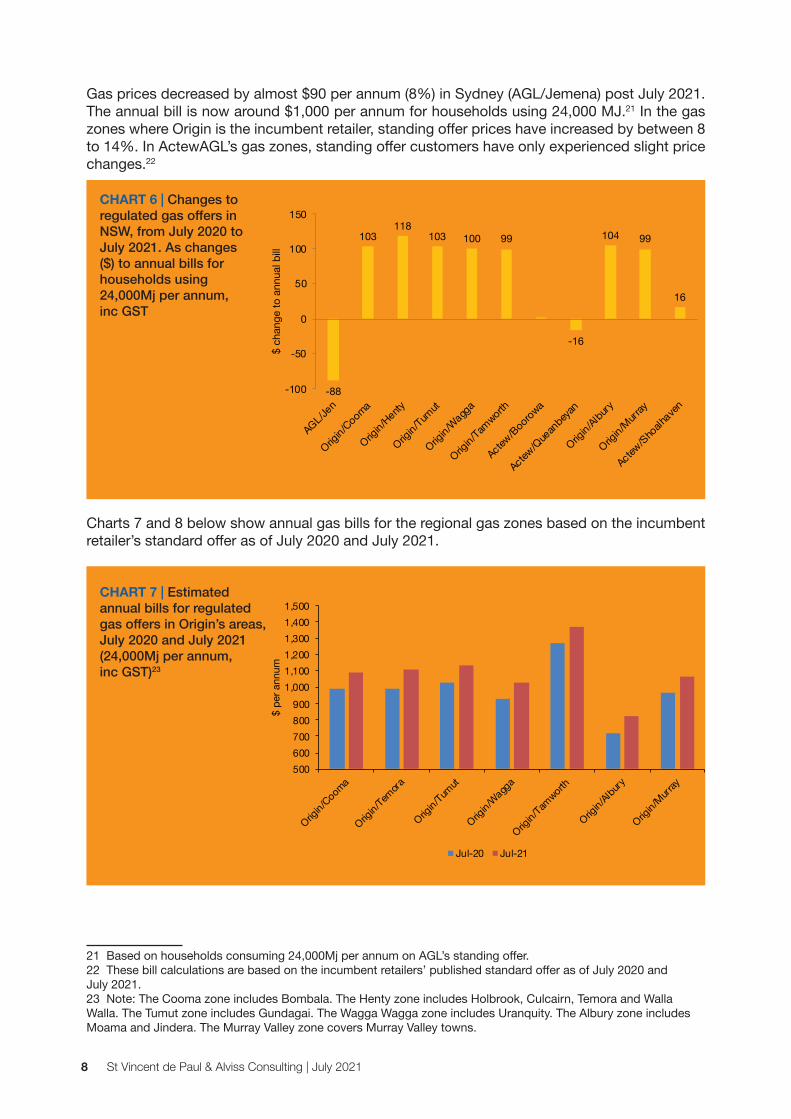
Gas prices decreased by almost $90 per annum (8%) in Sydney (AGL/Jemena) post July 2021. The annual bill is now around $1,000 per annum for households using 24,000 MJ.21 In the gas zones where Origin is the incumbent retailer, standing offer prices have increased by between 8 to 14%. In ActewAGL’s gas zones, standing offer customers have only experienced slight price changes.22
CHART 6 | Changes to regulated gas offers in NSW, from July 2020 to July 2021. As changes ($) to annual bills for households using 24,000Mj per annum, inc GST
Charts 7 and 8 below show annual gas bills for the regional gas zones based on the incumbent retailer’s standard offer as of July 2020 and July 2021.
CHART 7 | Estimated annual bills for regulated gas offers in Origin’s areas, July 2020 and July 2021 (24,000Mj per annum, inc GST)23
21 Based on households consuming 24,000Mj per annum on AGL’s standing offer.22 These bill calculations are based on the incumbent retailers’ published standard offer as of July 2020 and July 2021.23 Note: The Cooma zone includes Bombala. The Henty zone includes Holbrook, Culcairn, Temora and Walla Walla. The Tumut zone includes Gundagai. The Wagga Wagga zone includes Uranquity. The Albury zone includes Moama and Jindera. The Murray Valley zone covers Murray Valley towns.
-88
103118
103 100 99
-16
104 99
16
-100
-50
0
50
100
150
AGL/Jen
Origin/Cooma
Origin/Henty
Origin/Tum
ut
Origin/W
agga
Origin/Tam
worth
Actew/Boorowa
Actew/Q
uean
beyan
Origin/Albury
Origin/M
urray
Actew/Sho
alhaven
$ ch
ange
to a
nnua
l bill
Chart 6
500600700800900
1,0001,1001,2001,3001,4001,500
Origin/Cooma
Origin/Tem
ora
Origin/Tum
ut
Origin/W
agga
Origin/Tam
worth
Origin/Albury
Origin/M
urray
$ pe
r ann
um
Chart 7
Jul-20 Jul-21

NSW Energy Prices July 2021: An update report on the NSW Tariff-Tracking Project 9
CHART 8 | Estimated annual bills for regulated gas offers in ActewAGL’s areas, July 2020 and July 2021 (24,000Mj per annum, inc GST)24
Table 3 below summarises the price trends for NSW gas offers. For more detailed information about the areas and differences in energy price changes see section 5.
TABLE 3 | Changes to gas prices by area July 2020 – July 202125
Area Changes to annual bill since July 2020 Percentage
Sydney, Newcastle, Wollongong, Blue Mountains (AGL) -$90 -8%
Cooma and Bombala (Origin) $105 10%
Temora, Holbrook, Henty, Culcairn and Walla (Origin) $120 12%
Tumut and Gundagai (Origin) $105 10%
Wagga Wagga and Uranquity (Origin) $100 11%
Tamworth (Origin) $100 8%
Boroowa, Goulburn, Yass and Young (ActewAGL) $0 0%
Queanbeyan and Bundgendore (ActewAGL) -$15 -1%
Shoalhaven (ActewAGL) $15 1%
Albury, Moama and Jindera (Origin) $105 14%
Murray Valley Towns (Origin) $100 10%
24 Note: The Boorowa zone includes Goulbourn, Yass and Young. The Queanbeyan zone includes Bungendore. 25 Based on the regulated gas rates for customers using 24,000Mj per annum.
500
600
700
800
900
1,000
1,100
1,200
Actew/Boorowa Actew/Queanbeyan Actew/Shoalhaven
$ pe
r ann
um
Chart 8
Jul-20 Jul-21

St Vincent de Paul & Alviss Consulting | July 202110
2. Market offers July 2021 2.1 Electricity market offers July 2021
l The average electricity market offer (including guaranteed and pay on time discounts) produces an annual bill of $2,265 in the Essential Energy network, $1,890 in Ausgrid and $1,870 in Endeavour.26
l In July 2021, the average market offer for households consuming 7,200 kWh per annum decreased by -4% in Essential and by -7% in Endeavour and Ausgrid.27
l Typical consumption households (7,200kWh) can save $610 - $725 per annum (depending on their network area) if switching from the incumbent retailer’s standing offer to the best market offer.28 The maximum saving is similar to last year when it was $640 - $720.
l The difference between the best and the worst market offer ranges $630 (in Ausgrid’s area) to $765 (in Essential’s area) for customers with typical consumption levels.29 Chart 9 below shows the retail market offer price-spread within each of the three network areas. This difference is somewhat lower compared to last year when it was $745 - $890.
CHART 9 | Price-spread for electricity market offers in each network area as of July 2021 (incl GST), including discounts and pay on time discounts - Households consuming 7,200kWh per annum (single rate)
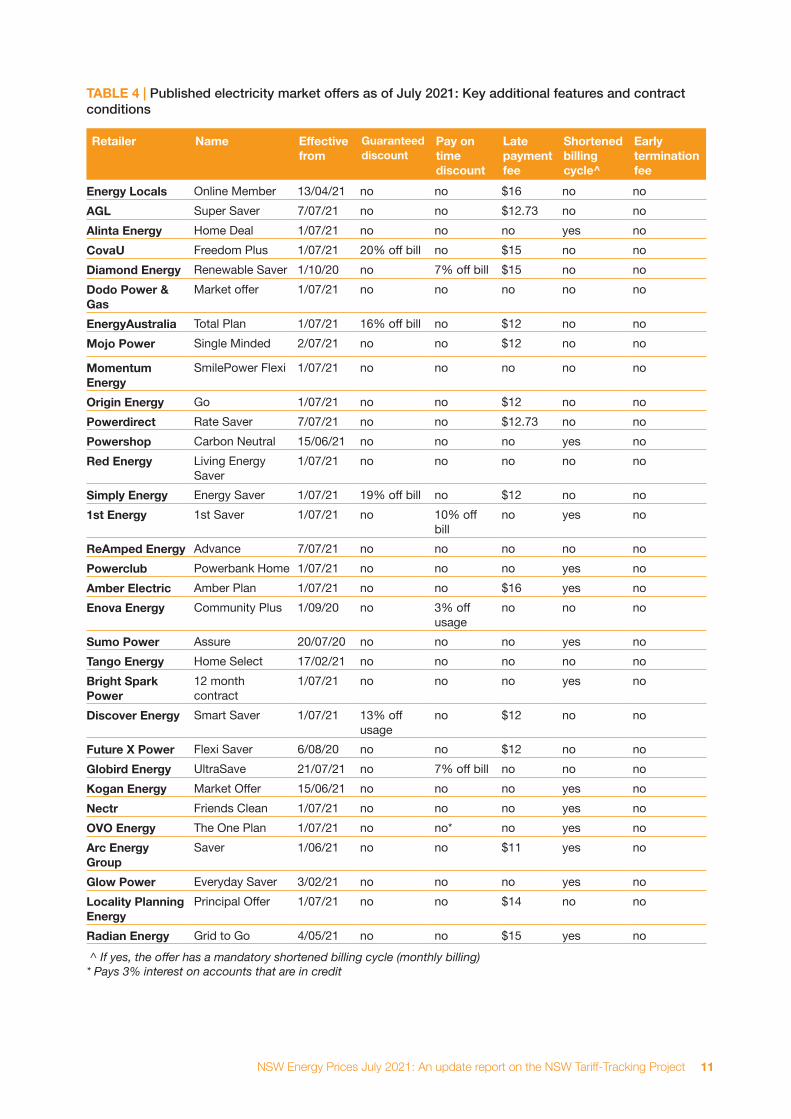
Table 4 below shows additional discounts applicable to the electricity retailers’ published market offer rates. Table 4 also shows other contract terms and features, such as late payment fees, associated with these market offers. Some of the retailers have multiple market offers and may offer higher (or lower) discounts than those listed here. However, if the discounts are higher they are tied to other conditions such as payment by direct debit.
There are some retailers (Energy Locals, Powerclub and Amber Electric) that have offers that include a membership fee. When analysis offers that include a membership fee, we have added this amount to the fixed supply charge. 26 Based on the average market offer (all retailers) for each network area, single rate and inclusive of pay on time discounts.27 Ibid. Post July 2021 offers compared to post July 2020 offers. 28 Based on the incumbent retailer’s standing offer (single rate) and the best of the published market offers (including additional discounts and/or pay on time discounts).29 Households using 7,200kWh per annum (single rate) and all market offer bills include additional discounts and/or pay on time discounts.
1,500
1,700
1,900
2,100
2,300
2,500
2,700
1 2 3 4 5 6 7 8 9 10 11 12 13 14 15 16 17 18 19 20 21 22 23 24 25 26 27 28 29 30 31 32
$ pe
r ann
um
Retail offers
Chart 9
Essential Ausgrid Endeavour
NSW Energy Prices July 2021: An update report on the NSW Tariff-Tracking Project 11
TABLE 4 | Published electricity market offers as of July 2021: Key additional features and contract conditions
Retailer Name Effective from
Guaranteed discount
Pay on time discount
Late payment fee
Shortened billing cycle^
Early termination fee
Energy Locals Online Member 13/04/21 no no $16 no noAGL Super Saver 7/07/21 no no $12.73 no noAlinta Energy Home Deal 1/07/21 no no no yes noCovaU Freedom Plus 1/07/21 20% off bill no $15 no noDiamond Energy Renewable Saver 1/10/20 no 7% off bill $15 no noDodo Power & Gas
Market offer 1/07/21 no no no no no
EnergyAustralia Total Plan 1/07/21 16% off bill no $12 no noMojo Power Single Minded 2/07/21 no no $12 no no
Momentum Energy
SmilePower Flexi 1/07/21 no no no no no
Origin Energy Go 1/07/21 no no $12 no noPowerdirect Rate Saver 7/07/21 no no $12.73 no noPowershop Carbon Neutral 15/06/21 no no no yes noRed Energy Living Energy
Saver1/07/21 no no no no no
Simply Energy Energy Saver 1/07/21 19% off bill no $12 no no1st Energy 1st Saver 1/07/21 no 10% off
billno yes no
ReAmped Energy Advance 7/07/21 no no no no noPowerclub Powerbank Home 1/07/21 no no no yes noAmber Electric Amber Plan 1/07/21 no no $16 yes noEnova Energy Community Plus 1/09/20 no 3% off
usageno no no
Sumo Power Assure 20/07/20 no no no yes noTango Energy Home Select 17/02/21 no no no no noBright Spark Power
12 month contract
1/07/21 no no no yes no
Discover Energy Smart Saver 1/07/21 13% off usage
no $12 no no
Future X Power Flexi Saver 6/08/20 no no $12 no noGlobird Energy UltraSave 21/07/21 no 7% off bill no no noKogan Energy Market Offer 15/06/21 no no no yes noNectr Friends Clean 1/07/21 no no no yes noOVO Energy The One Plan 1/07/21 no no* no yes noArc Energy Group
Saver 1/06/21 no no $11 yes no
Glow Power Everyday Saver 3/02/21 no no no yes noLocality Planning Energy
Principal Offer 1/07/21 no no $14 no no
Radian Energy Grid to Go 4/05/21 no no $15 yes no ^ If yes, the offer has a mandatory shortened billing cycle (monthly billing)* Pays 3% interest on accounts that are in credit

St Vincent de Paul & Alviss Consulting | July 202112
2.1.1 Potential savings - Differences between electricity offers
Typical consumption households (7,200kWh per annum) on the incumbent retailer’s standing offer can save $610 - $725 per annum if switching to the best published market offer.30 Importantly, it is the difference between individual retailers’ offers that can produce significant savings if switching from a standing offer to a market offer. Customers who choose to stay with the same retailer, but change to a market offer, are unlikely to experience annual savings as large as these.
Charts 10-12 below show annual retail bills for typical consumption (7,200kWh per annum, single rate) for each of the three network areas. The columns to the left represent the market offer bills including guaranteed discounts (but not pay on time discounts) while the columns to the right are market offer bills including pay on time discounts.31 The dotted lines show the average market offer (including pay on time discounts) in each network area.
AusgridIn Ausgrid’s area, average consumption households on Energy Australia’s standing offer can save $725 per annum if switching to the best published market offer. ReAmped Energy is the retailer that currently offers the best market offer rates in this area.
CHART 10 | Ausgrid’s network area: Estimated annual bills (incl GST) for electricity market offers July 2021, including discounts and pay on time discounts - Households consuming 7,200kWh per annum (single rate)
The difference between the best and the worst market offer is also significant. ReAmped Energy’s offer is approximately $765 less than Diamond Energy’s market offer post discounts (and pay on time discounts) for households with this consumption level. Figure 1 below shows estimated annual bills for market offers post discounts in Ausgrid’s network area. 32
30 Based on market offer bills that include discounts and pay on time discounts.31 These market offers were collected in mid-July 2021 and it should be noted that retailers may change their rates at any time. Discounts (excluding GST) have been applied to consumption and/or total bill as per offers listed in table 3. 32 These market offers were collected in mid-July 2021 and it should be noted that retailers may change their rates at any time. Additional discounts for customers choosing to pay by direct debit are not included in these bill calculations.
1,2001,6002,0002,4002,8003,200
1st E
nerg
yAG
LAl
inta
Ener
gyAm
ber E
lectri
cAr
c En
ergy
Gro
upBr
ight
Spa
rk P
ower
Cova
UDi
amon
d En
ergy
Disc
over
Ene
rgy
Dodo
Pow
er &
Gas
Ener
gy L
ocals
Ener
gyAu
stra
liaEn
ova
Ener
gyFu
ture
X P
ower
Glo
Bird
Ene
rgy
Glo
w Po
wer
Koga
n En
ergy
Loca
lity P
lanni
ng…
Moj
o Po
wer
Mom
entu
m E
nerg
yNe
ctr
Orig
in E
nerg
yO
VO E
nerg
yPo
wer
club
Pow
erdi
rect
Pow
ersh
opRa
dian
Ene
rgy
ReAm
ped
Ener
gyRe
d En
ergy
Sim
ply
Ener
gySu
mo
Pow
erTa
ngo
Ener
gy
Retail offers in Ausgrid's area
Chart 10
Market (inc guaranteed disc) Market (inc POT)Avg Market (inc POT)

NSW Energy Prices July 2021: An update report on the NSW Tariff-Tracking Project 13
FIGURE 1 | Ausgrid’s network area: Lowest to highest annual bills (incl GST) for market offers July 2021, including discounts and pay on time discounts - Households consuming 7,200kWh per annum (single rate)
ReAmped Energy $1,575
Energy Locals $1,694
Tango Energy $1,710
Kogan Energy $1,711
Alinta Energy $1,733
OVO Energy $1,783
Powerclub $1,795
Locality Planning $ 1,803
Powershop $1,804
Sumo Power $1,827
Arc Energy Group $1,834
Nectr $1,845
AGL $1,853
Discover Energy $1,861
Powerdirect $1,866
Simply Energy $1,876
Origin Energy $1,884
Glow Power $1,898
Future X Power $1,902
Bright Spark Power $1,907
Dodo Power & Gas $1,924
EnergyAustralia $1,931
CovaU $1,938
Radian Energy $1,941
GloBird Energy $1,964
Mojo Power $1,970
Enova Energy $1,982
Red Energy $2,021
1st Energy $2,054
Momentum Energy $2,107
Amber Electric $2,135
Diamond Energy $2,341
Energy

St Vincent de Paul & Alviss Consulting | July 202114
EndeavourIn Endeavour’s network area, average consumption households on Origin’s standing offer can save approximately $610 per annum if switching to the best published market offer. ReAmped Energy is the retailer with the best market offer rates.
CHART 11 | Endeavour’s network area: Estimated annual bills (incl GST) for electricity market offers July 2021, including discounts and pay on time discounts - Households consuming 7,200kWh per annum (single rate)
The difference between the best and the worst market offer is less than in Ausgrid’s network area. ReAmped Energy’s offer is approximately $660 less than Diamond Energy’s market offer post discounts (and pay on time discounts) for households with this consumption level. Figure 2 below shows estimated annual bills for market offers post discounts in Endeavour’s network.33
33 These market offers were collected in mid-July 2021 and it should be noted that retailers may change their rates at any time. Additional discounts for customers choosing to pay by direct debit are not included in these bill calculations.
1,2001,6002,0002,4002,8003,200
1st E
nerg
yAG
LAl
inta
Ener
gyAm
ber E
lectri
cAr
c En
ergy
Gro
upBr
ight
Spa
rk P
ower
Cova
UDi
amon
d En
ergy
Disc
over
Ene
rgy
Dodo
Pow
er &
Gas
Ener
gy L
ocals
Ener
gyAu
stra
liaEn
ova
Ener
gyFu
ture
X P
ower
Glo
Bird
Ene
rgy
Glo
w Po
wer
Koga
n En
ergy
Loca
lity P
lanni
ng…
Moj
o Po
wer
Mom
entu
m E
nerg
yNe
ctr
Orig
in E
nerg
yO
VO E
nerg
yPo
wer
club
Pow
erdi
rect
Pow
ersh
opRa
dian
Ene
rgy
ReAm
ped
Ener
gyRe
d En
ergy
Sim
ply
Ener
gySu
mo
Pow
erTa
ngo
Ener
gy
Retail offers in Endeavour's area
Chart 11
Market (inc guaranteed disc) Market (inc POT)Avg Market (inc POT)

NSW Energy Prices July 2021: An update report on the NSW Tariff-Tracking Project 15
FIGURE 2 | Endeavour’s network area: Lowest to highest annual bills (incl GST) for market offers July 2021, including discounts and pay on time discounts - Households consuming 7,200kWh per annum (single rate)
EssentialIn Essential’s network area, average consumption households on Origin’s standing offer can save approximately $625 per annum if switching to the best published market offer. Energy Locals is the retailer with the best market offer rates in this network area.
CHART 12 | Essential’s network area: Estimated annual bills (incl GST) for electricity market offers July 2021, including discounts and pay on time discounts - Households consuming 7,200kWh per annum (single rate)
ReAmped Energy $1,598
Kogan Energy $1,686
Energy Locals $1,690
Powerclub $1,762
Locality Planning $1,768
Tango Energy $1,775
Powerdirect $1,778
AGL $1,791
Alinta Energy $1,794
Powershop $1,798
Bright Spark Power $1,800
OVO Energy $1,804
Discover Energy $1,809
Simply Energy $1,812
Arc Energy Group $1,829
EnergyAustralia $1,860
Glow Power $1,861
Sumo Power $1,861
Future X Power $1,867
Radian Energy $1,885
Nectr $1,892
Origin Energy $1,898
Mojo Power $1,919
Dodo Power & Gas $1,931
GloBird Energy $1,960
Red Energy $1,964
Enova Energy $1,968
1st Energy $2,014
Momentum Energy $2,029
CovaU $2,120
Amber Electric $2,126
Diamond Energy $2,258
Energy
1,2001,6002,0002,4002,8003,200
1st E
nerg
yAG
LAl
inta
Ener
gyAm
ber E
lectri
cBr
ight
Spa
rk P
ower
Cova
UDi
amon
d En
ergy
Disc
over
Ene
rgy
Dodo
Pow
er &
Gas
Ener
gy L
ocals
Ener
gyAu
stra
liaEn
ova
Ener
gyFu
ture
X P
ower
Glo
Bird
Ene
rgy
Glo
w Po
wer
Koga
n En
ergy
Loca
lity P
lanni
ng…
Moj
o Po
wer
Mom
entu
m E
nerg
yNe
ctr
Orig
in E
nerg
yO
VO E
nerg
yPo
wer
club
Pow
erdi
rect
Pow
ersh
opRa
dian
Ene
rgy
ReAm
ped
Ener
gyRe
d En
ergy
Sim
ply
Ener
gySu
mo
Pow
erTa
ngo
Ener
gy
Retail offers in Essential's area
Chart 12
Market (inc guaranteed disc) Market (inc POT)Avg Market (inc POT)
St Vincent de Paul & Alviss Consulting | July 202116
Energy Locals $2,031
ReAmped Energy $2,058
Alinta Energy $2,115
Kogan Energy $2,134
AGL $2,156
Powershop $2,161
Simply Energy $2,163
OVO Energy $2,169
Locality Planning $2,169
Powerdirect $2,173
Glow Power $2,174
Future X Power $2,189
Bright Spark Power $2,198
Tango Energy $2,201
Powerclub $2,205
Discover Energy $2,237
Nectr $2,250
EnergyAustralia $2,254
Origin Energy $2,257
Sumo Power $2,262
Red Energy $2,269
Enova Energy $2,284
Radian Energy $2,304
Dodo Power & Gas $2,338
GloBird Energy $2,338
1st Energy $2,404
Mojo Power $2,420
CovaU $2,489
Momentum Energy $2,547
Amber Electric $2,586
Diamond Energy $2,661
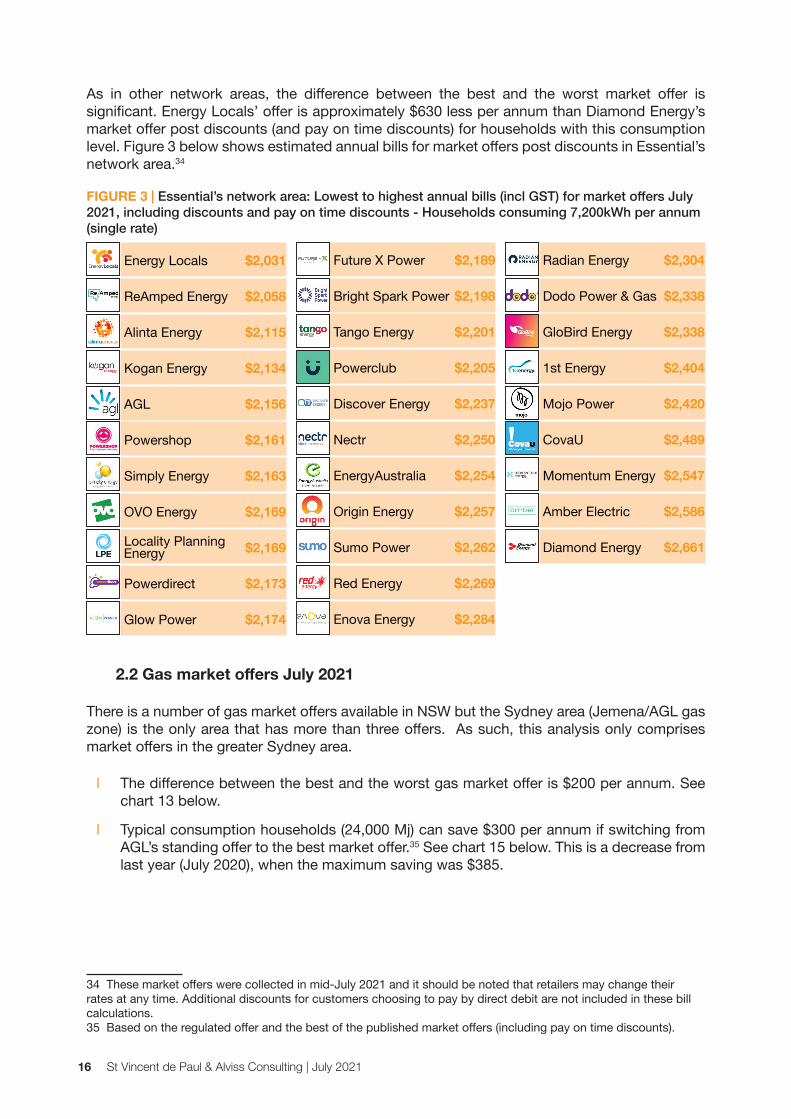
As in other network areas, the difference between the best and the worst market offer is significant. Energy Locals’ offer is approximately $630 less per annum than Diamond Energy’s market offer post discounts (and pay on time discounts) for households with this consumption level. Figure 3 below shows estimated annual bills for market offers post discounts in Essential’s network area.34
FIGURE 3 | Essential’s network area: Lowest to highest annual bills (incl GST) for market offers July 2021, including discounts and pay on time discounts - Households consuming 7,200kWh per annum (single rate)
2.2 Gas market offers July 2021
There is a number of gas market offers available in NSW but the Sydney area (Jemena/AGL gas zone) is the only area that has more than three offers. As such, this analysis only comprises market offers in the greater Sydney area.
l The difference between the best and the worst gas market offer is $200 per annum. See chart 13 below.
l Typical consumption households (24,000 Mj) can save $300 per annum if switching from AGL’s standing offer to the best market offer.35 See chart 15 below. This is a decrease from last year (July 2020), when the maximum saving was $385.
34 These market offers were collected in mid-July 2021 and it should be noted that retailers may change their rates at any time. Additional discounts for customers choosing to pay by direct debit are not included in these bill calculations.35 Based on the regulated offer and the best of the published market offers (including pay on time discounts).
Energy
NSW Energy Prices July 2021: An update report on the NSW Tariff-Tracking Project 17
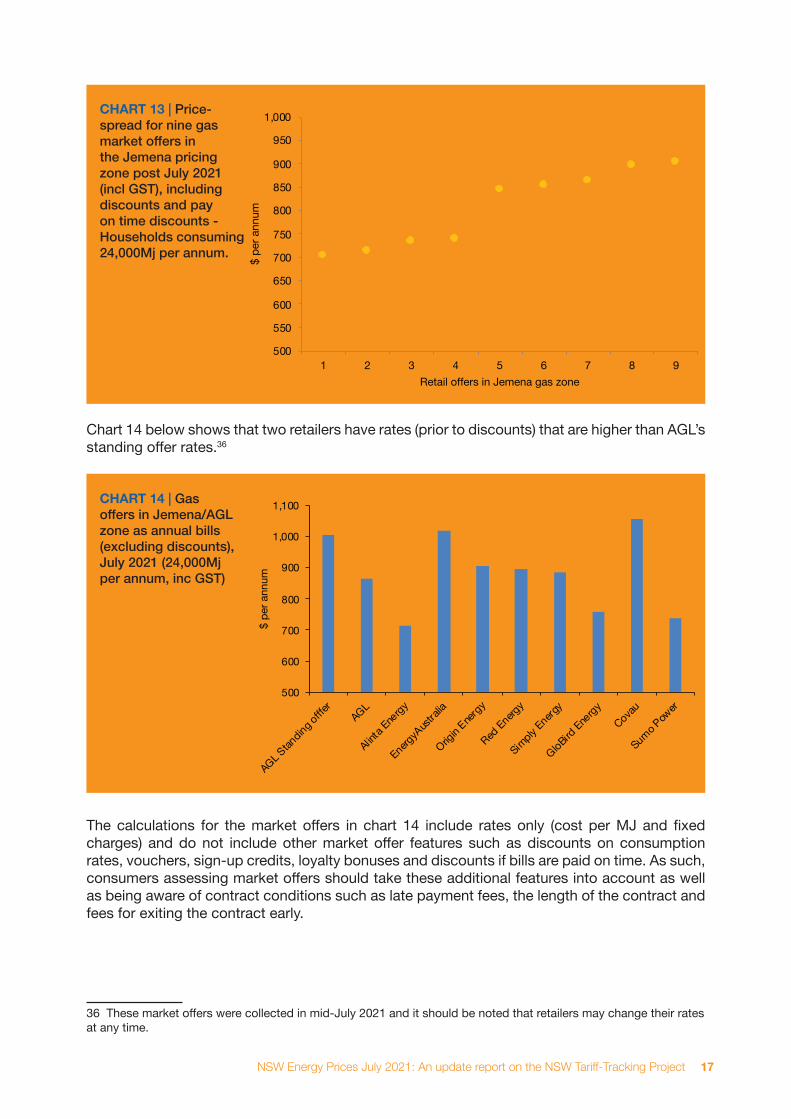
CHART 13 | Price-spread for nine gas market offers in the Jemena pricing zone post July 2021 (incl GST), including discounts and pay on time discounts - Households consuming 24,000Mj per annum.
Chart 14 below shows that two retailers have rates (prior to discounts) that are higher than AGL’s standing offer rates.36
CHART 14 | Gas offers in Jemena/AGL zone as annual bills (excluding discounts), July 2021 (24,000Mj per annum, inc GST)
The calculations for the market offers in chart 14 include rates only (cost per MJ and fixed charges) and do not include other market offer features such as discounts on consumption rates, vouchers, sign-up credits, loyalty bonuses and discounts if bills are paid on time. As such, consumers assessing market offers should take these additional features into account as well as being aware of contract conditions such as late payment fees, the length of the contract and fees for exiting the contract early.
36 These market offers were collected in mid-July 2021 and it should be noted that retailers may change their rates at any time.
500
550
600
650
700
750
800
850
900
950
1,000
1 2 3 4 5 6 7 8 9
$ pe
r ann
um
Retail offers in Jemena gas zone
Chart 13
500
600
700
800
900
1,000
1,100
AGL Standing o
fffer
AGL
Alinta E
nergy
EnergyA
ustral
ia
Origin Ener
gy
Red Energ
y
Simply E
nergy
GloBird Ene
rgyCovau
Sumo Pow
er
$ pe
r ann
um
Chart 14

St Vincent de Paul & Alviss Consulting | July 202118
Table 5 below shows additional discounts applicable to the gas retailers’ published market offer rates. It also shows other contract terms and features, such as late payment fees, associated with these market offers.
TABLE 5 | Published gas market offers in Jemena/AGL gas zone post July 2021: Key additional features and contract conditions
Retailer Name Effective from
Guaranteed discount
Pay on time discount
Late payment fee
Contract term/ benefit period
Early termination fee
AGL Super Saver 13/07/21 no no $12.73 12 months no
Alinta Energy Home Deal 1/07/21 no no no no no
Energy Australia
Total Plan 1/07/21 16% off bill no $12 12 months no
Origin Energy Go 1/07/21 no no $12 12 months no
Red Energy Living Energy Saver
1/07/21 no no no no no
Simply Energy Saver 1/07/21 17% off bill no $12 no no
GloBird UltraSave 11/06/21 no 7% off bill no no no
CovaU Freedom Plus 1/07/20 20% off bill no no no no
Sumo Power Assure 20/07/20 no no no no no
2.2.1 Potential savings - Differences between gas offers
Chart 15 below shows annual retail bills for market offers compared to AGL’s standing offer for typical consumption households (24,000kMj per annum) in the Jemena/AGL gas zone. The blue columns are the market offers including guaranteed discounts (but not pay on time discounts) while the green columns are market offer bills including pay on time discounts.37 The line represents AGL’s standing offer rates that took effect in July 2021.
Customers switching from AGL’s standard offer to GloBird Energy’s market offer can potentially save $300 on their annual gas bill (including discounts). If customers on AGL’s standard offer switch to AGL’s market offer, they will save $140 per annum. All market offers produce lower bills than AGL’s standard offer when discounts are included.
37 These market offers were collected in mid-July 2021 and it should be noted that retailers may change their rates at any time. Discounts have been applied to consumption and/or total bill as per offers listed in table 5.
NSW Energy Prices July 2021: An update report on the NSW Tariff-Tracking Project 19
CHART 15 | Gas offers in Jemena/AGL area: Estimated annual bill for market offers post July 2025 (guaranteed discount only and all discounts) compared to the regulated rates (based on 24,000Mj, incl GST)
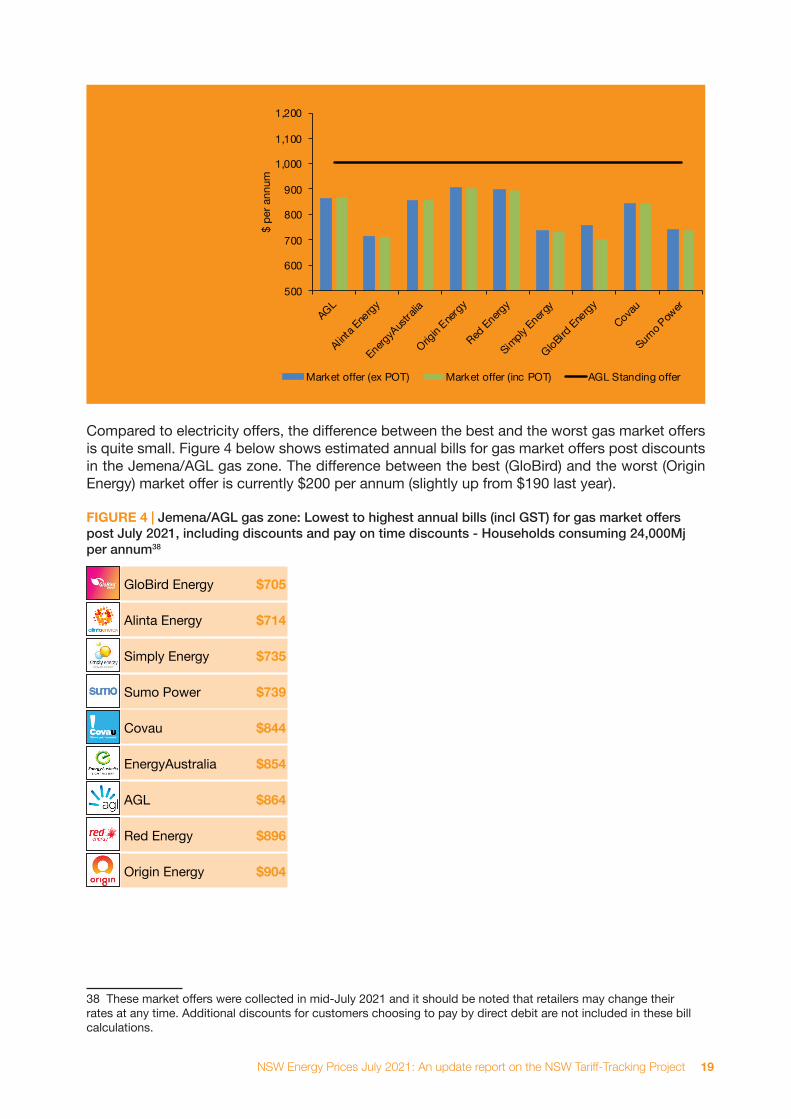
Compared to electricity offers, the difference between the best and the worst gas market offers is quite small. Figure 4 below shows estimated annual bills for gas market offers post discounts in the Jemena/AGL gas zone. The difference between the best (GloBird) and the worst (Origin Energy) market offer is currently $200 per annum (slightly up from $190 last year).
FIGURE 4 | Jemena/AGL gas zone: Lowest to highest annual bills (incl GST) for gas market offers post July 2021, including discounts and pay on time discounts - Households consuming 24,000Mj per annum38
38 These market offers were collected in mid-July 2021 and it should be noted that retailers may change their rates at any time. Additional discounts for customers choosing to pay by direct debit are not included in these bill calculations.
GloBird Energy $705
Alinta Energy $714
Simply Energy $735
Sumo Power $739
Covau $844
EnergyAustralia $854
AGL $864
Red Energy $896
Origin Energy $904
500
600
700
800
900
1,000
1,100
1,200
AGL
Alinta E
nergy
EnergyA
ustral
ia
Origin Ener
gy
Red Energ
y
Simply E
nergy
GloBird Ene
rgyCovau
Sumo Pow
er
$ pe
r ann
um
Chart 15
Market offer (ex POT) Market offer (inc POT) AGL Standing offer
St Vincent de Paul & Alviss Consulting | July 202120
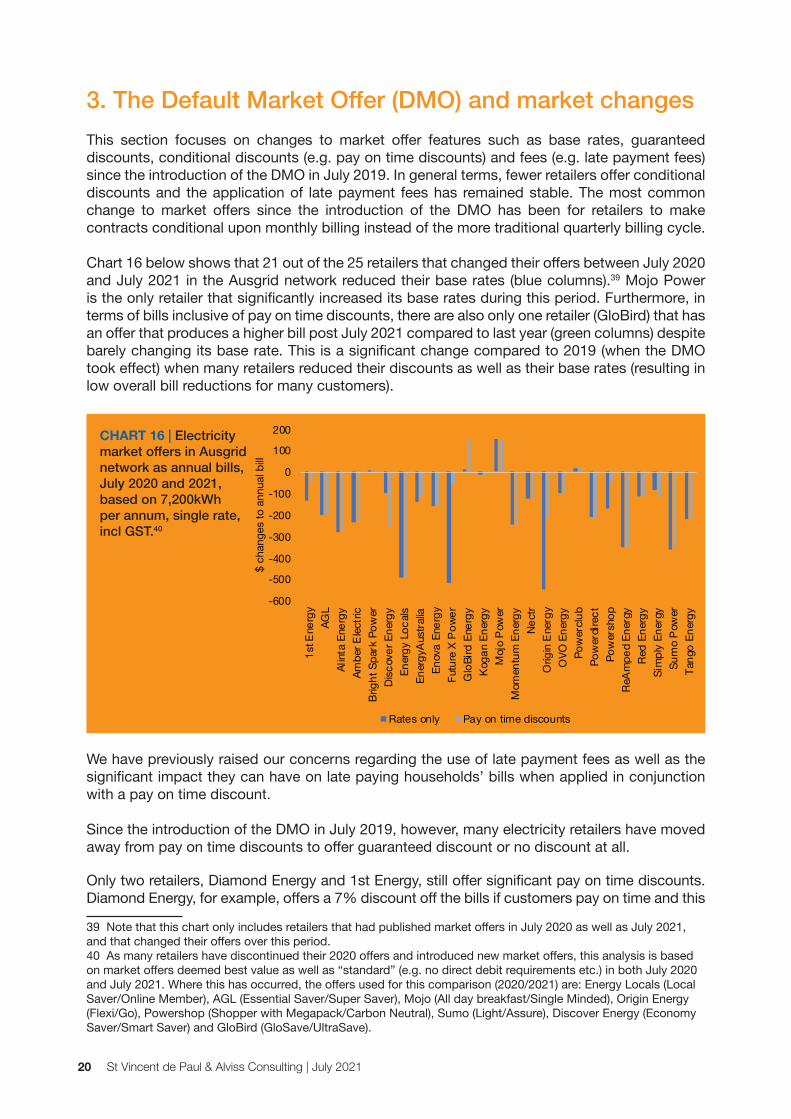
3. The Default Market Offer (DMO) and market changesThis section focuses on changes to market offer features such as base rates, guaranteed discounts, conditional discounts (e.g. pay on time discounts) and fees (e.g. late payment fees) since the introduction of the DMO in July 2019. In general terms, fewer retailers offer conditional discounts and the application of late payment fees has remained stable. The most common change to market offers since the introduction of the DMO has been for retailers to make contracts conditional upon monthly billing instead of the more traditional quarterly billing cycle.
Chart 16 below shows that 21 out of the 25 retailers that changed their offers between July 2020 and July 2021 in the Ausgrid network reduced their base rates (blue columns).39 Mojo Power is the only retailer that significantly increased its base rates during this period. Furthermore, in terms of bills inclusive of pay on time discounts, there are also only one retailer (GloBird) that has an offer that produces a higher bill post July 2021 compared to last year (green columns) despite barely changing its base rate. This is a significant change compared to 2019 (when the DMO took effect) when many retailers reduced their discounts as well as their base rates (resulting in low overall bill reductions for many customers).
CHART 16 | Electricity market offers in Ausgrid network as annual bills, July 2020 and 2021, based on 7,200kWh per annum, single rate, incl GST.40
We have previously raised our concerns regarding the use of late payment fees as well as the significant impact they can have on late paying households’ bills when applied in conjunction with a pay on time discount.
Since the introduction of the DMO in July 2019, however, many electricity retailers have moved away from pay on time discounts to offer guaranteed discount or no discount at all.
Only two retailers, Diamond Energy and 1st Energy, still offer significant pay on time discounts. Diamond Energy, for example, offers a 7% discount off the bills if customers pay on time and this
39 Note that this chart only includes retailers that had published market offers in July 2020 as well as July 2021, and that changed their offers over this period.40 As many retailers have discontinued their 2020 offers and introduced new market offers, this analysis is based on market offers deemed best value as well as “standard” (e.g. no direct debit requirements etc.) in both July 2020 and July 2021. Where this has occurred, the offers used for this comparison (2020/2021) are: Energy Locals (Local Saver/Online Member), AGL (Essential Saver/Super Saver), Mojo (All day breakfast/Single Minded), Origin Energy (Flexi/Go), Powershop (Shopper with Megapack/Carbon Neutral), Sumo (Light/Assure), Discover Energy (Economy Saver/Smart Saver) and GloBird (GloSave/UltraSave).
-600
-500
-400
-300
-200
-100
0
100
200
1st E
nerg
yAG
LAl
inta
Ener
gyAm
ber E
lectri
cBr
ight
Spa
rk P
ower
Disc
over
Ene
rgy
Ener
gy L
ocals
Ener
gyAu
stra
liaEn
ova
Ener
gyFu
ture
X P
ower
Glo
Bird
Ene
rgy
Koga
n En
ergy
Moj
o Po
wer
Mom
entu
m E
nerg
yNe
ctr
Orig
in E
nerg
yO
VO E
nerg
yPo
wer
club
Pow
erdi
rect
Pow
ersh
opRe
Ampe
d En
ergy
Red
Ener
gySi
mpl
y En
ergy
Sum
o Po
wer
Tang
o En
ergy
$ ch
ange
s to
ann
ual b
ill
Chart 16
Rates only Pay on time discounts

NSW Energy Prices July 2021: An update report on the NSW Tariff-Tracking Project 21
discount, combined with a late payment fee of $15, means that a late paying customer can be $260 worse off per annum in the Essential network.41 Furthermore, as mandatory monthly billing is becoming increasingly common, customers that always pay late can be charged significant amounts in late payment fees by the three retailers (Amber Electric, Radian Energy and Arc Energy Group) that charge late payment fees as well as have mandatory monthly billing. Table 6 shows how much more a late paying customer on each of the retail offers would pay per annum.42
TABLE 6 | The difference ($) to annual bill when customers pay late
Essential Ausgrid Endeavour
Diamond Energy 260 236 2301st Energy 267 228 224Amber Electric 192 192 192Radian Energy 180 180 180Arc Energy Group n/a 132 132Energy Locals 64 64 64CovaU 60 60 60Locality Planning Energy 56 56 56Enova Energy 54 52 51AGL 51 51 51Powerdirect 51 51 51Discover Energy 48 48 48EnergyAustralia 48 48 48Future X Power 48 48 48Mojo Power 48 48 48Origin Energy 48 48 48Simply Energy 48 48 48Alinta Energy 0 0 0Bright Spark Power 0 0 0Dodo Power & Gas 0 0 0GloBird Energy 0 0 0Glow Power 0 0 0Kogan Energy 0 0 0Momentum Energy 0 0 0Nectr 0 0 0OVO Energy 0 0 0Powerclub 0 0 0Powershop 0 0 0ReAmped Energy 0 0 0Red Energy 0 0 0Sumo Power 0 0 0Tango Energy 0 0 041 Based on households using 7,200 kWh per annum, single rate and inclusive of GST.42 If the retailer charges a late payment fee, the late payment fees have been multiplied according to how frequent customers are billed and included in the annual ‘late bill’ calculation. Amber Electric, Radian Energy and Arc Energy are retailers that bill monthly and charge late payment fees.
St Vincent de Paul & Alviss Consulting | July 202122
4. Network chargesThis section examines changes to electricity network charges since 2009 and gas distribution charges since 2019.
4.1 Electricity network charges
The NSW electricity networks (Ausgrid, Essential and Endeavour) introduce new Network Use of System (NUOS) charges in July every year. These NUOS charges are approved by the Australian Energy Regulator (AER) and comprise Transmission Use of System (TUOS) and Distribution Use of System (DUOS) as well as other costs such as jurisdictional charges and metering charges. The retailers can, and generally will, build changes to the NUOS (in relation to both shape and price) into their retail tariffs.
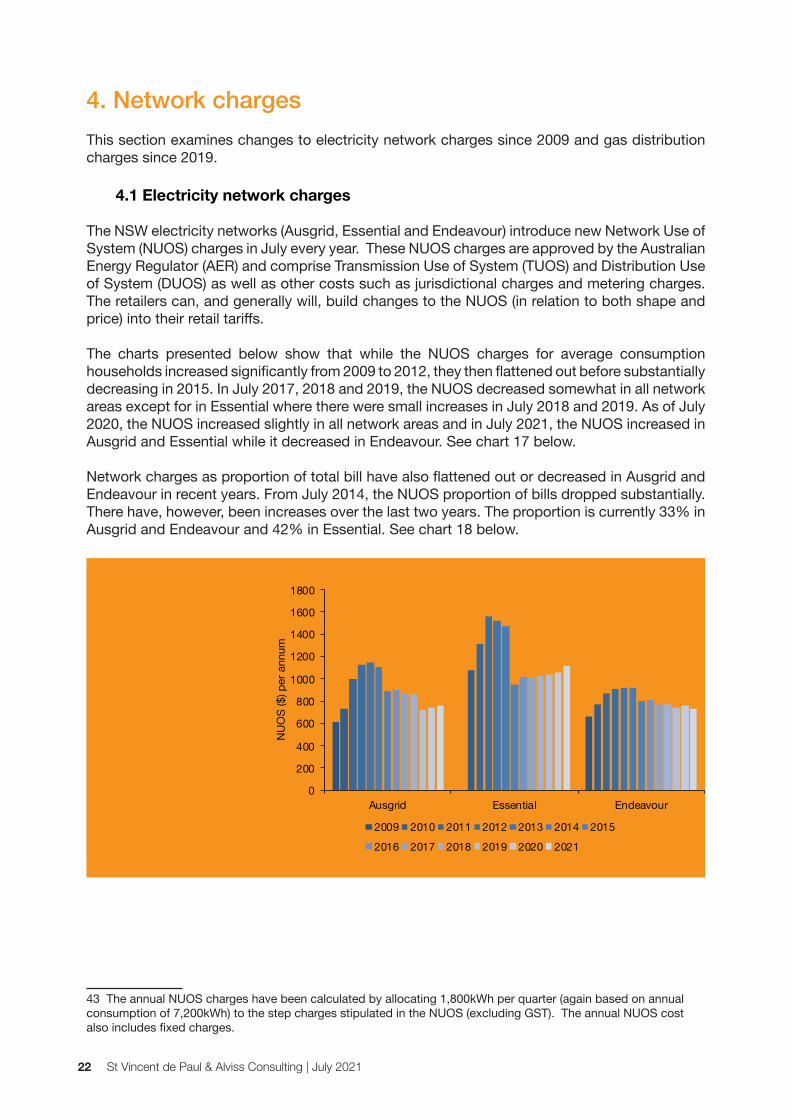
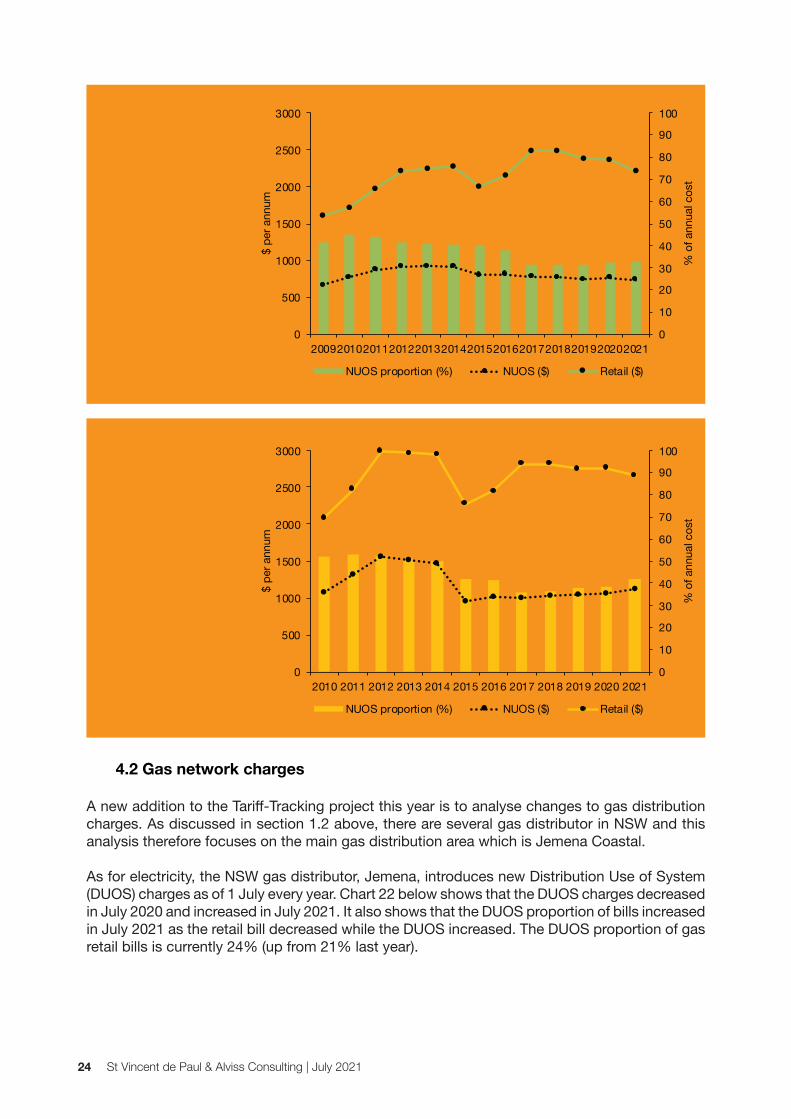
The charts presented below show that while the NUOS charges for average consumption households increased significantly from 2009 to 2012, they then flattened out before substantially decreasing in 2015. In July 2017, 2018 and 2019, the NUOS decreased somewhat in all network areas except for in Essential where there were small increases in July 2018 and 2019. As of July 2020, the NUOS increased slightly in all network areas and in July 2021, the NUOS increased in Ausgrid and Essential while it decreased in Endeavour. See chart 17 below.
Network charges as proportion of total bill have also flattened out or decreased in Ausgrid and Endeavour in recent years. From July 2014, the NUOS proportion of bills dropped substantially. There have, however, been increases over the last two years. The proportion is currently 33% in Ausgrid and Endeavour and 42% in Essential. See chart 18 below.
CHART 17 | NUOS charges as annual cost to residential consumers from 2009* to 2021, all networks (based on single rate, 7,200kWh per annum, GST exclusive)43
*Essential’s area includes NUOS charges from 2010 to 2016 only.
43 The annual NUOS charges have been calculated by allocating 1,800kWh per quarter (again based on annual consumption of 7,200kWh) to the step charges stipulated in the NUOS (excluding GST). The annual NUOS cost also includes fixed charges.
0
200
400
600
800
1000
1200
1400
1600
1800
Ausgrid Essential Endeavour
NU
OS
($) p
er a
nnum
Chart 17
2009 2010 2011 2012 2013 2014 2015
2016 2017 2018 2019 2020 2021

NSW Energy Prices July 2021: An update report on the NSW Tariff-Tracking Project 23
CHART 18 | NUOS charges as proportion of annual bill from 2009* to 2021, all networks. Based on regulated offer (2009-2013) and the incumbent retailers’ single rate standing offer (2014-2021), 7,200kWh per annum, incl. GST44
*Essential’s area includes NUOS charges from 2010 to 2016 only.
Charts 19-21 below show annual retail bills (solid line), NUOS charges as annual cost (dotted line) and as proportion of annual bill (columns) for each of the network areas. The methodology used for these calculations is the same as for charts 17-18 above.
CHART 19 | Ausgrid: Retail bill per annum, NUOS charges and NUOS as proportion of total bill Based on regulated offer (2009-2013) and Energy Australia’s single rate standing offer (2014 - 2021), 7,200kWh per annum, incl GST.
44 The NUOS proportion of total bill has been calculated using annual NUOS cost calculations (see footnote above) and the retailers’ regulated/standing offers as of July every year (from 2009 to 2021), presented as annual bills for households using 7,200kWh per annum (single rate, incl. GST) across the three distribution areas. Post 2013 the retail bills are based on the incumbent retailers’ (Origin and Energy Australia) standing offers.
0
10
20
30
40
50
60
Ausgrid Essential Endeavour
% o
f ann
ual b
ill
Chart 18
2009 2010 2011 2012 2013 2014 2015
2016 2017 2018 2019 2020 2021
0
10
20
30
40
50
60
70
80
90
100
0
500
1000
1500
2000
2500
3000
2009201020112012201320142015201620172018201920202021
% o
f ann
ual c
ost
$ pe
r ann
um
Chart 19
NUOS proportion (%) NUOS ($) Retail ($)
St Vincent de Paul & Alviss Consulting | July 202124
CHART 20 | Endeavour Energy: Retail bill per annum, NUOS charges and NUOS as proportion of total bill Based on regulated offer (2009-2013) and Origin’s single rate standing offer (2014 - 2021), 7,200kWh per annum, incl. GST
CHART 21 | Essential Energy: Retail bill per annum, NUOS charges and NUOS as proportion of total bill Based on regulated offer (2010-2013) and Origin’s single rate standing offer (2014 - 2021), 7,200kWh per annum, incl. GST
4.2 Gas network charges
A new addition to the Tariff-Tracking project this year is to analyse changes to gas distribution charges. As discussed in section 1.2 above, there are several gas distributor in NSW and this analysis therefore focuses on the main gas distribution area which is Jemena Coastal.
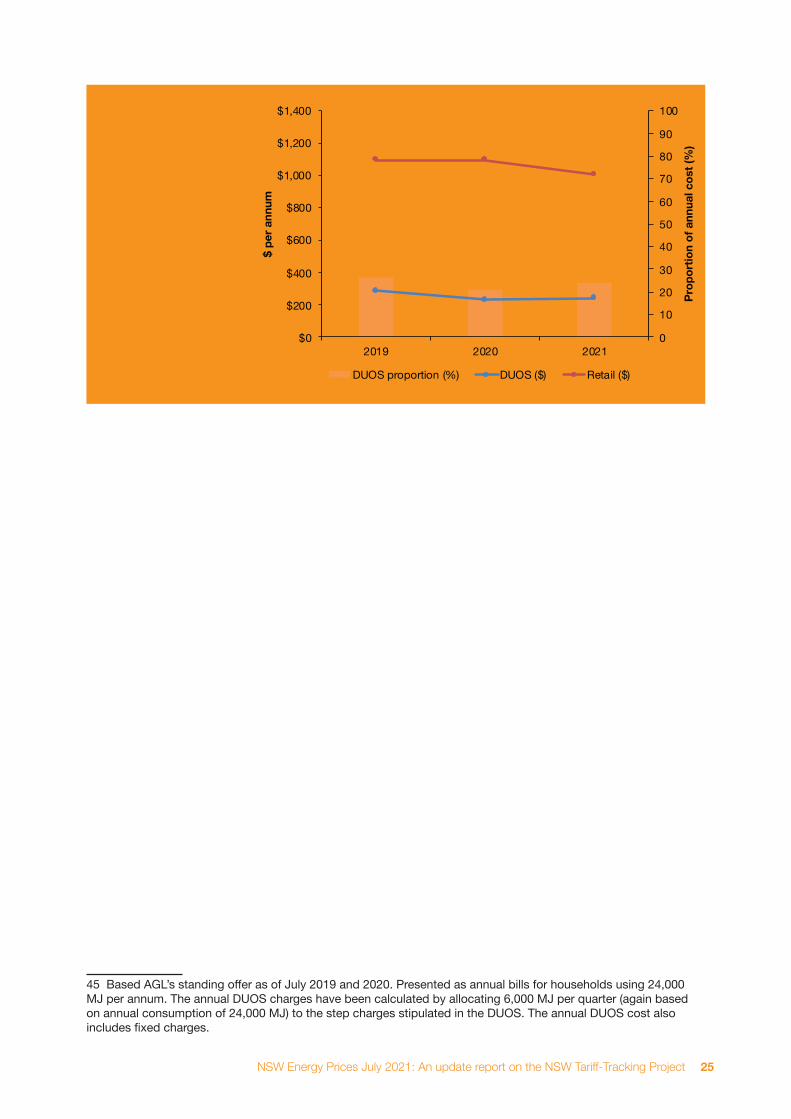
As for electricity, the NSW gas distributor, Jemena, introduces new Distribution Use of System (DUOS) charges as of 1 July every year. Chart 22 below shows that the DUOS charges decreased in July 2020 and increased in July 2021. It also shows that the DUOS proportion of bills increased in July 2021 as the retail bill decreased while the DUOS increased. The DUOS proportion of gas retail bills is currently 24% (up from 21% last year).
0
10
20
30
40
50
60
70
80
90
100
0
500
1000
1500
2000
2500
3000
2009201020112012201320142015201620172018201920202021
% o
f ann
ual c
ost
$ pe
r ann
um
Chart 20
NUOS proportion (%) NUOS ($) Retail ($)
0
10
20
30
40
50
60
70
80
90
100
0
500
1000
1500
2000
2500
3000
2010 2011 2012 2013 2014 2015 2016 2017 2018 2019 2020 2021%
of a
nnua
l cos
t
$ pe
r ann
um
Chart 21
NUOS proportion (%) NUOS ($) Retail ($)
NSW Energy Prices July 2021: An update report on the NSW Tariff-Tracking Project 25
CHART 22 | Jemena: Retail bill per annum (incl. GST), DUOS charges and DUOS as proportion of total bill (incl. GST) as of July 2019 and July 2021 (based on AGL’s standing offer, 24,000 MJ per annum)45
45 Based AGL’s standing offer as of July 2019 and 2020. Presented as annual bills for households using 24,000 MJ per annum. The annual DUOS charges have been calculated by allocating 6,000 MJ per quarter (again based on annual consumption of 24,000 MJ) to the step charges stipulated in the DUOS. The annual DUOS cost also includes fixed charges.
0
10
20
30
40
50
60
70
80
90
100
$0
$200
$400
$600
$800
$1,000
$1,200
$1,400
2019 2020 2021
Prop
ortio
n of
ann
ual c
ost (
%)
$ pe
r ann
um
Chart 22
DUOS proportion (%) DUOS ($) Retail ($)

St Vincent de Paul & Alviss Consulting | July 202126
5. Solar offersThere are over 652,000 small scale solar systems in NSW.46 For 2021-22, IPART stated that a fair and reasonable benchmark range for solar electricity fed back into the grid is between 4.6 and 5.5 cents per kWh.47 However, the retailers are not obliged to offer a FIT in this range. Customers looking for solar offers need to assess both the retailers’ FIT rates as well as the cost of electricity imported.
This section analyses and compares market offer bills for NSW customers with 1.5 kW and 3 kW systems installed. As retailers are not required to publish rates for solar products purchased and installed through them, this analysis only examines electricity offers available to customers independently of solar panels and installation. Methodology and assumptionsTo calculate the annual bills for the various solar market offers the following assumptions and methodology have been applied:
l An annual household consumption of 7,200kWh (including both produced and imported).
l Calculations have been produced for households with 1.5 kW and 3 kW systems only.
l For Sydney households, an annual generation capacity per kW installed of 1.614 MWh and an export rate of 49.9% for 3 kW systems and 18.9% for 1.5 kW systems.
l For non-metropolitan households, an annual generation capacity per kW installed of 1.801 MWh and an export rate of 55.1% for 3 kW systems and 27.3% for 1.5 kW systems.
l Only FIT rates available to new customers have been included. Retailer funded FIT rates have been applied as per offer (see table 8 below).
l A flat annual consumption has been assumed.
l The annual bills have been based on quarterly bill calculations and all step increases have been applied as quarterly thresholds (including when the retail offer refers to daily or monthly thresholds). Daily fixed charges have been multiplied by 91 to calculate the quarterly amount.
The average FIT rate (across all retailers) has been declining in recent years and the current average FIT rate is 8.5 c/kWh (down from 10.2 c/kWh in July 2020). Furthermore, some retailers (ReAmped Energy, Red Energy, Discover Energy and Enova) now offer a relatively high FIT rate for a set amount of kWh exported each day and a much lower FIT rate for any export above that. Origin Energy has taken a different approach. It does not have a threshold for daily export but ties the higher FIT rate to a 12 month “benefit period”. CovaU, on the other hand, offers the average FIT rate for a set amount of export and no FIT credits for export beyond that.
A declining FIT rate can have significant impact on households with a moderate export capacity. A Sydney household exporting 604 kWh per quarter, for example, would receive a quarterly FIT credit of approximately $360 on Red Energy’s declining FIT rate of 18 cents and 6 cents. The same household would have received a quarterly FIT credit of around $410 if they were on AGL’s Solar Saver offer with a single FIT rate of 17 cents.
46 Small scale is defined as systems up to 100 kW. Clean Energy Council, Clean Energy Australia Report 2021, 7447 See IPART, Solar feed-in tariff Benchmark, Final report, June 2021 https://www.ipart.nsw.gov.au/sites/default/files/cm9_documents/Final-Report-Solar-feed-in-tariffs-benchmarks-2021-22-June-2021.PDF

NSW Energy Prices July 2021: An update report on the NSW Tariff-Tracking Project 27
TABLE 8 | Retailers’ FIT rates (July 2021)Retailer* Offer 1st FIT rate
(c/kWh)Threshold 2nd FIT rate
(c/kWh)ReAmped Energy Solar 21 5 kWh/day 5
Red Energy Solar Saver 18 5 kWh/day 6
AGL Solar Savers 17
Discover Energy Solar Smart 16 3.29 kWh/day 10
Origin Energy Solar Boost 14 12 months 5
Enova Energy Solar Premium 12 5 kWh/day 6
Dodo Power & Gas Market offer 11.6
1st Energy Solar Bonus 11
Diamond Energy Renewable Saver POT 10.2
Energy Locals Online Member 10
Momentum Energy Solar Step Up 10
EnergyAustralia Total Plan Home 9.5
CovaU Freedom Plus Solar 8.5 27.5 kWh/day 0
Locality Planning Energy Principal Offer (solar) 8.5
Sumo Power Assure 8
Alinta Energy Home Deal 7.5
Mojo Power Single Minded 7.5
Powerdirect Rate Saver 7
Bright Spark Power 12 Month Contract 7
Glow Power Everyday Saver 7
Radian Energy Grid to Go 6
Simply Energy Energy Saver 5.5
Tango Energy Home Select 5.5
Powershop Carbon neutral 5
Nectr Friends Clean 5
Kogan Energy Market offer 4.35
Future X Power Flexi Saver 4
Powerclub Powerbank Home Solar 4
GloBird Energy UltraSave 3
Amber Electric Amber Plan 0
OVO Energy The One Plan 0 * Discover Energy has three FIT rates: 16 cents for the first 3.29 kWh exported each day, 10 cents for the next 3.29 kWh and 4 cents for any export beyond that.

St Vincent de Paul & Alviss Consulting | July 202128
Chart 23 below compares annual retail bills for solar customers in Sydney (Ausgrid) with 3 kW and 1.5 kW installed.48 It shows that for this consumption level, the average market offer bill for households in this area with a 3 kW system installed is $1,200 and that is $690 less than the average market offer bill for non-solar customers (see section 2.1 above). Households with a 1.5 kW system installed will have an average annual bill of $1,485.
Chart 23 also shows that Diamond, Momentum, Origin, 1st Energy, Amber Electric, Enova, GloBird, Powerclub and ReAmped Energy’s offers produce annual bills above the average for both 3 kW and 1.5 kW systems. This is despite ReAmped Energy offering the highest first FIT rate (21 cents) of all the solar offers. Sydney (Ausgrid) solar customers with 1.5 kW systems (and this consumption level) would be approximately $485 per annum better off on Energy Locals’ offer compared to ReAmped Energy’s offer, despite Energy Locals’ lower initial FIT rate. This highlights the importance of solar customers not choosing retail offers based on FIT rates alone and recognise the impact a declining FIT rate can have on bills. Customers with a 3kW system installed may save $630 per annum if they switched from Amber Electric to Energy Locals’ offer.
CHART 23 | Annual bills including discounts and FIT credits for Sydney/Ausgrid customers with 3 kW and 1.5 kW solar systems. Electricity offers post July 2021 as annual bills, Single rate, 7,200kWh (GST inc).49
Chart 24 below shows annual bills for Sydney solar customers in the Endeavour network. It shows that for this consumption level, the average market offer bill for households in this area with a 3 kW system installed is $1,185 and that is $685 less than the average market offer bill for non-solar customers (see section 2.1 above). Households with a 1.5 kW system installed will have an average annual bill of $1,465.
48 We note that these systems are small compared to the size of the typical systems that are currently being installed. However, as a key objective of the Tariff-Tracker is to compare developments over time, we continue to base the analysis on 3 kW and 1.5 kW systems.49 Calculations include discounts off usage or bill as well as pay on time discounts off usage or bill.
400600800
1,0001,2001,4001,6001,8002,000
Ener
gy L
ocals
AGL
Alint
a En
ergy
Cova
UDi
amon
d En
ergy
Dodo
Pow
er &
Gas
Ener
gyAu
stra
liaM
ojo
Pow
erM
omen
tum
Ene
rgy
Orig
in E
nerg
yPo
wer
dire
ctPo
wer
shop
Red
Ener
gySi
mpl
y En
ergy
1st E
nerg
yAm
ber E
lectri
cBr
ight
Spa
rk P
ower
Disc
over
Ene
rgy
Enov
a En
ergy
Futu
re X
Pow
erG
loBi
rd E
nerg
yKo
gan
Ener
gyPo
wer
club
ReAm
ped
Ener
gySu
mo
Pow
erTa
ngo
Ener
gyNe
ctr
OVO
Ene
rgy
Glo
w Po
wer
Loca
lity P
lanni
ng E
nerg
yRa
dian
Ene
rgy
Chart 23
3 kW 1.5 kW 3 kW avg 1.5 kW avg

NSW Energy Prices July 2021: An update report on the NSW Tariff-Tracking Project 29
CHART 24 | Annual bills including discounts and FIT credits for Sydney/Endeavour customers with 3 kW and 1.5 kW solar systems. Electricity offers post July 2021 as annual bills, Single rate, 7,200kWh (GST inc).50
Homes outside Sydney’s metropolitan area will typically have less overshadowing and therefore a higher generation capacity and export rate. Chart 25 compares annual retail bills for non-metropolitan solar customers with 3 kW systems in the three network areas. It shows that the average annual bill for non-metropolitan solar customers with this consumption level is $1,160 in Ausgrid, $1,140 in Endeavour and $1,470 in Essential. Compared to non-solar households, the average bill is $730 less in Ausgrid and Endeavour, and $795 less in Essential (see section 2.1 above for non-solar customers).
CHART 25 | Annual bills including discounts and FIT credits for non-metropolitan customers in Ausgrid, Endeavour and Essential with 3 kW solar systems. Electricity offers post July 2021 as annual bills, Single rate, 7,200kWh (GST inc).51
50 Ibid.51 Ibid.
400600800
1,0001,2001,4001,6001,8002,000
Ener
gy L
ocals
AGL
Alint
a En
ergy
Cova
UDi
amon
d En
ergy
Dodo
Pow
er &
Gas
Ener
gyAu
stra
liaM
ojo
Pow
erM
omen
tum
Ene
rgy
Orig
in E
nerg
yPo
wer
dire
ctPo
wer
shop
Red
Ener
gySi
mpl
y En
ergy
1st E
nerg
yAm
ber E
lectri
cBr
ight
Spa
rk P
ower
Disc
over
Ene
rgy
Enov
a En
ergy
Futu
re X
Pow
erG
loBi
rd E
nerg
yKo
gan
Ener
gyPo
wer
club
ReAm
ped
Ener
gySu
mo
Pow
erTa
ngo
Ener
gyNe
ctr
OVO
Ene
rgy
Glo
w Po
wer
Loca
lity P
lanni
ng…
Radi
an E
nerg
y
Chart 24
3 kW 1.5 kW 3 kW avg 1.5 kW avg
400600800
1,0001,2001,4001,6001,8002,000
Ener
gy L
ocals
AGL
Alint
a En
ergy
Cova
UDi
amon
d En
ergy
Dodo
Pow
er &
Gas
Ener
gyAu
stra
liaM
ojo
Pow
erM
omen
tum
Ene
rgy
Orig
in E
nerg
yPo
wer
dire
ctPo
wer
shop
Red
Ener
gySi
mpl
y En
ergy
1st E
nerg
yAm
ber E
lectri
cBr
ight
Spa
rk P
ower
Disc
over
Ene
rgy
Enov
a En
ergy
Futu
re X
Pow
erG
loBi
rd E
nerg
yKo
gan
Ener
gyPo
wer
club
ReAm
ped
Ener
gySu
mo
Pow
erTa
ngo
Ener
gyNe
ctr
OVO
Ene
rgy
Glo
w Po
wer
Loca
lity P
lanni
ng…
Radi
an E
nerg
y
Chart 25
Ausgrid Endeavour Essential
Ausgrid (avg) Endeavour (avg) Essential (avg)
St Vincent de Paul & Alviss Consulting | July 202130
Energy Locals $958
Discover Energy $988
Alinta Energy $1,027
Dodo Power & Gas $1,088
Locality Planning $1,098
Tango Energy $1,103
Sumo Power $1,108
Powerdirect $1,119
EnergyAustralia $1,119
Kogan Energy $1,128
CovaU $1,143
AGL $1,171
Simply Energy $1,179
Glow Power $1,181
Powershop $1,183
Bright Spark Power $1,188
Red Energy $1,206
Nectr $1,213
Enova Energy $1,223
Mojo Power $1,228
Radian Energy $1,235
Origin Energy $1,260
Future X Power $1,263
OVO Energy $1,265
ReAmped Energy $1,267
1st Energy $1,310
Powerclub $1,324
GloBird Energy $1,340
Momentum Energy $1,358
Diamond Energy $1,378
Amber Electric $1,589
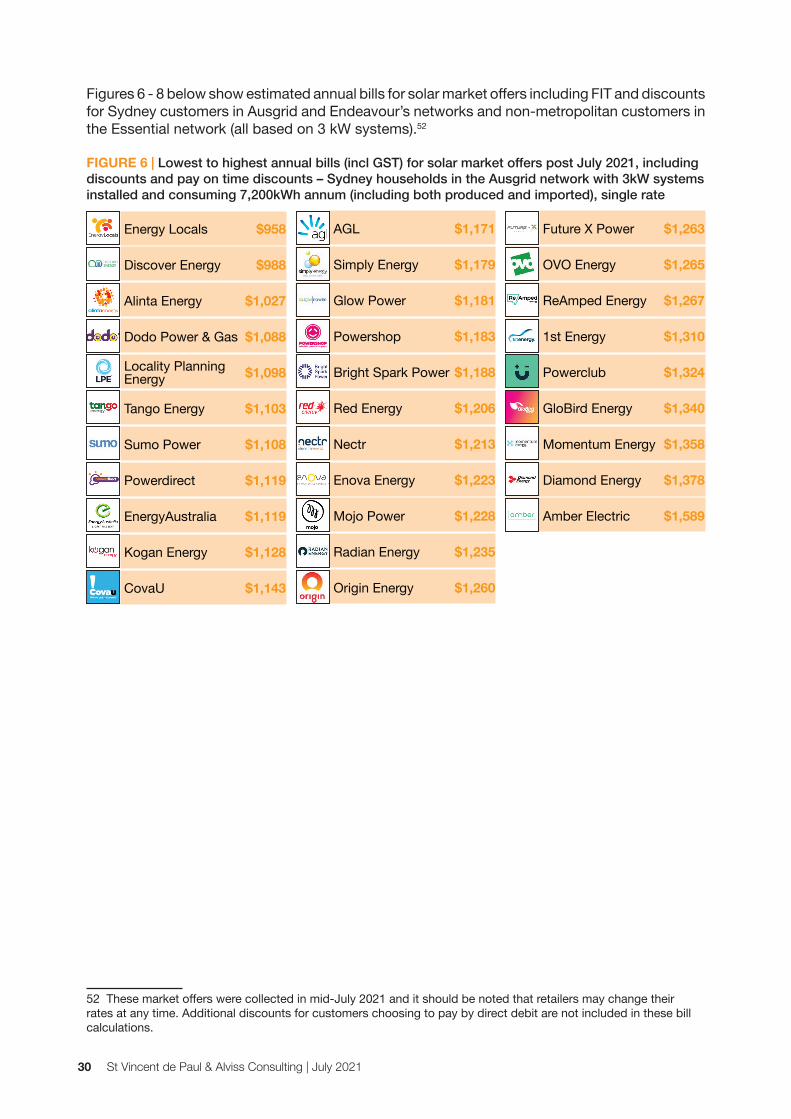
Figures 6 - 8 below show estimated annual bills for solar market offers including FIT and discounts for Sydney customers in Ausgrid and Endeavour’s networks and non-metropolitan customers in the Essential network (all based on 3 kW systems).52
FIGURE 6 | Lowest to highest annual bills (incl GST) for solar market offers post July 2021, including discounts and pay on time discounts – Sydney households in the Ausgrid network with 3kW systems installed and consuming 7,200kWh annum (including both produced and imported), single rate
52 These market offers were collected in mid-July 2021 and it should be noted that retailers may change their rates at any time. Additional discounts for customers choosing to pay by direct debit are not included in these bill calculations.
Energy

NSW Energy Prices July 2021: An update report on the NSW Tariff-Tracking Project 31
FIGURE 7 | Lowest to highest annual bills (incl GST) for solar market offers post July 2021, including discounts and pay on time discounts – Sydney households in the Endeavour network with 3kW systems installed and consuming 7,200kWh annum (including both produced and imported), single rate
FIGURE 8 | Lowest to highest annual bills (incl GST) for solar market offers post July 2021, including discounts and pay on time discounts – households in the Essential network with 3kW systems installed and consuming 7,200kWh annum (including both produced and imported), single rate
Discover Energy $946
Energy Locals $954
Locality Planning $1,055
Alinta Energy $1,069
Powerdirect $1,071
EnergyAustralia $1,071
Dodo Power & Gas $1,086
Kogan Energy $1,114
AGL $1,125
Bright Spark Power $1,129
Simply Energy $1,130
Sumo Power $1,134
Tango Energy $1,144
Glow Power $1,160
Red Energy $1,161
Mojo Power $1,177
Powershop $1,180
Radian Energy $1,198
Origin Energy $1,204
Enova Energy $1,220
Nectr $1,220
ReAmped Energy $1,225
Future X Power $1,243
OVO Energy $1,271
1st Energy $1,276
Powerclub $1,289
CovaU $1,297
Momentum Energy $1,311
Diamond Energy $1,319
GloBird Energy $1,342
Amber Electric $1,580
Energy Locals $896
Discover Energy $963
Alinta Energy $981
Dodo Power & Gas $1,016
Locality Planning $1,046
Sumo Power $1,059
EnergyAustralia $1,060
AGL $1,066
Tango Energy $1,069
Powerdirect $1,075
CovaU $1,090
Kogan Energy $1,101
Glow Power $1,138
Bright Spark Power $1,145
Simply Energy $1,145
Powershop $1,152
Red Energy $1,170
Origin Energy $1,174
Mojo Power $1,181
Nectr $1,183
Enova Energy $1,186
Radian Energy $1,198
ReAmped Energy $1,236
Future X Power $1,239
1st Energy $1,243
OVO Energy $1,265
Momentum Energy $1,296
Powerclub $1,299
Diamond Energy $1,315
GloBird Energy $1,322
Amber Electric $1,589
Energy
Energy

St Vincent de Paul & Alviss Consulting | July 202132
6. Total cost of energy by area As approximately 40% of NSW households are connected to both electricity and gas, it is important to analyse whether there are areas that have experienced high increases/decreases in both electricity and gas prices, and conversely, whether there are areas where the increases/decreases in electricity and gas prices are at the lower end.53 Such analysis allows for a more detailed understanding of the total energy costs faced by households across NSW. This year, dual fuel households in greater Sydney have received the greatest reductions to energy costs as gas prices have decreased in the Jemena network combined with a (state-wide) decrease in electricity prices. For many locations in rural and regional NSW, however, an increase in gas prices off-sets much of the savings obtained from reduced electricity costs.
5.1 Inner Sydney, Northern Sydney, Swansea, Newcastle, Maitland, Cessnock Singleton and Upper Hunter
In this area, Energy Australia’s annual electricity standing offer bill is $140 less in July 2021 compared to July 2020 (based on households consuming 7,200kWh/annum). Lower gas prices in the Jemena/AGL gas zone also means that annual bills for customers on AGL’s gas standing offer have reduced by around $90 per annum (based on households consuming 24,000MJ/annum).
l Dual fuel households with an average consumption of electricity and gas in inner and Eastern Sydney, Sydney’s North, Swansea and Newcastle will typically experience a decrease in annual energy costs of $230 from July 2021.54
l All-electric households in Sydney, Newcastle, Maitland, Singleton, Muswellbrook and the Upper Hunter will typically experience a decrease in annual electricity costs of $130 from July 2021.55
53 According to IPART, approximately 40% of all NSW households use gas and in the Sydney metropolitan area approximately 50% of households use gas. IPART, Review of regulated retail prices and charges for gas, Final report, June 2014, p 52 54 These are households in Ausgrid’s electricity distribution network and Jemena/AGL’s gas zone. 55 These are households on a two-rate (controlled load) tariff in Ausgrid’s electricity distribution network using 8,000 kWh per annum (thereof 30% controlled load).
Source: www.ausgrid.com.au

NSW Energy Prices July 2021: An update report on the NSW Tariff-Tracking Project 33
Source: www.endeavourenergy.com.au
5.2 Western Sydney, Wollongong, Blue Mountains, Lithgow, Kandos, Moss Vale, Nowra, Ulladulla
In this area, Origin’s annual electricity standing offer bill is $155 less in July 2021 compared to July 2020 (based on households consuming 7,200kWh/annum). Lower gas prices in the Jemena/AGL gas zone also means that annual bills for customers on AGL’s gas standing offer have reduced by around $90 per annum (based on households consuming 24,000MJ/annum).
l Dual fuel households with an average consumption of electricity and gas in Western Sydney, Wollongong, Blue Mountains and Lithgow will typically experience a decrease in annual energy costs of $245 from July 2021.56
l As gas prices in the Nowra/Shoalhaven have increased slightly (approximately $15 per annum), dual fuel households in this area will typically experience a decrease in annual energy costs of $140 from July 2021.57
l All-electric households in Western Sydney, Wollongong, Blue Mountains, Lithgow, Kandos, Moss Vale, Nowra and Ulladulla will typically experience a decrease in annual electricity costs of $70 from July 2021.58
56 These are households in Endeavour Energy’s electricity distribution network and Jemena/AGL’s gas zone. 57 These are households in Endeavour Energy’s electricity distribution network and ActewAGL’s Shoalhaven gas zone. 58 These are households on a two-rate (controlled load) tariff in Endeavour Energy ’s electricity distribution network using 8,000 kWh per annum (thereof 30% controlled load).

St Vincent de Paul & Alviss Consulting | July 202134
5.3 Rural and Regional NSW
In rural and regional NSW, the average annual electricity standing offer bill is $100 less in July 2021 compared to July 2020 (based on households consuming 7,200kWh/annum). For all-electric households (8,000kWh, 30% controlled off peak) the average electricity standing offer has decreased by $70.
l Dual fuel households with an average consumption of electricity and gas in Bathurst, Orange, Newcastle and Wollongong will typically experience a $190 decrease to their annual energy costs from July 2021.59
l Dual fuel households in Shoalhaven will typically experience a decrease in annual energy costs of $140 from July 2021.60
l Dual fuel households in Queanbeyan and Bungendore will typically experience a decrease in annual energy costs of $115 from July 2021.61
l Dual fuel households in Goulburn, Boorowa, Yass and Young will typically experience a decrease in annual energy costs of $100 from July 2021.62
l For dual fuel households in Wagga Wagga, Uranquinty, Tamworth and Murray Valley towns, the annual energy costs will typically remain unchanged from July 2021.63
l Dual fuel households in Tumut, Gundagai, Albury, Moama, Jindera, Cooma and Bombala will typically experience an increase in annual energy costs of $5 from July 2021.64
l Dual fuel households in Temora, Holbrook, Henty, Culcairn and Walla will typically experience an increase in annual energy costs of $20 from July 2021.65
59 These are households in Essential Energy’s electricity distribution network and the Jemena/AGL gas zones. 60 These are households in Endeavour Energy’s electricity distribution network and ActewAGL’s Shoalhaven gas zone. 61 These are households in Endeavour Energy’s electricity distribution network and ActewAGL’s Queanbeyan gas zone. 62 These are households in Endeavour Energy’s electricity distribution network and ActewAGL’s Goulburn gas zone. 63 These are households in Essential Energy’s electricity distribution network and Origin Energy’s Wagga Wagga, Tamworth and Murray gas zones. 64 These are households in Essential Energy’s electricity distribution network and Origin Energy’s Tumut, Albury and Cooma gas zones. 65 These are households in Essential Energy’s electricity distribution network and Origin Energy’s Temora gas zone.
Source: Country Energy, Annual Report 2009-10
10 11!"#$%&'(
)%&)(&*+,*-%*.&%/0%&%/*&,1#-*((&2)33&"*&-#4,3*%*.&"5&6*-*4"*1&7898:
;/*&<0(&=*%2#1>&"$()=*((?&2)%/&0&"##>&@03$*&#A&0((*%(&#A&B987&4)33)#=?&)(&0&(#$=.&0((*%&0=.&)(&*01=)=<&0&-#44*1-)03&1*%$1=?&/#2*@*1&)%&1*,1*(*=%(&#=35&&%2#&,*1&-*=%&#A&C#$=%15&D=*1<5E(&%#%03&0((*%&"0(*&F&0=.&C#$=%15&D=*1<5&/0(&=#&,30=(&%#&<1#2&)%(&<0(&=*%2#1>&"$()=*((&)=&-#4,*%)%)#=&2)%/&%/*&,1)@0%*&(*-%#1:&
;/*&(03*&2)33&033#2&C#$=%15&D=*1<5&%#&A#-$(&#=&)%(&-#1*&"$()=*((&#A&.*3)@*1)=<&*((*=%)03&*3*-%1)-)%5&(*1@)-*(&%#&A04)3)*(&0=.&"$()=*((*(&0-1#((&1*<)#=03&GHI&0=.&20%*1&(*1@)-*(&)=&%/*&J01&I*(%:
C#$=%15&D=*1<5&/0(&<$010=%**.&%/*&K#"(&#A&78&*4,3#5**(&"0(*.&)=&L$*0="*50=&0=.&I0<<0&I0<<0&2#1>)=<&)=&%/*&<0(&=*%2#1>&01*0&#A&#$1&"$()=*((?&2/#&2)33&"*&<)@*=&%/*&#,%)#=&#A&%0>)=<&$,&#AA*1(&%#&2#1>&2)%/&%/*&=*2=*1(&(%05)=<&2)%/&C#$=%15&D=*1<5&)=&*3*-%1)-)%5&1*30%*.&1#3*(&)=&%/*)1&-$11*=%&3#-0%)#=(&F&&I0<<0&I0<<0&0=.&L$*0="*50=:
Water and sewerage networkC#$=%15&I0%*1&)(&0=&#,*10%)=<&.)@)()#=&&#A&C#$=%15&D=*1<5&%/0%&,1#@).*(&20%*1&($,,35&(*1@)-*(&%#&01#$=.&7M?888&,*#,3*&)=&N1#>*=&O)33?&P*=)=.**?&H$=(*%&H%1),&0=.&H)3@*1%#=&0=.&(*2*10<*&(*1@)-*(&%#&N1#>*=&O)33:
C#$=%15&I0%*1&20(&*(%0"3)(/*.&)=&&788Q&2)%/&0&,1)4015&0)4&%#&.*3)@*1&&(0A*?&1*3)0"3*?&R$03)%5&.1)=>)=<&20%*1&&%/0%&4**%(&%/*&Australian Drinking Water Guidelines&S!6ITU&0=.&#$1&(%1)=<*=%&Drinking Water Policy.
;/*&01*0&(*1@)-*.&"5&C#$=%15&I0%*1&)(&%/*&4#(%&01).&)=&%/*&(%0%*?&2)%/&*+%1*4*&-3)40%)-&@01)0%)#=(&0=.&4#1*&A1*R$*=%&.1#$</%&%/0=&-#0(%03&01*0(:&
C#$=%15&I0%*1&-#4,3*%*.&-#=(%1$-%)#=&#A&%/*&=*2&BQ9&4)33)#=&P)-0&H%1**%&I0%*1&
-*4*=%)=<&#$1&-#44)%4*=%&%#&)4,1#@*&20%*1&R$03)%5&0=.&(*-$1*&(0A*&0=.&1*3)0"3*&20%*1&($,,3)*(&=#2&0=.&)=%#&%/*&A$%$1*:
NSW energy industry reformV=&98&H*,%*4"*1&788W&%/*&GHI&T#@*1=4*=%&1*3*0(*.&)%(&D=*1<5&X*A#14&;10=(0-%)#=&H%10%*<5?&2/)-/&0.#,%*.&0&Y.$03&%10->E&,1#-*((&)=@#3@)=<&0&%10.*&(03*&0=.&0&,#%*=%)03&Z=)%)03&[$"3)-&VAA*1)=<&#A&(*3*-%*.&0((*%(:&;/*&T#@*1=4*=%E(&1*A#14(&)=-3$.*&40)=%0)=)=<&,$"3)-=*1(/),&#A&*+)(%)=<&,#2*1&(%0%)#=(&0=.&*3*-%1)-)%5&%10=(4)(()#=&0=.&.)(%1)"$%)#=&
1*%0)3)=<&#,*10%)#=(&#A&D=*1<5!$(%103)0?&Z=%*<103&D=*1<5&0=.&C#$=%15&D=*1<5&%#&%/*&
&#A&,#%*=%)03&.*@*3#,4*=%&()%*(&A#1&=*2&
,1)@0%*&(*-%#1&%/*&1)</%&%#&(*33&*3*-%1)-)%5&,1#.$-*.&"5&%/*&H%0%*\#2=*.&<*=*10%#1(?&=04*35&6*3%0&D3*-%1)-)%5?&P0-R$01)*&T*=*10%)#=&0=.&D101)=<&D=*1<5&S%/*&T*=%10.*1&4#.*3U:
Far North Coast Region
Far West Region
North Western Region
Southern Region
CentralWestern Region
Northern Region
Mid North Coast Region
South EasternRegion
Country Energy’s regional operating area
!"#$%&'(
Our strategyC#$=%15&D=*1<5E(&(%10%*<)-&04")%)#=&&)(&%#&"*&!$(%103)0E(&3*0.)=<&*((*=%)03&(*1@)-*(&,1#@).*1&0=.&0&@)%03&,01%&#A&#$1&-#44$=)%)*(:&
%#&.*3)@*1&*((*=%)03&(*1@)-*(?&4**%&%/*&=**.(&#A&#$1&-$(%#4*1(?&.*@*3#,&)==#@0%)@*&(#3$%)#=(&0=.&40=0<*&%/*&*=@)1#=4*=%03&)4,0-%(&#A&#$1&"$()=*((:&
C#$=%15&D=*1<5E(&H%10%*<5&H%0%*4*=%&#$%3)=*(&#$1&>*5&,1)#1)%5&01*0(&F&H0A*%5?&H*1@)-*?&]03$*&0=.&H$(%0)=0")3)%5&F&0=.&#"K*-%)@*(&0=.&%01<*%(&=*-*((015&%#&0-/)*@*&#$1&04")%)#=:&;/*(*&,1)#1)%)*(&03)<=&2)%/&C#$=%15&D=*1<5E(&#"K*-%)@*(&0(&#$%3)=*.&)=&%/*&State Owned Corporations Act 1989&0=.&%/*&Energy Services Corporations Act 1995:&
#"K*-%)@*(&0=.&%01<*%(&0=.&).*=%)A5&&
-#=()(%*=%&,$1,#(*&0-1#((&%/*&"$()=*((&F&*=($1)=<&%/0%&%/*&0-%)@)%)*(&#A&C#$=%15&D=*1<5E(&*4,3#5**(&01*&03)<=*.&2)%/&%/*&(%10%*<)*(&0=.&#"K*-%)@*(&(*%&"5&%/*&N#01.&0=.&D+*-$%)@*:
;#&%10->&#$1&,*1A#140=-*&)=&.*3)@*1)=<&&#=&#$1&>*5&,1)#1)%5&01*0(?&#$1&C#1,#10%*&H%10%*<5&H%0%*4*=%&0=.&,*1A#140=-*&)=.)-0%#1(&01*&,$%&)=%#&0-%)#=&%/1#$</&&0&($)%*&#A&4*0($10"3*?&#,*10%)#=03&#"K*-%)@*(&-#=%0)=*.&)=&#$1&-#1,#10%*&&0=.&.)@)()#=03&.0(/"#01.:
C#$=%15&D=*1<5E(&N#01.&0=.&D+*-$%)@*&4**%&1*<$30135&%#&4#=)%#1&,*1A#140=-*&0-1#((&#$1&>*5&,1)#1)%5&01*0(&0=.&%/*&40=0<*4*=%&#A&C#$=%15&D=*1<5E(&>*5&"$()=*((&1)(>(:&
V$1&,*1A#140=-*&)(&1*,#1%*.&%#&#$1&*4,3#5**(&#=&0&4#=%/35&"0()(&%/1#$</&#$1&)=%*1=03&-#44$=)-0%)#=(&%##3?&;*04"1)*A:
Nature and scope of operationsC#$=%15&D=*1<5&)(&#=*&#A&!$(%103)0E(&301<*(%&$%)3)%5&"$()=*((*(=*.&"5&&%/*&GHI&T#@*1=4*=%?&-/01<*.&2)%/&($,,35)=<&(0A*&0=.&1*3)0"3*&*3*-%1)-)%5?&20%*1&0=.&<0(&(*1@)-*(&%#&#$1&-$(%#4*1(&0-1#((&1*<)#=03&GHI:
I)%/&0=&0==$03&1*@*=$*&*+-**.)=<&&B7&")33)#=&0=.&034#(%&Q?^88&*4,3#5**(&)=&
&%2#&"$()=*((&-*=%1*(&)=&H5.=*5&0=.&G*2-0(%3*?&%/*&"$()=*((&(*1@*(&&4#1*&%/0=&M88?888&-$(%#4*1(:
-/033*=<*(&#@*1&%/*&-#4)=<&5*01(&F&
205(&%#&,1#4#%*&)=-1*0(*.&(0A*%5&0=.&*=@)1#=4*=%03&,*1A#140=-*:&
C#$=%15&D=*1<5&1*(%1$-%$1*.&)%(&#,*10%)#=(&)=&788W&%#&/*3,&4**%&%/*(*&-/033*=<*(&0=.&(%1*=<%/*=&#$1&,#()%)#=&&%#&4**%&A$%$1*&"$()=*((&=**.(:
J#$1&#,*10%)=<&.)@)()#=(&/0@*&,1)4*&1*(,#=()")3)%5&A#1&.*3)@*1)=<&#$1&&G*%2#1>&[30=_
Z=A10(%1$-%$1*&H%10%*<5&F&>*5&A#-$(&&#=&=*%2#1>&(%10%*<5&0=.&#$%-#4*(
D=<)=**1)=<&H*1@)-*(&F&>*5&A#-$(&#=&.*3)@*1)=<&40K#1&,1#K*-%(?&(%0=.01.(&0=.&(5(%*4(
Z=A10(%1$-%$1*&V,*10%)#=(&F&>*5&A#-$(&#=&40)=%0)=)=<&0=.&$,<10.)=<&.)(%1)"$%)#=&=*%2#1>
C#1,#10%*&0=.&C#44*1-)03&H*1@)-*( F&%01<*%*.&(0A*%5&0=.&-$(%#4*1&(*1@)-*&#$%-#4*(&2)%/&>*5&A#-$(&#=&1*(#$1-)=<&%/*&.*3)@*15&#A&-$11*=%&0=.&A$%$1*&"$()=*((&=**.(:
;/*(*&A#$1&#,*10%)=<&.)@)()#=(&01*&($,,#1%*.&"5_
C$(%#4*1&0=.&C#1,#10%*&!AA0)1(&F,1#4#%*(&0=.&,1#%*-%(&C#$=%15&D=*1<5E(&1*,$%0%)#=&%/1#$</&-#1,#10%*&(%10%*<5?&-$(%#4*1&0=.&<#@*1=4*=%&1*30%)#=(?&-#44$=)-0%)#=(&0=.&401>*%)=<&
J)=0=-*&0=.&X)(>&F&)(&1*(,#=()"3*&&
<#@*1=0=-*&A$=-%)#=(&)=-3$.)=<&&&
1)(>&0=.&3*<03?&-#4,0=5&(*-1*%01)0%&0=.&(*-$1)%5:
;/*&X*%0)3&.)@)()#=&F&-/01<*.&2)%/&&%/*&.*@*3#,4*=%&#A&C#$=%15&D=*1<5E(&1*%0)3&,1#.$-%(&0=.&(*1@)-*(&1*40)=(&$=-/0=<*.&%#&,1*,01*&A#1&%/*&GHI&T#@*1=4*=%E(&D=*1<5&X*A#14&;10=(0-%)#=&H%10%*<5:
C#$=%15&D=*1<5E(&.*-*=%103)(*.&40=0<*4*=%&(%1$-%$1*&)(&-*=%103&%#&#$1&($--*((&)=&4**%)=<&1*3)0")3)%5&(%0=.01.(&(*%&"5&%/*&GHI&T#@*1=4*=%&0=.&%/*&=**.(&#A&1*<)#=03&-$(%#4*1(:
V$1&*)</%&1*<)#=03&40=0<*4*=%&%*04(&3#-0%*.&0-1#((&-#$=%15&GHI&40>*&.*-)()#=(&0%&0&3#-03&3*@*3&0=.&01*&0"3*&%#&1*(,#=.&R$)->35&0=.&*AA*-%)@*35&%#&$=)R$*?&@01)*.&3#-03&-#=.)%)#=(&0=.&-$(%#4*1&=**.(:
C#$=%15&D=*1<5E(&1*<)#=03&#,*10%)=<&01*0&)(&.*,)-%*.&#,,#()%*:
Electricity networkC#$=%15&D=*1<5&#,*10%*(&!$(%103)0E(&301<*(%&*3*-%1)-)%5&=*%2#1>&*+%*=.)=<&0-1#((&034#(%&W^&,*1&-*=%&#A&GHI?&,01%(&#A&(#$%/*1=&L$**=(30=.&&0=.&=#1%/*1=&])-%#1)0&2)%/&01#$=.&&788?888&>)3#4*%1*(&#A&,#2*13)=*(?&&9:Q&4)33)#=&,#3*(&0=.&9`8?888&.)(%1)"$%)#=&($"(%0%)#=(:
V$1&.)(%1)"$%)#=&01*0&)(&<*#<10,/)-0335&.)@*1(*&0=.&)=-3$.*(&%/*&(*4)\01).&,30)=(&#A&%/*&J01&I*(%?&%/*&(=#25&,*0>(&#A&%/*&!$(%103)0=&!3,(&0=.&40=5&-#0(%03&0=.&($"\%1#,)-03&1*<)#=(:
C#$=%15&D=*1<5E(&*3*-%1)-)%5&=*%2#1>&-0%*1(&A#1&@015)=<&,#,$30%)#=&()a*(?&A1#4&(4033&1$103&01*0(&%#&/)</35&,#,$30%*.&$1"0=&-*=%1*(&0=.&)%&03(#&,1#@).*(&A#1&301<*&Y(,#%E&$(*1(&0=.&(#$1-*(&#A&*=*1<5&($-/&0(&4)=*(&0=.&2)=.&A014(:
Gas networkC#$=%15&D=*1<5E(&<0(&=*%2#1>(&(,0=&01#$=.&9?9^8&>)3#4*%1*(&#A&.)(%1)"$%)#=&40)=(&0=.&b^&>)3#4*%1*(&#A&%10=(4)(()#=&,),*3)=*(&($,,35)=<&<0(&(*1@)-*(&%#&01#$=.&7b?888&-$(%#4*1(&0-1#((&&,01%(&#A&(#$%/*1=&GHI:&
Z=&J*"1$015&7898&C#$=%15&D=*1<5&0==#$=-*.&)%(&)=%*=%)#=&%#&#AA*1&)%(&&<0(&=*%2#1>&#,*10%)#=(&)=&(#$%/*1=&GHI&A#1&(03*&%#&%/*&,1)@0%*&(*-%#1:&
!%&%/)(&(%0<*?&%/*&%)4)=<&0=.&(%1$-%$1*&#A&
About Us