nowcasting severe convective activity over...
TRANSCRIPT
Nowcasting severe convective activity over southeast India usingground-based microwave radiometer observations
A. Madhulatha,1 M. Rajeevan,2 M. Venkat Ratnam,1 Jyoti Bhate,1 and C. V. Naidu3
Received 30 May 2012; revised 30 October 2012; accepted 1 November 2012.
[1] In the present study, the feasibility of nowcasting convective activity is examined byusing thermodynamic indices derived from the ground-based microwave radiometer(MWR) observations located at a tropical station, Gadanki (13.5�N, 79.2�E). There is agood comparison between thermodynamic parameters derived from MWR and colocatedGPS radiosonde observations, indicating that MWR observations can be used to developtechniques for nowcasting severe convective activity. Using MWR observations, anowcasting technique was developed with the data of 26 thunderstorm cases observed atGadanki. The analysis showed that there are sharp changes in some thermodynamicindices, such as the K index, the humidity index, precipitable water content, the stabilityindex, and equivalent potential temperature lapse rates, about 2–4 h before the occurrenceof thunderstorm. A superepoch analysis was made to examine the composite temporalvariations of the thermodynamic indices associated with the occurrence of thunderstorms.The superepoch analysis revealed that 2–4 h prior to the storm occurrence, appreciablevariations in many parameters are observed, suggesting thermodynamic evolution of theboundary layer convective instability. It is further demonstrated that by monitoring thesevariations it is possible to predict the ensuing thunderstorm activity over the region at least2 h in advance. The association between the temporal evolution of thermodynamic indicesand convective activity has been tested for the independent case of nine thunderstorms. Thepresent results suggest that ground-based MWR observations can be used effectively topredict the occurrence of thunderstorms at least 2 h in advance.
Citation: Madhulatha, A., M. Rajeevan, M. Venkat Ratnam, J. Bhate, and C. V. Naidu (2013), Nowcasting severeconvective activity over southeast India using ground-based microwave radiometer observations, J. Geophys. Res., 118,doi:10.1029/2012JD018174.
1. Introduction
[2] Thunderstorms are mesoscale convective systems whichcause devastating consequences like lightning, heavy precipi-tation, hail, and wind gusts. These weather systems can disruptpublic life, satellite launch operations, air transport and bringout human and economic losses. In general, the time span ofthese convective systems is about 20–30min, which makes itdifficult to forecast these weather features in advance. Predic-tion of such systems using weather prediction models is stilldifficult because of relative coarse resolution, lack of observa-tions of the initial state, and the limited predictability of smallmesoscale phenomena [Rajeevan et al., 2010]. Attempts topredict these events using weather prediction models encoun-ter problems from imperfect knowledge of the state of the
atmosphere on the mesoscale, in particular regarding the threemain ingredients which invoke thunderstorms, i.e., moistureavailability, convective instability and lifting mechanism[Kober and Tafferner, 2009].[3] Deep convection requires the presence of a conditionally
unstable lapse rate, so that parcels lifted adiabatically from theplanetary boundary layer (PBL) become more buoyant thantheir environment. The latent heat release by condensationprovides the thermal energy required to give positive buoyancyto provide vertical momentum sufficient to carry parcels fromthe PBL to the level of free convection [Colby, 1984]. Previousstudies [Beebe, 1958; Carlson et al., 1983; Colby, 1984;Sanders, 1986; Sanders and Blanchard, 1993] on the pre con-vective environment highlight the importance of changing PBLheat and moisture for the initiation of deep convection. Increas-ing heat and moisture reduces the level of free convection andincrease parcel’s convective available potential energy (CAPE)[Bluestien and Parker, 1993]. In addition, the presence ofconvective inhibition energy (CINE, in the form of capping in-version) may prevent the realization of this potential energywithin the free troposphere [Sanders and Blanchard, 1993].The knowledge of balance between PBL equivalent potentialtemperature and the intensity of the capping inversion moni-tored at high time resolution is critical to a successful nowcastof thunderstorm occurrence [Feltz and Mecikalski, 2002].
1National Atmospheric Research Laboratory, Gadanki, India.2Ministry of Earth Sciences, New Delhi, India.3Department of Meteorology and Oceanography, Andhra University,
Visakhapatnam, India.
Corresponding author: A. Madhulatha, National Atmospheric ResearchLaboratory, Gadanki P.O., Chittoor District, Andhra Pradesh 517 112, India.([email protected])
©2012. American Geophysical Union. All Rights Reserved.2169-897X/13/2012JD018174
1
JOURNAL OF GEOPHYSICAL RESEARCH, VOL. 118, 1–13, doi:10.1029/2012JD018174, 2013
[4] Very short period forecasting of the future location ofconvective storms has historically been based on extrapola-tion of radar reflectivity echoes. The accuracy of these fore-casts generally decreases very rapidly during the first 30minbecause of the very short life time of individual convectivestorms. For forecasts periods beyond ~20min, techniquesfor forecasting the initiation, growth, and dissipation of con-vective storms are essential [Browning, 1980; Wilson andMueller, 1993; Wilson et al., 1998; Hering et al., 2004].Storm location and intensity are primarily determined bymesoscale stability, wind fields and in particular conver-gence lines. Methods under development for forecastingstorm evolution are knowledge-based expert systems, statis-tical techniques and explicit numerical forecast models thatare initialized with radar data. The accurate forecasts ofconvection initiation will require initial conditions for thedynamical, thermodynamical, and microphysical fields,which in some cases are beyond our present observing capa-bilities. In other words, skillful numerical storm predictionrequire that NWP models are run over large enough domainsto capture the large-scale forcing and high enough resolutionthat the storm structure can be initialized from radar data.The knowledge-based expert system utilizes radar, satellite,boundary layer profilers, lightning network, high-densitysurface observations, and upper air weather observations(soundings). These systems may also make use of numericalmodel output and utilize fuzzy logic techniques and neuralnetworks [Wilson et al., 1998]. During the recent years, avariety of statistical techniques have been used to developforecast models for thunderstorms and lightning [Reap,1994; Lambert et al., 2005; Shafer and Fuelberg, 2006]. Ina recent study by Rajeevan et al. [2012], a statistical modelbased on binary logistic regression was developed for pre-dicting probability of lightning occurrence over southeastIndia using the perfect prognostic method (PPM). For realtime forecasts, predictors are derived from 12 h predictionsusing the WRF model. The model showed some encourag-ing results in predicting the probability of lightning overthe region about 3–12 h in advance.[5] As discussed earlier, the other method of nowcasting is
to examine stability/convective indices derived mainly fromthe upper air soundings to explain the thermodynamic evolu-tion of the boundary layer convective instability [Feltz et al.,2003]. In operational weather forecasting, it is common toexamine the temperature and humidity profiles measuredby radiosondes and the derived instability indices innowcasting heavy rain and thunderstorms [McCann, 1994;Geerts, 2001; Manzato, 2003; Lee, 2007]. There are manyprevious studies [Tuduri and Ramis, 1997; Manzato, 2003;Marinaki et al., 2006] of correlating convective activity withthe radiosonde derived instability indices. However, ordi-nary upper air observations by radiosonde are taken onlytwice a day, which are not sufficient to monitor atmosphericstructures vertically for a short-term forecast. This is becauseprecipitation systems develop rapidly and thermodynamicproperties of troposphere could change rapidly [Güldnerand Spänkuch, 1999]. Therefore, more frequently availablethermodynamic information is of great benefit for severeweather nowcasting. This problem can be solved to largeextent with ground-based microwave radiometer, whichgives continuous profiles of temperature and humidity withhigh temporal resolution.
[6] Over the last 25 years, ground-based remote profilingof various atmospheric parameters has found increasingapplications in atmospheric studies where its high verticaland temporal resolution and extended vertical coverage aregiving scientists a clearer understanding of atmospheric pro-cesses in the troposphere. Various studies have been carriedout to observe continuously the atmosphere in the boundarylayers for short-term weather forecasting, using variousremote sensing instruments, such as a wind profiler, radar,lidar, and microwave radiometers [Clifford et al., 1994;Wilczak et al., 1996; Güldner and Spänkuch, 2001; Won,2009]. Ware et al. [2003] compared radiometric, radiosondeand forecast soundings for evaluating the accuracy of radio-metric temperature and water vapor soundings. Studies byKoffi [2007] have shown that the fine temporal resolution ofconvective indices may be valuable for thunderstorm now-casting as well as for basic studies on convection evolution.[7] Microwave radiometer (MWR) has the advantage of
continuous monitoring of atmosphere up to 10 km to coverthe temporal and spatial gaps of synoptic networks by radio-sonde measurements. Ground-based MWRs [Rose andCzekala, 2003; Knupp et al., 2009] retrieve the temperatureand humidity profiles up to 10 km by measuring the radia-tion intensity at a number of frequency channels in themicrowave spectrum that are dominated by atmosphericwater vapor, cloud liquid water and molecular oxygen emis-sions. A comprehensive study by Chan, [2009] during afield experiment discussed the importance of the MWR pro-files in nowcasting of intense convective weather over HongKong. Later, Chan and Hon [2011] elaborately described theimportance of the MWR derived indices, and their usage innowcasting by correlating the derived variables with thelightning activity. The high temporal resolution monitoringof rapid atmospheric destabilization is especially importantfor nowcasting severe convection [Feltz et al., 2003]. Thedetermination of water vapor mixing ratio and temperatureprofiles within the troposphere using microwave radiometerenables high temporal monitoring of stability indices. Thesedata sets provide a unique, real time assessment of thepreconvective atmosphere, not available from conventionalsounding observations usually made twice daily.[8] Recently, a ground-based MWR was installed at the
National Atmospheric Research Laboratory (NARL), atGadanki (13.5�N, 79.2�E), a semiarid station located overSoutheast India. The continuous measurements of tempera-ture and humidity profiles up to 10 km with high temporalresolution (~5min) obtained from MWR can be used toderive thermodynamic stability indices, which will give anindication of the degree of convective instability of the tro-posphere. In the present study, we explore the possibilityof nowcasting thunderstorm activity over the southeastIndian region using the ground-based MWR and otherobservational systems. For identifying the genesis of thun-derstorm activity, lightning data recorded by the ElectricField mill available at the observational site were also consid-ered. Electric field intensity greater than 2000V/m is identi-fied as thunderstorm activity. Altogether, 25 thermodynamicindices were considered, including the single-level indicesdepending on temperature and dew point at specific levels,such as the K index (KI), the humidity index (HI), totaltotal index (TTI), integrated parameters like convectiveavailable potential energy (CAPE), moisture parameters like
MADHULATHA ET AL.: THUNDERSTORM NOWCASTING USING RADIOMETER
2
precipitable water content, relative humidity, layer thickness,stability index, lapse rate at different levels based on equiva-lent potential temperature, and the shape factor (SF) [Walkeret al., 2008]. The estimation of all these indices is describedin Appendix A.[9] The present paper reports the application of multi-
wavelength, ground-based MWR observations at Gadankiin nowcasting thunderstorms over the region. The equipmentsetup of MWR and methodology is described in section 2.Validation of MWR data with GPS radiosonde and the per-formance of MWR during severe convection are examinedby correlating the MWR derived stability indices with radio-sonde derived stability indices are discussed in section 3. Toobtain the composite picture of stability indices during thethunderstorm events, a superepoch analysis has been carriedout to examine the temporal variations in various stabilityindices prior to the storm occurrence. These results arediscussed in section 4. The inference established from super-epoch analysis is tested for an independent verification ofnine thunderstorm cases is discussed in section 5. Conclusionsare drawn in section 6.
2. Data and Methodology
[10] In the present study, MWR and GPS radiosondeobserved temperature and humidity profiles during theperiod, June to December 2011 were used. MWR used inthe present study is a MP-3000A temperature, humidity andliquid profiler (manufactured by Radiometrics Corporation),which operates in 21 K band (22–30GHz) and 14 V band(51–184GHz) microwave channels. It measures the radiationintensity of the sky in 35 different frequency channels both inoxygen and water vapor bands, which are primary absorbersof the atmospheric radiation in the atmosphere. Neural net-work retrieval method has been constructed to retrieve thetemperature profiles from the brightness temperature mea-surements [Chan and Lee, 2011]. Retrieval of temperatureand humidity profiles from the radiation intensity measure-ments of the radiometer is accomplished by neural networkmethods based on historical radiosonde data, using a radiativetransfer model to simulate the observations of a radiometer[Chan, 2009]. In this study neural network algorithm wastrained by using high-resolution radiosonde data from thesame location for the period 2006 to 2009. MWR scans theatmosphere in zenith and off zenith directions in different ele-vations at fixed angles. For the present study, the temperatureand humidity profiles in the zenith direction only are onlytaken, which are normally available in every 4–5min intervalup to 10 km altitude. The vertical soundings of temperatureand humidity obtained from the Meisei radiosonde balloonascents launched at around 1200 UTC (1730 local time(LT)) daily from Gadanki are also taken. The accuracy oftemperature and relative humidity sensors of radiometer pro-vided by radiometrics are 0.5 K and 2%, respectively whichare at par with radiosonde observations [Nath et al., 2009].[11] In addition to this, electric field mill (EFM) measure-
ments are also used to identify thunderstorm activity. EFMis a real-time lightning system which monitors the develop-ment and dissipation of overhead lightning threats by mea-suring local atmospheric electric field. EFM measures theelectric field intensity in the local area. There is always ver-tical electric field in the atmosphere. In fair weather this
electric field is around 0 to 200V/m. In stormy weather itis much higher because of presence of electric charges onthunder clouds. By the time the electric field reaches2000V/m the probability of lightning is significant. EFMtheory is based on basic laws of electromagnetism. When aconducting plate is exposed to electric field, a charge willbe induced proportional to electric field and the plate area.EFM creates an alternating electric field using a motordriven rotor and stator arrangement, which is easier to mea-sure. In addition to detecting the electric field changes asso-ciated with thunderstorms, EFMs also detect variety of othersignals not associated with thunderstorms like blowing sandor dust, blowing snow, charge separation in nonlightningproducing showers, charge separated when raindrops splashon or near the instrument. This wide variety of signals canlead to false alarms when EFMs are used for lightning warn-ings, but the amount of such false alarms will depend on thefield threshold used for identifying thunderstorm activity aswell as frequency, duration and intensity of such events[Murphy et al., 2008].
3. Results and Discussions
3.1. Validation of MWR Data With GPS RadiosondeData
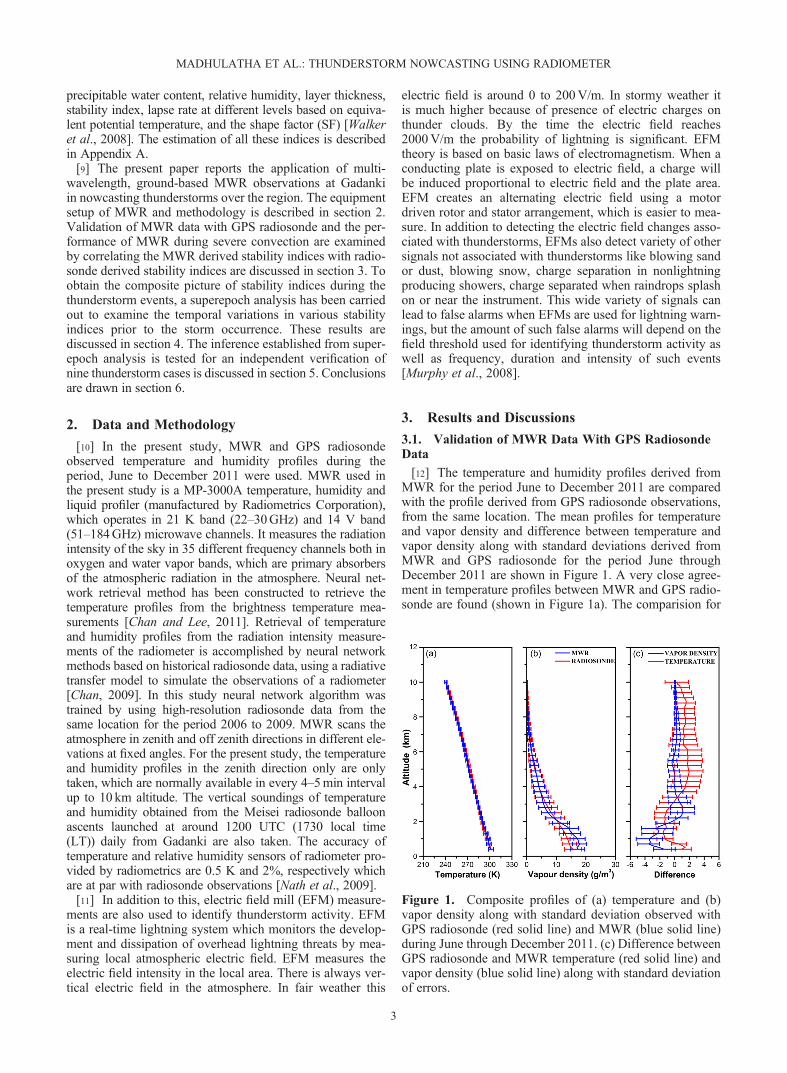
[12] The temperature and humidity profiles derived fromMWR for the period June to December 2011 are comparedwith the profile derived from GPS radiosonde observations,from the same location. The mean profiles for temperatureand vapor density and difference between temperature andvapor density along with standard deviations derived fromMWR and GPS radiosonde for the period June throughDecember 2011 are shown in Figure 1. A very close agree-ment in temperature profiles between MWR and GPS radio-sonde are found (shown in Figure 1a). The comparision for
Figure 1. Composite profiles of (a) temperature and (b)vapor density along with standard deviation observed withGPS radiosonde (red solid line) and MWR (blue solid line)during June through December 2011. (c) Difference betweenGPS radiosonde and MWR temperature (red solid line) andvapor density (blue solid line) along with standard deviationof errors.
MADHULATHA ET AL.: THUNDERSTORM NOWCASTING USING RADIOMETER
3

vapor density profiles (Figure 1b) are better in middle toupper troposphere and at the lower levels (below 3 km),MWR observations show a wet bias compared to the radio-sonde observations in the lower levels. However, theseresults on dry bias of radiosonde are consistent with theearlier observations by Westwater et al. [2003] and Cady-Pereria et al. [2008]. Difference between GPS radiosondeand MWR for temperature and vapor density profiles alongwith standard deviation are shown in Figure 1c. Temperatureof MWR in the lower levels and above 4 km, shows coldbias with the magnitude of 1�C and vapor density ofMWR shows wet bias below 2 km and dry bias up to 4 kmwhen compared with radiosonde measurements (shown inFigure 1c). For vapor density, wet bias of MWR at lowerlevels and dry bias higher up are coinciding with the resultsof [Chan, 2009]. Since the measurement principles of thetwo instruments are different (Volume integral above a fixedlocation on the ground for Radiometers vs. point measure-ment of a drifting balloon for radiosonde), there are biasesand spreads of the data points, but the two data sets are fol-lowing the similar trends in the evolution of the temperatureand humidity inside the troposphere Chan and Hon [2011].
3.2. Correlation of Thermal Indices Derived FromMWRand GPS Radiosonde Data
[13] In this section, we examine the correlations ofthermodynamic indices derived from the MWR and GPSradiosonde observations. Since the radiosonde data areavailable only at 1200 UTC, we used the MWR data of thecorresponding hour for the analysis. Using the temperatureand relative humidity profiles obtained from GPS radio-sonde and MWR, 25 thermodynamic (including moisturevariables) parameters are computed (details of the 25 indicesare given in Appendix A). The correlation coefficients ofcalculated 25 thermodynamic indices are shown in Table 1.
All parameters are well correlated each other except the fol-lowing four parameters, LI, CINE, Thickness (700–400 hPa)and LR (700–400 hPa). The scatterplots of 15 thermody-namic indices (having a correlation >0.5) derived from theMWR and radiosonde data are shown in Figures 2 and 3.In general, the MWR derived indices and radiosonde derivedindices are well correlated. Among all the indices, single-level indices like KI, TTI, HI and moisture parameters likePW, MEANLAYRH, and stability index (θes – θe)950hPashow very high correlation of 0.9 which is significant atthe 99% confidence level. Among all the moisture indices,PW showed the best correlation of 0.98. Fairly good correla-tion of the parameters KI, HI, TTI are persistent with previ-ous observations by [Chan and Hon, 2011]. The correlationanalysis suggests that the quality of MWR profiles is ade-quate enough to calculate the stability indices using MWRdata which can explain thermodynamic structure of thetroposphere. Therefore, for further analysis, we have usedMWR data to develop methods for nowcasting convectiveactivity over the region.
3.3. Relationship Between the Genesis of ThunderstormActivity and Thermodynamical Indices
[14] The variation of MWR derived thermodynamic indi-ces and the occurrence of thunderstorm activity is examinedin this section. By using a single index, namely, KI, Chan[2009] demonstrated a good correlation between lightningactivity and the instability index, KI. In this section, anattempt has been made to identify precursors of thunder-storm genesis by examining the variations of MWR derivedthermodynamic indices and the occurrence of thunderstorm.A thunderstorm event is defined as the event in which theassociated observed electric field strength (measured by EFM)is greater than 2000V/m.[15] The variations of thermodynamic parameters associ-
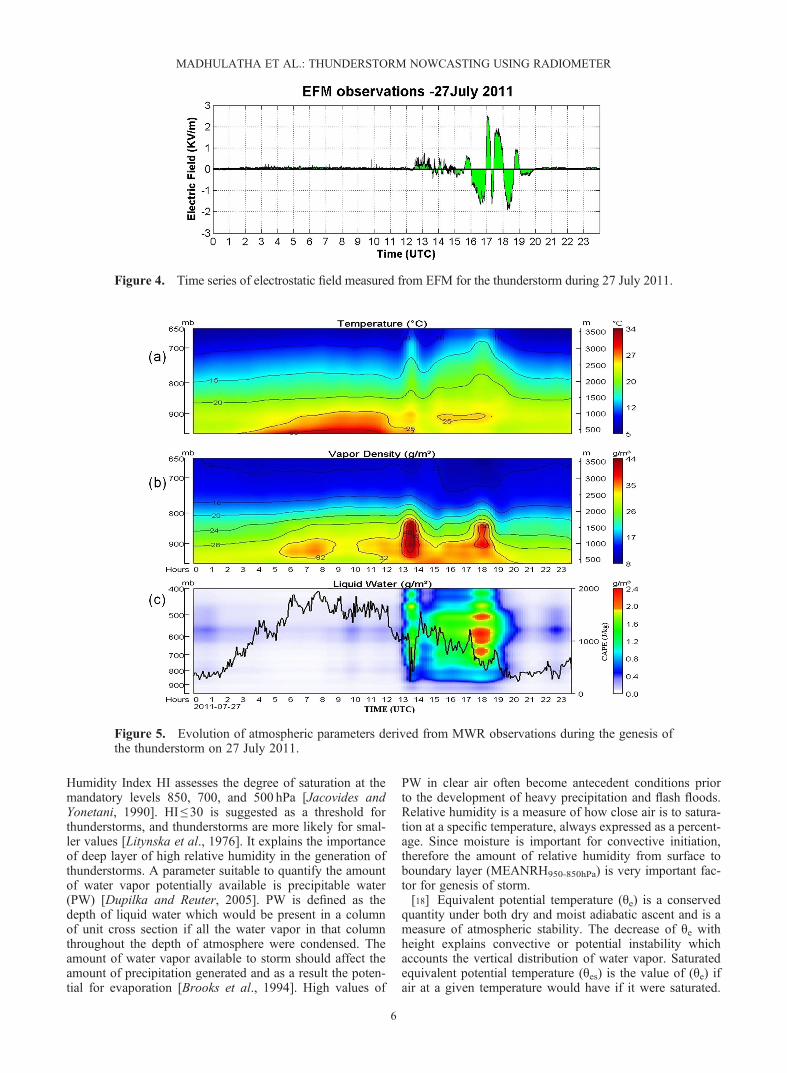
ated with a thunderstorm event are examined and illustratedby considering a case study of severe thunderstorm occurredover Gadanki. Using the EFM data, a severe thunderstormobserved around 1700 UTC on 27 July 2011 was identified(Figure 4). The temporal variations in basic parameters asso-ciated with storm are studied using MWR observations. Thecontinuous temperature and moisture profiles derived fromMWR provide unique perspective on the evolution of thethermodynamic structure of convective instability associatedwith the storm. Sharp increase in water vapor density andfluctuations in temperature are clearly visible during the evo-lution of the storm. The presence of a deep convective cloudis seen from the large amount of cloud liquid water extend-ing up to 400 hPa. Even though EFM showed changes in theelectrical field exceeding 2000 V/M around 1700 UTC only,large-scale convective cloud development was observedfrom 1300 UTC. It is interesting to note that convectiveavailable potential energy (CAPE) increased sharply in theafternoon (almost 6 h in advance); however, it decreasedsharply during the occurrence of the storm (Figure 5). Thiscase study illustrated the promise for nowcasting the occur-rence of convective activity based on continuous tempera-ture, moisture monitoring and unique cloud liquid soundingsin the lower troposphere available from MWR.[16] To understand the variations of different thermody-
namic parameters associated with the thunderstorms, wehave examined the 25 parameters tabulated in Table 1.
Table 1. Correlation Values Between GPS andMWR for DifferentThermodynamical Parameters
Parameter R
LI 0.18KI 0.91TTI 0.58HI 0.95LCAPE2 0.32CINE 0.15CONVTEMP 0.50SF 0.37PW 0.98MEANRH950-850hPa 0.88RHFRZL 0.84MEANLAYRH 0.98THICKNESS950-850hPa 0.60THICKNESS850-500hPa 0.27THICKNESS700-400hPa 0.14THICKNESS500-300hPa 0.34(θes-θe)950hPa 0.92(θes-θe)850hPa 0.75(θes-θe)500hPa 0.79LR950-700hPa 0.75LR700-400hPa -0.07LR400-300hPa 0.04θe LR950-700 hPa 0.57θe LR700-400 hPa 0.76θe LR400-300 hPa 0.30
MADHULATHA ET AL.: THUNDERSTORM NOWCASTING USING RADIOMETER
4

However, the correlation between MWR and radiosondeobservations is more than 0.5 only for 15 parameters(Table 1). Among the 15 parameters, we find eight parameterswhich consistently showed similar variations associated withthe occurrence of thunderstorms. The eight parameters thusidentified are, KI, HI, PW, MEANRH950-850hPa, (θes-θe)950hPa,(θes-θe)500hPa, θe LR950-700 hPa, θe LR700-400 hPa. These param-eters explain the variations in temperature, moisture and
stability state of atmosphere which are the basic ingredientsfor thunderstorm development. A brief description of theseeight parameters is as follows.[17] KI represents the thunderstorm potential as a function
of vertical temperature lapse rate, dew point temperature at850 hPa and the depth of the moist layer at 700 hPa [George,1960]. KI> 30 represents an atmospheric potential forthunderstorms to occur [Haklander and van Delden, 2003].
Figure 2. Scatterplots of different thermal and dynamical instability indices derived from GPS radiosondeand MWR. The correlation coefficient values are given in the plot (N = 162).
Figure 3. Same as Figure 2, but for the stability index (θes - θe) at different levels, lapse rate at 950–850 hPa,and θe lapse rate at different levels.
MADHULATHA ET AL.: THUNDERSTORM NOWCASTING USING RADIOMETER
5
Humidity Index HI assesses the degree of saturation at themandatory levels 850, 700, and 500 hPa [Jacovides andYonetani, 1990]. HI ≤ 30 is suggested as a threshold forthunderstorms, and thunderstorms are more likely for smal-ler values [Litynska et al., 1976]. It explains the importanceof deep layer of high relative humidity in the generation ofthunderstorms. A parameter suitable to quantify the amountof water vapor potentially available is precipitable water(PW) [Dupilka and Reuter, 2005]. PW is defined as thedepth of liquid water which would be present in a columnof unit cross section if all the water vapor in that columnthroughout the depth of atmosphere were condensed. Theamount of water vapor available to storm should affect theamount of precipitation generated and as a result the poten-tial for evaporation [Brooks et al., 1994]. High values of
PW in clear air often become antecedent conditions priorto the development of heavy precipitation and flash floods.Relative humidity is a measure of how close air is to satura-tion at a specific temperature, always expressed as a percent-age. Since moisture is important for convective initiation,therefore the amount of relative humidity from surface toboundary layer (MEANRH950-850hPa) is very important fac-tor for genesis of storm.[18] Equivalent potential temperature (θe) is a conserved
quantity under both dry and moist adiabatic ascent and is ameasure of atmospheric stability. The decrease of θe withheight explains convective or potential instability whichaccounts the vertical distribution of water vapor. Saturatedequivalent potential temperature (θes) is the value of (θe) ifair at a given temperature would have if it were saturated.
Figure 4. Time series of electrostatic field measured from EFM for the thunderstorm during 27 July 2011.
Figure 5. Evolution of atmospheric parameters derived from MWR observations during the genesis ofthe thunderstorm on 27 July 2011.
MADHULATHA ET AL.: THUNDERSTORM NOWCASTING USING RADIOMETER
6
If θes of the environment decreases with height then a parcelcan become positively buoyant and reach saturation whichimplies conditional instability. Conditional instability ismost appropriate parameter for identifying regions favorablefor convection since it is a function of temperature lapse rateonly. On a climatological basis both conditional and convec-tive instability exists essentially everywhere in the tropics,so for evaluating favored locations capable for supportingdeep convection, both instabilities should be considered[Khalsa, 1989]. The most accurate method of explainingthe atmospheric stability is to consider both convective andconditional instabilities.[19] Stability index (θes-θe) at different levels explains the
saturation state of atmosphere. A higher difference impliesthe atmosphere is unsaturated. The decrease of θe withheight is θe lapse rate (θe LR), which explains the stabilityof atmosphere. Generally, θe LR decreasing with heightcorresponds to unstable atmosphere.[20] For the present case study of 27 July 2011, we have
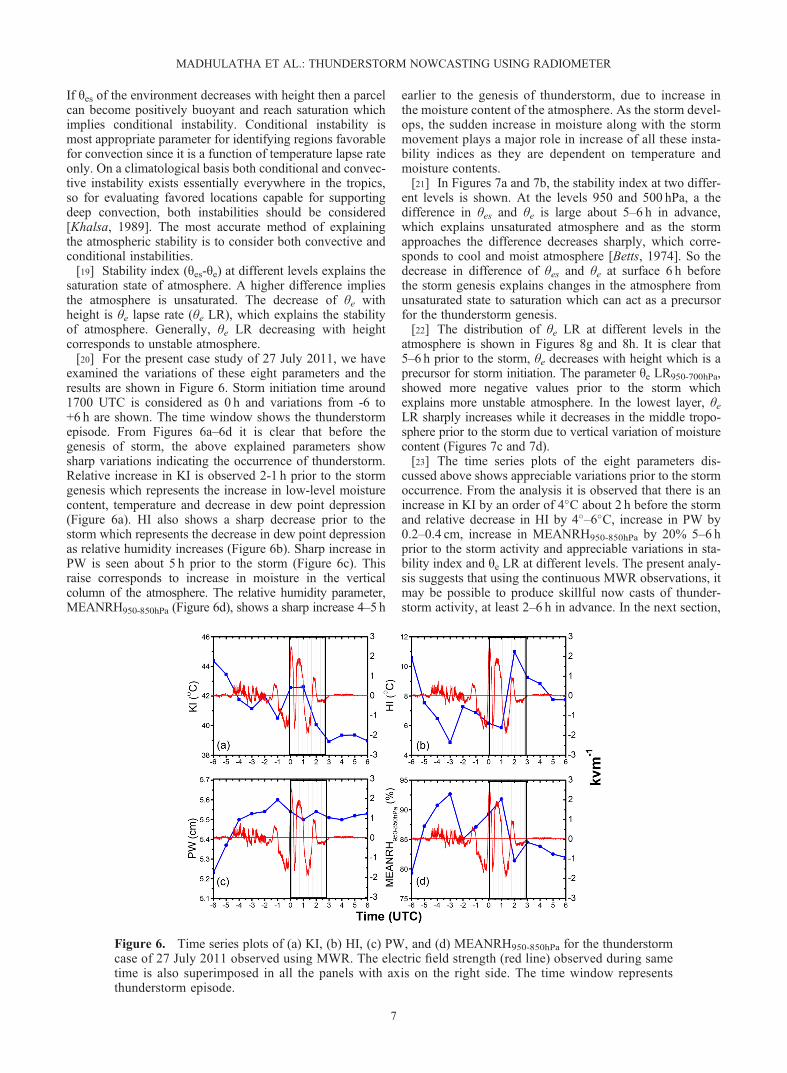
examined the variations of these eight parameters and theresults are shown in Figure 6. Storm initiation time around1700 UTC is considered as 0 h and variations from -6 to+6 h are shown. The time window shows the thunderstormepisode. From Figures 6a–6d it is clear that before thegenesis of storm, the above explained parameters showsharp variations indicating the occurrence of thunderstorm.Relative increase in KI is observed 2-1 h prior to the stormgenesis which represents the increase in low-level moisturecontent, temperature and decrease in dew point depression(Figure 6a). HI also shows a sharp decrease prior to thestorm which represents the decrease in dew point depressionas relative humidity increases (Figure 6b). Sharp increase inPW is seen about 5 h prior to the storm (Figure 6c). Thisraise corresponds to increase in moisture in the verticalcolumn of the atmosphere. The relative humidity parameter,MEANRH950-850hPa (Figure 6d), shows a sharp increase 4–5 h
earlier to the genesis of thunderstorm, due to increase inthe moisture content of the atmosphere. As the storm devel-ops, the sudden increase in moisture along with the stormmovement plays a major role in increase of all these insta-bility indices as they are dependent on temperature andmoisture contents.[21] In Figures 7a and 7b, the stability index at two differ-
ent levels is shown. At the levels 950 and 500 hPa, a thedifference in θes and θe is large about 5–6 h in advance,which explains unsaturated atmosphere and as the stormapproaches the difference decreases sharply, which corre-sponds to cool and moist atmosphere [Betts, 1974]. So thedecrease in difference of θes and θe at surface 6 h beforethe storm genesis explains changes in the atmosphere fromunsaturated state to saturation which can act as a precursorfor the thunderstorm genesis.[22] The distribution of θe LR at different levels in the
atmosphere is shown in Figures 8g and 8h. It is clear that5–6 h prior to the storm, θe decreases with height which is aprecursor for storm initiation. The parameter θe LR950-700hPa,showed more negative values prior to the storm whichexplains more unstable atmosphere. In the lowest layer, θeLR sharply increases while it decreases in the middle tropo-sphere prior to the storm due to vertical variation of moisturecontent (Figures 7c and 7d).[23] The time series plots of the eight parameters dis-
cussed above shows appreciable variations prior to the stormoccurrence. From the analysis it is observed that there is anincrease in KI by an order of 4�C about 2 h before the stormand relative decrease in HI by 4�–6�C, increase in PW by0.2–0.4 cm, increase in MEANRH950-850hPa by 20% 5–6 hprior to the storm activity and appreciable variations in sta-bility index and θe LR at different levels. The present analy-sis suggests that using the continuous MWR observations, itmay be possible to produce skillful now casts of thunder-storm activity, at least 2–6 h in advance. In the next section,
Figure 6. Time series plots of (a) KI, (b) HI, (c) PW, and (d) MEANRH950-850hPa for the thunderstormcase of 27 July 2011 observed using MWR. The electric field strength (red line) observed during sametime is also superimposed in all the panels with axis on the right side. The time window representsthunderstorm episode.
MADHULATHA ET AL.: THUNDERSTORM NOWCASTING USING RADIOMETER
7

a detailed analysis of variation of thermal indices associatedwith more number of thunderstorm cases is discussed usinga superepoch analysis.
4. Superepoch Analysis
[24] From the analysis discussed above, it inferred that2–6 h before the storm occurrence, variations in KI, HI, PW,MEANRH950-850hPa, stability index and θe LR at differentlevels are clearly observed. These variations in these para-meters explain the thermodynamic evolution of the boundarylayer convective instability. For obtaining a composite picture
of all thunderstorms considered for the study, we have carriedout a superepoch analysis for the time series of various ther-mal indices derived from MWR observations.[25] To examine the temporal variations of various ther-
mal indices, lagged composites of all the eight parametersare calculated. The time of occurrence of the storm is consid-ered as lag 0 and lag -6 corresponds to preenvironment 6 hbefore the storm occurrence and lag +6 correspond to post-environment 6 h after the storm occurrence. In the presentanalysis, the hour corresponding to the storm occurrence isconsidered as zero. Six hours before and after the stormoccurrence were superposed and averaged to produce one
Figure 7. Same as Figure 6, but for (a) the stability index at 950 hPa, (b) the stability index at 500 hPa,(c) θe LR950-700 hPa, and (d) θe LR700-400 hPa.
Figure 8. Superepoch analysis of eight different thermodynamical indices. Vertical bars represent thestandard errors.
MADHULATHA ET AL.: THUNDERSTORM NOWCASTING USING RADIOMETER
8

superposed curve. This procedure is repeated for all the eightparameters considered in this study. All these parameterscorresponding to different lags are averaged and standarddeviations are calculated. By observing the variations ofthe composite time series of these thermodynamic indices,it is possible to explain the prerequisites necessary for thegenesis of thunderstorm activity. In the recent study by[Rajeevan et al., 2012], a prediction scheme is developedto nowcast the probability of lightning over southeast Indiausing various thermodynamical indices which explain thetropospheric instability. From the study it is inferred thatthe above mentioned eight parameters showed appreciabledifferences in threshold for the occurrence of thunderstormand nonthunderstorm cases, 60% or more storms are formedwhen KI exceeds 42�C, MEANRH950-850hPa raises morethan 75%, and PW value reaches more than 5.4 cm. And alsoappreciable variations are observed for stability index andequivalent potential temperature lapse rate at lower and mid-dle levels for thunderstorm and nonthunderstorm cases forthe study region. So it is clear that these parameters arehistorically suitable for this location in nowcasting the gen-esis of thunderstorm activity in advance. The lag compo-sites of the mentioned eight parameters for the identified26 thunderstorm cases are shown in Figure 8. KI shows anear monotonic increase from 6 to 0 h prior to the storm.This is due to an increase in vertical lapse rate and low-level moisture and a decrease in dew point depression at700 mbar. At the time of occurrence of storm, KI exceeding42�C is observed (Figure 8a). Decrease in HI is also clearlyseen before 3 h of the storm occurrence which clearlyexplains decrease in dew point depression at differentlevels which suggests increase in relative humidity. HIvalues are reduced by values less than 10�C (Figure 8b).There is also a sharp increase in total Precipitablewater content (PW) and lower-level relative humidity. PW
increases to 5.2 cm or more while lower-level relative hu-midity (MEANRH950-850hPa) exceeds 85% during the storm(Figures 8c and 8d).[26] (θes-θe)950hPa shows a relative decrease 3 h prior to the
storm development and decreased by an order of 15 K at thetime of storm and the parameter (θes-θe)500hPa decreases 2 hbefore storm genesis and decrease by the order of 2 K asstorm approaches. The decrease in these stability indexparameters at surface and mid troposphere explains thatthe parcel is tending to saturation state from unsaturationstate of the atmosphere due to increase in relative humidity(Figures 8e and 8f).[27] θe LR950-700hPa increases 3 h prior to the storm occur-
rence and θe LR700-400hPa decreases 3 h before the storminitiation. θe LR at both levels is negative which corre-sponds to unstable atmosphere but at lower levels increaseis seen prior to the storm whereas at middle levels decreaseis seen this is due to variation on water vapor density at dif-ferent levels. Since the vertical distribution of θe dependson the amount of water vapor the increase in moisture atlower levels during the initiations of storm results inincreasing of θe LR950-700hPa as compared to the other(shown in Figures 8g and 8h).[28] However, the observed variations associated with
thunderstorms could happen during nonthunderstorm casesalso due to diurnal variation of temperature, moisture andboundary layer. Therefore, to examine the kind of variationsto be observed during nonthunderstorm cases, we consid-ered 30 nonthunderstorm cases, selected randomly. Sincesuperposed epoch analysis (with zero time) cannot be ap-plied for the nonthunderstorm cases, composites (arithmeticaverages) of the parameters during the period 0600–1800UTC were calculated and examined. Majority (90% ormore) of storm occurrence at Gadanki is observed duringthe period 0600–1800 UTC. The average variations of the
Figure 9. Composite profiles of eight different thermodynamical parameters along with standard errors(vertical lines) for nonthunderstorm cases.
MADHULATHA ET AL.: THUNDERSTORM NOWCASTING USING RADIOMETER
9
eight parameters for nonthunderstorm cases are shown inFigures 9a–9h.[29] For nonthunderstorm cases also KI shows an increase
in value during the evening, but however the mean value ofKI (less than 40) for nonthunderstorm days is much less thanKI (more than 42) observed during the thunderstorm daysand moreover for thunderstorm cases, KI shows a monotonicincrease as storm approaches which is not seen for nonthun-derstorm cases. HI does not show sharp decrease as ob-served during the thunderstorm cases. Moreover, the valueof HI for nonthunderstorm cases is also larger compared tothunderstorm cases. Similarly, PW during nonthunderstormdays does not show a sharp increase and the mean value ofPW during nonthunderstorm cases is less than thunderstormcases. Even though MEANRH950-850hPa shows an increaseduring the evening period, the mean value of this parameter(less than 70%) for nonthunderstorm days is much less thanthe mean value (more than 80%) during the thunderstormcases. Similarly, (θes-θe)950hPa shows a sharper decrease dur-ing the thunderstorm days compared to nonthunderstormdays. The magnitude of this parameter during the nonthun-derstorm days is much larger than during thunderstormcases. The same parameter at 500 hPa also shows a sharpdecrease during the thunderstorm cases. The parameters θeLR950-700 hPa, θe LR700-400 hPa do not show appreciablevariations during the nonthunderstorm cases as observed inthunderstorm cases (shown in Figures 9a–9h).[30] Thus we note appreciable differences in the variations
and magnitude of the parameters between thunderstorm andnonthunderstorm cases. This information may be useful fordeveloping an algorithm for nowcasting purposes. In thenext section, we discuss the possibility of nowcasting thun-derstorms (at least 2 h in advance) using these eight para-meters derived from MWR data.
5. Independent Cases
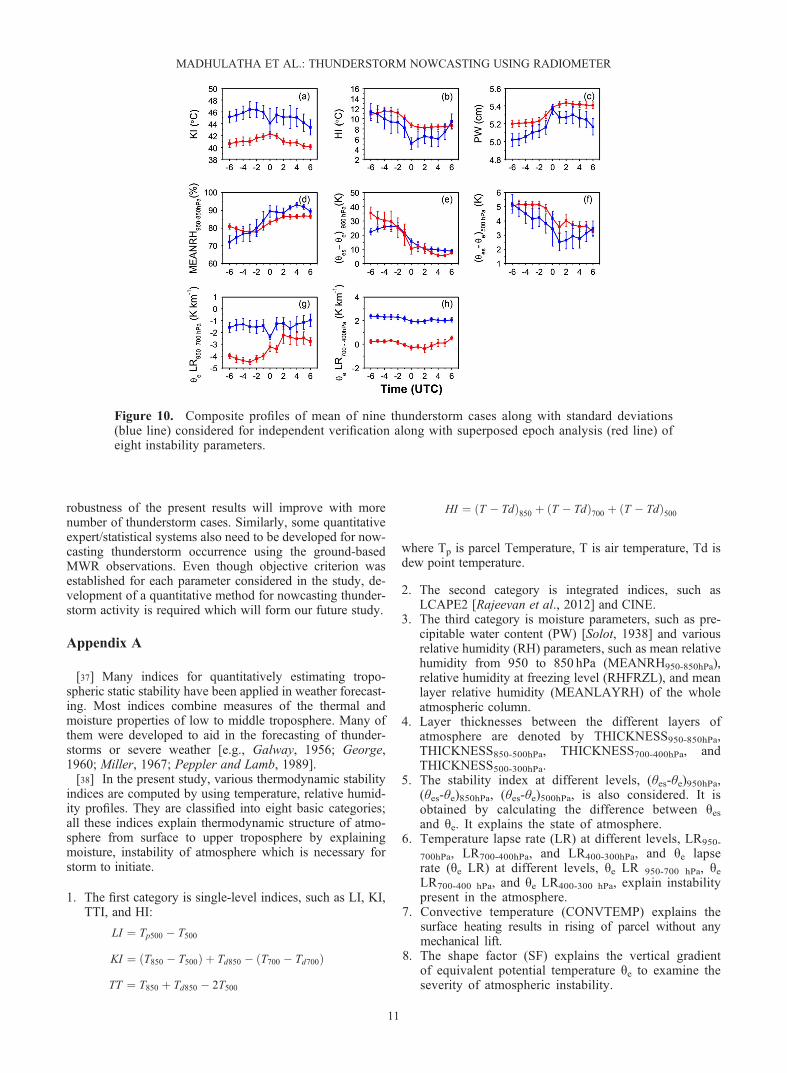
[31] Superepoch analysis has been done to obtain the com-posite picture of variations of MWR derived indices with theoccurrence of intense convective activity. The informationso established could be useful for nowcasting of intense con-vective weather. For testing the information revealed fromsuperepoch analysis to nowcast thunderstorm activity, wehave done an independent verification using nine thunder-storm cases. The nine thunderstorm cases identified for theanalysis is shown in Table 2. These cases were not includedin the superposed epoch analysis discussed in section 4.The superposed epoch variations of the mean of parameters
during the nine cases of thunderstorms are shown inFigures 10a–10h along with the superposed epoch variationsof 26 thunderstorms considered in the earlier analysis. Theresults indicate similar kind of variations during these ninecases of thunderstorms also except for a couple of parameters.[32] The parameter KI during the nine cases is showing an
increasing trend before the storm occurrence as we observedin the superepoch analysis. Mean value of KI is larger thanthe superepoch analysis of 26 cases. HI shows a sharpdecrease and PW shows a sharp increase. Similarly, meanRH in the lower level (MEANRH950-850hPa) increasessharply. And θe differences parameters (θes-θe)950hPa and(θes-θe)500hPa also shows sharp decreases as we have seen inthe superepoch analysis of 26 thunderstorm cases. Both θelapse rate parameters θe LR950-700 hPa, θe LR700-400 hPa alsoshow similar variations as observed in the superepoch analysis.[33] The above results during the independent period sug-
gest the importance of examining the temporal variation ofvarious thermal and moisture parameters in nowcastingthunderstorm activity. It clearly highlights the importanceof continuous monitoring of thermal indices from MWR tonowcast the severe thunderstorm activity in advance.
6. Conclusions
[34] The primary objective of the present paper is to dem-onstrate the use of ground-based microwave radiometer forstudying severe convective activity over Southeast Indianregion and exploring the feasibility of nowcasting thunder-storm activity at least 2 h in advance. For this purpose, con-tinuous observations of temperature and moisture obtainedfrom MWR located at a tropical station, Gadanki were used.Before using MWR data for the analysis of thunderstormcases, the quality of MWR data is validated by comparingthe temperature and vapor density profiles with that ob-served from colocated GPS radiosonde data. The analysisrevealed that the MWR derived profiles of temperatureand vapor density match reasonably well with the GPSradiosonde profiles. Moreover, at least 15 thermodynamicvariables derived from MWR data correlated significantly(statistically significant) with the variables derived fromGPS radiosonde observations.[35] To examine the utility of the continuous measure-
ments by MWR, we have carried out a superepoch analysisof eight thermodynamic parameters derived from MWR datafor 26 thunderstorm cases. The superepoch analysis is con-ducted from 6 h before the storm initiation to 6 h after thestorm initiation. This analysis suggested that many thermo-dynamic parameters like, KI, LI, total precipitable watercontent, lower-level relative humidity, stability index at dif-ferent levels, lapse rate of equivalent potential temperatureshowed useful signals at least 3 h before the storm occur-rence. The analysis showed that there are sharp changes inthe eight thermodynamic parameters associated with thestorms. There are appreciable differences in the variationsof these eight parameters between thunderstorm and non-thunderstorm cases.[36] The present study thus highlights the utility of
ground-based MWR observations for studying and nowcast-ing thunderstorms. However, the present study has somecaveats, especially on the nowcasting method. The presentstudy uses only limited cases of thunderstorms. The
Table 2. List of Thunderstorm Cases
Storm Thunderstorm Date
1 1 Jul 20112 5 Jul 20113 9 Oct 20114 7 Jun 20125 10 Jul 20126 17 Jul 20127 21 Aug 20128 29 Aug 20129 3 Sep 2012
MADHULATHA ET AL.: THUNDERSTORM NOWCASTING USING RADIOMETER
10
robustness of the present results will improve with morenumber of thunderstorm cases. Similarly, some quantitativeexpert/statistical systems also need to be developed for now-casting thunderstorm occurrence using the ground-basedMWR observations. Even though objective criterion wasestablished for each parameter considered in the study, de-velopment of a quantitative method for nowcasting thunder-storm activity is required which will form our future study.
Appendix A
[37] Many indices for quantitatively estimating tropo-spheric static stability have been applied in weather forecast-ing. Most indices combine measures of the thermal andmoisture properties of low to middle troposphere. Many ofthem were developed to aid in the forecasting of thunder-storms or severe weather [e.g., Galway, 1956; George,1960; Miller, 1967; Peppler and Lamb, 1989].[38] In the present study, various thermodynamic stability
indices are computed by using temperature, relative humid-ity profiles. They are classified into eight basic categories;all these indices explain thermodynamic structure of atmo-sphere from surface to upper troposphere by explainingmoisture, instability of atmosphere which is necessary forstorm to initiate.
1. The first category is single-level indices, such as LI, KI,TTI, and HI:
LI ¼ Tp500 � T500
KI ¼ T850 � T500ð Þ þ Td850 � T700 � Td700ð Þ
TT ¼ T850 þ Td850 � 2T500
HI ¼ T � Tdð Þ850 þ T � Tdð Þ700 þ T � Tdð Þ500
where Tp is parcel Temperature, T is air temperature, Td isdew point temperature.
2. The second category is integrated indices, such asLCAPE2 [Rajeevan et al., 2012] and CINE.
3. The third category is moisture parameters, such as pre-cipitable water content (PW) [Solot, 1938] and variousrelative humidity (RH) parameters, such as mean relativehumidity from 950 to 850 hPa (MEANRH950-850hPa),relative humidity at freezing level (RHFRZL), and meanlayer relative humidity (MEANLAYRH) of the wholeatmospheric column.
4. Layer thicknesses between the different layers ofatmosphere are denoted by THICKNESS950-850hPa,THICKNESS850-500hPa, THICKNESS700-400hPa, andTHICKNESS500-300hPa.
5. The stability index at different levels, (θes-θe)950hPa,(θes-θe)850hPa, (θes-θe)500hPa, is also considered. It isobtained by calculating the difference between θesand θe. It explains the state of atmosphere.
6. Temperature lapse rate (LR) at different levels, LR950-
700hPa, LR700-400hPa, and LR400-300hPa, and θe lapserate (θe LR) at different levels, θe LR 950-700 hPa, θeLR700-400 hPa, and θe LR400-300 hPa, explain instabilitypresent in the atmosphere.
7. Convective temperature (CONVTEMP) explains thesurface heating results in rising of parcel without anymechanical lift.
8. The shape factor (SF) explains the vertical gradientof equivalent potential temperature θe to examine theseverity of atmospheric instability.
Figure 10. Composite profiles of mean of nine thunderstorm cases along with standard deviations(blue line) considered for independent verification along with superposed epoch analysis (red line) ofeight instability parameters.
MADHULATHA ET AL.: THUNDERSTORM NOWCASTING USING RADIOMETER
11
[39] Acknowledgments. We are grateful to A. Jayaraman, Director,NARL, for his kind support and encouragement for this study. We thankRandolph Ware, Radiometrics Corporation, Boulder, Colorado, for hisvaluable suggestions and guidance during the present study. We arealso grateful to three anonymous reviewers for their critical and usefulcomments and suggestions, which helped us to improve the quality ofthis paper.
ReferencesBeebe, R. G. (1958), Tornado proximity soundings, Bull. Am. Meteorol.Soc., 39, 195–201.
Betts, K. A. (1974), Thermodynamic classification of tropical convectivesoundings, Mon. Weather Rev., 102, 760–764.
Bluestien, H. B., and S. Parker (1993), Modes of isolated convectivestorm formation along the dryline, Mon. Weather Rev., 121,1354–1372.
Brooks, H. E., C. A. Doswell III, and R. B. Wilhelmson (1994), The role ofmidtropospheric winds in the evolution and maintenance of low-levelmesocyclones, Mon. Weather Rev., 122, 126–136.
Browning, K. A. (1980), Local weather forecasting, Proc. R. Soc. London,Ser. A., 371, 179–211.
Cady-Pereria, E. K., M. W. Shephard, D. D. Turner, E. J. Mlawer, S. A.Clough, and T. J. Wagner (2008), Improved daytime column-integratedprecipitable water vapor from Vaisala radiosonde humidity sensors, J.Atmos. Oceanic Technol., 25, 873–883.
Carlson, S., G. Benjamin, G. S. Forbes, and Y. F. Li (1983), Elevated mixedlayer in the severe-storm environment conceptual model and case studies,Mon. Weather Rev., 111, 1453–1473.
Chan, P. W. (2009), Performance and application of a multi-wavelength,ground based microwave radiometer in intense convective weather,Meteorol. Z., 18(3), 253–265.
Chan, P. W., and K. K. Hon (2011), Application of ground-based, multi-channel microwave radiometer in the nowcasting of intense convectiveweather through instability indices of the atmosphere, Meteorol. Z., 20(4), 431–440.
Chan, P. W., and Y. F. Lee (2011), Application of a ground-based, multi-channel microwave radiometer to the alerting of low-level windshear atan airport, Meteorol. Z., 20(4), 423–429.
Clifford, S. F., J. C. Kaimal, R. J. Lataitis, and R. G. Strauch (1994),Ground-based remote profiling in atmospheric studies, An overview,Proc. IEEE, 82, 313–355.
Colby, F. P. (1984), Convective inhibition as a predictor of convectionduring AVE-SESAME II, Mon. Weather Rev., 112, 2239–2252.
Dupilka, M. L., and G. W. Reuter (2005), Forecasting tornadic thunder-storm potential in Alberta using environmental sounding data. Part II:Helicity, precipitable water, and storm convergence, Weather Forecast.,21, 336–346.
Feltz,W. F., and J. R.Mecikalski (2002),Monitoring high-temporal-resolutionconvective stability indices using the ground-based Atmospheric EmittedRadiance Interferometer (AERI) during the 3 May 1999 Oklahoma–Kansastornado outbreak,Weather Forecast., 17, 445–455.
Feltz, W. F., W. L. Smith, H. B. Howell, R. O. Knuteson, H. Woolf, and H.Revercomb (2003), Near-continuous profiling of temperature, moisture,and atmospheric stability using the Atmospheric Emitted Radiance Inter-ferometer (AERI), J. Appl. Meteorol., 42, 584–597.
Galway, J. G. (1956), The lifted index as a predictor of latent instability,Bull. Amer. Meteor. Soc., 37, 528–529.
Geerts, B. (2001), Estimating downburst-related maximum surface windspeeds by means of proximity soundings in New South Wales, Australia,Weather Forecast., 16, 261–269.
George, J. J. (1960), Weather Forecasting for Aeronautics, pp. 407–415,Academic Press, New York.
Güldner, J., and D. Spänkuch (1999), Results of year-round remotely sensedintegrated water vapor by ground-based microwave radiometry, J. Appl.Meteorol., 38, 981–988.
Güldner, J., and D. Spänkuch (2001), Remote sensing of the thermody-namic state of the atmospheric boundary layer by ground-based micro-wave radiometry, J. Atmos. Oceanic Technol., 18, 925–933.
Haklander, A., and A. J. van Delden (2003), Thunderstorm predictorsand their forecast skill for the Netherlands, Atmos. Res., 67–68,273–299.
Hering, A. M., C. Morel, G. Galli, S. Sénési, P. Ambrosetti, and M.Boscacci (2004), Nowcasting thunderstorms in the alpine region usingradar based adaptive thresholding scheme, paper presented at 3rdEuropean Conf. Radar in Meteorology and Hydrology (ERAD), Visby,Sweden, 6–10 Sept. [Available at http://www.copernicus.org/erad/2004/online/ERAD04_P_206.pdf.]
Jacovides, C. P., and T. Yonetani (1990), An evaluation of stability indi-ces for thunderstorm prediction in greater Cyprus,Weather Forecast., 5,559–569.
Khalsa, S. J. S. (1989), Atmospheric stability over the tropical oceansderived from TIROS operational vertical sounder, J. Appl. Meteorol.,28, 1002–1009.
Kober, K., and A. Tafferner (2009), Tracking and nowcasting of convectivecells using remote sensing data from radar and satellite, Meteorol. Z., 1,75–84.
Koffi, E. (2007), The use of radiometer derived convective indices inthunderstorm nowcasting, Res. Rep. 2007-02-MW, 31 pp., Inst. of Appl.Phys., Univ. of Bern, Bern.
Knupp, K., R. Ware, D. Cimni, F. Vandenberghe, J. Vivekanandan, E.Westwater, and T. Coleman (2009), Ground-based passive microwaveprofiling during dynamic weather conditions, J. Atmos. Oceanic Technol.,26, 1057–1072.
Lambert, W. C., M. Wheeler, and W. Roeder (2005), Objective lightningforecasting at Kennedy Space Center and Cape Canaveral Air ForceStation using cloud-to-ground lightning surveillance system data, paperpresented at Conference on Meteorological Applications of LightningData, Am. Meteorol. Soc., San Diego, Calif.
Lee, O. S. M. (2007), Forecast of strong gusts associated with thunder-storms based on data from radiosonde ascents and automatic weatherstations [in Chinese], paper presented at 21st Guangdong–HongKong–Macao Technical Seminar onMeteorological Science and Technology,Hong Kong, 24–26 Jan.
Litynska, Z., J. Parfiniewicz, and H. Pinkowski (1976), The prediction of airmass thunderstorms and hails, W. M. O. Bull., 450, 128–130.
Manzato, A. (2003), A climatology of instability indices derived from FriuliVenezia Giulia soundings, using three different methods, Atmos. Res.,67–68, 417–454.
Marinaki, A., M. Spliiotopolous, and H. Michalopoulou (2006), Evaluationof atmospheric instability indices in Greece, Adv. Geosci., 7, 131–135.
McCann, D. W. (1994), WINDEX—A new index for forecasting micro-burst potential, Weather Forecast., 9, 532–541.
Miller, R. C. (1967), Notes on analysis and severe storm forecasting proce-dures of the Military Weather Warning Center. Tech. Report 200, AWS,USAF. [Headquarters, AWS, Scott AFB, 1L 62225].
Murphy, M. J., R. L. Holle, and N. W. S. Demetriades (2008), Cloud-to-ground lightning warnings using electric field mill and lightning observa-tions, paper presented at the 19th International Lightning DetectionConference, Vaisala, Inc., Tucson, Ariz.
Nath, D., M. Venkat Ratnam, V. V. M. Jagannadha Rao, B. V. KrishnaMurthy, and S. Vijaya Bhaskara Rao (2009), Gravity wave characteris-tics observed over a tropical station using high-resolution GPS radio-sonde soundings, J. Geophys. Res., 114, D06117, doi:10.1029/2008JD011056.
Peppler, R. A., and P. J. Lamb (1989), Tropospheric static stability and cen-tral north American growing season rainfall, Mon. Weather. Rev., 117,1156–1180.
Rajeevan, M., A. Kesarkar, S. B. Thampi, T. N. Rao, B. Radhakrishna, andM. Rajasekhar, (2010), Sensitivity of WRF cloud microphysics to simula-tions of a severe thunderstorm event over southeast India, Ann. Geophys.,28, 603–619.
Rajeevan, M., A. Madhulatha, M. Rajasekhar, J. Bhate, A. Kesarkar and B.V. Apparao (2012), Development of a perfect prognosis probabilisticmodel for prediction of lightning over south-east India, J. Earth Syst.Sci., 121, 355–371.
Reap, R. M. (1994), 4–h NGM based probability and categorical forecastsof thunderstorms and severe local storms for the contiguous U.S., NWSTech. Proc. Bull. 419, 14 pp., Natl. Weather Serv., Silver Spring, Md.
Rose, T., and H. Czekala (2003), Filter bank radiometers for atmosphericprofiling, paper presented at Sixth International Symposium on Tropo-spheric Profiling: Needs and Technologies. Meckenhiem, Germany.
Sanders, F. (1986), Temperatures of air parcels lifted from the surface: Back-ground, application, and monograms,Weather Forecast., 1, 190–205.
Sanders, F., and D. O. Blanchard (1993), The origin of a severe thunder-storm in Kansas on 10 May 1985, Mon. Weather Rev., 121, 133–149.
Shafer, P. E., and H. E. Fuelberg (2006), A statistical procedure to forecastwarm season lightning over portions of the Florida peninsula, WeatherForecast., 21, 851–868.
Solot, B. (1938), Computation of depth of precipitable water in a column ofair, Mon. Weather Rev., 67, 100–103.
Tuduri, I. E., and C. Ramis (1997), The environments of significant convectiveevents in the western Mediterranean, Weather Forecast., 12, 294–306.
Walker, I., V. Chakrapani, and W. El Mahboub (2008), The development ofa shape factor instability index to guide severe weather forecasts foraviation safety, Meteorol. Appl., 15, 465–473.
Ware, R., R. Carpenter, J. Guldner, J. Liljegren, T. Nehrkorn, F. Solheim,and F. Vandenberghe (2003), A multichannel radiometric profiler of
MADHULATHA ET AL.: THUNDERSTORM NOWCASTING USING RADIOMETER
12
temperature, humidity, and cloud liquid, Radio Sci., 44(3), 8079,doi:10.1029/2002RS002856.
Westwater, E. R., B. Stankov, D. Cimini, Y. Han, J. A. Shaw, B.M. Lesht, andC. N. Long (2003), Radiosonde humidity soundings and microwave radio-meters during Nauru99, J. Atmos. Oceanic Technol., 20(7), 953–971.
Wilczak, J. M., E. E. Gossard, W. D. Neff, and W. L. Eebrehard (1996),Ground based remote sensing of the atmospheric boundary layer: 25 yearsof progress, Boundary Layer Meteorol., 71, 277–296.
Wilson, J. W., and C. K. Mueller (1993), Nowcasts of thunderstorm initial-ization and evolution, Weather Forecast., 8, 113–131.
Wilson, J. W., N. A. Crook, C. K. Mueller, J. Sun, and M. Dixon (1998),Nowcasting thunderstorms: A status report, Bull. Am. Meteorol. Soc.,79, 2079–2099.
Won, H. Y. (2009), An application of brightness temperature received froma ground-based microwave radiometer to estimation of precipitationoccurrences and rainfall intensity, J. Atmos. Sci., 45, 55–69.
MADHULATHA ET AL.: THUNDERSTORM NOWCASTING USING RADIOMETER
13