nowcasting of convective cells over italian peninsula - core · nowcasting of convective cells over...
TRANSCRIPT

Nowcasting of convective cells over Italian Peninsula
C. M. Medaglia, C. Adamo, M. Formenton, F. Piccolo
To cite this version:
C. M. Medaglia, C. Adamo, M. Formenton, F. Piccolo. Nowcasting of convective cells overItalian Peninsula. Advances in Geosciences, European Geosciences Union, 2005, 2, pp.173-176.<hal-00296869>
HAL Id: hal-00296869
https://hal.archives-ouvertes.fr/hal-00296869
Submitted on 30 May 2005
HAL is a multi-disciplinary open accessarchive for the deposit and dissemination of sci-entific research documents, whether they are pub-lished or not. The documents may come fromteaching and research institutions in France orabroad, or from public or private research centers.
L’archive ouverte pluridisciplinaire HAL, estdestinee au depot et a la diffusion de documentsscientifiques de niveau recherche, publies ou non,emanant des etablissements d’enseignement et derecherche francais ou etrangers, des laboratoirespublics ou prives.

Advances in Geosciences, 2, 173–176, 2005SRef-ID: 1680-7359/adgeo/2005-2-173European Geosciences Union© 2005 Author(s). This work is licensedunder a Creative Commons License.
Advances inGeosciences
Nowcasting of convective cells over Italian Peninsula
C. M. Medaglia, C. Adamo, M. Formenton, and F. Piccolo
Istituto di Scienze dell’Atmosfera e del Clima (ISAC-CNR Roma), Via Fosso del Cavaliere 100, 00133 Roma, Italy
Received: 10 December 2004 – Revised: 18 April 2005 – Accepted: 18 April 2005 – Published: 30 May 2005
Abstract. The aim of the study is the individuation of con-vective cells over the Italian peninsula with the conjunctionuse of geostationary satellite data (METEOSAT, MSG satel-lite) in the IR and WV channels and lightning data.
We will use GCD (Global Convective Diagnostic) al-gorithm developed at Aviation Weather Centre (AWC) ofNOAA (National Oceanic and Atmospheric Administration).This algorithm is based on the idea that a deep convectivecloud will not have any significant moisture above it.
This technique works quite well at identifying active deepconvection and can be applied to all the world’s geostation-ary satellites. However it does not always agree with light-ning sensors. Low topped convection with lightning willbe missed. We will extend the capabilities of GCD usinglightning data. The new product will be validate over differ-ent cases in the central Italy using the C-band polarimetricradar of ISAC-CNR (Institute of Atmospheric Sciences andClimate-of the Italian National Research Council) Rome.
1 Introduction
The convective parts of the thunderstorms are for many rea-sons the most difficult to forecast, to reproduce in mesoscalemodels and even the most difficult to identify.
However, these active convective areas, representing themost dangerous part of the storms, are the most important.Thunderstorm detection is required for a large number of ap-plications ranging from global climate studies to meteoro-logical purposes, from civil protection aims to aircraft oper-ations.
Mosher (2001) has proposed using the difference betweenthe 6.7 micron water vapor (WV) and the 11 micron IR chan-nels to identify deep convection and to monitor global con-vection since these two channels are available on the geo-stationary weather satellites. This technique, herein called
Correspondence to:C. M. Medaglia([email protected])
GCD, originally, has been developed in the AWC-NOAA forgenerating High Level Significant Weather forecasts cover-ing 2/3 of the globe which include areas of deep convectiveactivity that will affect aircraft, however, in our aims, thisalgorithm will be used for meteorological issues.
2 Algorithm physical basis
The physical concept behind the GCD algorithm is that thun-derstorms lift WV and cloud particles to the top of the tropo-sphere. Where there is active uplift to the top of the tropo-sphere, the ir and wv channels of geostationary satellite sen-sors will have the same temperature. The wind at the thun-derstorm top will transport the cloud ice particles and WVdown wind. As the cloud ice particles advect away from thethunderstorm, they will gradually fall because of their mass.WV will also advect away from the thunderstorm, but willnot fall. hence in the cirrus clouds down wind of the thun-derstorm, there should be a slight temperature difference be-tween the IR temperature of the cloud particles and the WVchannel temperature of the WV. The current algorithm elimi-nates areas where the IR channel is at least 1◦C warmer thanthe WV channel (Mosher, 2001).
First the algorithm was modified to take the differencesbetween the channels in the original satellite image projec-tions, and then to remap and composite the differences into aglobal composite (Martin et al., 2005).
3 Preliminary results over Mediterranean Region
The GCD algorithm has been applied over italian peninsula.We noted (Mosher, personal communications) that over italythe method is not working as well as it was doing over us ter-ritory. GCD algorithm shows some problem over italy and inparticular over complex orography region. So that the mainaims of this work are the understanding of the algorithm per-formances over italy and then the improvement of its capa-bility.
174 C. M. Medaglia et al.: Nowcasting of convective cells over Italian Peninsula
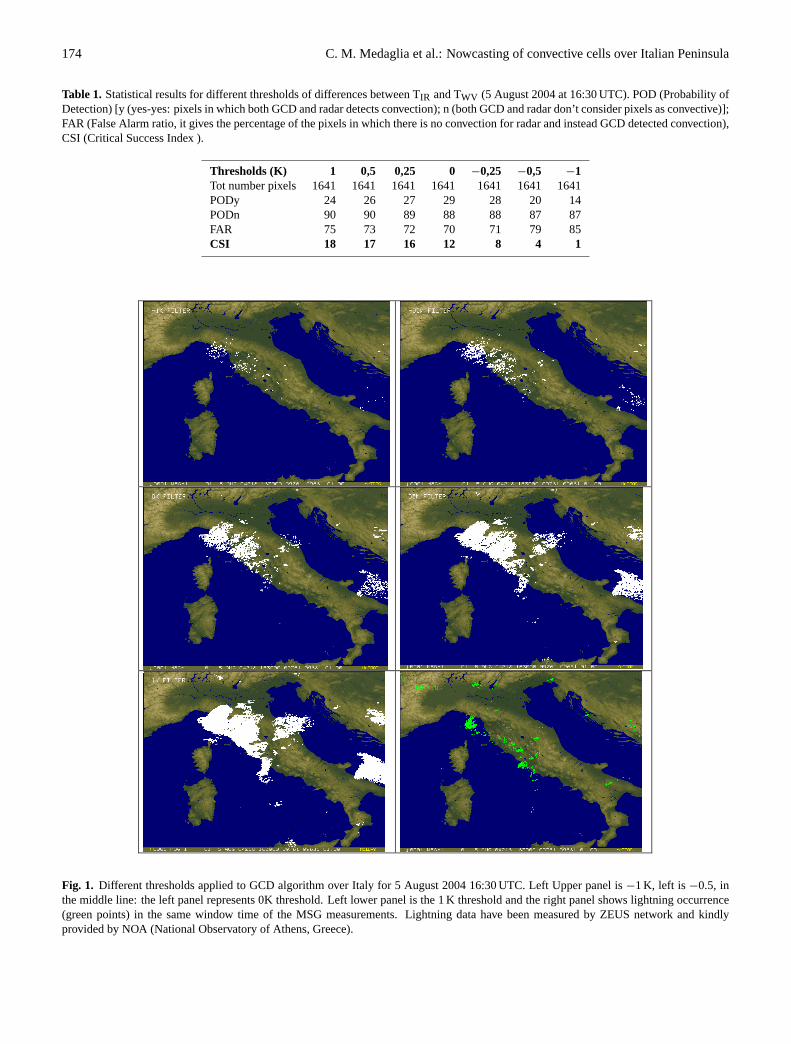
Table 1. Statistical results for different thresholds of differences between TIR and TWV (5 August 2004 at 16:30 UTC). POD (Probability ofDetection) [y (yes-yes: pixels in which both GCD and radar detects convection); n (both GCD and radar don’t consider pixels as convective)];FAR (False Alarm ratio, it gives the percentage of the pixels in which there is no convection for radar and instead GCD detected convection),CSI (Critical Success Index ).
Thresholds (K) 1 0,5 0,25 0 −0,25 −0,5 −1Tot number pixels 1641 1641 1641 1641 1641 1641 1641PODy 24 26 27 29 28 20 14PODn 90 90 89 88 88 87 87FAR 75 73 72 70 71 79 85CSI 18 17 16 12 8 4 1
Fig. 1 Different thresholds applied to GCD algorithm over Italy for 5 August 2004 16:30 UTC. Left Upper panel is –1 K, left is –0.5, in the middle line: the left panel represents 0K threshold.
Left lower panel is the 1 K threshold and the right panel shows lightning occurrence (green points) in the same window time of the MSG measurements. Lightning data have been measured
by ZEUS network and kindly provided by NOA (National Observatory of Athens, Greece).
For this analysis, the original method has been applied to many radar volumes at any given 15th minutes, between 16 and 18 UTC for the selected study. The results are similar to the showed case but more robust. The next step is the improvement of the
Fig. 1. Different thresholds applied to GCD algorithm over Italy for 5 August 2004 16:30 UTC. Left Upper panel is−1 K, left is −0.5, inthe middle line: the left panel represents 0K threshold. Left lower panel is the 1 K threshold and the right panel shows lightning occurrence(green points) in the same window time of the MSG measurements. Lightning data have been measured by ZEUS network and kindlyprovided by NOA (National Observatory of Athens, Greece).
C. M. Medaglia et al.: Nowcasting of convective cells over Italian Peninsula 175
To focus on this topic, the thunderstorm occurred over ro-man area on the 5 and 6 August 2004 has been studied. theavailable data for this case are:
– MSG measurements,
– Lightning data by Zeus network,
– C-band radar reflectivity measurements acquired by theISAC-CNR Roma radar as validation dataset.
Figure 1 shows all the different pixels in which the algo-rithm recognizes the convection as a result of the differencesbetween brightness temperatures in the MSG IR (TIR) andWV (TWV) channels. The different maps are referred to val-ues of the Tir–TWV are respectively−1, −0.5, 0, 0.25, 0.5,1 K.
Radar data are considered ground true. In particular wehave chosen VMI (Vertical maximum Intensity of Reflectiv-ity) parameter for individuating convective cells. Becausethe definition of convection is not so well established, weadopted 35 DBz bottom threshold for considering the radarpixel a convective one. In order to validate the gcd perfor-mances we estimated the agreement between gcd estimationsand radar measurements via statistical success index. Wehave performed for the area covered by the ISAC-CNR radarthat cover the 250×250 km region around Rome.
The statistical analysis for the comparison between GCDand radar (Table 1) shows that the Critical Index of Success(CSI) is around 18% for the highest threshold and goes downwith the threshold value. Probability of detection for the no-event (PODn) is always very high, the detection convectivepixels (PODy) is roughly between 20 and 29%, and the falsealarm ratio (FAR) is from 70 up to 85%. Considering thepositive thresholds, we reach always a CSI index greater than10. This results can be compared with the results obtained byMartin et al. (2005) validating GCD over pacific and atlanticoceans using goes data in many different meteorological sit-uations. They used as validation the data measured by thePrecipitation Radar (PR) aboard of TRMM (Tropical Rain-fall Measurements Mission) satellite.
They found an agreement between GCD and radar lowerthan the one showed here (except for one case), even if it wasbetter than the performances obtained considering the bench-mark index (TIF lower than 215 K). Note that the study ofMartin et al. (2005) considered convective a PR pixel, wherethe height of the storm was greater than 10 km, the reflectiv-ity was greater than 17 DBz. This condition appears strongerthan the one we choose (VMI>35 DBz), however, for ge-ographical reason, the kind of storms considered are prettydifferent.
For this analysis, the original method has been appliedto many radar volumes at any given 15 min, between 16:00and 18:00 UTC for the selected study. The results are sim-ilar to the showed case but more robust. The next step isthe improvement of the algorithm for our issues and light-ning measurements appeared like a good candidate to do that.The strongly relationship between lightning and convection
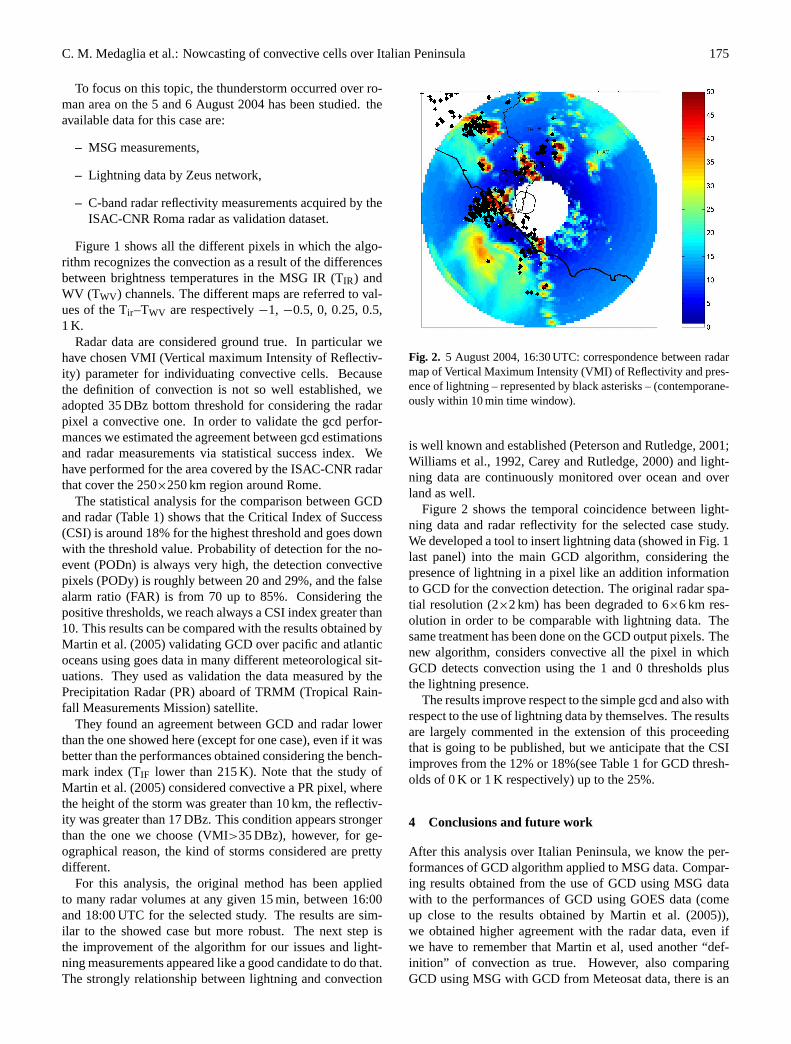
algorithm for our issues and lightning measurements appeared like a good candidate to do that. The strongly relationship between lightning and convection is well known and established (Peterson and Rutledge, 2001; Williams et al., 1992, Carey and Rutledge, 2000) and lightning data are continuously monitored over ocean and over land as well. Figure 2 shows the temporal coincidence between lightning data and radar reflectivity for the selected case study. We developed a tool to insert lightning data (showed in fig.1 last panel) into the main GCD algorithm, considering the presence of lightning in a pixel like an addition information to GCD for the convection detection. The original radar spatial resolution (2x2 km) has been degraded to 6x6 km2 resolution in order to be comparable with lightning data. The same treatment has been done on the GCD output pixels. The new algorithm, considers convective all the pixel in which GCD detects convection using the 1 and 0 thresholds plus the lightning presence.
Fig. 2 5th August 2004, 16:30 UTC: correspondence between radar map of Vertical Maximum Intensity (VMI) of Reflectivity and presence of lightning -represented by black asterisks-
(contemporaneously within 10 minutes time window).
The results improve respect to the simple GCD and also with respect to the use of lightning data by themselves. The results are largely commented in the extension of this proceeding that is going to be published, but we anticipate that the CSI improves from the 12% or 18%(see tab. 1 for GCD thresholds of 0 K or 1K respectively) up to the 25%.
4. CONCLUSIONS AND FUTURE WORK
After this analysis over Italian Peninsula, we know the performances of GCD algorithm applied to MSG data. Comparing results obtained from the use of GCD using MSG data with to the performances of GCD using GOES data (come up close to the results
Fig. 2. 5 August 2004, 16:30 UTC: correspondence between radarmap of Vertical Maximum Intensity (VMI) of Reflectivity and pres-ence of lightning – represented by black asterisks – (contemporane-ously within 10 min time window).
is well known and established (Peterson and Rutledge, 2001;Williams et al., 1992, Carey and Rutledge, 2000) and light-ning data are continuously monitored over ocean and overland as well.
Figure 2 shows the temporal coincidence between light-ning data and radar reflectivity for the selected case study.We developed a tool to insert lightning data (showed in Fig. 1last panel) into the main GCD algorithm, considering thepresence of lightning in a pixel like an addition informationto GCD for the convection detection. The original radar spa-tial resolution (2×2 km) has been degraded to 6×6 km res-olution in order to be comparable with lightning data. Thesame treatment has been done on the GCD output pixels. Thenew algorithm, considers convective all the pixel in whichGCD detects convection using the 1 and 0 thresholds plusthe lightning presence.
The results improve respect to the simple gcd and also withrespect to the use of lightning data by themselves. The resultsare largely commented in the extension of this proceedingthat is going to be published, but we anticipate that the CSIimproves from the 12% or 18%(see Table 1 for GCD thresh-olds of 0 K or 1 K respectively) up to the 25%.
4 Conclusions and future work
After this analysis over Italian Peninsula, we know the per-formances of GCD algorithm applied to MSG data. Compar-ing results obtained from the use of GCD using MSG datawith to the performances of GCD using GOES data (comeup close to the results obtained by Martin et al. (2005)),we obtained higher agreement with the radar data, even ifwe have to remember that Martin et al, used another “def-inition” of convection as true. However, also comparingGCD using MSG with GCD from Meteosat data, there is an

176 C. M. Medaglia et al.: Nowcasting of convective cells over Italian Peninsula
improvements of the performances, as we found previously(not showed).
As future work, we will improve the quality of the infor-mation obtained by lightning to better detect thunderstormconvection. In particular we are conducting two studies:one focuses on using lightning flash rate instead of lightningpresence, the other focuses on using a temporal dynamic ap-proach for both infrared and lightning data.
Acknowledgements.The Italian team has been funded by theItalian National Group for Prevention from Hydro-GeologicalDisasters (GNDCI). The authors wish to thank E. Defer (NOA-National Observatory of Athens) for providing lightning data;D. Martin and R. Kohrs (SSEC – Space Science and EngineeringCenter, Madison, WI) for their precious inputs and the usefulconversations on this topic; F. Mosher (Embry-Riddle AeronauticalUniversity, Daytona Beach, FL) for given us GCD algorithm.Finally we thank J. Weinman (Univ. of Washington, Seattle, WA)for his initial advances and help in this work.
Edited by: L. FerrarisReviewed by: anonymous referees
References
Carey, L. D. and Rutledge, S. A.: On the Relationship BetweenPrecipitation and Lightning in Tropical Island Convection: A C-band Polarimetric Radar Study, Monthly Weather Review, 128,2687–2710, 2000.
Martin, D. W., Mosher, F. R., Kohrs, R. A.: Over Ocean vali-dation of the global convective diagnostic, in: Preprints, 13thConference on Satellite Meteorology and Oceanography (20–24September 2004; Norfolk, VI), in press, 2005.
Mosher, F. R.: A satellite diagnostic of global convection,in: Preprints, 11th Conference on Satellite Meteorology andOceanography (15–19 October 2001; Madison, WI), 416–419,2001.
Peterson, W. A. and Rutledge, S. A.: Regional Variability in Trop-ical Convection: Observations from TRMM, J. Climate, 14,3566–3585, 2001.
Williams, E. R., Rutledge, S. A., Geotis, S. C., Renno, N., Ras-mussen, E., and Rickenbach, T.: A radar and electrical study oftropical hot towers, J. Atmos. Sci., 49, 1386–1395, 1992.