november , 2012 - · pdf filep.22 docomo’s competition ... 2012) p.33 ntt group...
TRANSCRIPT

Appendices November, 2012

Copyright (c) 2012 Nippon Telegraph and Telephone Corporation Appendices (November, 2012) Copyright (c) 2012 Nippon Telegraph and Telephone Corporation Appendices (November, 2012)
Table of Contents
‐1‐
IR Presentation P.2 Evolution Towards Becoming a Value Partner on the Next Stage in Inter-Service Era P.3 Changes in Earnings Structure P.4 NTT Group’s Global Business Development P.5 Doubling of Overseas Sales P.6 Spending Forecast P.7 Example of Big Data Use P.8 Reinforcement of Security Base ~Top Runner P.9 Increasing Corporate Value Overview of Consolidated Financial Results P.10 Trend in Consolidated Financial Results P.11 Transformation of Business Structure (Consolidated Revenue Composition Image) P.12 CAPEX Global Business P.13 Enterprise ICT Services in Global Market P.14 Overseas Sales Trend and M&A Development Fixed Communications Business P.15 Broadband Access Services in Japan P.16 Fixed Broadband Business P.17 Penetration of Video Services P.18 Profitability from FTTH services P.19 Measures to retain FLET’S Hikari Subscribers P.20 Core Network Migration
Mobile Communications Business P.21 Mobile Broadband Business P.22 DOCOMO’s Competition Strategies P.23 Market Share of Smartphone Sold P.24 Xi ”crossy” (LTE) Area Expansion Plans P.25 “docomo cloud” – 3 key directions P.26 Aggregate ARPU of Mobile Broadband Business Shareholder Returns P.27 Shareholder Returns P.28 Share Buy Backs Others P.29 Changes in Consolidated Operating Revenue P.30 Changes in Consolidated Operating Income P.31 Changes in Number of Employees P.32 Age Distribution of Employees at NTT East, NTT West and Outsourcing Companies” (As of March 31, 2012) P.33 NTT Group Overview
Copyright (c) 2012 Nippon Telegraph and Telephone Corporation Appendices (November, 2012) Copyright (c) 2012 Nippon Telegraph and Telephone Corporation Appendices (November, 2012)
Internet services Real-world services
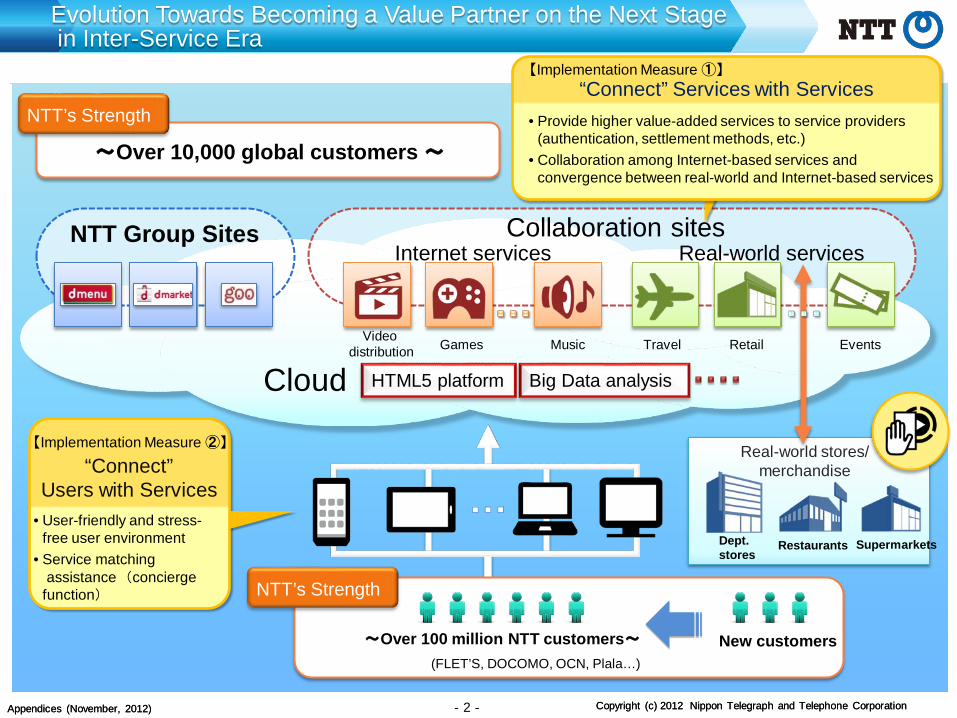
~Over 100 million NTT customers~
Real-world stores/ merchandise
Dept. stores
Restaurants Supermarkets
New customers (FLET’S, DOCOMO, OCN, Plala…)
Video distribution Games Music
HTML5 platform Big Data analysis Cloud Travel Retail Events
NTT Group Sites
• User-friendly and stress- free user environment
• Service matching assistance (concierge function)
【Implementation Measure ②】
“Connect” Users with Services
~Over 10,000 global customers ~
NTT’s Strength
【Implementation Measure ①】 “Connect” Services with Services
• Provide higher value-added services to service providers (authentication, settlement methods, etc.)
• Collaboration among Internet-based services and convergence between real-world and Internet-based services
Evolution Towards Becoming a Value Partner on the Next Stage in Inter-Service Era
NTT’s Strength
Collaboration sites
‐2‐
Copyright (c) 2012 Nippon Telegraph and Telephone Corporation Appendices (November, 2012) Copyright (c) 2012 Nippon Telegraph and Telephone Corporation Appendices (November, 2012)
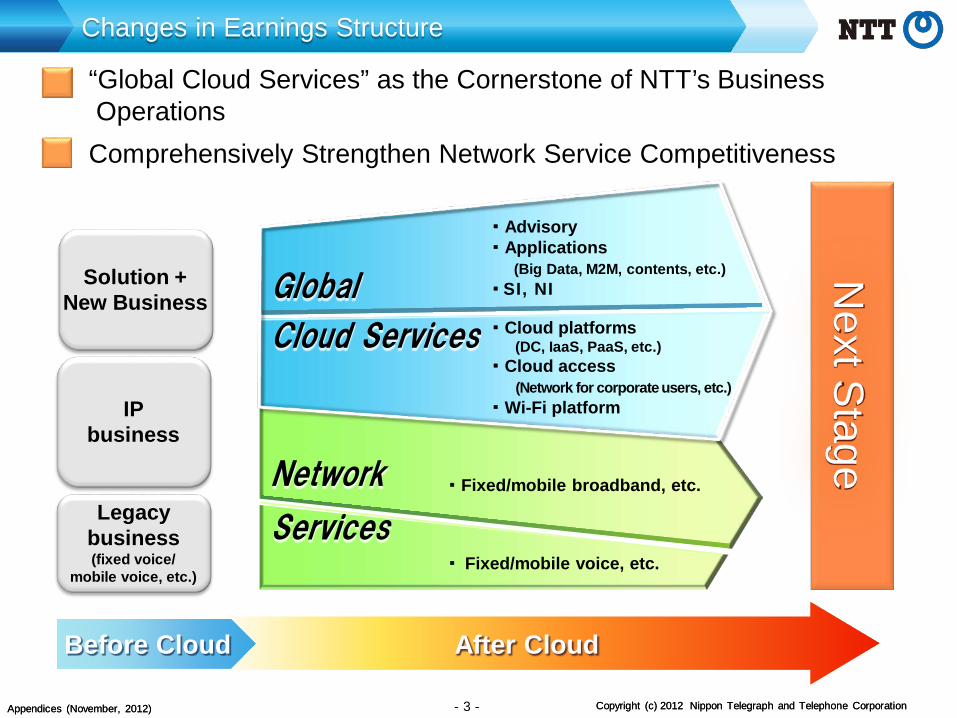
Changes in Earnings Structure
Before Cloud After Cloud
Legacy business (fixed voice/
mobile voice, etc.)
IP business
Solution + New Business
・ Fixed/mobile voice, etc.
・Fixed/mobile broadband, etc.
Next S
tage Comprehensively Strengthen Network Service Competitiveness
Global
Cloud Services
・Advisory ・Applications (Big Data, M2M, contents, etc.) ・SI, NI
・Cloud platforms (DC, IaaS, PaaS, etc.) ・Cloud access (Network for corporate users, etc.) ・Wi-Fi platform
Network
Services
“Global Cloud Services” as the Cornerstone of NTT’s Business Operations
‐3‐
Copyright (c) 2012 Nippon Telegraph and Telephone Corporation Appendices (November, 2012) Copyright (c) 2012 Nippon Telegraph and Telephone Corporation Appendices (November, 2012)
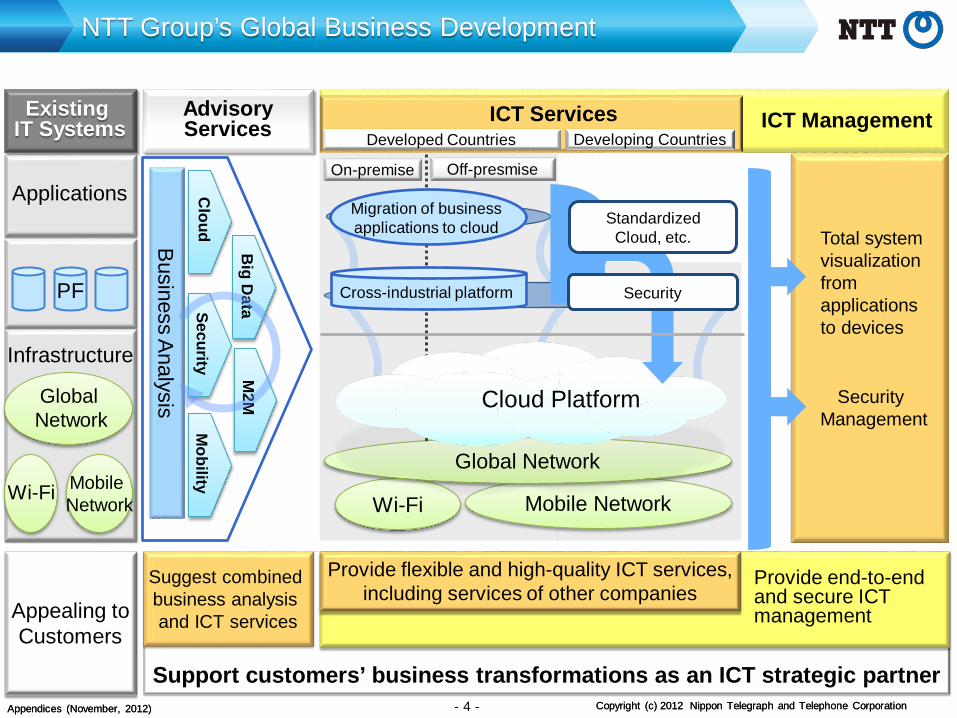
NTT Group’s Global Business Development
Security
Applications
Mobile Network Wi-Fi
Infrastructure
Global Network
Suggest combined business analysis and ICT services
Business A
nalysis
Cloud
Mobility
Big D
ata M
2M
Mobile Network Wi-Fi
Global Network
On-premise Off-presmise
Developed Countries ICT Services
Developing Countries
Advisory Services
Total system visualization from applications to devices
Appealing to Customers
Support customers’ business transformations as an ICT strategic partner
Provide end-to-end and secure ICT management
Provide flexible and high-quality ICT services, including services of other companies
ICT Management
Security Management
Existing IT Systems
Cloud Platform
PF
Migration of business applications to cloud Standardized
Cloud, etc.
Security Cross-industrial platform
‐4‐

Copyright (c) 2012 Nippon Telegraph and Telephone Corporation Appendices (November, 2012) Copyright (c) 2012 Nippon Telegraph and Telephone Corporation Appendices (November, 2012)
Doubling of Overseas Sales
Double overseas sales by the fiscal year ending March 31, 2017
Fiscal year ending March 31, 2017
Fiscal year ended March 31, 2008
Fiscal year ended March 31, 2012
Reached $10 billion one year
ahead of schedule
$2 billion
Attain at least 50% of corporate sales from overseas sales
Exceeded $10 billion
Onward to $20 billion
Aiming to double earnings
‐5‐

Copyright (c) 2012 Nippon Telegraph and Telephone Corporation Appendices (November, 2012) Copyright (c) 2012 Nippon Telegraph and Telephone Corporation Appendices (November, 2012)
$1,800 billion
2011
$1,440 billion
IT Spending Forecast
19
10
20
95 114
30
245
125 380 235
1,420 1,195
Developing Countries
$360 billion
(83%)
(17%)
(65%) (35%)
(79%)
(21%)
2016 Growth 2011-2016
Developed Countries
(E)
※ IT Spending : Software, Hardware, IT Services ※ Developing Countries : Latin America, Emerging Asia/Pacific, Greater China, Eastern Europe, Eurasia, MEA ※ Developed Countries : North America, Western Europe, Mature APAC
SOURCE: Gartner
‐6‐
Copyright (c) 2012 Nippon Telegraph and Telephone Corporation Appendices (November, 2012) Copyright (c) 2012 Nippon Telegraph and Telephone Corporation Appendices (November, 2012)
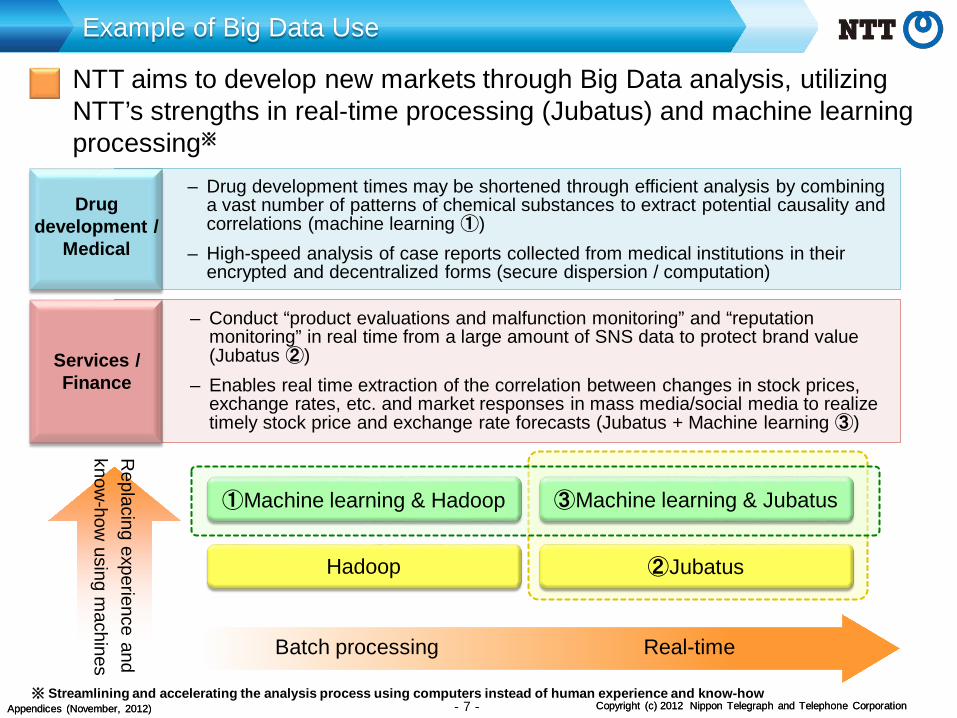
Example of Big Data Use
③Machine learning & Jubatus ①Machine learning & Hadoop
Real-time
– Drug development times may be shortened through efficient analysis by combining a vast number of patterns of chemical substances to extract potential causality and correlations (machine learning ①)
– High-speed analysis of case reports collected from medical institutions in their encrypted and decentralized forms (secure dispersion / computation)
– Conduct “product evaluations and malfunction monitoring” and “reputation monitoring” in real time from a large amount of SNS data to protect brand value (Jubatus ②)
– Enables real time extraction of the correlation between changes in stock prices, exchange rates, etc. and market responses in mass media/social media to realize timely stock price and exchange rate forecasts (Jubatus + Machine learning ③)
Replacing experience and
know-how
using machines
Batch processing
※ Streamlining and accelerating the analysis process using computers instead of human experience and know-how
NTT aims to develop new markets through Big Data analysis, utilizing NTT’s strengths in real-time processing (Jubatus) and machine learning processing※
Services / Finance
Drug development /
Medical
Hadoop ②Jubatus
‐7‐

Copyright (c) 2012 Nippon Telegraph and Telephone Corporation Appendices (November, 2012) Copyright (c) 2012 Nippon Telegraph and Telephone Corporation Appendices (November, 2012)
Enhancement of Security Platform ~Top Runner NTT’s Secure Computation Technology ranks among the highest level in the world,* which is highly competitive in expanding our “Global Cloud Service”. NTT has succeeded in putting it to practical use for medical statistical analysis for the first time in the world.
‐8‐
Original (Data File)
?
?
?
computing request
Secret sharing (data saved in separate servers)
output result
save
draw
Restoration of original file
Secret Sharing Technology
Use of Data (Statistic Computing, etc)
Secure Computation Technology
Cloud
Enables to encrypting data (dividing into some meaningless data sets) and stores them in separate servers among the cloud.
Enables computation of secretly shared data without decryption.
* World’s No.1 sorting and multiplication capability
Enables statistical analyses without decryption

Copyright (c) 2012 Nippon Telegraph and Telephone Corporation Appendices (November, 2012) Copyright (c) 2012 Nippon Telegraph and Telephone Corporation Appendices (November, 2012)
EPS
Fiscal year ending March 31, 2016
Fiscal year ending March 31, 2015
EPS
Increasing Corporate Value
Fiscal year ended March 31, 2012
Share Buybacks
Cost reductions of at least
400 billion yen (fixed-line/mobile access networks)
Capex to Sales 15%
‐9‐

Copyright (c) 2012 Nippon Telegraph and Telephone Corporation Appendices (November, 2012) Appendices (November, 2012)
1.30
1.11 1.12
2008/3 2009/3 2010/3 2011/3 2012/3 2013/3E
1.21
0.51
0.49
0.54 0.64
1.22
0.47
10.4 10.2 10.3
10.7 10.5
385 372 400
461
367
*
1.20
10.8
0.53
437
1.41
1.25 1.22
1.48
1.27 1.24
Creating steady operating income and operating free cash flow
‐10‐
Trend in Consolidated Financial Results
■ Operating Revenues (Trillion yen)
■ Operating Income (Trillion yen)
■ Net Income (Trillion yen)
■ EPS (yen)
■ Operating FCF (Trillion yen)
Fiscal year ended/ing March 31
* Includes special factors such as the gain on the transfer of substitutional portion of the Employee Pension Fund. (Note) Due to the January 2009 stock split of one share of common stock into 100 shares, figures for 2008/3 have been retroactively adjusted.

Copyright (c) 2012 Nippon Telegraph and Telephone Corporation Appendices (November, 2012) Appendices (November, 2012)
Transformed from legacy-oriented business to IP, solution and new business field
:Solution & New Business, etc. :IP Business :Legacy Business
75%
IP, solution & new business account for
three-quarters
58% 61% 65% 70%
52%
‐11‐
Transformation of Business Structure (Consolidated Revenue Composition Image)
Fiscal year ended/ing March 31

Copyright (c) 2012 Nippon Telegraph and Telephone Corporation Appendices (November, 2012) Appendices (November, 2012)
Capex to Sales is substantially decreasing
823.5 847.3 846.0 779.6 784.2 750.0
758.7 737.6 686.5 668.5 726.8 749.0
546.7 560.2 454.6
422.0 435.6 451.0
19.9%20.6%
19.5%
18.1% 18.5%18.0%
0.0%
5.0%
10.0%
15.0%
20.0%
0
500
1,000
1,500
2,000
2,500
2008/3 2009/3 2010/3 2011/3 2012/3 2013/3E
(Billions of yen)
2,128.9 2,145.1
1,987.1
1,870.1
CAPEX / Sales
1,946.6
NTT EAST +
NTT WEST
NTT DOCOMO
Others
1,950.0
‐12‐
CAPEX
Fiscal year ended/ing March 31
Copyright (c) 2012 Nippon Telegraph and Telephone Corporation Appendices (November, 2012) Appendices (November, 2012)
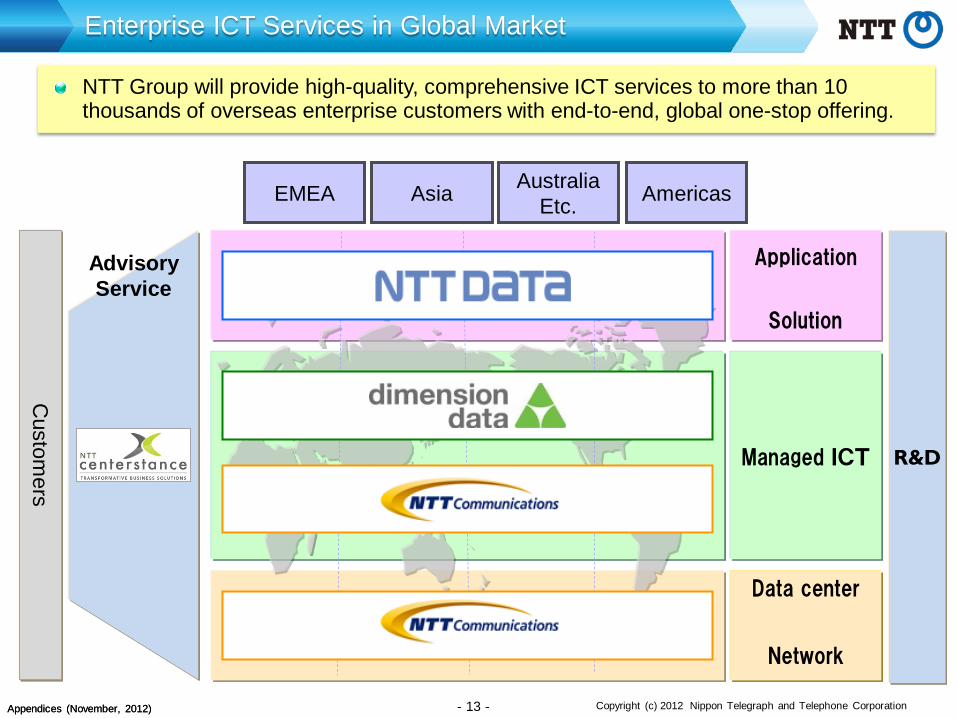
NTT Group will provide high-quality, comprehensive ICT services to more than 10 thousands of overseas enterprise customers with end-to-end, global one-stop offering.
Asia Australia Etc. Americas EMEA
‐13‐
Custom
ers
Advisory Service
Enterprise ICT Services in Global Market
Data center
Managed ICT
Solution
Network
Application
R&D

Copyright (c) 2012 Nippon Telegraph and Telephone Corporation Appendices (November, 2012) Appendices (November, 2012)
13.0 Billion USD
2008/3 2009/3 2010/3 2012/3 2011/3
2007.12
2008.10
2009.10
2010.10
2010.12
2011.6 2010.7
2.0 Billion USD
2.6 Billion USD
2.9 Billion USD
4.8
Billion USD
11.6 Billion USD
2013/3E
‐14‐
2012.11
Overseas Sales Trend and M&A Development
(Note) Dates that the companies became subsidiaries of NTT (Fiscal year ended/ing March 31)

Copyright (c) 2012 Nippon Telegraph and Telephone Corporation Appendices (November, 2012) Appendices (November, 2012) ‐15‐
Mobile etc.
Public Wi-Fi
Fixed Mobile
~54Mbps ~75Mbps ~160Mbps ~1Gbps ~50Mbps
~ ~ ~ ~
CATV
Broadband Access Services in Japan
(Note1) Access speeds shown are numbers used for commercial purposes, and are the maximum output speeds achievable within the framework of the respective best effort services. (Note2) Mobile etc. includes subscriptions of data communications services plan, and those of WiMAX.
(Source)Fixed accesses are MIC data, Mobile etc. is TCA data. (Some figures are based on financial results materials of the companies.) (As of the end of June 2012)
Access speed
DSL
FTTH
※including NTTDOCOMO LTE subs approx. 3.3M
NTT market share Approx.35%
NTT market share Approx.74%
NTT market share Approx.45%
Approx. 22.8M subs
Approx. 6.3M subs
Approx. 132.9M subs
Approx. 6.0M subs

Copyright (c) 2012 Nippon Telegraph and Telephone Corporation Appendices (November, 2012) Appendices (November, 2012)
IP related revenues have largely grown with the increase in FTTH subscriptions ARPU has increased with the expansion of optional service (i.e. Hikari Denwa, Remote support service)
‐16‐
Fixed Broadband Business
1,024.3
2,897.2 2,832.0 2,785.4 2,777.9 2,707.6 2,683.0 (Change year-on-year) (-65.1) (-46.6) (-7.4) (-70.3) (-24.6)
Voice Revenues
1,171.0 1,300.6
2,048.6
1,807.6
1,471.3
1,614.3
2008/3 2009/3 2010/3 2011/3 2013/3E
8,777
13,251
11,134
15,059
16,564
4,260 4,290 4,310
4,290 4,320 4,310
1,330 1,460 1,580
1,320 1,450 1,570 5,310 5,580 5,740 5,880
5,460 5,620 5,780 5,890
4,280
4,280
1,650
1,620
5,900
5,930
0.59
0.86
11/3 12/3
0.27
10.14
77% 80%
84%
10/3
848.5
IP-related Revenues
1,406.9
1,306.5
17,864
2012/3
1,523.0
1,160.0
4,170
1,690
5,860
4,110
1,690
5,800
13/3E
12.11
13.90
11/3 12/3 10/3 13/3E 11/3 12/3 10/3 13/3E
3.34
2.13
4.30
2008/3 2009/3 2010/3 2011/3 2012/3 2013/3E
15.40 1.04
86%
5.00
Voice and IP-related Revenues (Sum of NTT East and NTT West) ARPU (Yen)
NTT East
NTT West
Basic Rate Additional Services
(Fiscal year ended/ing
March 31)
<FLET’S TV> <Hikari Denwa>
Million subscriptions
<Remote Support> Percentage of FTTH users Million
subscriptions
500 yen/month~ 650 yen/month~ 500 yen/month~
Million channels
(Fiscal year ended/ing March 31)
FTTH Subscriptions (thousands)
(Billions of yen) Voice Revenues + IP-related Revenues

Copyright (c) 2012 Nippon Telegraph and Telephone Corporation Appendices (November, 2012) Appendices (November, 2012)
Number of Hikari TV + FLET’S TV subscriptions reached 2.87 million by end of Mar 2012. Steady growth can be expected continuously.
‐17‐
Penetration of Video Services
Service also available on smartphones and tablet PCs
Million subscriptions
0.24
0.55
1.01
Hikari TV
1.41
2.00
Hikari TV +
FLET’S TV
0.63
1.28
2.01
2.87
Tuner (STB)
TV
Smartphones, tablet PCs (Android,iPhone, iPad)
2008/3 2009/3 2010/3 2011/3 2012/3 2013/3E
2.55
3.59
(End of Year/month)
PC/NotePC
TV with Built-in tuner
Car Navigation

Copyright (c) 2012 Nippon Telegraph and Telephone Corporation Appendices (November, 2012) Appendices (November, 2012)
Achieved profitability from FTTH services on a single-year basis in 2012/3
‐18‐
(Note) 2009/3 : Figures of designated telecommunications services except specified telecommunications services 2010/3 and thereafter : Figures of designated telecommunications services (FTTH access and other services) except specified telecommunications services.
Profitability from FTTH services
2009/3
(154.2)
2010/3 2012/3
(88.9)
-100.0 billion yen
-150.0 billion yen
2011/3
(17.4)
+41.7
-50.0 billion yen
+50.0 billion yen
Fiscal Year ended March 31
Improved by 65.3 billion yen
Improved by 71.5 billion yen
Improved by 59.1 billion yen
Profitability from FTTH services

Copyright (c) 2012 Nippon Telegraph and Telephone Corporation Appendices (November, 2012) Appendices (November, 2012)
Measures to retain FLET’S Hikari Subscribers
Launch of “FLET’S Hikari LIGHT”, a two-tiered flat-rate charging system (Jun 2011: NTT East , Jan 2012: NTT West 2012)
■ Retention & acquisition of light users by pay-as-you-go
■ Promotion of long-term usage by discount menus Launch of “Ninen-wari”, a discount service with condition of continuous usage for 2 years
(Mar 2012: NTT East) ⇒ Together with points from “FLET’S Hikari Members Club”, price is reduced to ADSL price level
■ Acquisition of smartphone & tablet users
Launch of “FLET’S Hikari Wifi Access”, a Wireless LAN access service for small-sized multi-dwelling unit apartments (Nov 2012: NTT East)
■ Acquisition of separately-dwelling families and high-speed users
Launch of “Super high-speed type Hayabusa” (Cutting price of 1Gbps service) (Oct 2012: NTT West)
Launch of “Community Discount”, a discount service for registered group members (Oct 2012: NTT West)
Communication Amount per month
Monthly Charges
Cutting monthly charges of “FLET’S Hikari LIGHT Mansion Type” (Sep 2012: NTT East and West)
‐19‐

Copyright (c) 2012 Nippon Telegraph and Telephone Corporation Appendices (November, 2012) Appendices (November, 2012)
Core Network Migration
Networks consolidation will realize CAPEX optimization and maintenance cost reduction
■ IP Networks will be consolidated to NGN ・To be completed by Mar 2013
■ PSTN (subscribed telephone network) will be consolidated to NGN ・To be done approx. from 2020 to 2025 - User care is necessary for end-of-provision service - Coordination among inter-connected providers is necessary for smooth connection of IP networks
Regional IP Network NGN
PSTN NGN
PSTN NGN
NGN
IP Network Migration
PSTN Migration
IP Network
PSTN
‐20‐

Copyright (c) 2012 Nippon Telegraph and Telephone Corporation Appendices (November, 2012) Appendices (November, 2012)
Packet revenues are steadily growing due to the growth of packet flat-rate service subscribers Aiming further growth of packet revenues by strengthening smartphone sales
‐21‐
Mobile Broadband Business
Cellular Services Revenues (Voice +Packet )
4,019.0 3,661.3 3,499.5 3,407.4 3,424.9 3,492.0 (Change year-on-year) (-357.7) (-161.8) (-92.4) (+17.5) (+67.1)
2,645.1
Voice Revenues
2,149.6
1,910.5
Packet Revenues
1,589.0 1,511.7
1,694.9
2,016.0 1,712.2
1,238.0
36,290
1,373.9
31,920
17,790
12,810
25,770
Cellular Services Revenues (excluding“Monthly Support”))
1,541.9
1,843.9
41,300
2013/3E 2008/3 2009/3 2010/3 2011/3 2012/3
*Excluding “Monthly Support” 【The impact of “Monthly Support”】 -0.2 -39.2 -238.0 (2011/3) (2012/3) (2013/3E)
* * *
Smartphone Sales (Annual sales)
“Xi” LTE Subscriptions(Cumulative)
(Million units)
8.82
2.52
14.00 million
2013/3E 2011/3 2012/3
11/3 16/3E 12/3 13/3E
0.03 2.22
5.00
10.00
30.00
20.00
11.00
(Million Units)
Packet flat-rate service
subscriptions (thousands)
(Billions of yen)
(Fiscal year ended/ing March 31)
41.00 million
10.00
(End of year/month)
(End of year/month)
40.00
15.00
13.00 2013/3 Initial Plan
30.00 Target as of
2012/5
(Note) Packet flat-rate services include subscriptions to “Pake-hodai”, “Pake-hodai full”, “Pake-hodai double”, “Pake-hodai simple”, “Biz-hodai” services, flat-rate data plans and Xi data plans

Copyright (c) 2012 Nippon Telegraph and Telephone Corporation Appendices (November, 2012) Appendices (November, 2012)
DOCOMO will expand its Smartphone customer base by innovative approach, which is the source of competitiveness
‐22‐
DOCOMO’s Competition Strategies

Copyright (c) 2012 Nippon Telegraph and Telephone Corporation Appendices (November, 2012) Appendices (November, 2012)
DOCOMO’s market share of smartphones sold maintained higher than subscriber market share
55%49%50%
35%
53%45%
0%
20%
40%
60%
80%
100%
1Q 2Q 3Q 4Q 1Q 2Q
:DOCOMO
:Other Carriers
Fiscal year ended 2012/3
(Apr.2011~Mar.2012)
‐23‐
Market Share of Smartphone Sold
* Market share distribution among top 4 carriers in Japan offering devices carrying any of the 4 OSs (Android/iOS/WindowsMobile・WindowsPhone/BlackBerry) in the mobile phone category, based on survey of track record of sales at major mass retailers across Japan by GfK Japan (Tablet devices not included)
Fiscal year ending 2013/3
(Apr.2011~Mar.2012)

Copyright (c) 2012 Nippon Telegraph and Telephone Corporation Appendices (November, 2012) Appendices (November, 2012)
Population coverage : Approx. 30% at the end of Mar, 2012. Expand to approx. 75% by the end of Mar, 2013 Start providing 112.5 Mbps download service in limited areas within 2013/3
Xi ”crossy” (LTE) Area Expansion Plans
‐24‐

Copyright (c) 2012 Nippon Telegraph and Telephone Corporation Appendices (November, 2012) Appendices (November, 2012)
“Cutting-edge service development” is a new source of revenue
‐25‐
“docomo cloud” – 3 key directions

Copyright (c) 2012 Nippon Telegraph and Telephone Corporation Appendices (November, 2012) Appendices (November, 2012)
Aggregate ARPU of Mobile Broadband Business
Aim to expand “Smart ARPU” to
achieve sustainable growth of business
(Double in 2016/3 compared to 2012/3)
2012/3 2013/3 (Apr.~Mar.)
・Smart ARPU : Revenues from providing services that accompany our wireless services (revenues from content and cloud services, collection of charges, mobile phone insurance service, advertising and others) / No. of active subscriptions(*) (*) Sum of No. of active subscriptions for each month : ((No. of subscriptions at the end of previous month + No. of subscriptions at the end of current month) / 2) during the relevant period
‐26‐

Copyright (c) 2012 Nippon Telegraph and Telephone Corporation Appendices (November, 2012) Appendices (November, 2012)
Dividends per share have steadily increased by 1.8 times, from ¥90 (FY ended Mar 2008) to ¥160 (planned: FY ending Mar 2013) Resolved on share buy backs of 150 billion yen in total, by the end of FY ending Mar 2013. (Sep 19th, 2012)
90 110 120 120 140
160
23.0%27.5%
32.3% 31.2% 38.2% 36.6%
0%
25%
50%
0
100
200
2008/3 2009/3 2010/3 2011/3 2012/3 2013/3E
Dividend per share Pay-out ratio
94.4
200.0
381.7
150.0
0
100
200
300
400
2008/3 2009/3 2010/3 2011/3 2012/3 2013/3E
Dividend
(yen)
*
Share Buy backs
*
‐27‐
Shareholder Returns
Dividends per share
Pay-out ratio
*Excludes special factors such as the transfer of the substitutional portion of the Employee Pension Fund
(Billions of yen)
Fiscal year ended/ing March 31
*NTT may repurchase up to 42 million shares, or up to 150 billion yen, of its common stock by the end of the fiscal year ending March 31, 2013.
50.0 Status as of October 31, 2012
Up to
Approx.
Fiscal year ended/ing March 31

Copyright (c) 2012 Nippon Telegraph and Telephone Corporation Appendices (November, 2012) Appendices (November, 2012)
Excess Holdings
58mil shares <36%>
1,574 1,449 1,323
<37%>
Cancellation Buy back from Gov’t Cancellation Buy back
from Gov’t Buy Back from
market
Market floating shares
Portion bought
back from the market (Equivalent to 150 billion
yen)
793mil. shares 751mil shares
‐28‐
Share Buy Backs
Treasury Stocks <15.9%>
251mil. shares (*1)
Gov’t Owned Shares
530mil. shares
Total number of shares issued (million shares)
(Note 1) The basic policy on cancellation of all treasury stock owned by NTT as of March 31, 2010 (approx. 250 million shares) was resolved in May 2010, and one-half of such shares was cancelled in November 2010. The remaining half was cancelled in November 2011. (Note 2) Mandatory (minimum) number of shares to be held by the Government under the NTT Law = (total number of shares issued-30 million shares issued at the IPO in 2000) ×1/3 *The number of shares issued after the initial listing are not to be included in the calculations. (NTT Law, supplementary provision 13)
Minimum for Gov’t Owning
473mil. shares
<33%>
Gov’t Owned Shares
473mil. Shares
<33%>
Minimum for Gov’t Owning
431mil. shares <33%>
Gov’t Owned Shares
431mil. shares <33%>
Gov’t Owned Shares
431mil. shares <33%>
Mar. 31, 2010 Nov. 15, 2010 Nov. 15, 2011 Jul. 5, 2011 Feb. 8, 2012 Mar. 31, 2012E
<>:share holding ratio
Excess Holdings
42mil shares
Cancellation -125 mil. shares
Cancellation -125 mil. shares
793mil. shares 793mil. shares 793mil. shares
125mil. shares 125mil. shares
58mil. shares 58mil. shares 99mil. shares 99mil. shares
42mil. shares
793mil. shares
Market floating shares
Treasury Stocks <10.7%>

Copyright (c) 2012 Nippon Telegraph and Telephone Corporation Appendices (November, 2012) Appendices (November, 2012)
1,185.1 1,165.2 1,132.6 1,120.3 1,089.0
1,059.5 1,127.2 1,132.5 1,163.2 1,251.8
4,711.8 4,448.0 4,284.4 4,224.3 4,240.0
1,322.8 1,315.5 1,259.6 1,332.7 1,678.7
4,209.7 4,064.8
3,964.3 4,027.2 3,764.8
0
5,000
10,000
2008/3 2009/3 2010/3 2011/3 2012/3 2013/3E
Consolidated Operating Revenue (billion yen)
‐29‐
10,680.9 10,507.4 10,416.3
10,181.4 10,305.0
10,810.0
Changes in Consolidated Operating Revenue :Data communications business :Regional communications business
:Long distance and international communications business :Mobile communications business
:Other business
(Note) Business segment operating revenues include intersegment transactions (Fiscal year
ended/ing March 31)

Copyright (c) 2012 Nippon Telegraph and Telephone Corporation Appendices (November, 2012) Appendices (November, 2012)
78.9 15.2 13.3 44.9 56.9
58.8 86.8 64.9 77.0 71.5
796.5 825.4 828.4 839.1 876.4
105.8 96.9 98.2 97.1
116.7
285.6
70.5 82.1
127.3 86.9
0
500
1,000
2008/3 2009/3 2010/3 2011/3 2012/3 2013/3E
‐30‐
1,304.6
1,109.8 1,117.7
1,214.9 1,223.0 1,200.0
Changes in Consolidated Operating Income
Consolidated Operating Income (billion yen)
:Data communications business :Regional communications business :Long distance and international communications business :Mobile communications business
:Other business
(Note) Business segment operating income include intersegment transactions (Fiscal year
ended/ing March 31)

Copyright (c) 2012 Nippon Telegraph and Telephone Corporation Appendices (November, 2012) Appendices (November, 2012)
25,283 25,068 25,269 25,502 25,244 27,200
22,592 31,238 34,54349,991 58,668 62,15022,100
21,831 22,297
22,95423,289
24,250
13,17713,923 14,176
29,33031,162
34,350110,679
104,236 98,697
91,56685,876 78,250
0
100,000
200,000
2008/3 2009/3 2010/3 2011/3 2012/3 2013/3E
Consolidated No. of employees
‐31‐
:Data communications business :Regional communications business :Long distance and international communications business :Mobile communications business
:Other business
193,831 196,296 194,982
219,343 224,239 226,200
Changes in Number of Employees
(End of Year/month)

Copyright (c) 2012 Nippon Telegraph and Telephone Corporation Appendices (November, 2012) Appendices (November, 2012)
0
2,000
4,000
6,000
8,000
Age 20 30 40 50 60 65
(Note) Figures for East Outsourcing Companies include the consolidated prefectural outsourcing companies (NTT EAST-TOKYO and others), NTT-ME and NTT EAST SOLUTIONS, while figures for West Outsourcing Companies include the consolidated regional outsourcing companies (NTT WEST-KANSAI and others), NTT MARKETING ACT, NTT NEOMEIT and NTT WEST-HOMETECHNO. Figures for those companies include the number of employees who retired or will retire at the end of a fiscal year and who were rehired or will be rehired at the beginning of the following fiscal year (at the age of 50 and 60 (fixed-term employment which will be renewed year by year)).
‐32‐
Age Distribution of Employees at NTT East, NTT West and “Outsourcing Companies” (As of March 31, 2012)
Num
ber of Em
ployees

Copyright (c) 2012 Nippon Telegraph and Telephone Corporation Appendices (November, 2012) Appendices (November, 2012) ‐33‐
NTT East
NTT West
NTT Communications
NTT DATA
Other group
companies
Long distance and
international communications
business
Data communications
business Other business
100%* 100% * 100% * 54.2% *
Regional communications business
real estate, finance, construction
and power business
• Operating revenues (consolidated):10,507.4 billion yen • Operating income (consolidated): 1,223.0 billion yen • No. of employees: 224,239 • No. of subsidiary companies: 772
Operating Revenue:
Operating Income:
No. of Employees:
No. of Subsidiaries:
3,764.8 billion yen
86.9 billion yen
86,000
86
1,678.7 billion yen
116.7 billion yen
31,000
254
1,251.8 billion yen
71.5 billion yen
59,000
223
1,089.0 billion yen
56.9 billion yen
25,000
81
NTT DOCOMO
Mobile communications
business
66.6% *
4,240.0 billion yen
876.4 billion yen
23,000
128
* Percentage figures show the percentage of voting rights (October 31, 2012)
(Note) Financial year ended March 2012. Operating revenue and operating income of each segment include intersegment transactions.
Dimension Data
100% *
NTT Group Overview
Copyright (c) 2012 Nippon Telegraph and Telephone Corporation Appendices (November, 2012) Appendices (November, 2012)
The forward-looking statements and projected figures concerning the future performance of NTT and its subsidiaries and affiliates contained or referred to herein are based on a series of assumptions, projections, estimates, judgments and beliefs of the management of NTT in light of information currently available to it regarding NTT and its subsidiaries and affiliates, the economy and telecommunications industry in Japan and overseas, and other factors. These projections and estimates may be affected by the future business operations of NTT and its subsidiaries and affiliates, the state of the economy in Japan and abroad, possible fluctuations in the securities markets, the pricing of services, the effects of competition, the performance of new products, services and new businesses, changes to laws and regulations affecting the telecommunications industry in Japan and elsewhere, other changes in circumstances that could cause actual results to differ materially from the forecasts contained or referred to herein, as well as other risks included in NTT’s most recent Annual Report on Form 20-F and other filings and submissions with the United States Securities and Exchange Commission.
* “E” in this material represents that the figure is a plan or projection for operation.
‐34‐