november 2, 2016 - barry callebaut 12 november 2016 fy 15/16 roadshow presentation dr. w. andreas...
TRANSCRIPT

November 2016
November 2, 2016
Roadshow presentation 2015/16

BC at a glance
Highlights FY 2015/16
Strategy & Outlook
Agenda
November 2016 FY 15/16 Roadshow presentation Page 2

November 2016
BC at a glance

A merger between Cacao Barry, the very first chocolate connoisseur since 1842 and Callebaut, a chocolate couverture manufacturer expert since 1925
Listed on the SIX Swiss Exchange since 1998
Today, the world's leading manufacturer of high-quality chocolate and cocoa products
Barry Callebaut is part of 25% of all consumer products containing cocoa or chocolate
Who are we?
The heart and engine of the chocolate industry
November 2016 FY 15/16 Roadshow presentation Page 4

We add value in every step of the cocoa and chocolate value chain
November 2016 Page 5 FY 15/16 Roadshow presentation
Who do we do?

November 2016 FY 15/16 Roadshow presentation Page 6

What do we offer?
A broad range from standard to the most premium products
Page 7
Food Manufacturers Gourmet & Specialties Cocoa Products
FY 15/16 Roadshow presentation November 2016

Sales Volume per Product Group Sales Volume per Region
Cocoa Products
24%
Gourmet & Specialities
11%
Food Manu- facturers
65%
Asia Pacific 4%
EMEA 44%
Americas 28%
Global Cocoa 24%
November 2016
Our Regional and Product split
FY 2015/16 Sales Volume: 1.8 mio tonnes
Sales Revenue: CHF6,676.8m
EBITDA: CHF539.4m
EBIT: CHF401.7m
FY 15/16 Roadshow presentation Page 8
How are we organized?

Our business model
Customers Pricing model
• Small, medium and
Global Food
Manufacturers
• Cost Plus
• Small, medium and
Global Food
Manufacturers
• Market prices
• Cost Plus (partly)
Profit levers
• Customer mix
• Product mix
• Economies of scale
• Global set-up
• Combined ratio
• Customer/product mix
• Professional users, Food
Chains, Distributors
• Price list • Expansion of global brands
• Adjacent products
• Innovation/Sustainability
62%
10%
28%
Note: Percentage of FY2014/15 Group sales volume
Passing on the cost of raw materials to customers underpins profit stability by mitigating volatility impact of main raw materials
November 2016
We apply a cost plus approach to the majority of the business
Food Manufacturers
Cocoa Products
Gourmet & Specialties
FY 15/16 Roadshow presentation Page 9

Chocolate factory
Cocoa processing factory
Integrated factory
November 2016
A global footprint and a local service Cocoa factories in origin countries and chocolate factories close to our customers
FY 15/16 Roadshow presentation Page 10

November 2016
Highlights FY 2015/16

Changes in the Board of Directors
Dr. W. Andreas Jacobs to step down as Chairman
Patrick De Maeseneire proposed for election as new Chairman
All other Board members are standing for reelection for another term of office of one year.
FY results 2015/16
Proposal to the Annual General Meeting of Shareholders of December 7, 2016
November 2016 FY 15/16 Roadshow presentation Page 12
Dr. W. Andreas Jacobs
Patrick De Maeseneire

Sales volume growth +2.2%, outperforming the market1
Strong growth of chocolate business +7.6%
Intentional phase out of less profitable contracts in cocoa products -12.0%
Positive contribution from all key growth drivers
Profitability as anticipated, Operating profit (EBIT) flat at 0.1% in local currencies, Net profit down -5.1% in local currencies
Strong free cash flow of CHF 404 mio.
Dividend CHF 15.50 per share. Payout ratio of 39%
FY results 2015/16
“Smart growth” getting traction, strong free cash flow generation
November 2016
1 Source Nielsen: -1.7% volume growth in chocolate confectionery for 26 countries from Sept 2015-Aug 2016
Page 13 FY 15/16 Roadshow presentation

Food Manufacturers 65%
Cocoa Products 24%
Gourmet & Specialties 11%
Strong chocolate business across all regions, outperforming the market, while intentional decline in Global Cocoa
November 2016
Region Europe 6.6%
Underlying market -1.7%
Gourmet & Specialties 12.4%
Food Manufacturers 6.8%
Global Cocoa -12.0%
Region Asia Pacific 10.8%
Region Americas 8.8%
Sales volume growth 2015/16 vs. prior year Sales volume per Product Group
Page 14 FY 15/16 Roadshow presentation

Highlights 2015/16
November 2016
Launch of Cocoa Horizons Foundation
Sep 2015
Acquisition of commercial vending activities from FrieslandCampina
Nov 2015
Acquisition of Nyonkopa for sustainable cocoa sourcing from Ghana
Nov 2015
Opening of the first Van Houten Beverage™ Academy center in Sweden
Jun 2016
License agreement with Naturex to market Acticoa
Nov 2015
Opening new, relocated CALLEBAUT® CHOCOLATE ACADEMY center in Mumbai
Aug 2016
Strategic partnership with Tony’s Chocolonely chocolate from fully traceable sustainable cocoa
Aug 2016
Successful issue of EUR 450 million 2.375% Senior Notes due 2024
May 2016
Expansion of West Coast Factory, American Canyon, US
Mar 2016
Partnership with IDH, the Sustainable Trade Initiative
Jun 2016
Introduction of Katchilé, Innovative tool for geo-traceability and farm impact measurement
Jun 2016
Launch of BC Studio «craft and co-create» chocolate of tomorrow
Dec 2015
Page 15 FY 15/16 Roadshow presentation

11% 34% 34%
Emerging Markets Long-term outsourcing &
Strategic Partnerships
Gourmet & Specialties
FY results 2015/16
Volume growth continues to be fuelled by our key drivers
November 2016
Volume growth FY 2015/16
% of total Group Sales Volume
CAGR 5 year Volume
+12.4% vs. prior year +6.1% vs. prior year +4.5% vs. prior year
+9.6% +16.5% +24.3%
Page 16 FY 15/16 Roadshow presentation

Opening our first chocolate factory in Indonesia to supply our long-term agreement with Garuda Foods
Major expansion of our chocolate factory in Singapore: new production line, molding line and warehouse facility. Total investment of CHF 18 million
Opening new, relocated CALLEBAUT® CHOCOLATE ACADEMY center in Mumbai
Double-digit growth in China, India and Latin America in both Food Manufacturers and Gourmet businesses, capturing new customers
November 2016
Driving growth in Emerging Markets...
Page 17 FY 15/16 Roadshow presentation
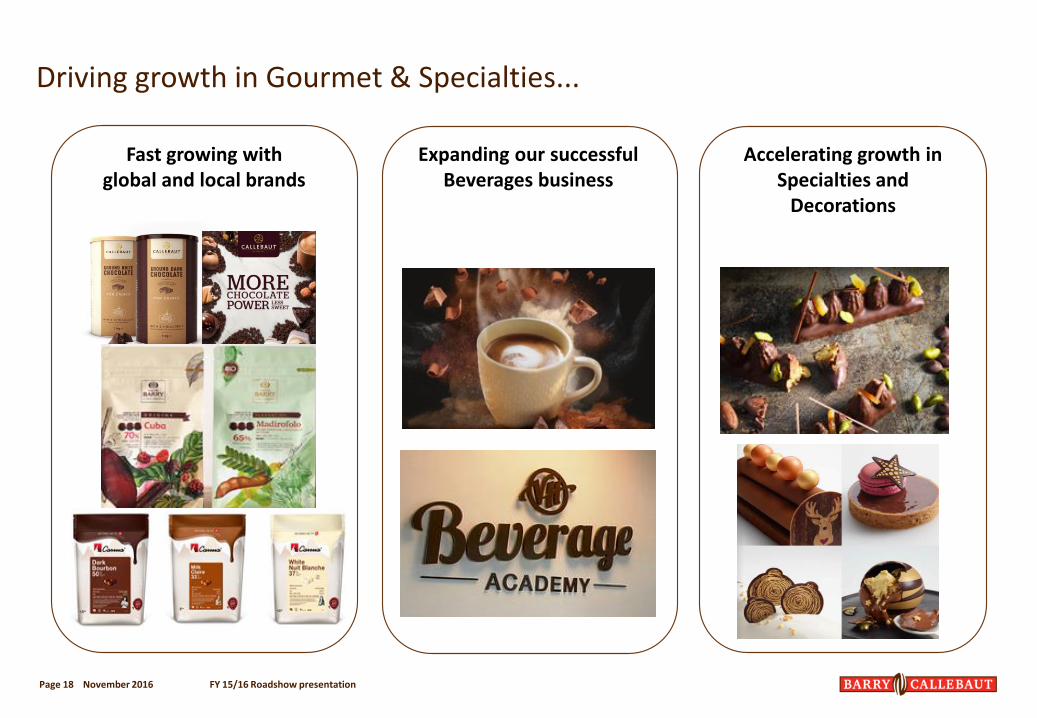
Driving growth in Gourmet & Specialties...
November 2016
Expanding our successful Beverages business
Fast growing with global and local brands
Accelerating growth in Specialties and
Decorations
Page 18 FY 15/16 Roadshow presentation

Extension of strategic partnership with Mondelēz International
Intention to acquire and integrate the chocolate production facility of Mondelēz International in Halle, Belgium
Long-term agreement for the supply of additional 30,000 tonnes of liquid chocolate per year
Closing expected by Dec 2016
New long-term contracts with mid-size customers in emerging markets
Strategic partnership to supply chocolate from fully traceable cocoa with Tony’s Chocolonely
November 2016
Driving growth by expanding and capturing strategic partnerships...
Page 19 FY 15/16 Roadshow presentation

Bringing Global Cocoa to the next level Cocoa Leadership Project
November 2016
Driving commercial excellence
• Sharpening focus on customers
• New pricing model in place and sales incentive scheme aligned
• SKU reduction by 25%
Optimizing our operations
• Creating an optimal manufacturing footprint
• More competitive direct sourcing model
• More efficient product flows and optimal stock levels
Leveraging our scale in execution
• Combined ratio organization & governance in place
• Global product availability
• Elevating our market intelligence
Page 20 FY 15/16 Roadshow presentation

“Smart growth” getting traction in FY 2015/16
November 2016
Bringing cocoa to the next level
Greater discipline on free cash flow
Page 21 FY 15/16 Roadshow presentation
Growing with customers while adding value

November 2016
Financial Highlights FY 2015/16

Solid volume growth, profitability as anticipated and flat in local currencies
FY results 2015/16
Group performance
(In CHF mio.)
FY 2015/16 (in CHF)
% vs prior year (in CHF)
% vs prior year in local
currencies
Sales Volume Total (in tonnes)
1,834,224 +2.2%
Sales Revenue 6,676.8 +7.0% +8.8%
Gross Profit 863.2 +1.9% +4.4%
EBIT Total EBIT per tonne
401.7 219.0
-3.2% -5.2%
+0.1% -2.0%
Net profit for the year 219.0 -8.7% -5.1%
Free cash flow 404.0
November 2016 Page 23 FY 15/16 Roadshow presentation

FY results 2015/16
November 2016
in tonnes +2.2%
Sales Volume FY15/16
1,834,224
-12.0%
+7.6%
Q4
-3.5% +3.8%
+8.1%
-7.9%
1,794,782
+2.3%
Sales Volume FY14/15
-2.0%
+9.1%
-13.7%
Q2 Q1
+6.4%
+9.7%
+4.6%
-23.2%
Q3
Global Cocoa
Chocolate (FM and Gourmet & Specialties)
Strong volume growth across all the chocolate Regions, while intentional phase out of less profitable contracts in Global Cocoa
Market Volume growth* -3.7% -1.3% -0.7% -1.7% -1.5%
*Source: Nielsen chocolate confectionery in volume – 26 countries
Page 24 FY 15/16 Roadshow presentation

Volume growth +6.6% +8.8% +10.8% -12.0%
25%
4%
28%
EMEA Americas Asia Pacific Global Cocoa
44%
28%
4%
24%
FY results 2015/16
Strong chocolate performance, in Global Cocoa profitability temporarily affected by challenging cocoa products market
EBIT growth in local currencies
+4.4% +12.0% +17.9% -60.3%
EBIT growth in CHF -0.1% +12.6% +19.7% -62.5%
November 2016 Page 25 FY 15/16 Roadshow presentation

Gross Profit FY 2015/16
in CHF mio.
Gross profit up +4.4% before FX impact, driven by positive volume effects, margin mix and despite a historically low combined cocoa ratio
November 2016
+34.5
+46.6
863.2
-20.5
Gross Profit FY 2015/16
FX Impact
+4.4%
Gross Profit before FX
Gross Profit FY 2014/15
846.8
883.7
Cocoa Processing
-44.2
Product/Customer Mix
Volume effects
Page 26 FY 15/16 Roadshow presentation

0.00
1.00
2.00
3.00
4.00
Oct-07 Oct-08 Oct-09 Oct-10 Oct-11 Oct-12 Oct-13 Oct-14 Oct-15 Oct-16
Historically low combined cocoa ratio strongly impacted FY 2015/16; recent signs of recovery, albeit with regional differences
Cocoa processing profitability
European combined ratio - 6 months forward ratio
For cocoa processors, profitability depends on the ratio between input costs (price of cocoa beans) and combined output prices (price of cocoa butter and powder).
November 2016
Combined ratio 3.39
Butter ratio
Powder ratio
FY 2015/16
Page 27 FY 15/16 Roadshow presentation

EBIT FY 2015/16
Operating profit flat in local currencies, supported by good product and customer mix, while setting up the path for continued “smart growth”
in CHF mio.
November 2016
One-off related to the settlement agreement with Petra Foods
+36.9
13.6
Additional SG&A
-26.2
Additional Gross Profit
FX Impact
-13.6
EBIT FY 2015/16
401.7
EBIT FY 2015/16 before FX
+0.1%
415.3 414.8
-10.2
EBIT FY 2014/15
Restructuring & other one-off
Page 28 FY 15/16 Roadshow presentation

From EBITDA to Net Profit
Net Profit down 8.7% in CHF, due to higher financial expenses, as well as higher taxes
239.9219.0
401.7
539.4 -137.7
EBITDA FY 2015/16
Depreciation and amortization
-135.3
EBIT
-47.5
Net Financial expenses
Income taxes
PAT 2015/16
-8.7%
PAT 2014/15
in CHF mio.
November 2016
EPS CHF 39.5
EPS CHF 43.2
One-off costs related to bond and FX Brazil Tax rate
17.8% vs 15.6% in prior year
Page 29 FY 15/16 Roadshow presentation

0%
50%
100%
150%
200%
250%
300%
Sep.2007 Sep.2008 Sep.2009 Sep.2010 Sep.2011 Sep.2012 Sep.2013 Sep.2014 Sep.2015 Sep.2016
Cocoa bean at high levels; world sugar prices increased, milk powder at low levels
Raw materials price evolution
Cocoa beans +10.1%
Milk powder -11%
Sugar EU -6.1%
Sugar world +18.6%
FY average increase vs. prior year
November 2016
Note: All figures are indexed to Sep 2007 Source: Cocoa beans London (2nd position), Sugar world London n°5 (2nd position), Sugar EU Kingsman estimates W-Europe DDP, skimmed milk powder average price Germany,
Netherlands, France.
FY 15/16 Roadshow presentation Page 30

Receivables Stocks Payables
Net Working Capital Aug 16
1,530
Growth impact
Others and FX impacts
-19
+27
-14
Price and operational
impact
+36
Growth impact
-147
Operational Improvement
+68
Price Impact
-87
-19
1,374
Growth impact
Net Working Capital Aug 15
Price and operational
Impact
-10.2%
in CHF mio.
Working Capital below prior year as a result of successful inventory reduction program and positively impacted by one-offs
Net Working Capital
November 2016 Page 31 FY 15/16 Roadshow presentation

Free Cash Flow
Strong cash flow generation as a result of efforts to reduce working capital and strict discipline on CAPEX
November 2016
in CHF mio.
404
569
473
Operating Cash Flow
FY 2014/15
Free Cash Flow FY 2015/16
M&A and other
-17 (py +44)
Interest paid and income taxes
-141 (py-145)
Capital Expenditures
-201 (py-249)
Change in Working capital
+193 (py -101)
Operating Cash Flow
FY 2015/16
+20.4%
Page 32 FY 15/16 Roadshow presentation

Improvement of our some financial ratios, based on our “smart growth” strategy and some positive one-off effects
Balance Sheet & key ratios
November 2016
Aug 16 Aug 15
Total Assets [CHF m] 5,640.8 5,429.4
Net Working Capital [CHF m] 1,374.6 1,529.7
Non-Current Assets [CHF m] 2,301.0 2,185.5
Net Debt [CHF m] 1,452.8 1,728.0
Shareholders' Equity [CHF m] 1,956.3 1,772.8
Debt/Equity ratio 74.3% 97.5%
Solvency ratio 34.7% 32.7%
Net debt / EBITDA 2.7x 3.2x
Interest cover ratio 4.0x 4.1x
ROIC 9.5% 9.8%
ROE 11.2% 13.5%
Page 33 FY 15/16 Roadshow presentation

Proposed payout of CHF 15.50 per share, up CHF 1.00 per share
Proposed dividend
CHF 15.50 per share1
Payout of 39% of Net Profit
Not subject to withholding tax2
Timetable for dividend
Shareholder approval: Dec 7, 2016 (AGM)
Expected ex-date: Feb 28, 2017
Expected payment date: March 2, 2017
Dividend
November 2016
219240255
223
143
33% 35%
2012
33%
2013
33%
2014 2016*
39%
2015
Payout ratio
Net Profit in CHF mio.
* As proposed by the Board to our Shareholders 1) Partly from reserves from capital contributions (CHF 4.19 per share) and partly in the form of a capital repayment by way of a par value reduction (CHF 11.31 per share) 2) For individuals who are taxed in Switzerland and hold the shares privately also no income tax
Page 34 FY 15/16 Roadshow presentation

November 2016
Strategy update & Outlook

Consistent long-term strategy, focus on execution
Vision
4 strategic pillars
Expansion
Innovation
Cost Leadership
Sustainability
“Heart and engine of the chocolate and cocoa industry”
“SMART growth”
Sustainable growth
Margin accretive growth
Accelerated growth in Gourmet, Specialties and emerging markets
Return on Capital and greater
focus on Free cash flow
Talent & Team
November 2016 Page 36 FY 15/16 Roadshow presentation

Execution translated into our Product groups
November 2016
Gourmet & Specialties Food Manufacturers Global Cocoa
Accelerated growth • Expand reach • Expand scope • Growth & profit accretion
Sustained growth • Strengthen existing
partnerships • Foster new
partnerships • Innovation & co-
creation
Profitable growth • Reinvent and refocus
our model • Restore profitability
Leve
ragi
ng
glo
bal
sca
le a
nd
exp
ert
ise
Page 37 FY 15/16 Roadshow presentation

Grow Competitively
Further leverage our innovation capabilities
Inspire and co-create
Nourish & expand partnerships
Grow Sustainably
Cocoa
Beyond cocoa
Talents & teams
Grow Profitably
Cocoa Leadership deployment
Increase leverage
Footprint & Capabilities
Disciplined execution
Quality & service
Profitability & cash
Strategic priorities 2016/17
November 2016 Page 38 FY 15/16 Roadshow presentation

Outlook
Continue to strive for a smart balance between consistent, above-market volume growth and enhanced profitability
November 2016
Outlook
Continue to implement “smart growth”, we have good visibility on volume growth and expect positive contribution to profitability from our Cocoa Leadership project.
Mid-term guidance (2015/16 - 2017/18)
Average volume growth 4-6%
EBIT growth on average above volume growth1
1 In local currencies and barring any major unforeseen events
Page 39 FY 15/16 Roadshow presentation

November 2016
Appendix

Global number one player in chocolate and cocoa
Deep chocolate and cocoa expertise
Global leader in Gourmet & Specialties
Proven and long-term oriented strategy
Unparalled global footprint, present in all key markets
Preferred outsourcing and strategic partner
Leader in Innovation
Cost leadership along the value chain
Pioneer in sustainability
Entrepreneurial spirit
Balancing short and long-term
What makes Barry Callebaut unique?
Page 41 November 2016 FY 15/16 Roadshow presentation

Capital Expenditures
2016/17 E
200
2015/16
201
2014/15
249
2013/14
249
2012/13
224
2011/12
218
CAPEX as % of sales revenue
+4.0%+4.2%+4.6%+4.5%+3.0%
in CHF mio.
Maintenance
Upgrade / efficiency gains existing sites
IT
Additional growth
November 2016 Page 42 FY 15/16 Roadshow presentation

271279274
251
290
312
282
219242
223
256
286
282
2009/10
1’210
+7.2%
2015/16
1’834
2014/15
231
1’795
2013/14
1’717
2012/13
1’536
2011/12
1’379
2010/11
1’269 Volume in kMT
EBIT per tonne in CHF (as reported)
EBIT per tonne in constant currencies
7-year EBIT per tonne development
EBIT per tonne temporarily affected by a challenging cocoa products market and a strong Swiss franc
November 2016 Page 43 FY 15/16 Roadshow presentation
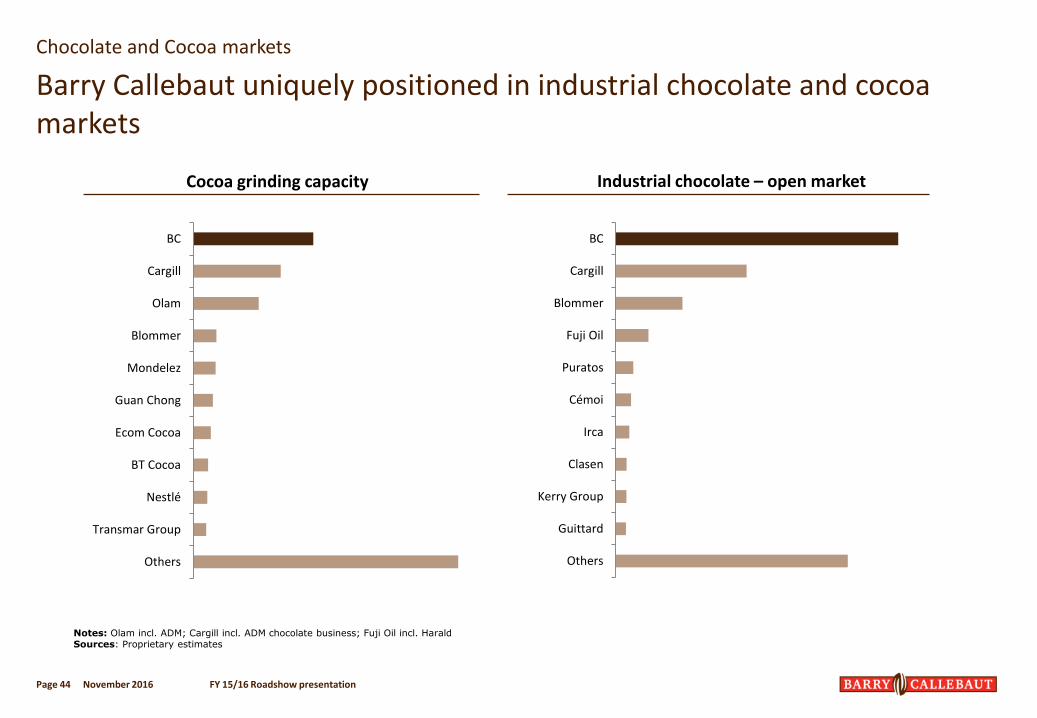
Chocolate and Cocoa markets
Barry Callebaut uniquely positioned in industrial chocolate and cocoa markets
Page 44
Cocoa grinding capacity Industrial chocolate – open market
Notes: Olam incl. ADM; Cargill incl. ADM chocolate business; Fuji Oil incl. Harald Sources: Proprietary estimates
BC
Cargill
Blommer
Fuji Oil
Puratos
Cémoi
Irca
Clasen
Kerry Group
Guittard
Others
BC
Cargill
Olam
Blommer
Mondelez
Guan Chong
Ecom Cocoa
BT Cocoa
Nestlé
Transmar Group
Others
November 2016 FY 15/16 Roadshow presentation

West Africa is the world’s largest cocoa producer
Source: ICCO estimates
About 70% of total cocoa beans come from West Africa
BC processed ~925,000 tonnes or 22% of the world crop
Barry Callebaut has various cocoa processing facilities in origin countries*, in Europe and in the USA
Total world harvest (14/15): 4,157 TMT
Ivory Coast* 42%
Ghana* 17%
Indonesia* 10%
Ecuador 6%
Cameroon* 6%
Brazil* 6%
Nigeria 5%
others 8%
Page 45 November 2016 FY 15/16 Roadshow presentation

Available Financing
Enough headroom for further growth and raw material price fluctuations
CHF 1,811 mio
Maturity 2023
Maturity 2021
Maturity 2017
Maturity 2019
Related Party loan 2017
3-5 years
Outstanding amounts
-58.9%
EUR 350 mio 6.0% Senior Notes
Long-term
Cash and cash equivalents
ABS
Available Funding Sources
CHF 4,407 mio
EUR 250 mio 5. 625% Senior Notes
USD 400 mio 5.5% Senior Notes
EUR 600 mio Syndicated Bank Loan
(11 banks)
Various bilateral LT loans
EUR 600 mio. Domestic Commercial
Paper Programme
CHF 948 mio Various uncommitted facilities
ABS
Short-term
Maturity 2024 EUR 450 mio
2.375% Senior Notes
CHF 150 mio.
As of 31 August 2016
Committed lines
November 2016 Page 46 FY 15/16 Roadshow presentation

Liquidity – Debt maturity profile
‐‐ Cash and revolving credit facility (undrawn)
Short-term facilities Term loans Bonds
As of 31 August 2016 In CHF mio
Uncommitted lines Committed lines
457 382
271
484
383
134
150
657
91
Cash 2015 2016 2017 2018 2019 2020 2021 2022 2023 2024
Page 47 November 2016 FY 15/16 Roadshow presentation