novel molecular probes reagents to analyze cellular...
TRANSCRIPT

Novel Molecular Probes®
Reagents to Analyze
Cellular Function
Gayle Buller
Sr. Product Development Manager
Flow Cytometry Systems

Overview
UTILIZE THE POWER OF FLOW----
Reagents that detect cellular functions are easily incorporated into
multi-color experiments
•Apoptosis
•Reactive Oxygen Identification
•Cell Proliferation
•Cell Cycle Analysis
•Viability
•Phagocytosis

Necrosis vs Apoptosis
Z. Darzynkiewicz, et.al.,Cytometry 27:1–20 (1997)

Violet Fluorescent Biomembrane Probe-Ratiometric Detection of Apoptosis
Probe incorporates into plasma membrane
•Excitable with Violet laser, easily multiplexed
•Probe exhibits Excited State Intramolecule proton transfer---- dual
fluorescence at 530 and 585 nm
•Apoptosis modifiies the surface charge of outer leaflet of plasma
membrane
•Monitors changes in surface charges through the change in relative
intensity of the two emission bands.
•Flow Cytometry Ratio parameter can be used

Apoptosis Assay for Adherent Cells
Hela (1 uM
Staurosporine)
NIH/3T3 (10 uM
Staurosporine)A549 (10 uM
Actinomycin D)
Control DMSO
Drug Treated
Less affected by cell membrane damage found during physical or
chemical removal steps when assaying adherent cells

Comparison of F2N12S to Caspase 3 and 7, mitochrondrial membrane potental indicators DiIC(5) and JC-1
DilC(5)_10uM Camptothecin.fcs
FSC-A
SS
C-A
0 65536 131072 196608 262144-63
65489
131041
196592
262144
Cells Cell Line: Jurkat
Number of live cells 18367Percent of live cells 66
Number of Apoptotic Cells 7535Percent of Apoptotic Cells 27
Number of Total Dead Cells 1732Percent Total Dead Cells 6
DilC(5)_10uM Camptothecin.fcs
DilC(5) (660/20)
SY
TO
X A
AD
va
nc
ed
(6
95
/40
)
-101
103
104
105
-102
102
103
104
105
JC-1 SYTOX AAD_10uM Camptothecin.fcs
FSC-A
SS
C-A
0 65536 131072 196608 262144-74
65480
131035
196589
262144
Cells
Cell Line: Jurkat
Number of live cells 28551Percent of live cells 75
Number of Apoptotic Cells 9028Percent of Apoptotic Cells 24
Number of Total Dead Cells 6461Percent Total Dead Cells 14
JC-1 SYTOX AAD_10uM Camptothecin.fcs
JC-1 Green (530/30)
JC
-1 R
ed
(5
85
/42
)
-101
103
104
105
-101
103
104
105
DiIC(5)
JC-1
F2N12S D499-88_10uM Camptothecin.fcs
FSC-A
SS
C-A
0 65536 131072 262144
0
65536
131072
196608
262144
Cells
F2N12S D499-88_10uM Camptothecin.fcs
Violet A/Violet B (x1,000)
SY
TO
X A
Ad
van
ced
(695/4
0)
0 1250 2500 3750 5000
-102
102
103
104
105
Cell Line: Jurkat
Number of Live Cells: 30232Percent Live Cells: 60%
Number of Apoptotic Cells: 15178Percent Apoptotic Cells: 30%
Number of Dead Cells: 4975Percent Dead Cells: 10%
Caspase 3-7_10uM Camptothecin.fcs
FSC-A
SS
C-A
0 65536 131072 196608 2621440
65536
131072
196608
262144
CellsCell Line: Jurkat
Number of live cells 34201Percent of live cells 74
Number of Apoptotic Cells 9423Percent of Apoptotic Cells 20
Number of Total Dead Cells 2306Percent Total Dead Cells 5
Caspase 3-7_10uM Camptothecin.fcs
FAM (530/30)
SY
TO
X A
AD
va
nc
ed
(6
95
/40
)
-102
102
103
104
105
-102
102
103
104
105
Caspase 3 and 7
F2N12S
| Life Technologies Proprietary & Confidential | 10/5/2011
•Comparable to other hall mark changes in apoptosis
•No special buffer required
•No Wash Assay
•Less affected by cell membrane damage found during physical
or chemical removal steps when assaying adherent cells

CellEvent™
caspase-3/7 green detection

CellEvent™ Caspase 3/7 Green reagent for apoptosis• Fluorogenic Caspase 3/7 Substrate
• A nucleic acid dye conjugated to a DEVD peptide
• Non-fluorescent until active caspase 3/7cleaves the DEVD peptide and the free nucleic acid dye binds to DNA.
ADVANTAGES: − Live cell amenable
− May be added to complete growth media
− No-wash protocol
− Retained after fixation and permeabilization
− May be multiplexed with other live or fixed cell probes
DEVD
Active
Caspase-3/7 Enzyme
Non-fluorescent
No DNA binding
Bound
DNA dyeDNA dye

Effect of Washes on Apoptotic Cells
0
10
20
30
40
50
60
70
80
90
No Wash 1 Wash 2 Wash3 Wash
4 Wash
Washes wash away
the fragile apoptotic
cells as illustrated
here.
U2OS cells were treated with 0.375 µM staurosporine for 23 hours. Cells were then labeled with 5 µM CellEvent and Hoechst 33342 in complete media for 30 min. at 37oC. Cells were then imaged immediately, no wash. Cells were washed with DPBS and imaged after each wash for 4 washes. % positive (% of cells positive for CellEvent) were plotted.

Jurkat cells (1x10⁶ cells/mL) were induced with 10µM camptothecin for 4 hours prior to harvest. Cells were washed 1x in PBS
and stained using 4µM CellEvent™ and Fixable Aqua. Following a 30 minute incubation at room temperature protected from
light, cells were washed with 1xPBS and analyzed on the Attune® Acoustic Focusing Cytometer using a collection rate of
Standard 100µL/min. Each dual parameter plot indicates Fixable Aqua and CellEvent™ fluorescence from the gated
population of parent cells (excluding debris). Treatment with camptothecin increases the percent of apoptotic (A, blue) cells
while decreasing the percent of live (L, green) cells. The number of necrotic (N, red) cells remains fairly constant over the
course of this experiment.
L (84%)L (67%)
A (11%) A (27%)
N (4%) N (5%)
Control cells (+DMSO) Induced cells (+10µM camptothecin)
CellEvent™ Caspase-3/7 Green Detection
Reagent (C10423)

ROS Probes

• Under Oxidative Stress- ROS is
dramatically increased.
• Reactive Oxygen Species can alter
membrane lipids, proteins, and nucleic
acids.
• Specifically Detects general reactive
oxygen species (ROS) or Oxidative
stress.
• Absorption/emission maxima: ~644/665
nm,
• Compatible with formaldehyde-based
fixation methods, facilitating convenient
multi-parameter analyses

Simple Work flow for CellROX™ for Multiple platforms
Sim
ple
30 M
inute
s w
ork
flow
Validated with all Major
platforms
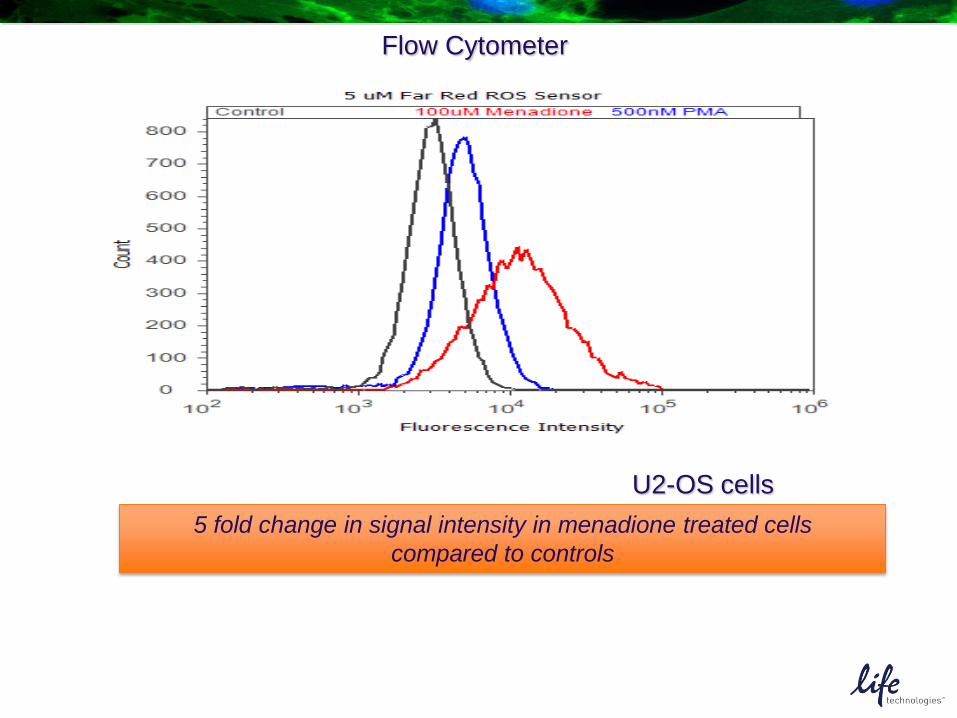
Flow Cytometer
5 fold change in signal intensity in menadione treated cells
compared to controls
U2-OS cells

CellTrace™ Violet Stain:An alternative to CellTrace™ CSFE

Cell Proliferation Analysis by Dye Dilution
• Cell division results in equal partitioning of dye between daughter cells.
• Fluorescence of daughter cells is half that of parent cell
First
Generation
Second
Generation
Third
Generation
Fourth
Generation
Brightness
Nu
mb
er
of
Cells

Proliferation Analysis with CFSE
Carboxyfluorescein Diacetate Succinimidyl Ester

CFSE: Occupies a Popular Channel

Human CD8+ T lymphocytes stained with 10µM CellTrace™ Violet and incubated in OpTmizer
T-cell Expansion Medium at 37°C for 7 days. (A) Unstimulated cells. (B) Cells stimulated with
200ng mouse anti-human CD3 antibody and 100ng Interleukin-2 per milliliter cells.
A. B.
CellTrace™ Violet Analyzed with Proliferation Modeling Software

Peripheral blood mononuclear cells were isolated
from whole blood, stained with 10µM CellTrace™
Violet, and stimulated with mouse anti-human CD3
and Interleukin-2 for 7 days in culture. Cells were
stained with mouse anti-human CD4 Alexa Fluor®
488 and SYTOX® AADvanced™ dead cell stain
immediately prior to analysis.
Multiplexed Analysis on the Attune™ Acoustic Focusing Cytometer

Multiplexed Analysis on the
Attune® Acoustic Focusing Cytometer
Several generations of live CD4+ T Cells as
visualized with the Attune® Acoustic Focusing
Cytometer
CellTrace™ Violet Fluorescence
Nu
mb
er
of ce
lls c
ou
nte
d
Several generations of live CD4+ and CD4-
T Cells as visualized with the Attune®
Acoustic Focusing Cytometer.
CellTrace™ Violet FluorescenceC
D4
-Ale
xa
Flu
or®
48
8 F
luo
resce
nce

DNA Content Analysis: Options for live or fixed cells

Cell Cycle in brief
G0
M
G2
S
G0: Non-proliferating cells
G1: Cell have 2N nuclear DNA content
S: Nuclear DNA content doubles to 4N
G2: Cells are maintained at 4N
M: Cell division results in two cells each with 2N DNA content

DNA Content Analysis in Proliferating Cells
U2OS osteosarcoma cells transduced with Cellular Lights™ Tubulin and MAP4

Technical Considerations for Cell Cycle Staining• Instrument
− Know your instrument (lasers/emission filters)
− Know your dye (excitation/emission)
− Proper maintenance and careful optical alignment
− Verify instrument linearity
• Sample Prep− Single cell suspension
− Cell concentration and dye concentration
− Optimize for cell type, medium or buffer used, time of incubation, temperature of incubation.
• Acquisition and Analysis− Acquire sample in low flow rate
− Total number of cells acquired
− Gating strategies
− Software analysis

Narrow Sample Stream:
Low Flow Rate -12µL/min
Wide Sample Stream: High
Flow Rate-60µL/min
CV = 5.1% CV = 8.5%
Hydrodynamic
Focusing

G0G1: 41.73% Mean: 50.34
− CV: 4.83%
G2M: 20.44% Mean: 98.67
− G2/G1: 1.96
S-Phase: 37.83% Mean:73.46
G0G1: 40.16% Mean: 50.00
− CV: 6.12%
G2M: 20.89% Mean: 98.00
− G2/G1: 1.96
S-Phase: 38.95% Mean:73.19
G0G1: 44.60% Mean: 49.97
− CV: 7.76%
G2M: 29.23% Mean: 95.13
− G2/G1: 1.90
S-Phase: 26.17% Mean:69.12
Hydrodynamic Focusing: DNA Content Cell Cycle Data
Low - 12 l/min
Medium - 35 l/min
High - 60 l/min
As Sample Rates
Increase
Note overt
degradation of CV
values and changes in
data
Fixed Jurkat cells stained
with Propidium Iodide

FxCycleTM Violet fluorescence
Count
FxCycle™ Stains: for DNA content measurement in FIXED cells
Easily add DNA content to multicolor experiments
• Violet 405 nm excitation
• ~ 450 nm emission
FxCycleTM Far Red fluorescence
• Red 633 nm excitation
• ~ 660 nm emission
HL-60
promyeloblast
TF-1
erythroblast
FxCycleTM Violet stain FxCycleTM Far Red stain

Identify Mitotic Cells with FxCycle™ Violet and FxCycle™ Far Red
dyes combined with pH3 + Zenon® Alexa® Fluor 488
BioSource Rabbit polyclonal anti-Histone H3 [pS10]
Complexed with Zenon® Alexa Fluor® 488 Rabbit IgG
FxCycle™ Far RedFxCycle™ Far Red
FxCycle™ VioletFxCycle™ Violet
pH
3-A
lexa Flu
or 4
88
pH
3-A
lexa Flu
or 4
88
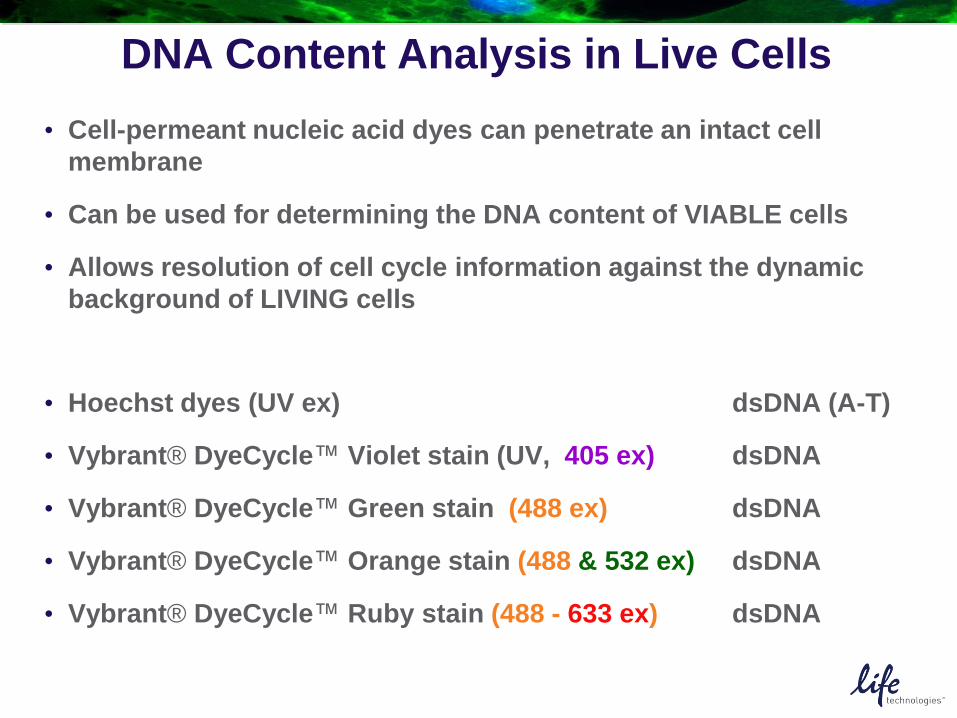
DNA Content Analysis in Live Cells
• Cell-permeant nucleic acid dyes can penetrate an intact cell
membrane
• Can be used for determining the DNA content of VIABLE cells
• Allows resolution of cell cycle information against the dynamic
background of LIVING cells
• Hoechst dyes (UV ex) dsDNA (A-T)
• Vybrant® DyeCycle™ Violet stain (UV, 405 ex) dsDNA
• Vybrant® DyeCycle™ Green stain (488 ex) dsDNA
• Vybrant® DyeCycle™ Orange stain (488 & 532 ex) dsDNA
• Vybrant® DyeCycle™ Ruby stain (488 - 633 ex) dsDNA

Vybrant® DyeCycle™ Ruby stain
for DNA content in LIVE cells
Vybrant®DyeCycle™ Ruby fluorescence
488 nm laser 633 nm laser

Jurkat cell growth eight days after sorting
Control
Vybrant®DyeCycle™
Ruby stain
Hoechst 33342
DRAQ5®

Re-Growth After Sorting
HL-60 cell count
0
1
2
3
4
5
6
7
8
1 2 3 4 5
Day post sort
Cell c
ou
mt/
ml x 1
0e5
Data Courtesy of: Tina Luke and Derek Davies, London Research Institute, Cancer Research UK
FSC-A0 30 60 90 120
SS
C-A
03
06
09
01
20
R1
Channels (780-60 Red-A)0 30 60 90 120 150
Num
ber
080
160
240
320
400
File analyzed: Specimen_002_HL-60.fcs
Date analyzed: 5-Jun-2009
Model: 1nn0n_DSF
Analysis type: Manual analysis
Diploid: 100.00 %
Dip G1: 55.52 % at 51.37
Dip G2: 1.41 % at 91.98
Dip S: 43.07 % G2/G1: 1.79
%CV: 11.46
Total S-Phase: 43.07 %
Total B.A.D.: 0.00 % no debris no aggs
Debris: %
Aggregates: 0.00 %
Modeled events: 8199
All cycle events: 8199
Cycle events per channel: 197
RCS: 1.067
HL-60
0
20
40
60
80
100
1 2 3 4 5
Days post sort
Percen
tage v
iable

• Fluorescent Ubiquitination-based Cell Cycle Indicator
− A fluorescent protein-based sensor using a red (RFP) and a green (GFP) fluorescent protein fused to different regulators of the cell cycle: Cdt1 and geminin
− In G1 phase, geminin is broken down and only Cdt1 tagged with RFP may be visualized. Cells in the G1 phase have red fluorescent nuclei.
− In S, G2, and M phases, Cdt1 is degraded and only geminin tagged with GFP remains. Cells in these phases have green fluorescent nuclei.
| Life Technologies Proprietary & Confidential | 10/5/2011
Premo™ FUCCI Cell Cycle Sensor
Channels (UV B-A-DAPI UV B-A)0 30 60 90 120 150
Nu
mb
er
02
00
40
06
00
80
01
00
0
Channels (UV B-A-DAPI UV B-A)0 40 80 120 160
Nu
mb
er
02
00
40
06
00
80
0
ControlDip G1: 33.61 % at 45.72
Dip G2: 15.72 % at 90.99
Dip S: 50.68 % G2/G1:
1.99
%CV: 5.32
Premo™ FUCCIDip G1: 35.85 % at 50.93
Dip G2: 16.07 % at 101.71
Dip S: 48.08 % G2/G1: 2.00
%CV: 6.68

| Life Technologies Proprietary & Confidential | 10/5/2011
Premo™ FUCCI Cell Cycle Sensor
U2OS cells transduced with Premo™ FUCCI Cell Cycle Sensor and allowed to divide. Images were collected over 15 hours.

Vybrant® DyeCycle™ Violet Fluorescence (603/48 nm)
Vyb
ran
t® D
yeC
ycle
™ V
iole
t Fl
uo
resc
ence
(4
50
/40
nm
)
Vybrant® DyeCycle™ Violet Fluorescence (603/48 nm)
Vyb
ran
t® D
yeC
ycle
™ V
iole
t Fl
uo
resc
ence
(4
50
/40
nm
)
Limbal Stem Cell Side Population
Limbal stem cells give rise to cells that migrate to the central cornea
To identify corneal epithelial progenitor populations in cell cultures derived from
human limbal tissue, DyeCycle™ Violet is used, here shown with a pump blocker
Useful to quantify stems cells in expanded limbal cell cultures

Fluorescence Histogram of DNA content distribution
Channels (UV B-A-450/50 HO342 UV B-A)0 50 100 150 200 250
Nu
mb
er
050
100
150
200
G1: 21.98 %
G2: 62.92 %
S: 15.10 %
Channels (UV B-A-450/50 HO342 UV B-A)0 50 100 150 200 250
Nu
mb
er
070
140
210
280
G1: 1.77 %
G2: 82.74 %
S: 15.49 %
Where is the S-phase?
DNA content
DNA content

Click-iT® EdU Cell Proliferation Assay:
Reliable S-Phase Analysis

Tritiated (3H) thymidine
TRADITIONALLY
1960’s - (3H-thymidine)

BrdU (5-bromo-2’-deoxyuridine)
Br
Br
Br
Br
1970’s - (BrdU)

Br
Br
Br
Br
BrdU incorporated in
dsDNA is inaccessible
to the BrdU antibody

Br
Br
Br
Br
BrdU antibody requires DNA
denaturation for detection
Numerous protocols: acid, heat, or
nuclease for DNA denaturation

Br
Br
Br
Br
• Denatured DNA is required for
antibody detection of BrdU

EdU (5-ethynyl-2’-deoxyuridine)
New in 2007-EdU

Click-iT® EdU detection
Click labeling does not require
DNA denaturation
Dye azide reacts with the
alkyne on double stranded DNA

Attune® Acoustic Cytometer with Click-iT ® EdU:FxCycle™ Violet with Alexa Fluor® 488 azide
EdU- Alexa Fluor ® 488 fluorescence
EdU
-A
lexa
Flu
or
® 4
88
flu
ore
sce
nce
FxCycle™ Violet fluorescence
FxCycle™ Violet fluorescence
Run at Standard collection
1000 µl/min

One hour EdU then one hour BrdU
G1 S G2 M
G1 S G2 M
EdU
•Incorporated into
cells replicating
DNA
Add BrdU
•cells that have already
completed DNA synthesis will
not incorporate BrdU and will
express EdU only
•Cells in S-phase during both
pulses will express BrdU and EdU
•Cells newly entering S-phase
will incorporate BrdU and
express BrdU only

Jurkat cells: Edu then BrdU
BrdU
FITC
EdU Alexa Fluor® 647BrdU
FITC
EdU
Alexa Fluor®
6
47
DNA content
DNA content

Selection of BrdU clone
BrdU Clone react with EdU react with BrdU
3D4 yes yes
PRB-1 yes yes
B331 no no
Bu20a yes yes
B44 yes yes
MoBu no yes
There are many more clones of BrdU….

Click-iT® EdU labeling birth-
dates differentiated cells in
mouse olfactory epithelium F.
Chehrehasa et al. J Neurosci
Method (2009)
Click-iT® EdU is compatible with multiplex fluorescence labeling across species (and Kingdoms)
Neural tube and otocyst
labeling with Click-IT®
EdU in chick embryos. M.
Warren et al. Dev.
Dynamics (2009)
Proliferating germ cells in
C. elegans with Click-iT®
EdU. M. Dorsett et al.
Genetics (2009)
Image courtesy of Sarah
Cheesman, University of
Oregon
Methods (2009) 48:8-13
Image coutesy of Julian P.S. Smith
III, Winthrop Microscopy Facility,
Winthrop University
E. colimarine flatworm
zebrafish larva
Medicago sativa (alfalfa)
suspension cultures labeled
with Click-iT® EdU. Image
courtesy of Ferhan Ayaydin,
Cellular Imaging Laboratory,
Biological Research Center,
Szeged, Hungary

Tools for Determination
of Cell Viability

SYTOX® AADvanced™ dead cell stain
Dead cell identification based on membrane integrity
• Propidium Iodide (488 nm ex)
• 7AAD (488 nm ex)
• SYTOX® Green dead cell stain (488 nm ex)
• SYTOX® Blue dead cell stain (405 nm ex)
• SYTOX® Red dead cell stain (633 nm ex)
• Uses common 488 nm laser
• Spectra similar to 7AAD
• Efficient staining, only 5 minutes
• Can easily use with FITC & PE channels
Common Nucleic Acid Dyes for Flow

7AAD vs SYTOX® AADvanced™
7-AAD fluorescence
7-AAD
MFI ratio of Dead:Live = 56
SYTOX® AADvanced™ fluorescence
SYTOX® AADvanced™ stain
MFI ratio of Dead:Live = 102
Comparison with 5 minutes incubation time

Alternatives for Dead Cell Identification
Live cells react with the
fluorescent reactive dye only
on their surface to yield
weakly fluorescent cells.
• Amine-reactive fluorescent dyes in a range of colors
• Easy discrimination of live and dead cells
Cells with compromised
membranes react with
the dye throughout their
volume, yielding brightly
stained cells.

Fixable Dead Cell Stains
Before fixation After fixation
Dead
Live
Same population discrimination pattern before and after fixation.
Live
Dead
Jurkat cells were mixed 50% live: 50% dead and stained with LIVE/DEADTM
Fixable
Violet Dead Cell Stain.

Propidium
iodide
LIVE/DEAD®
Fixable Red stain
Before Fixation After Fixation
488 nm excitation, 610/20 filter
488 nm excitation, 610/20 filter
Effect of Fixation on Dead Cell Dyes
Before Fixation After Fixation

LIVE/DEAD®
Fixable Blue stain
LIVE/DEAD®
Fixable Violet
stain
LIVE/DEAD®
Fixable Aqua stain
LIVE/DEAD®
Fixable Yellow
stain
LIVE/DEAD®
Fixable
Green stain
LIVE/DEAD®
Fixable Red stain
LIVE/DEAD®
Fixable Far Red
stain
LIVE/DEAD®
Fixable
Near IR stain
Before Fixation 18 Hours Post-Fixation Before Fixation 18 Hours Post-Fixation
UV (355 nm) excitation, 450/50 filter
405 nm excitation, 450/20 filter
405 nm excitation, 530/30 filter
405 nm excitation, 575/25 filter
488 nm excitation, 530/30 filter
488 nm excitation, 610/20 filter
633 nm excitation, 660/20 filter
633 nm excitation, 780/60 filter
LIVE/DEAD® Fixable Dead Cell Stains:
amine-reactive dyes

BA
Live CellsLive + Dead Cells
Eliminate dead cells from analysis
Lysed human peripheral blood was labeled with CD4-Pacific Blue™ and CD8-Pacific Orange™ direct
conjugates, and then labeled with SYTOX® Orange dead cell stain before acquisition using 488 nm excitation
with a 575/24 BP for detection of SYTOX® Orange and 405 nm excitation with 450/40 BP for Pacific Blue™
and 603/48 BP for Pacific Orange™ detection.
Antibodies will bind nonspecifically to dead cells.
Gating on live cells will improve the accuracy of results.

LIVE/DEAD® Fixable Dead Cell StainSampler Kit
A B C D E F G H
Standard Workflow1. Resuspend 1 x 10⁶ cells in 1 mL cell suspension buffer.
2. Add 1 µL dye.
3. Incubate at room temperature: SYTOX® AADvanced™: 5min; SYTOX® Blue: 15 min; SYTOX® Green: 20min; SYTOX® Orange: 20 min; SYTOX® Red: 15 min.
4. Analyze.
SYTOX® dead cell stain sampler kit for flow cytometry S34862
SYTOX® dead cell stain sampler kit for flow cytometry S34862
SYTOX® dead cell stain
Excitation Maximum (nm)
Emission Maximum (nm)
Suggested laser (nm)
Attune Channel;
bandpass filter
SYTOX® AADvanced™
546 647 488 BL3; 640LP
SYTOX® Blue 444 480 405 VL1; 450/40
SYTOX® Green 504 523 488 BL1; 530/30
SYTOX® Orange
547 570 532 or 488 BL2; 575/24
SYTOX® Red 640 658 633/635 n/a; 660/20
SYTOX® fluorescence
Co
un
t
AADvanced™ Blue Green Orange Red
SYTOX® Dead Cell Stain Sampler Kit

Tools for Compensation
ArC™ Bead Kit: Amine-Reactive Compensation
Protocol:
• Stain one drop of reactive beads with 1µl
Live/Dead™ Fixable Stain
• Incubate 15 minutes
• Wash
• Add one drop of negative beads
• Ready to Run
•Why Use them?
• Eliminates the hassle of heat-treating cells
• Fast and simple bead based compensation
• Save precious cell sample
• Auto-compensation compatible
Green Fluorescence

ArC™ Bead Kit
Amine Reactive Compensation Beads
ArC™ Beads stained with Live/Dead™ fixable
Blue, Green, and Near IR dyes

Phagocytosis Studies

pHrodo™ BioParticles® for Phagocytosis
pHrodo™: pH-sensitive fluorescence
Figure 1. Analysis of phagocytosis in a granulocyte population. Whole
human blood was incubated with pHrodo™ E.coli Bioparticles ® either on ice
(4oC) or at 37oC for 15 minutes before red blood cell lysis and wash. Samples
were analyzed using the Attune® Acoustic Focusing Cytometer equipped with 488
nm laser for pHrodo ™ dye excitation. Samples were run at a collection rate of
Standard 25 µL/min and fluorescence emission was detected using a 575/24
bandpass filter. Histogram (A) and dot plot (B) overlays gated from a granulocyte
population demonstrate the difference in E.coli Bioparticles fluorescence upon
phagocytosis. Phagocytosis is inhibited by incubation on ice (4oC), whereas
incubation at 37oC permits efficient phagocytosis.
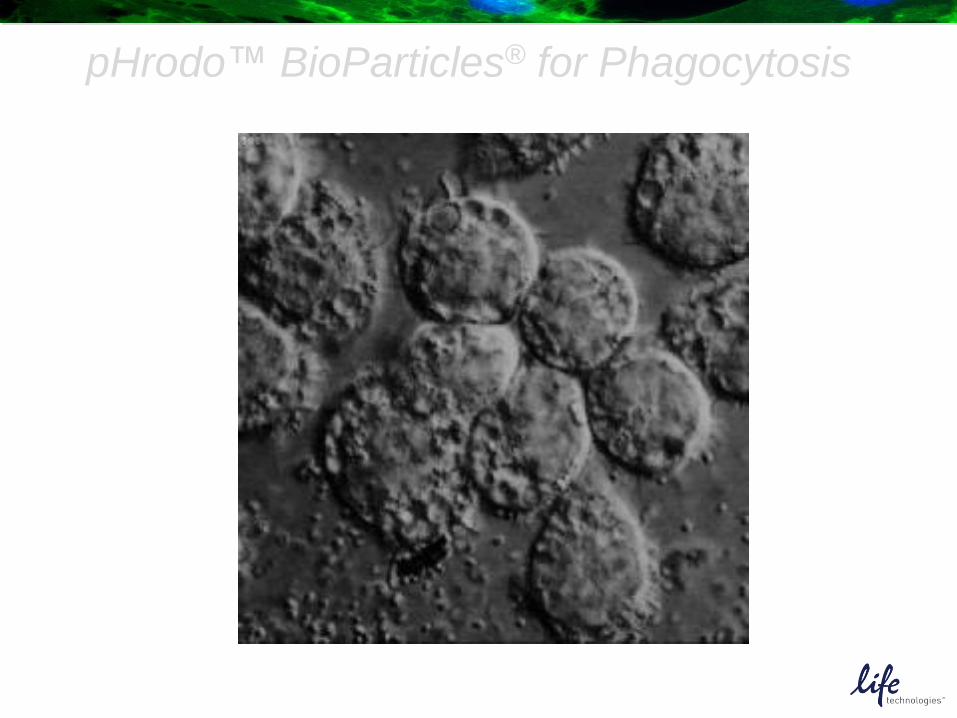
pHrodo™ BioParticles® for Phagocytosis

Life Technologies- Reagents and Instruments
Attune® Acoustic Focusing
Cytometer
Innovative New Technology
to Align Cells for flow
analysis
Ideal for rare cell analyses,
precious samples
Tali™ Image-based Cytometer2 Channel Fluorescent Image
CytometerIdeal for GFP /RFP
EnumerationSimple Cell Assays
Countess® Automated Cell Counter
Ideal for cell counting /viability

Promotions
•15% off the featured Flow technologies &
Countess
•A free box of slides when you order the
Tali™
•Coupon to save $15K when you order both
the Tali™ & Attune®

Contacts
Kris Zuraitis- Consumable Sales Representative
Sara Staggs- Flow Technical Sales Specialist
Russ Bennett- Technical Specialist-Drug
Discovery and Cellular Analysis