nova first results
TRANSCRIPT

NOvA First Results
JeffHartnellUniversityofSussex
Rencontres de Moriond EW 14thMarch2016
Introduc?on• Long-baselineappearancemeasurement
• NuMIbeam• NOvAdetectors
• Muonneutrinodisappearance
• Electronneutrinoappearance
JeffHartnell,MoriondEW2016 2

JeffHartnell,MoriondEW2016 3
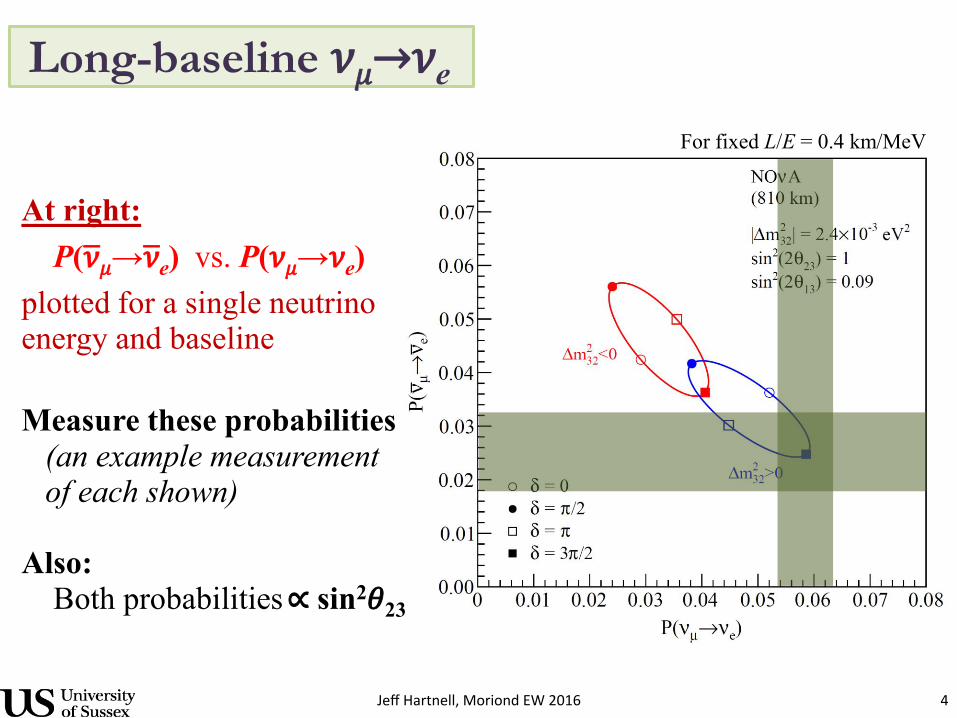
Long-baseline 𝜈𝜇→𝜈e For fixed L/E = 0.4 km/MeV A more quantitative sketch…
At right: P(𝜈⎺𝜇→ 𝜈⎺e) vs. P(𝜈𝜇→𝜈e) plotted for a single neutrino energy and baseline
Ryan Patterson, Caltech Fermilab JETP, August 6, 2015 4
JeffHartnell,MoriondEW2016 4
Long-baseline 𝜈𝜇→𝜈e For fixed L/E = 0.4 km/MeV A more quantitative sketch…
At right: P(𝜈⎺𝜇→ 𝜈⎺e) vs. P(𝜈𝜇→𝜈e) plotted for a single neutrino energy and baseline Measure these probabilities (an example measurement of each shown) Also: Both probabilities ∝ sin2𝜃23
Ryan Patterson, Caltech Fermilab JETP, August 6, 2015 5
JeffHartnell,MoriondEW2016 5
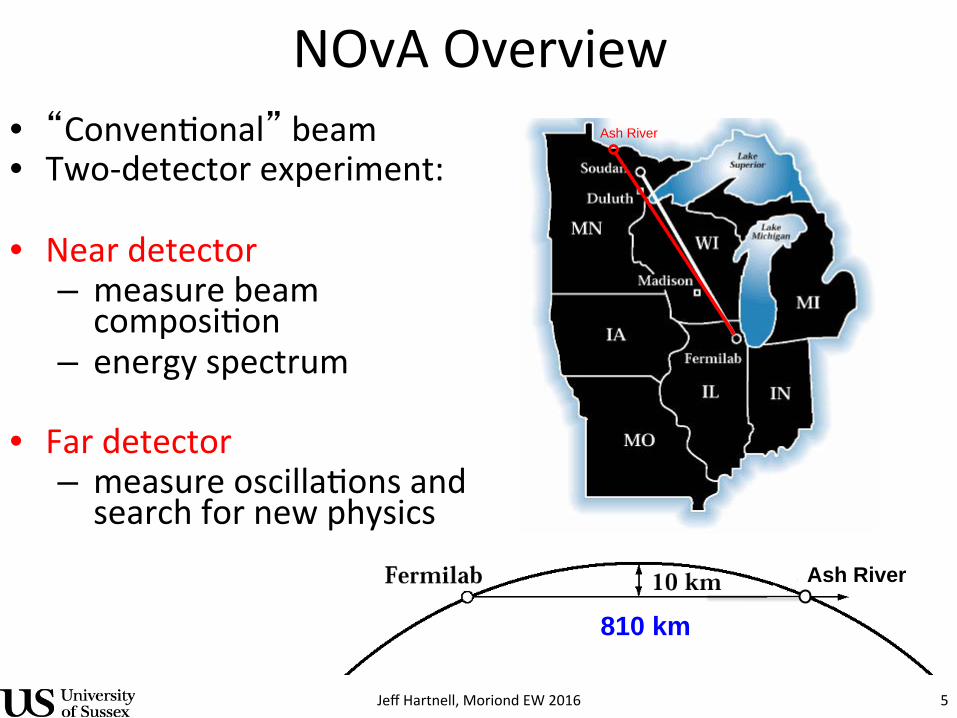
NOvAOverview• “Conven?onal”beam• Two-detectorexperiment:
• Neardetector– measurebeamcomposi?on
– energyspectrum
• Fardetector– measureoscilla?onsandsearchfornewphysics
Ash River
Ash River
810 km

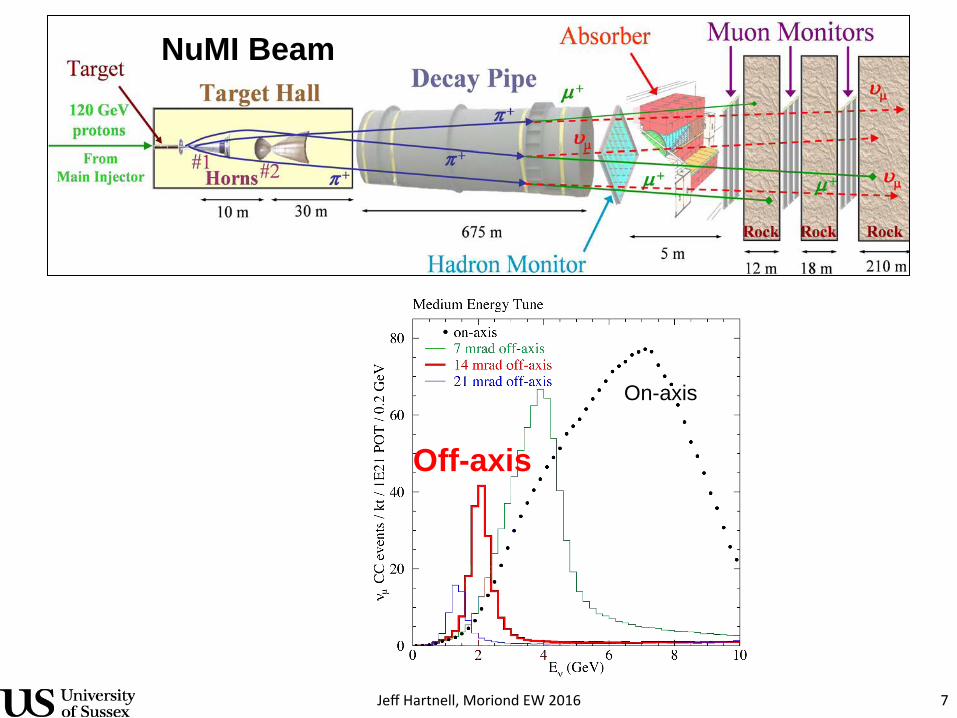
KeyFeaturesof2ndGenera?onExpt• Narrowband(off-axis)beam
• Detectorsop?misedfor– νeflavouriden?fica?on– νeappearancemaximum(L/E)
• Higherpowerbeam
• NOvAhasabouttriplethema\ereffectofT2Kandhigherrela?vean?neutrinoxsec
JeffHartnell,MoriondEW2016 6
JeffHartnell,MoriondEW2016 7
Off-axis
On-axis
NuMI Beam

NOvADetectors
JeffHartnell,MoriondEW2016 8
JeffHartnell,MoriondEW2016 9
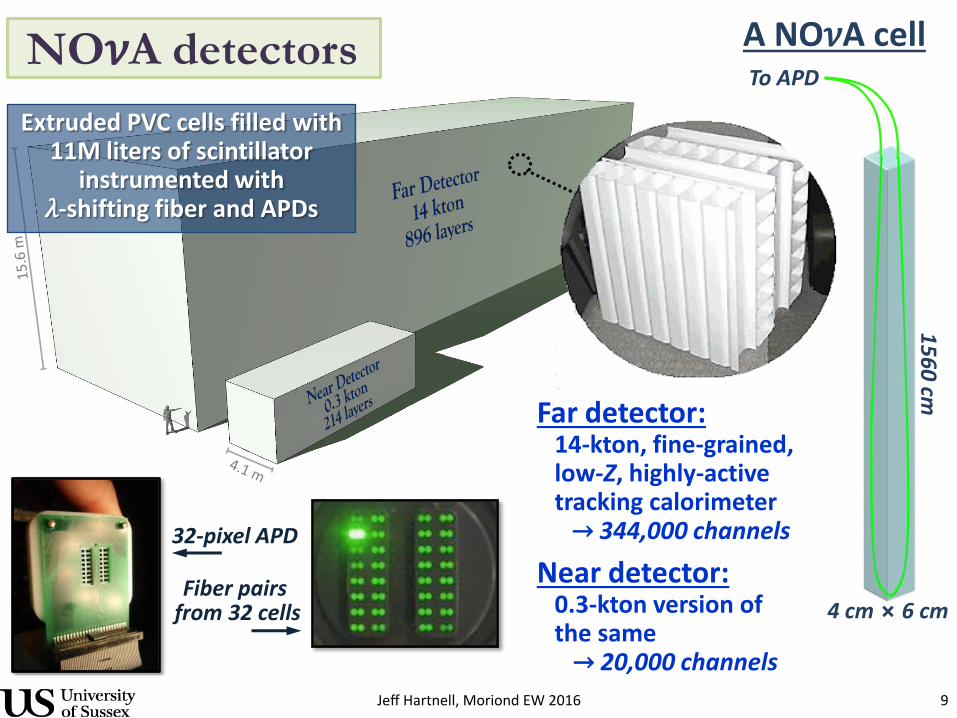
To APD
4 cm ⨯ 6 cm
1560 cm
A NO𝜈A cell NO𝜈A detectors
Fiber pairs from 32 cells
32-pixel APD
Far detector: 14-kton, fine-grained, low-Z, highly-active tracking calorimeter → 344,000 channels
Near detector: 0.3-kton version of the same → 20,000 channels
Extruded PVC cells filled with 11M liters of scintillator
instrumented with 𝜆-shifting fiber and APDs
Ryan Patterson, Caltech Fermilab JETP, August 6, 2015 10
JeffHartnell,MoriondEW2016 10Ryan Patterson, Caltech Fermilab JETP, August 6, 2015 11
JeffHartnell,MoriondEW2016 11
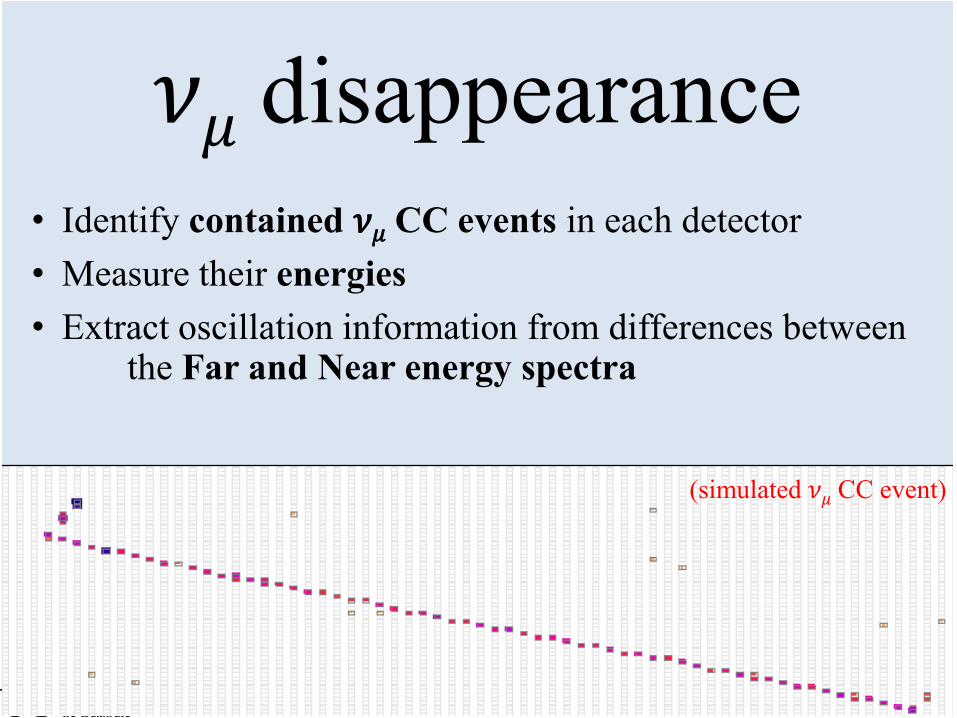
𝜈𝜇 disappearance
(simulated 𝜈𝜇 CC event)
• Identify contained 𝜈𝜇 CC events in each detector • Measure their energies • Extract oscillation information from differences between
the Far and Near energy spectra

JeffHartnell,MoriondEW2016 12
Ryan Patterson, Caltech Fermilab JETP, August 6, 2015 31
JeffHartnell,MoriondEW2016 13
Ryan Patterson, Caltech Fermilab JETP, August 6, 2015 32

JeffHartnell,MoriondEW2016 14
Ryan Patterson, Caltech Fermilab JETP, August 6, 2015 33
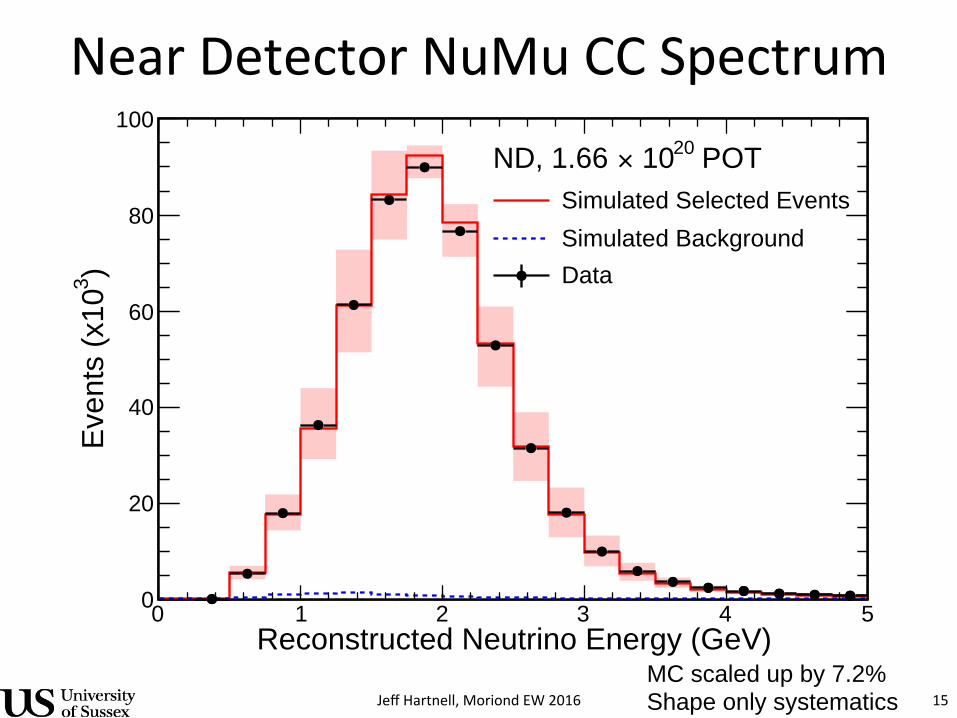
NearDetectorNuMuCCSpectrum
JeffHartnell,MoriondEW2016 15
5
Length of Primary Muon Track (m)0 5 10 15
)3Ev
ents
(x10
0
5
10
15
20
25
30
Simulated Selected EventsSimulated BackgroundData
POT20 10×ND, 1.66
)ZθPrimary Muon Track cos(0 0.2 0.4 0.6 0.8 1
Even
ts
1
10
210
310
410
510
610
Simulated Selected EventsSimulated BackgroundData
POT20 10×ND, 1.66
FIG. 2. Reconstructed track length (left) and track angle ✓Z relative to the detector longitudinal axis, along the beam direction(right) for the primary muons in selected ⌫µ CC interactions in the ND. The simulated distributions follow the conventions ofFig. 1.
Hadronic Energy (GeV)0 0.5 1 1.5 2 2.5 3
)3Ev
ents
(x10
0
20
40
60
80
100DataData (w/o 14% offset)Simulated Selected EventsSimulated Background
POT20 10×ND, 1.66
FIG. 3. Reconstructed hadronic energy Ehad for selected⌫µ CC interactions in the ND, both with (black circles) andwithout (gray squares) the 14% o↵set described in the text.The simulated distributions follow the conventions of Fig. 1.
Figure 2 shows the reconstructed muon track param-eters for ⌫µ CC events in the ND. Figure 3 shows theEhad distribution both with and without the 14% dif-ference in Ehad calibration scale between data and sim-ulation. A corresponding ±14% uncertainty is assessedon the hadronic energy scale, and is included in all ofthe uncertainty bands shown. Figure 4 shows the finalE⌫ distribution. The energy resolution for reconstructed⌫µ CC events is estimated from simulation to be 7%.
The prediction for the FD neutrino energy spectrumis based on the observed ND neutrino energy spectrum,with corrections for acceptance and flux di↵erences de-rived from simulation. First, the small NC background,estimated from simulation, is subtracted from the NDdata spectrum. The resulting background-subtractedspectrum is then converted into a true neutrino energy
Reconstructed Neutrino Energy (GeV)0 1 2 3 4 5
)3Ev
ents
(x10
0
20
40
60
80
100
Simulated Selected EventsSimulated BackgroundData
POT20 10×ND, 1.66
FIG. 4. Reconstructed neutrino energy E⌫ for selected ⌫µ CCinteractions in the ND. The simulated distributions follow theconventions of Fig. 1.
spectrum via a mapping derived from simulation. Thistrue neutrino energy spectrum is then used to constructa spectrum in the FD by multiplying it by the energy-dependent ratio of FD-to-ND selected events from sim-ulation. Oscillation probabilities for a given set of os-cillation parameters are then applied, by energy bin, tothe predicted true FD energy spectrum, which is thenmapped to a reconstructed neutrino energy spectrum us-ing FD simulation. The extrapolated ⌫µ CC energy spec-trum is then combined with beam-induced backgrounds(NC, ⌫e CC, and ⌫⌧ CC) predicted from simulation, andthe background spectrum measured using events selectedfrom outside of the beam spill window.
Systematic uncertainties in the calibration, flux esti-mate, cross sections, hadronization modeling, particle-transport modeling and exposure di↵erences between thetwo detectors are assessed by varying these aspects of the
MC scaled up by 7.2% Shape only systematics
JeffHartnell,MoriondEW2016 16Evan Niner I Results from NOvA 02/11/16
νμ Spectrum
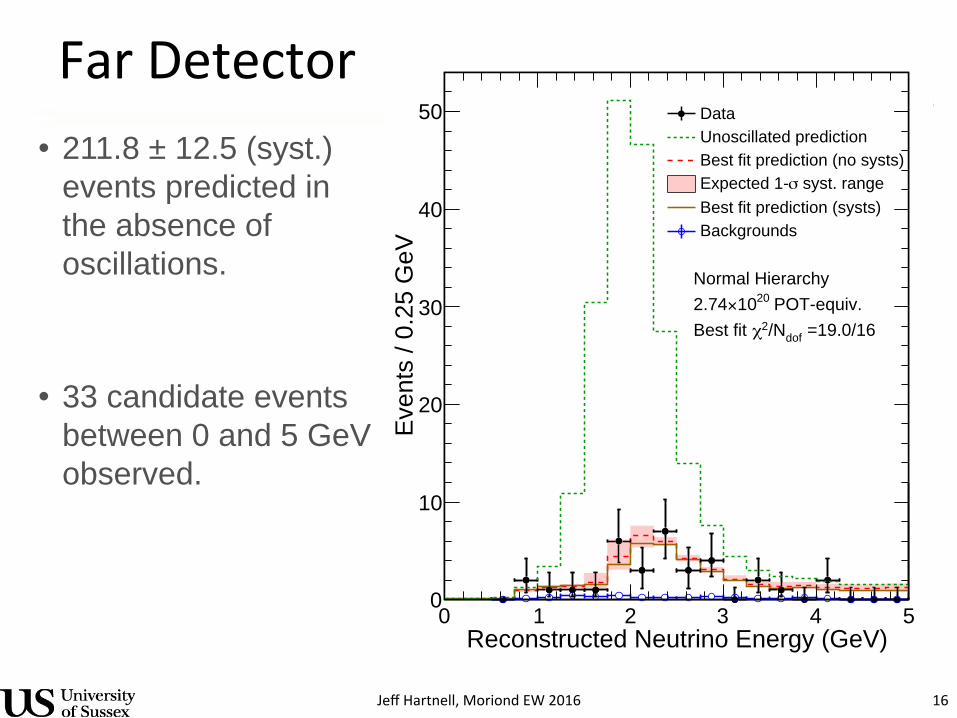
• 211.8 ± 12.5 (syst.) events predicted in the absence of oscillations.
• 33 candidate events between 0 and 5 GeV observed.
12
Reconstructed Neutrino Energy (GeV)0 1 2 3 4 5
Even
ts /
0.25
GeV
0
10
20
30
40
50 DataUnoscillated predictionBest fit prediction (no systs)
syst. rangeσExpected 1-Best fit prediction (systs)Backgrounds
Normal Hierarchy POT-equiv.2010×2.74
=19.0/16dof/N2χBest fit
FarDetector
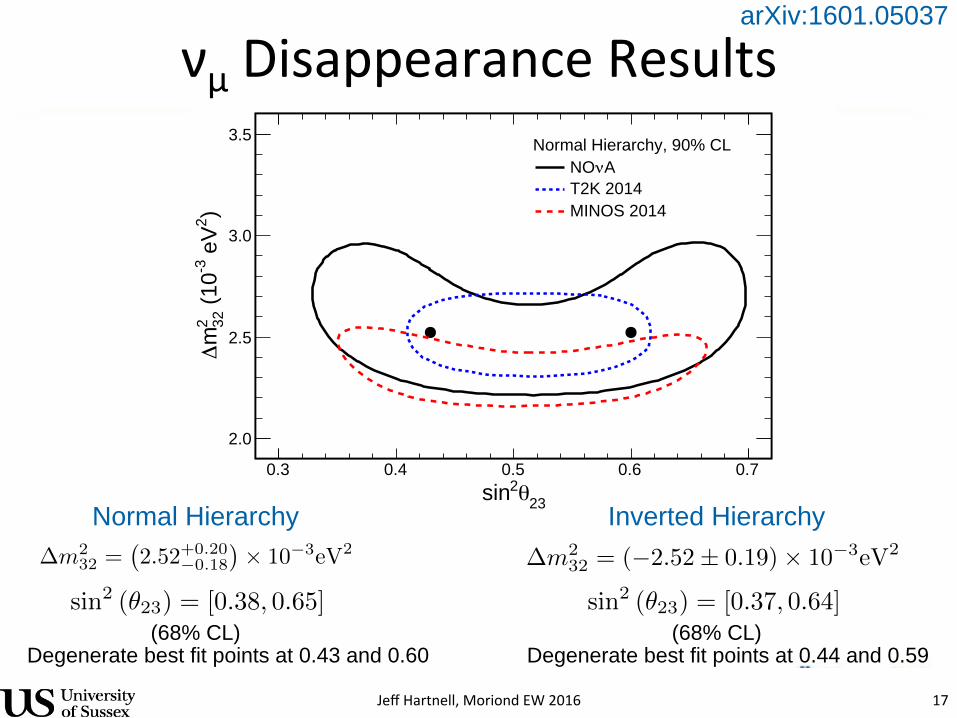
νμDisappearanceResults
JeffHartnell,MoriondEW2016 17Evan Niner I Results from NOvA 02/11/16
Best Fit Oscillation Parameters
13
23θ2sin0.3 0.4 0.5 0.6 0.7
)2 e
V-3
(10
322m
∆
2.0
2.5
3.0
3.5 Normal Hierarchy, 90% CLAνNO
T2K 2014MINOS 2014
arXiv:1601.05037
�m232 =
�2.52+0.20
�0.18
�⇥ 10�3eV2 �m2
32 = (�2.52± 0.19)⇥ 10�3eV2
sin2 (✓23) = [0.38, 0.65] sin2 (✓23) = [0.37, 0.64]
Normal Hierarchy Inverted Hierarchy
(68% CL) (68% CL)Degenerate best fit points at 0.43 and 0.60 Degenerate best fit points at 0.44 and 0.59Evan Niner I Results from NOvA 02/11/16
Best Fit Oscillation Parameters
13
23θ2sin0.3 0.4 0.5 0.6 0.7
)2 e
V-3
(10
322m
∆
2.0
2.5
3.0
3.5 Normal Hierarchy, 90% CLAνNO
T2K 2014MINOS 2014
arXiv:1601.05037
�m232 =
�2.52+0.20
�0.18
�⇥ 10�3eV2 �m2
32 = (�2.52± 0.19)⇥ 10�3eV2
sin2 (✓23) = [0.38, 0.65] sin2 (✓23) = [0.37, 0.64]
Normal Hierarchy Inverted Hierarchy
(68% CL) (68% CL)Degenerate best fit points at 0.43 and 0.60 Degenerate best fit points at 0.44 and 0.59
JeffHartnell,MoriondEW2016 18
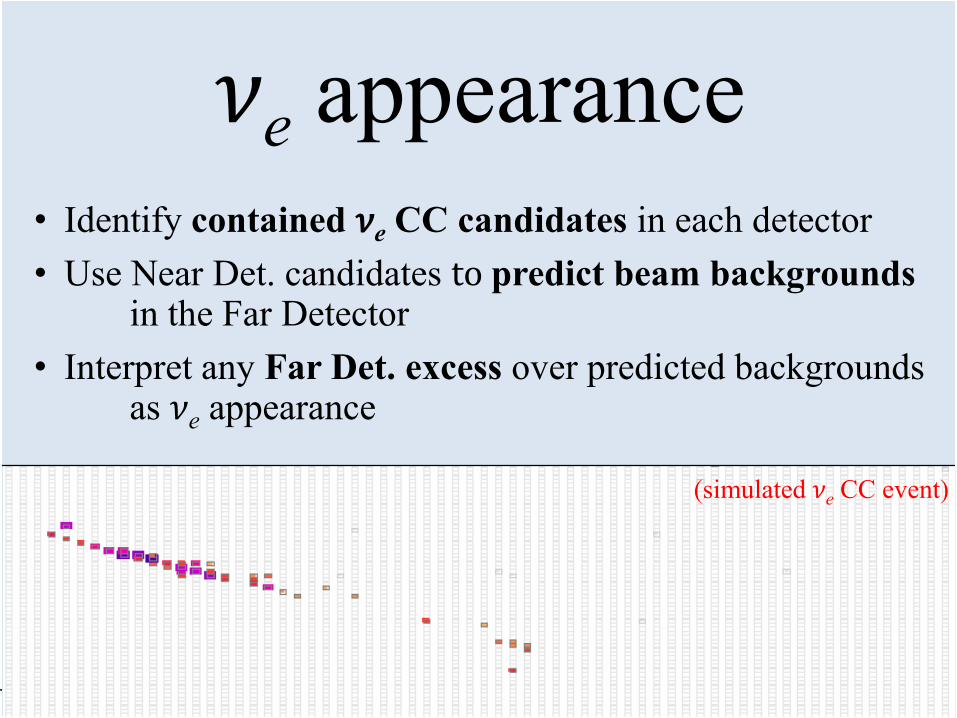
𝜈e appearance
(simulated 𝜈e CC event)
• Identify contained 𝜈e CC candidates in each detector • Use Near Det. candidates to predict beam backgrounds
in the Far Detector • Interpret any Far Det. excess over predicted backgrounds
as 𝜈e appearance
νeSelec?on
JeffHartnell,MoriondEW2016 19Evan Niner I Results from NOvA 02/11/16
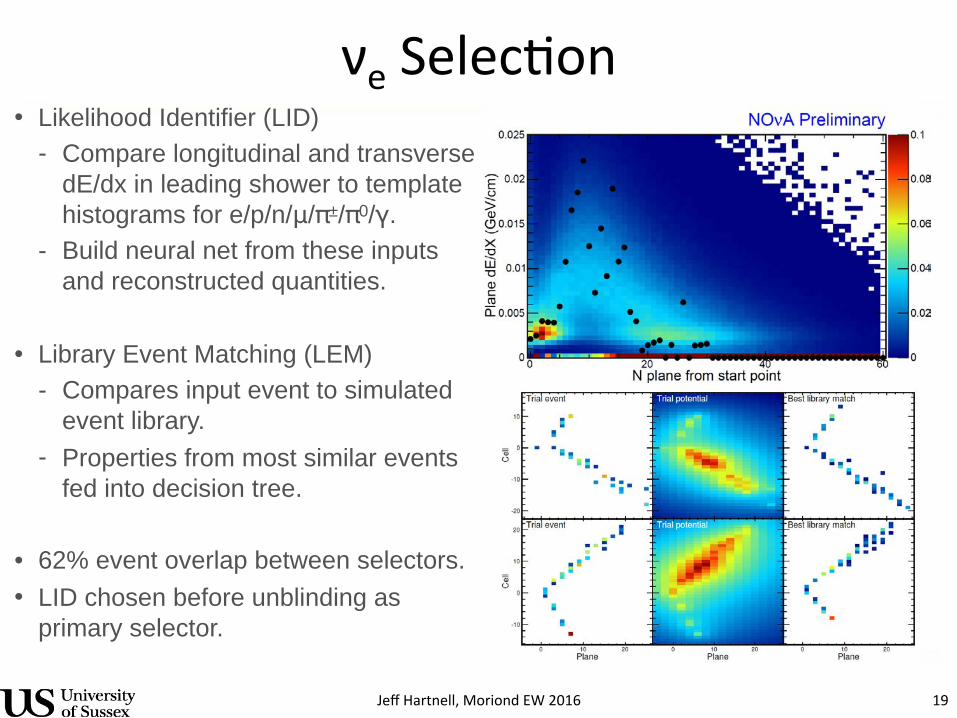
νe Identification• Likelihood Identifier (LID)
- Compare longitudinal and transverse dE/dx in leading shower to template histograms for e/p/n/μ/π±/π0/γ.
- Build neural net from these inputs and reconstructed quantities.
• Library Event Matching (LEM)- Compares input event to simulated
event library.- Properties from most similar events
fed into decision tree.
• 62% event overlap between selectors. • LID chosen before unblinding as
primary selector.
15
JeffHartnell,MoriondEW2016 20
Ryan Patterson, Caltech Fermilab JETP, August 6, 2015 52
JeffHartnell,MoriondEW2016 21
Ryan Patterson, Caltech Fermilab JETP, August 6, 2015 53
JeffHartnell,MoriondEW2016 22
Ryan Patterson, Caltech Fermilab JETP, August 6, 2015 54
νeAppearance
JeffHartnell,MoriondEW2016 23Evan Niner I Results from NOvA 02/11/16
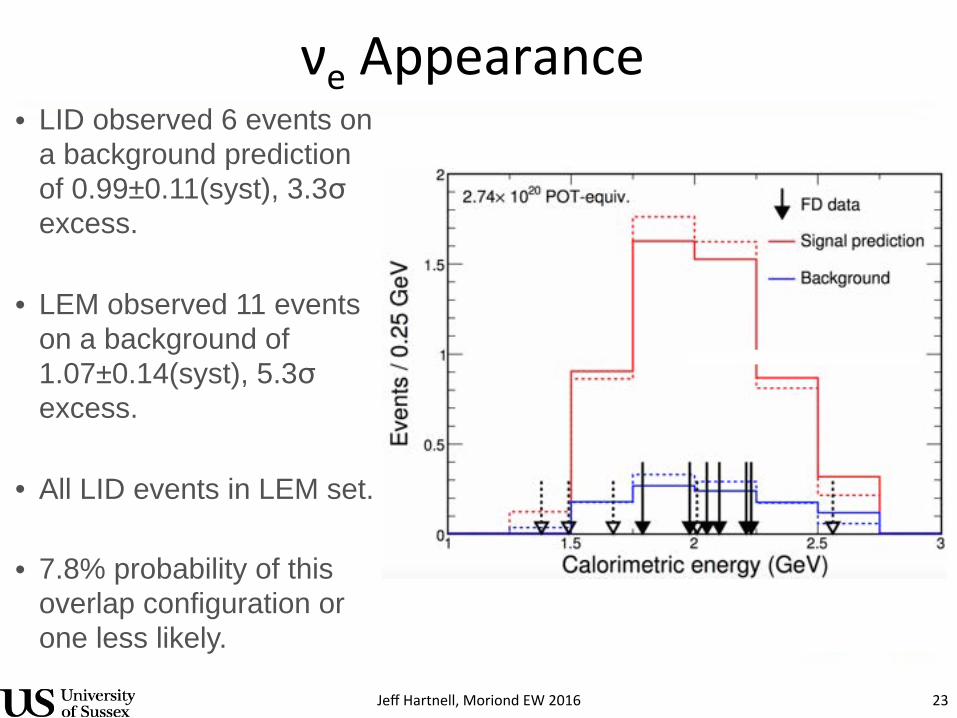
νe Appearance Analysis Results• LID observed 6 events on
a background prediction of 0.99±0.11(syst), 3.3σ excess.
• LEM observed 11 events on a background of 1.07±0.14(syst), 5.3σ excess.
• All LID events in LEM set.
• 7.8% probability of this overlap configuration or one less likely.
17
JeffHartnell,MoriondEW2016 24
Evan Niner I Results from NOvA 02/11/16
νe Appearance Analysis Results
19
0 0.1 0.2 0.3 0.4 0.5
CPδCPδ
13θ22sin
0
2π
π
2π3
π2
2π
π
2π3
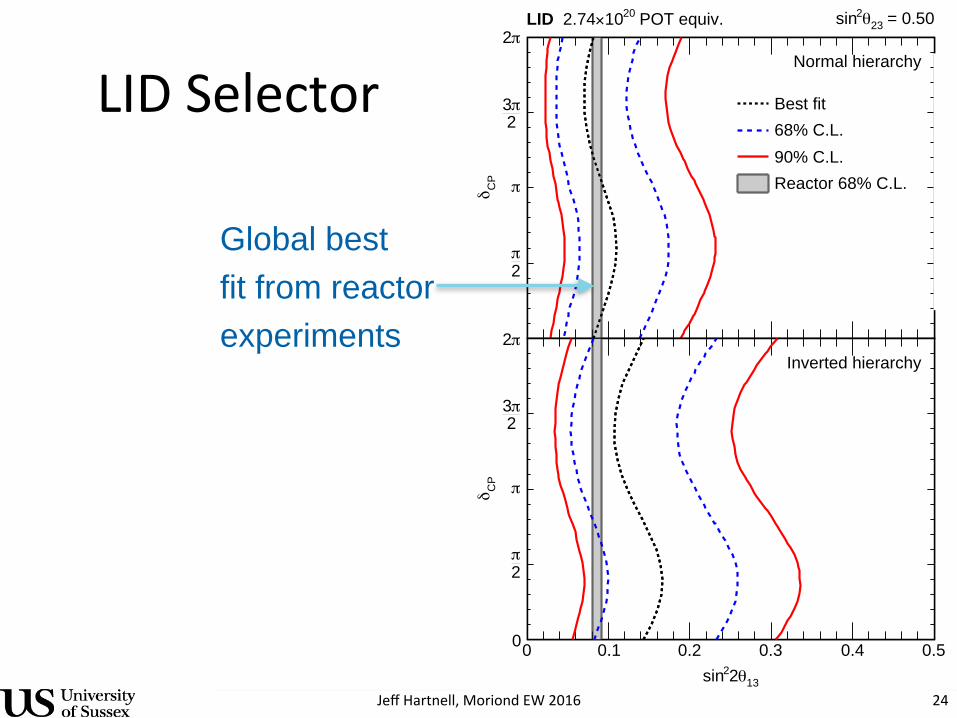
π2 POT equiv.2010× 2.74LID = 0.5023θ2sin
A Preliminary
νNO
Best fit68% C.L.90% C.L.Reactor 68% C.L.
Normal hierarchy
Inverted hierarchy
Normal
2mΔ
221mΔ
Inverted
eν µν τν
Global bestfit from reactor experiments
LIDSelector

JeffHartnell,MoriondEW2016 25Evan Niner I Results from NOvA 02/11/16
νe Appearance Analysis Results
20
0 0.1 0.2 0.3 0.4 0.5
CPδCPδ
13θ22sin
0
2π
π
2π3
π2
2π
π
2π3
π2 POT equiv.2010× 2.74LID = 0.5023θ2sin
A Preliminary
νNO
Best fit68% C.L.90% C.L.Reactor 68% C.L.
Normal hierarchy
Inverted hierarchy
Normal
2mΔ
221mΔ
Inverted
eν µν τν
Global bestfit from reactor experiments
0 0.1 0.2 0.3 0.4 0.5
CPδCPδ
13θ22sin
0
2π
π
2π3
π2
2π
π
2π3
π2 POT equiv.2010× 2.74LEM = 0.5023θ2sin
A Preliminary
νNONormal hierarchy
Inverted hierarchy
LEMSelector

ResultswithReactorConstraint
JeffHartnell,MoriondEW2016 26
Evan Niner I Results from NOvA 02/11/16
Significance with Reactor Constraint
• Apply global reactor constraint- sin2θ13=0.086±0.05
• Marginalize over θ23.• Both selectors weakly
prefer normal mass hierarchy and π<δcp<2π.
• This preference is consistent with T2K (arXiv:1502.01550)
21
CPδ
Sign
ifican
ce
0 /2π π /2π3 π20
σ1
σ2
σ3
σ4
σ5
90%
POT equiv.2010×2.74
NH LID NH LEMIH LID IH LEM
arXiv:1601.05022
Conclusions• FirstNOvAoscilla?onresultswith7.6%ofplannedexposure
• νμdisappearanceconsistentw/MINOS&T2K• νeappearanceresulthintsatnormalhierarchyandπ<δCP<2π,consistentwithT2K
• Cross-sec?onstudiesinprogress,νeCCandcoherentπ0resultsshownatNuINT
• Planning2ndresultwithdoublethesta?s?csforthesummer
• Staytuned!JeffHartnell,MoriondEW2016 27

Backupslides
JeffHartnell,MoriondEW2016 28
JeffHartnell,MoriondEW2016 29Evan Niner I Results from NOvA 02/11/16
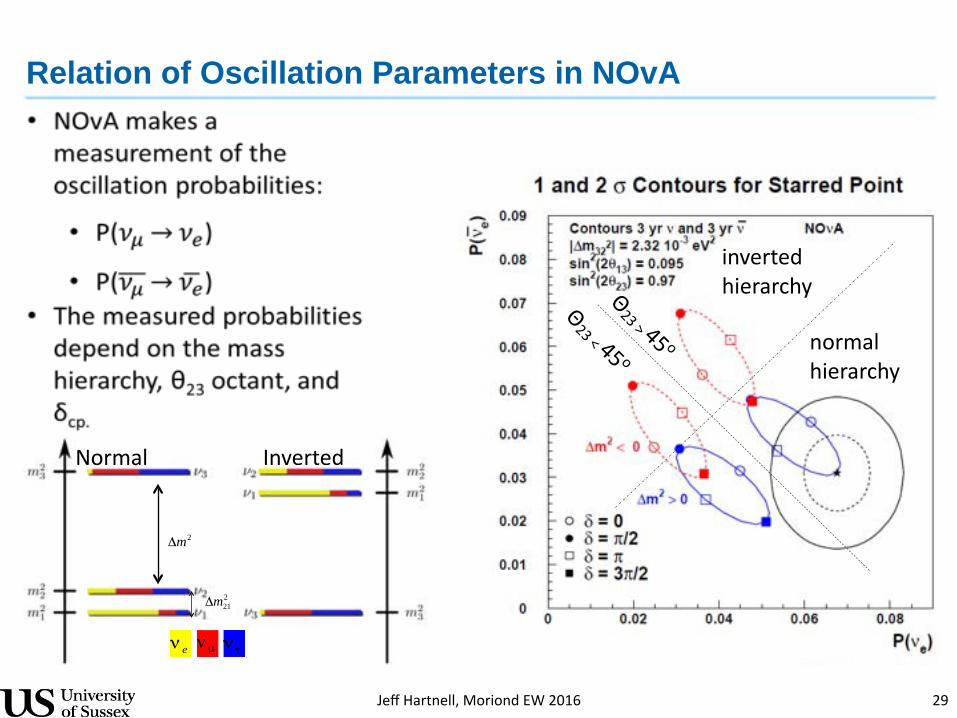
Relation of Oscillation Parameters in NOvA
25
inverted%hierarchy
normal%hierarchy
Θ23%<%45 o
Θ23%>%45 o
%
Normal Inverted
eν µν τν
2mΔ
221mΔ
JeffHartnell,MoriondEW2016 30Evan Niner I Results from NOvA 02/11/16
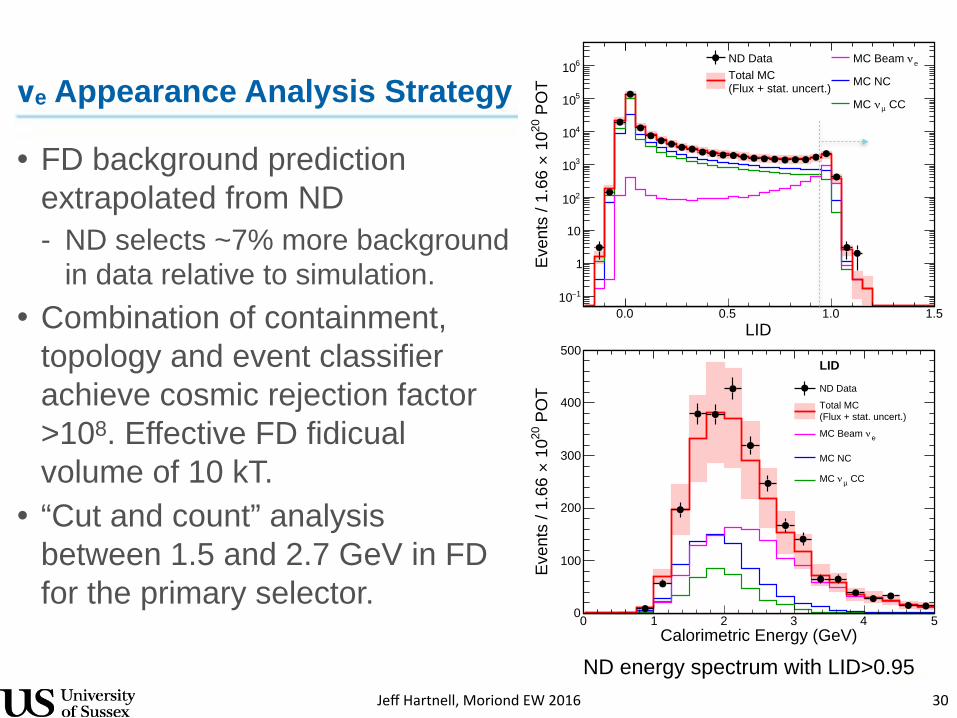
νe Appearance Analysis Strategy
• FD background prediction extrapolated from ND - ND selects ~7% more background
in data relative to simulation. • Combination of containment,
topology and event classifier achieve cosmic rejection factor >108. Effective FD fidicual volume of 10 kT.
• “Cut and count” analysis between 1.5 and 2.7 GeV in FD for the primary selector.
16
Calorimetric Energy (GeV)0 1 2 3 4 5
PO
T20
10
×Ev
ents
/ 1.
66
0
100
200
300
400
500A PreliminaryνNOLID
ND Data
(Flux + stat. uncert.)Total MC
eνMC Beam
MC NC
CCµνMC
LID0.0 0.5 1.0 1.5
PO
T20
10
×Ev
ents
/ 1.
66
1−10
1
10
210
310
410
510
610
A PreliminaryνNOND Data eνMC Beam
(Flux + stat. uncert.)Total MC MC NC
CCµνMC
ND energy spectrum with LID>0.95
JeffHartnell,MoriondEW2016 31Evan Niner I Results from NOvA 02/11/1626
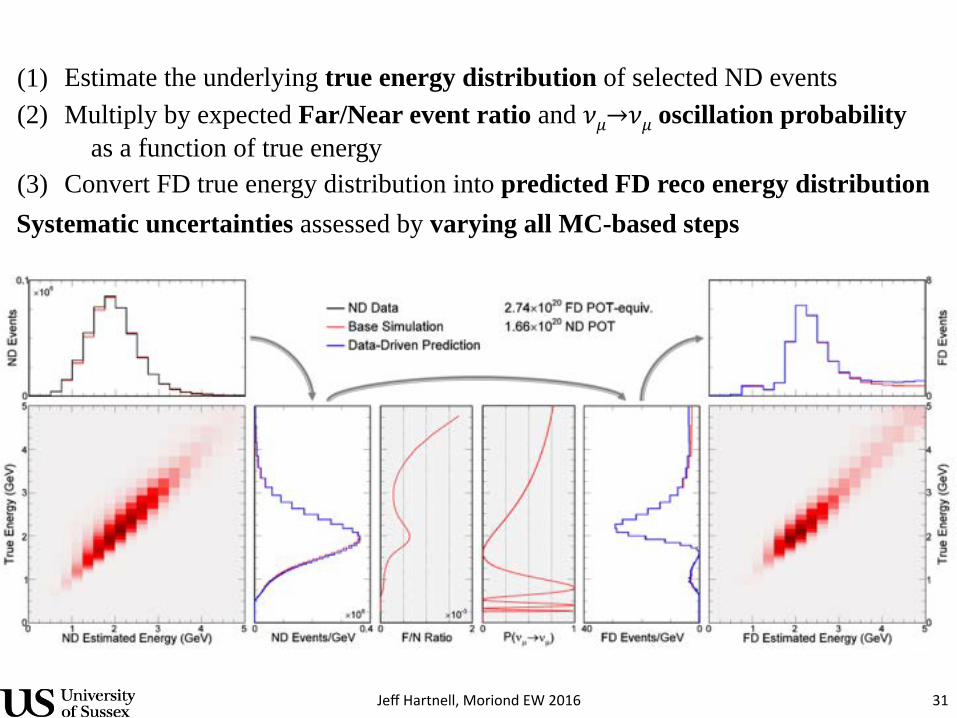
(1) Estimate the underlying true energy distribution of selected ND events(2) Multiply by expected Far/Near event ratio and !"→!" oscillation probability
as a function of true energy(3) Convert FD true energy distribution into predicted FD reco energy distributionSystematic uncertainties assessed by varying all MC-based steps

JeffHartnell,MoriondEW2016 32
Evan Niner I Results from NOvA 02/11/1627
Hadronic Energy (GeV)0 0.5 1 1.5 2 2.5 3
)3Ev
ents
(x10
0
20
40
60
80
100DataData (w/o 14% offset)Simulated Selected EventsSimulated Background
POT20 10×ND, 1.66
Length of Primary Muon Track (m)0 5 10 15
)3Ev
ents
(x10
0
5
10
15
20
25
30
Simulated Selected EventsSimulated BackgroundData
POT20 10×ND, 1.66
E⌫ = Eµ + Ehadrons
• Muon variables in agreement• Best fit to hadronic energy prefers 14% increase in data
JeffHartnell,MoriondEW2016 33Evan Niner I Results from NOvA 02/11/1629
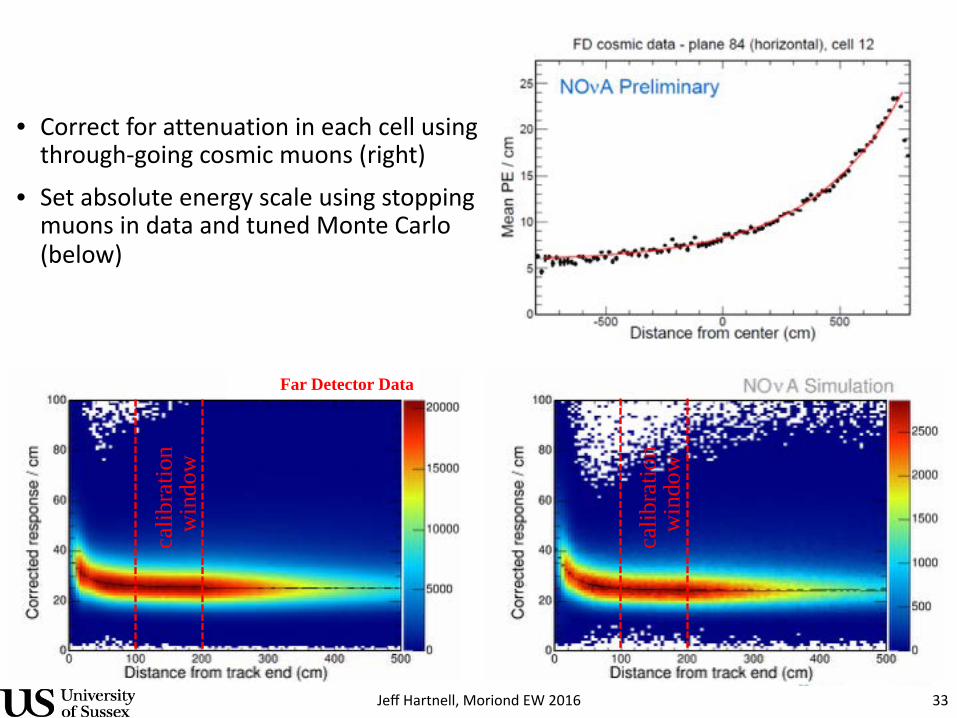
• Correct%for%attenuation%in%each%cell%using%throughGgoing%cosmic%muons%(right)%
• Set%absolute%energy%scale%using%stopping%muons%in%data%and%tuned%Monte%Carlo%(below)
calib
ratio
n w
indo
w
Far Detector Data
calib
ratio
n w
indo
w
JeffHartnell,MoriondEW2016 34[G. Feldman]
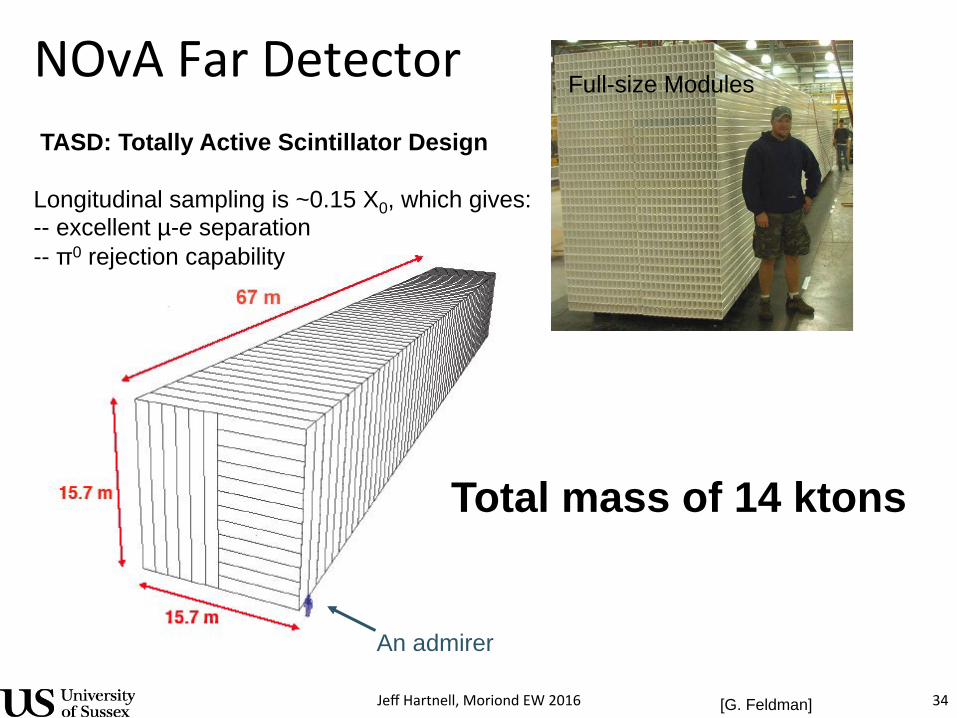
NOvAFarDetector
Total mass of 14 ktons
An admirer
TASD: Totally Active Scintillator Design Longitudinal sampling is ~0.15 X0, which gives: -- excellent µ-e separation -- π0 rejection capability
Full-size Modules

JeffHartnell,MoriondEW2016 35[L. Corwin]

JeffHartnell,MoriondEW2016 36[L. Corwin]
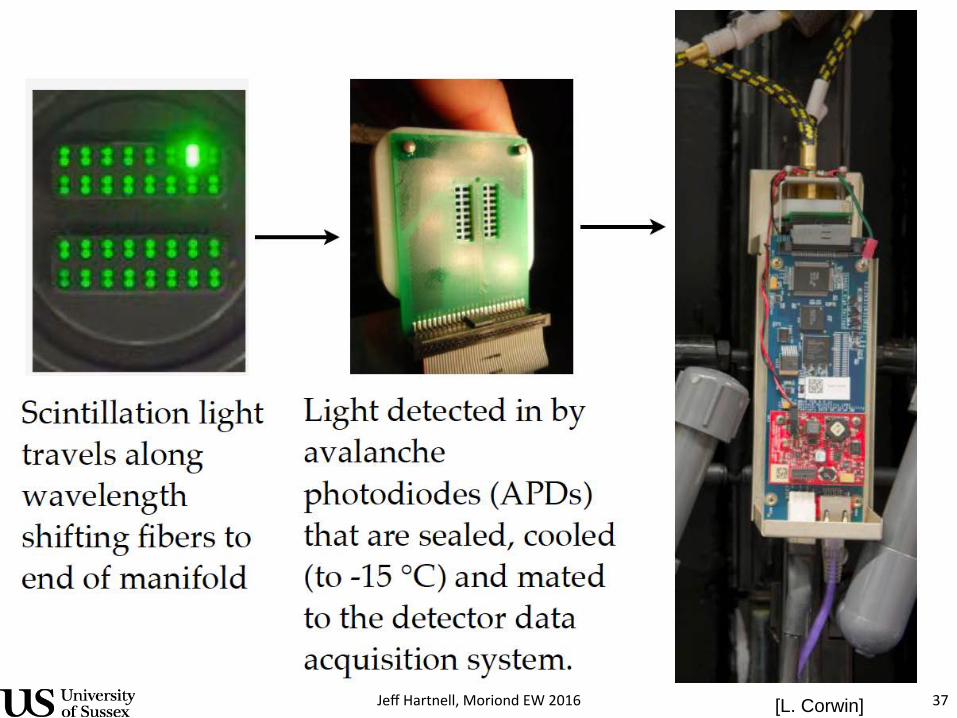
JeffHartnell,MoriondEW2016 37[L. Corwin]
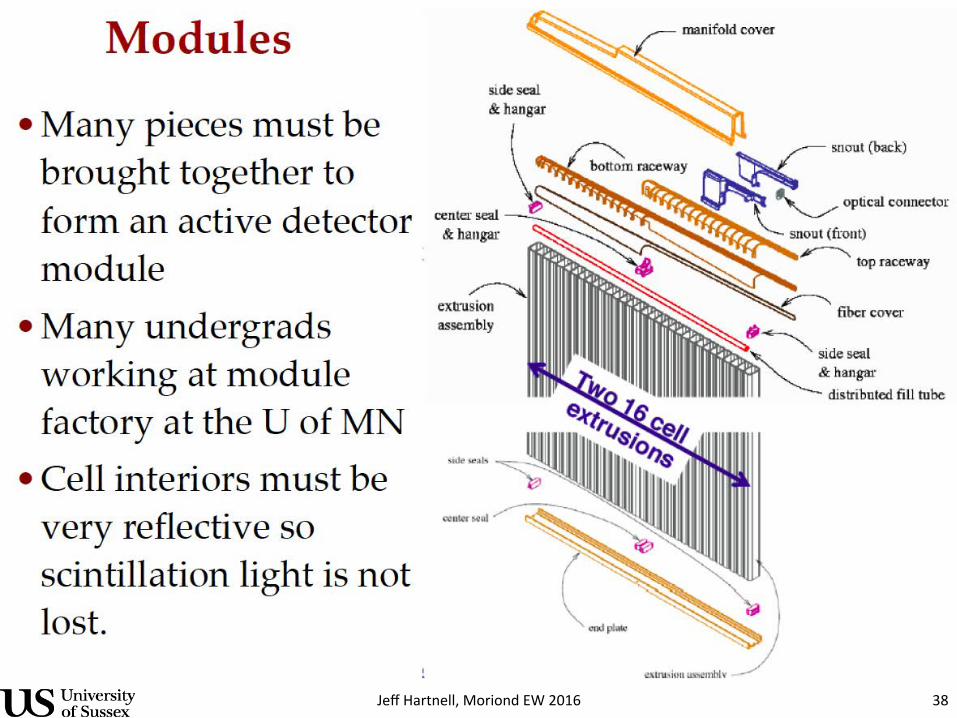
JeffHartnell,MoriondEW2016 38

JeffHartnell,MoriondEW2016 39[L. Corwin]

JeffHartnell,MoriondEW2016 40[L. Corwin]

JeffHartnell,MoriondEW2016 41
Very cool time lapse video: http://www.youtube.com/watch?v=gFpK00WJl90&sns=tw