fy2014 first-quarter financial results€¦ · fy2014 first-quarter financial results ... fy14 25
TRANSCRIPT
July 28, 2014Nissan Motor Co., Ltd
FY2014 first-quarterfinancial results
www.nissan-global.com 2(C) Copyright NISSAN MOTOR CO., LTD.xxxx All rights reserved. www.nissan-global.com
(C) Copyright NISSAN MOTOR CO., LTD.All rights reserved. 2
Net revenue
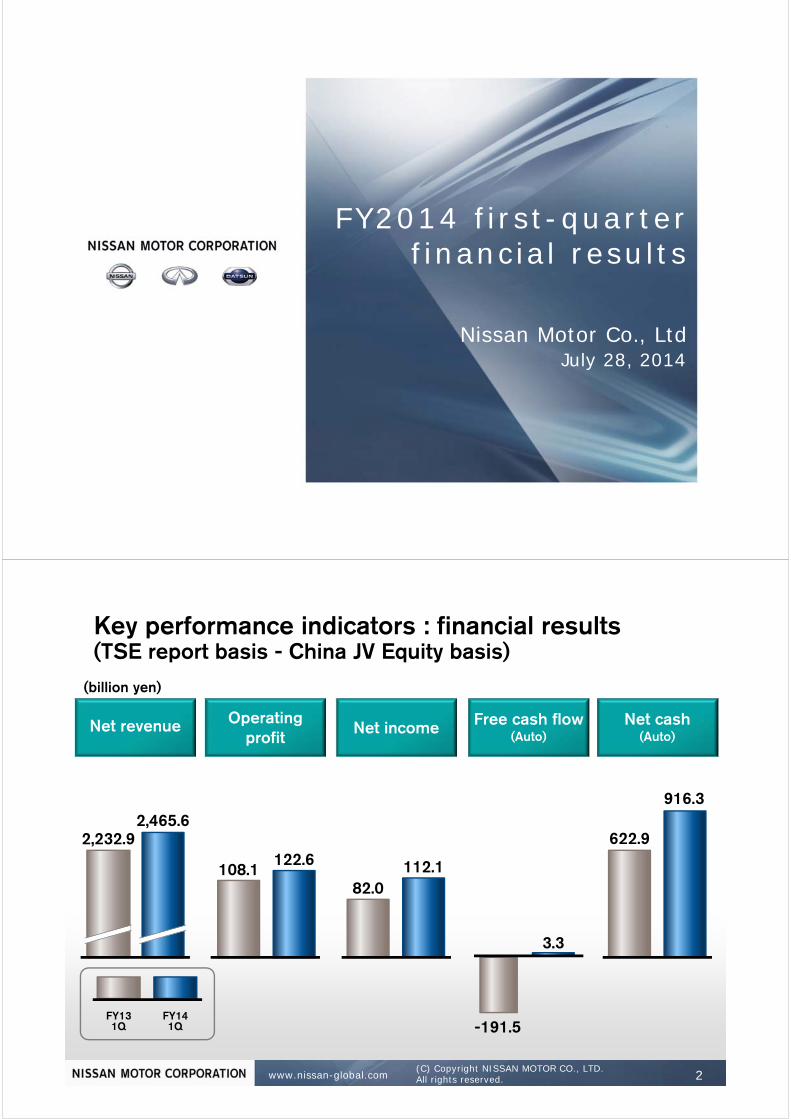
(billion yen)
Operating profit Net income Free cash flow
(Auto)Net cash
(Auto)
108.1122.6
82.0112.1
-191.5
3.3
622.9
916.3
2,232.92,465.6
Key performance indicators : financial results(TSE report basis - China JV Equity basis)
FY141Q
FY131Q
www.nissan-global.com 3(C) Copyright NISSAN MOTOR CO., LTD.xxxx All rights reserved. www.nissan-global.com
(C) Copyright NISSAN MOTOR CO., LTD.All rights reserved. 3
FY14 1st quarterconsolidated financial performance
FY14 1st quarter sales performance
FY14 business update
www.nissan-global.com 4(C) Copyright NISSAN MOTOR CO., LTD.xxxx All rights reserved. www.nissan-global.com
(C) Copyright NISSAN MOTOR CO., LTD.All rights reserved. 4
FY14 business update
Common Module Families updateCommon Module Families update
Cumulative sales
www.nissan-global.com 5(C) Copyright NISSAN MOTOR CO., LTD.xxxx All rights reserved. www.nissan-global.com
(C) Copyright NISSAN MOTOR CO., LTD.All rights reserved. 5
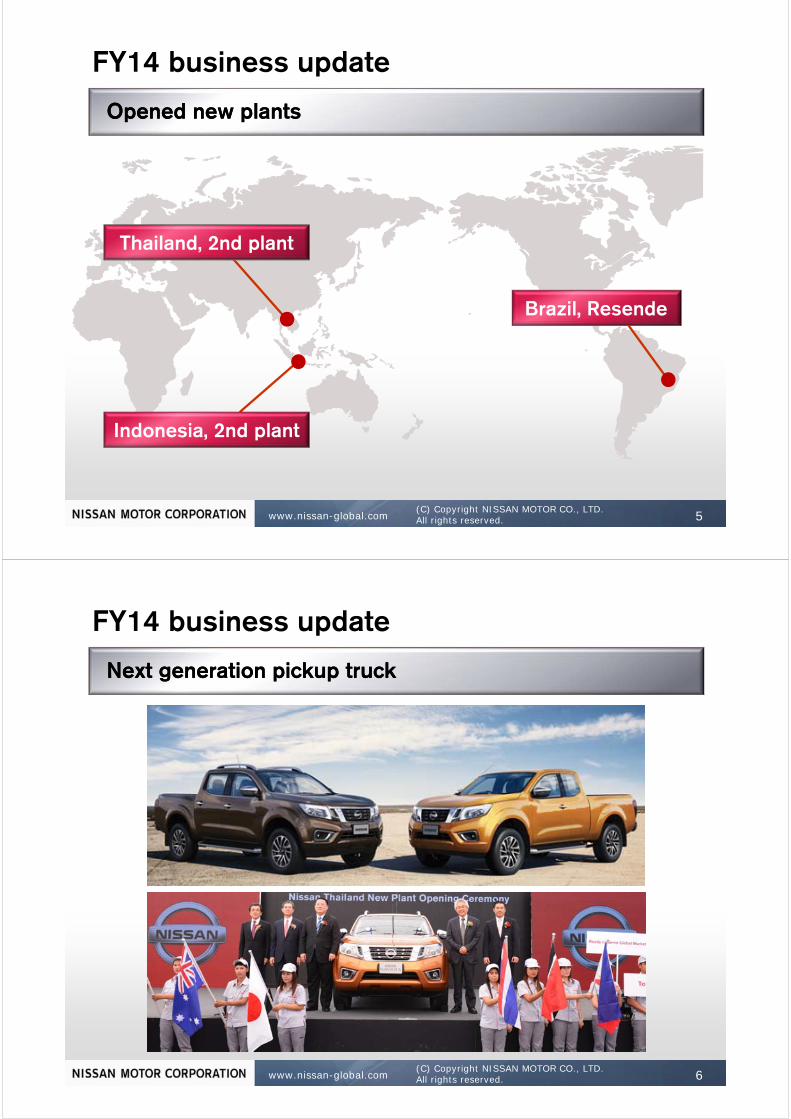
FY14 business update
Opened new plantsOpened new plants
Cumulative sales
Thailand, 2nd plant
Brazil, Resende
Indonesia, 2nd plant
www.nissan-global.com 6(C) Copyright NISSAN MOTOR CO., LTD.xxxx All rights reserved. www.nissan-global.com
(C) Copyright NISSAN MOTOR CO., LTD.All rights reserved. 6
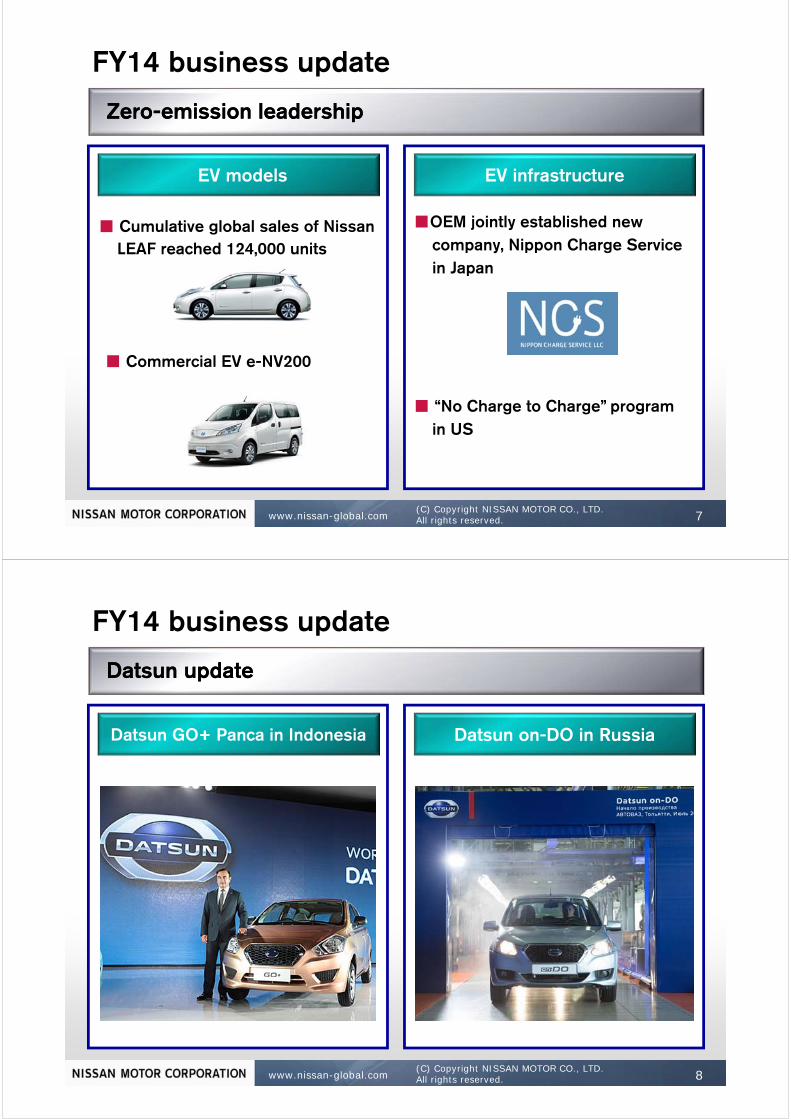
FY14 business update
Next generation pickup truckNext generation pickup truck
www.nissan-global.com 7(C) Copyright NISSAN MOTOR CO., LTD.xxxx All rights reserved. www.nissan-global.com
(C) Copyright NISSAN MOTOR CO., LTD.All rights reserved. 7
FY14 business update
EV models EV infrastructure
■OEM jointly established new company, Nippon Charge Service in Japan
■ “No Charge to Charge” programin US
■ Cumulative global sales of NissanLEAF reached 124,000 units
■ Commercial EV e-NV200
Zero-emission leadershipZero-emission leadership
www.nissan-global.com 8(C) Copyright NISSAN MOTOR CO., LTD.xxxx All rights reserved. www.nissan-global.com
(C) Copyright NISSAN MOTOR CO., LTD.All rights reserved. 8
FY14 business update
Datsun update Datsun update
Datsun GO+ Panca in Indonesia Datsun on-DO in Russia
www.nissan-global.com 9(C) Copyright NISSAN MOTOR CO., LTD.xxxx All rights reserved. www.nissan-global.com
(C) Copyright NISSAN MOTOR CO., LTD.All rights reserved. 9
FY14 business update
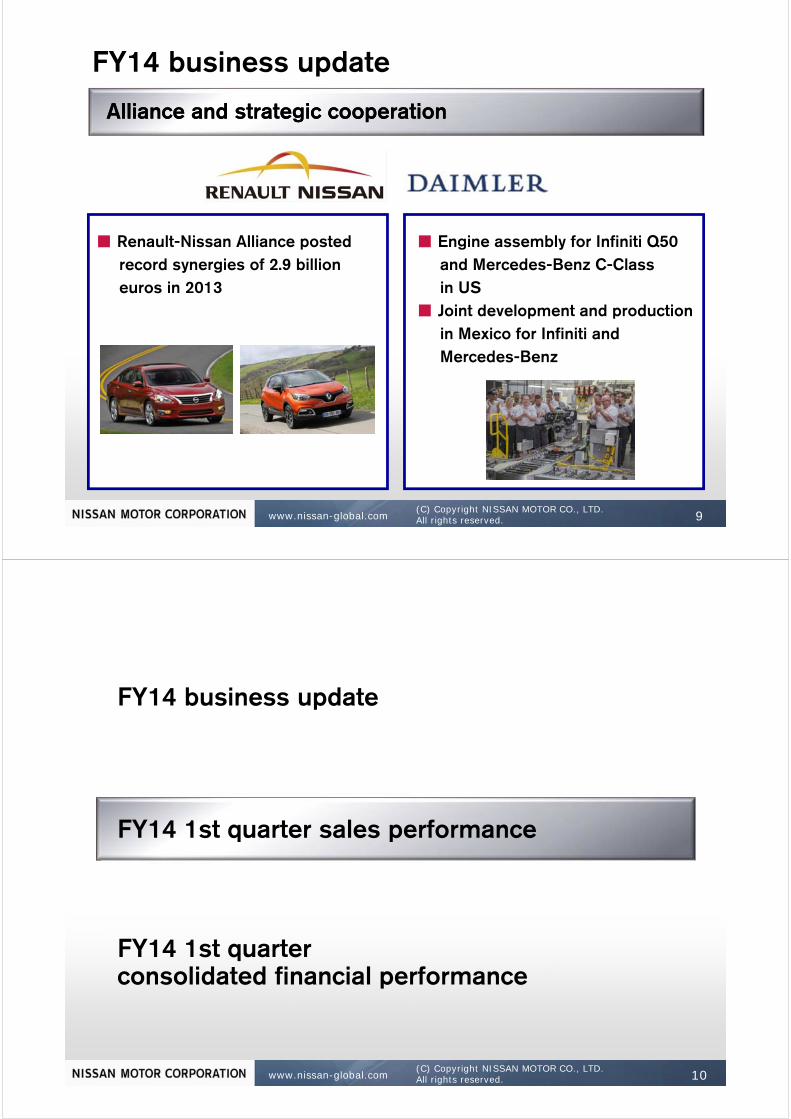
Alliance and strategic cooperationAlliance and strategic cooperation
■ Renault-Nissan Alliance posted record synergies of 2.9 billioneuros in 2013
■ Engine assembly for Infiniti Q50and Mercedes-Benz C-Classin US
■ Joint development and productionin Mexico for Infiniti and Mercedes-Benz
www.nissan-global.com 10(C) Copyright NISSAN MOTOR CO., LTD.xxxx All rights reserved. www.nissan-global.com
(C) Copyright NISSAN MOTOR CO., LTD.All rights reserved. 10
FY14 1st quarterconsolidated financial performance
FY14 1st quarter sales performance
FY14 business update
www.nissan-global.com 11(C) Copyright NISSAN MOTOR CO., LTD.xxxx All rights reserved. www.nissan-global.com
(C) Copyright NISSAN MOTOR CO., LTD.All rights reserved. 11
(tho
usan
d un
its)
FY141Q
FY131Q
+13.3%Europe
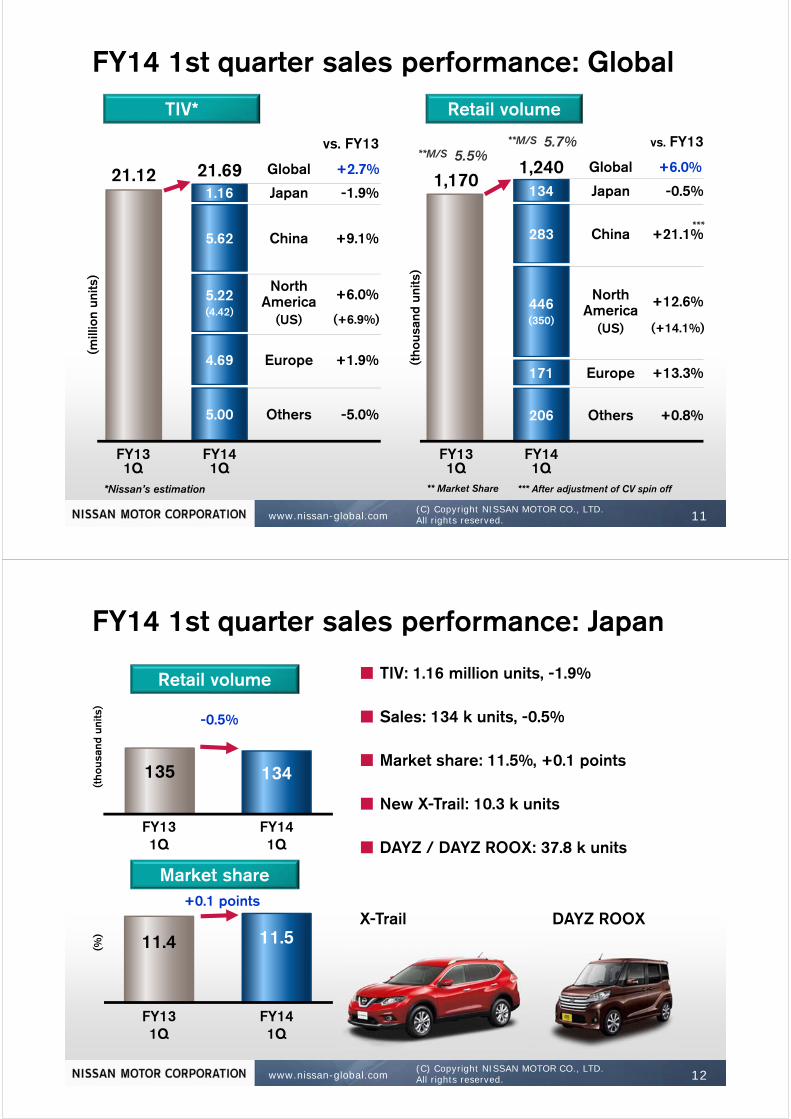
-0.5%Japan
+0.8%Others
Global +6.0%
+21.1%China
+12.6%North America
(US)
(mill
ion
units
)
FY141Q
FY131Q
+1.9%Europe
-1.9%Japan
-5.0%Others
vs. FY13
Global +2.7%
+9.1%China
+6.0%North America
(US)
vs. FY13
*Nissan’s estimation
1,2401,17021.6921.12
5.5%**M/S5.7%**M/S
** Market Share
5.62
4.69
5.22(4.42)
5.00
1.16
283
171
446(350)
134
206
TIV* Retail volume
*** After adjustment of CV spin off
***
FY14 1st quarter sales performance: Global
(+6.9%)(+14.1%)
www.nissan-global.com 12(C) Copyright NISSAN MOTOR CO., LTD.xxxx All rights reserved. www.nissan-global.com
(C) Copyright NISSAN MOTOR CO., LTD.All rights reserved. 12
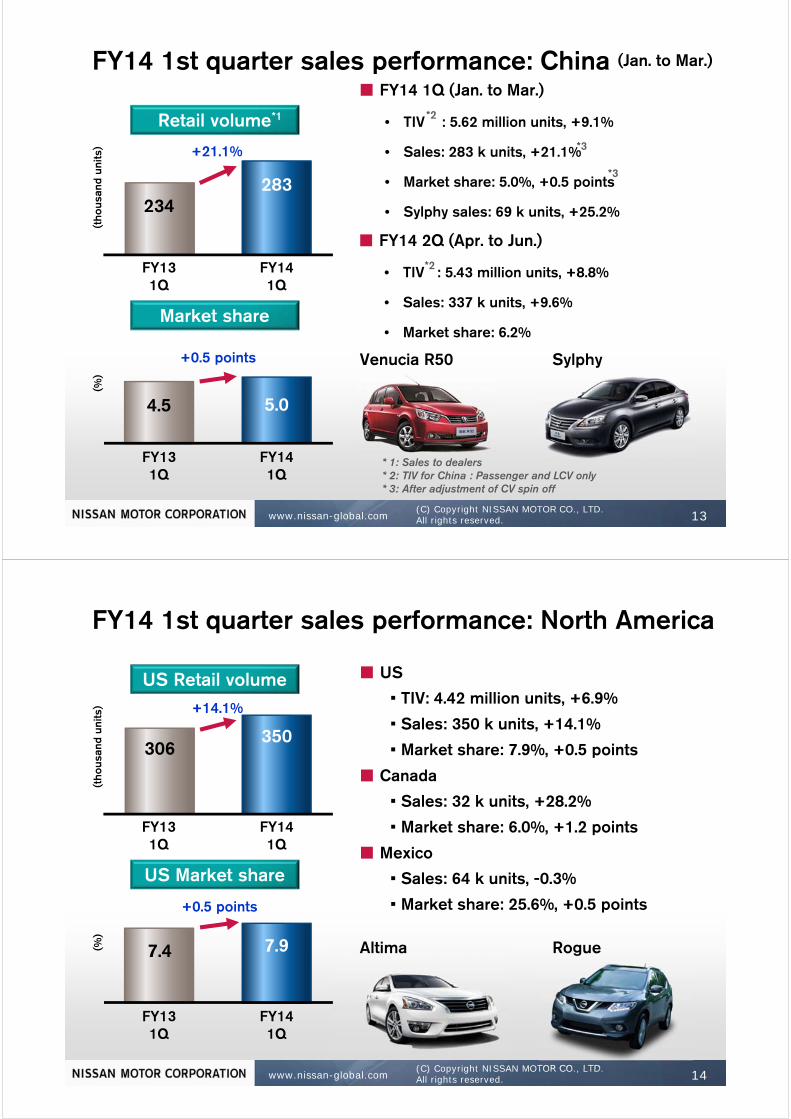
■ TIV: 1.16 million units, -1.9%
■ Sales: 134 k units, -0.5%
■ Market share: 11.5%, +0.1 points
■ New X-Trail: 10.3 k units
■ DAYZ / DAYZ ROOX: 37.8 k units FY131Q
FY141Q
FY131Q
11.4
+0.1 points
11.5
135
-0.5%
134
FY141Q
X-Trail
(tho
usan
d un
its)
(%)
Retail volume
Market share
FY14 1st quarter sales performance: Japan
DAYZ ROOX
www.nissan-global.com 13(C) Copyright NISSAN MOTOR CO., LTD.xxxx All rights reserved. www.nissan-global.com
(C) Copyright NISSAN MOTOR CO., LTD.All rights reserved. 13
Retail volume
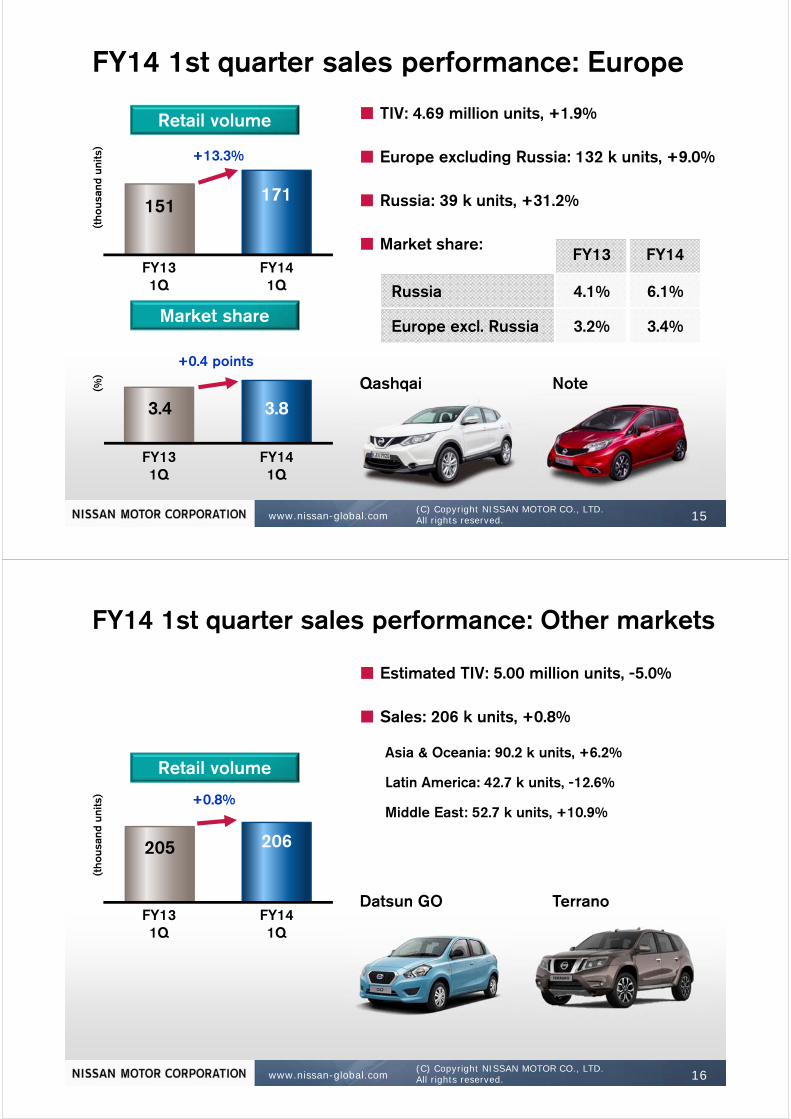
■ FY14 1Q (Jan. to Mar.)
• TIV : 5.62 million units, +9.1%
• Sales: 283 k units, +21.1%
• Market share: 5.0%, +0.5 points
• Sylphy sales: 69 k units, +25.2%
* 2: TIV for China : Passenger and LCV only* 1: Sales to dealers
* 3: After adjustment of CV spin off
+0.5 points
+21.1%
*1
*3
FY14 1st quarter sales performance: China (Jan. to Mar.)
*2
■ FY14 2Q (Apr. to Jun.)
• TIV : 5.43 million units, +8.8%
• Sales: 337 k units, +9.6%
• Market share: 6.2%
*2
*3
FY131Q
FY141Q
FY131Q
FY141Q
(tho
usan
d un
its)
(%)
Market share
4.5 5.0
234283
Venucia R50 Sylphy
www.nissan-global.com 14(C) Copyright NISSAN MOTOR CO., LTD.xxxx All rights reserved. www.nissan-global.com
(C) Copyright NISSAN MOTOR CO., LTD.All rights reserved. 14
■ US
• TIV: 4.42 million units, +6.9%
• Sales: 350 k units, +14.1%
• Market share: 7.9%, +0.5 points
■ Canada
• Sales: 32 k units, +28.2%
• Market share: 6.0%, +1.2 points
■ Mexico
• Sales: 64 k units, -0.3%
• Market share: 25.6%, +0.5 points
7.4 7.9
350306
+14.1%
+0.5 points
FY14 1st quarter sales performance: North America
FY131Q
FY141Q
FY141Q
(tho
usan
d un
its)
(%)
US Retail volume
US Market share
FY131Q
Altima Rogue
www.nissan-global.com 15(C) Copyright NISSAN MOTOR CO., LTD.xxxx All rights reserved. www.nissan-global.com
(C) Copyright NISSAN MOTOR CO., LTD.All rights reserved. 15
■ TIV: 4.69 million units, +1.9%
■ Europe excluding Russia: 132 k units, +9.0%
■ Russia: 39 k units, +31.2%
■ Market share:
3.4 3.8
+13.3%
Russia
FY13 FY14
4.1% 6.1%
Europe excl. Russia 3.2% 3.4%
FY14 1st quarter sales performance: Europe
FY131Q
FY141Q
FY131Q
FY141Q
(tho
usan
d un
its)
(%)
Retail volume
Market share
171151
Qashqai Note+0.4 points
www.nissan-global.com 16(C) Copyright NISSAN MOTOR CO., LTD.xxxx All rights reserved. www.nissan-global.com
(C) Copyright NISSAN MOTOR CO., LTD.All rights reserved. 16
■ Estimated TIV: 5.00 million units, -5.0%
■ Sales: 206 k units, +0.8%
Asia & Oceania: 90.2 k units, +6.2%
Latin America: 42.7 k units, -12.6%
Middle East: 52.7 k units, +10.9%+0.8%
205 206
FY14 1st quarter sales performance: Other markets
FY131Q
FY141Q
(tho
usan
d un
its)
Retail volume
Datsun GO Terrano
www.nissan-global.com 17(C) Copyright NISSAN MOTOR CO., LTD.xxxx All rights reserved. www.nissan-global.com
(C) Copyright NISSAN MOTOR CO., LTD.All rights reserved. 17
FY14 1st quarterconsolidated financial performance
FY14 1st quarter sales performance
FY14 business update
www.nissan-global.com 18(C) Copyright NISSAN MOTOR CO., LTD.xxxx All rights reserved. www.nissan-global.com
(C) Copyright NISSAN MOTOR CO., LTD.All rights reserved. 18
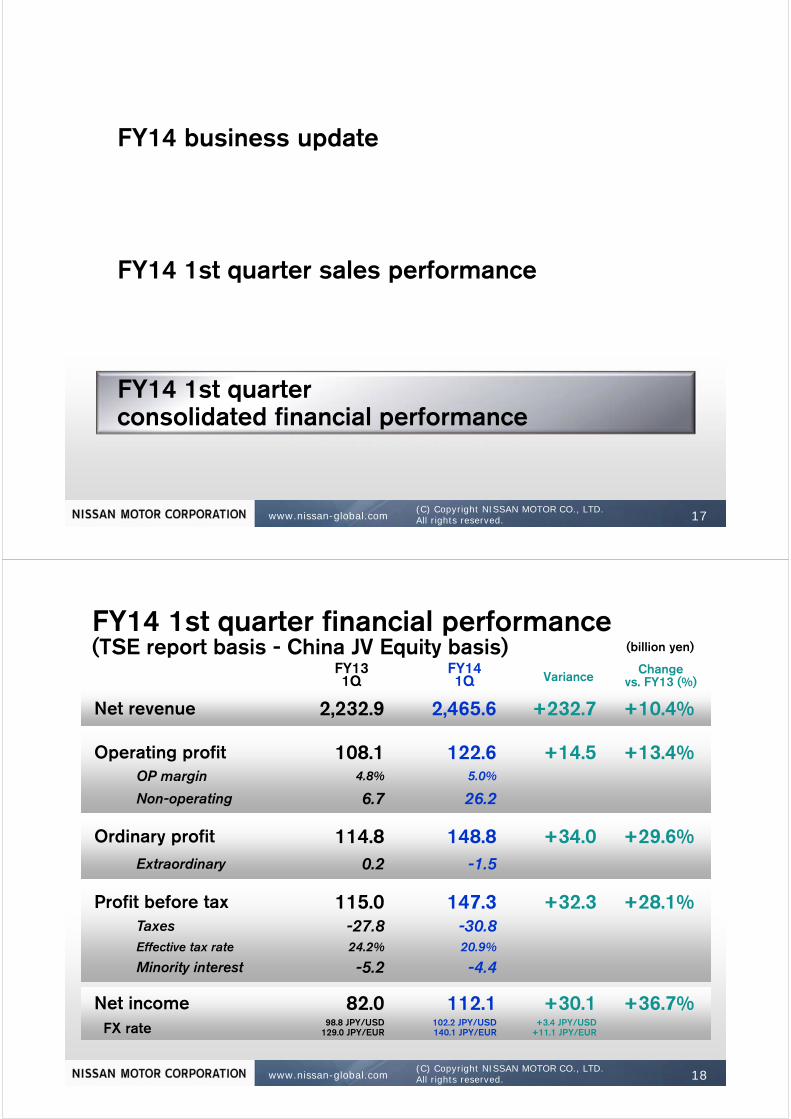
(billion yen)
Operating profit
148.8 +34.0Ordinary profit
147.3 +32.3
Non-operating
-1.5Extraordinary
108.1
114.8
6.7
Profit before tax
VarianceFY131Q
FX rate 102.2 JPY/USD 140.1 JPY/EUR
98.8 JPY/USD129.0 JPY/EUR
0.2
115.0
Net revenue 2,232.9
122.6
26.2
2,465.6 +232.7
+14.5
Net income
Taxes -30.8
Minority interest -4.4
-27.8
-5.2
+30.1
+10.4%
+13.4%
+29.6%
+28.1%
+36.7%
Effective tax rate 20.9%24.2%
Change vs. FY13 (%)
OP margin 5.0%4.8%
82.0 112.1
FY141Q
(TSE report basis - China JV Equity basis)FY14 1st quarter financial performance
+3.4 JPY/USD+11.1 JPY/EUR
www.nissan-global.com(C) Copyright NISSAN MOTOR CO., LTD.All rights reserved. 19
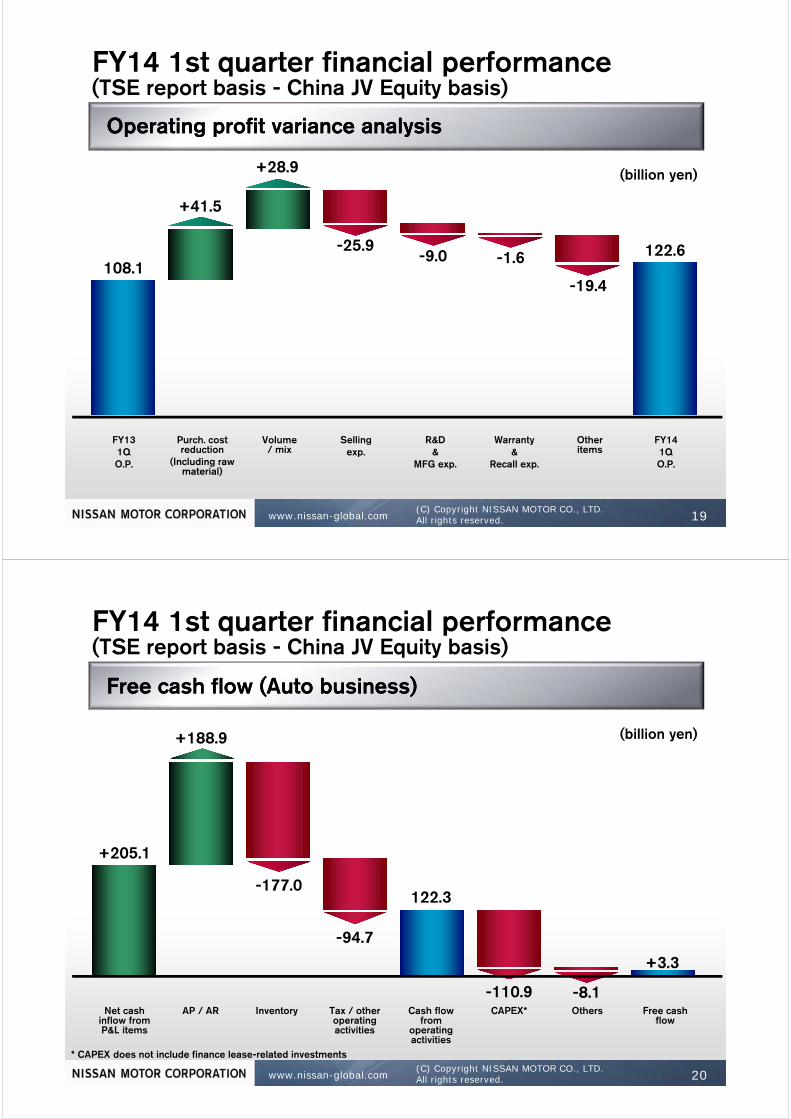
FY14 1st quarter financial performance(TSE report basis - China JV Equity basis)
Operating profit variance analysisOperating profit variance analysis
108.1
+41.5
+28.9
-25.9-9.0 -1.6
-19.4
122.6
FY131QO.P.
Selling exp.
R&D&
MFG exp.
FY141Q O.P.
Purch. cost reduction
(Including raw material)
Warranty&
Recall exp.
Volume / mix
Other items
(billion yen)
www.nissan-global.com 20(C) Copyright NISSAN MOTOR CO., LTD.xxxx All rights reserved. www.nissan-global.com
(C) Copyright NISSAN MOTOR CO., LTD.All rights reserved. 20
* CAPEX does not include finance lease-related investments
Free cash flow (Auto business)Free cash flow (Auto business)
(TSE report basis - China JV Equity basis)FY14 1st quarter financial performance
Net cash inflow from P&L items
AP / AR Inventory Cash flow from
operating activities
OthersCAPEX*Tax / other operating activities
Free cash flow
+3.3
-8.1
(billion yen)
+205.1
+188.9
-177.0
-94.7
-110.9
122.3
www.nissan-global.com 21(C) Copyright NISSAN MOTOR CO., LTD.xxxx All rights reserved. www.nissan-global.com
(C) Copyright NISSAN MOTOR CO., LTD.All rights reserved. 21
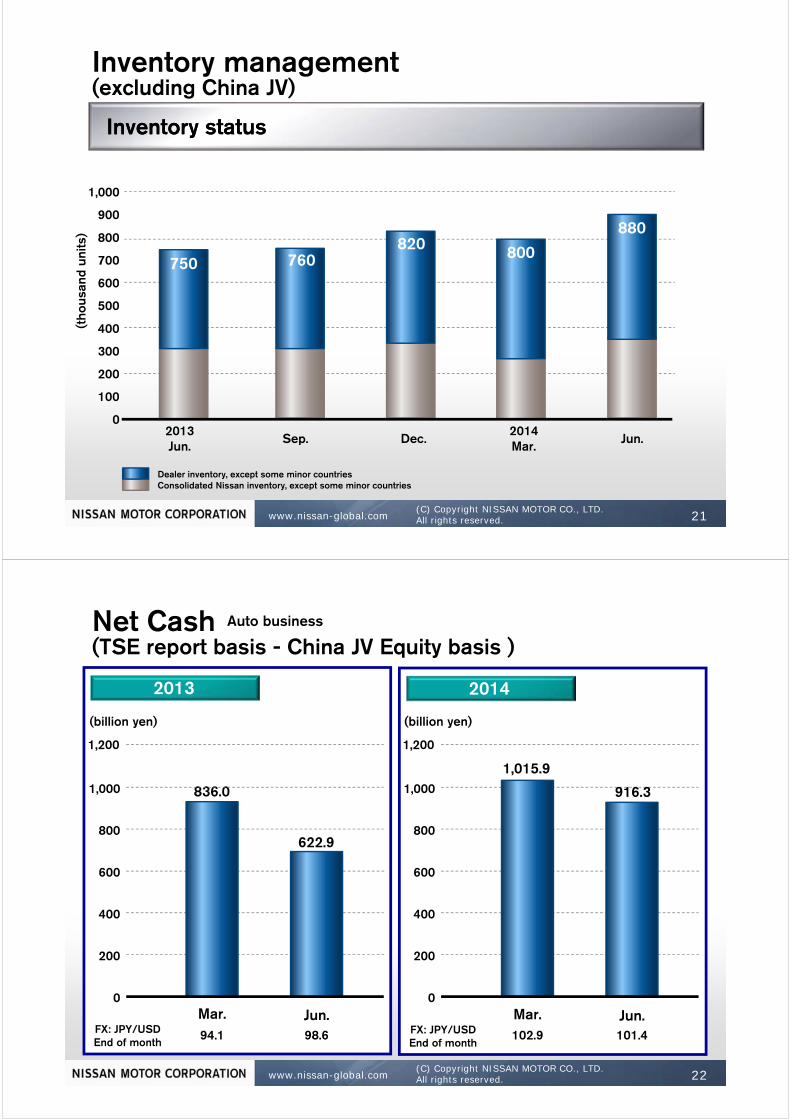
Consolidated Nissan inventory, except some minor countriesDealer inventory, except some minor countries
(tho
usan
d un
its)
0
100
200
300
400
500
600
700
800
900
1,000
2013 Jun.
750 760 800
Inventory management
Sep.2014 Mar.
Dec.
970820
Jun.
880
Inventory statusInventory status
(excluding China JV)
www.nissan-global.com 22(C) Copyright NISSAN MOTOR CO., LTD.xxxx All rights reserved. www.nissan-global.com
(C) Copyright NISSAN MOTOR CO., LTD.All rights reserved. 22
400
200
600
800
1,000
1,200
Auto business
(TSE report basis - China JV Equity basis )Net Cash
FX: JPY/USDEnd of month
101.4
Mar.102.9
Jun.
2014
916.3
1,015.9
FX: JPY/USDEnd of month
98.6
Mar.94.1
Jun.
2013
622.9
836.0
400
200
600
800
1,000
1,200
(billion yen)(billion yen)
0 0
www.nissan-global.com 23(C) Copyright NISSAN MOTOR CO., LTD.xxxx All rights reserved. www.nissan-global.com
(C) Copyright NISSAN MOTOR CO., LTD.All rights reserved. 23
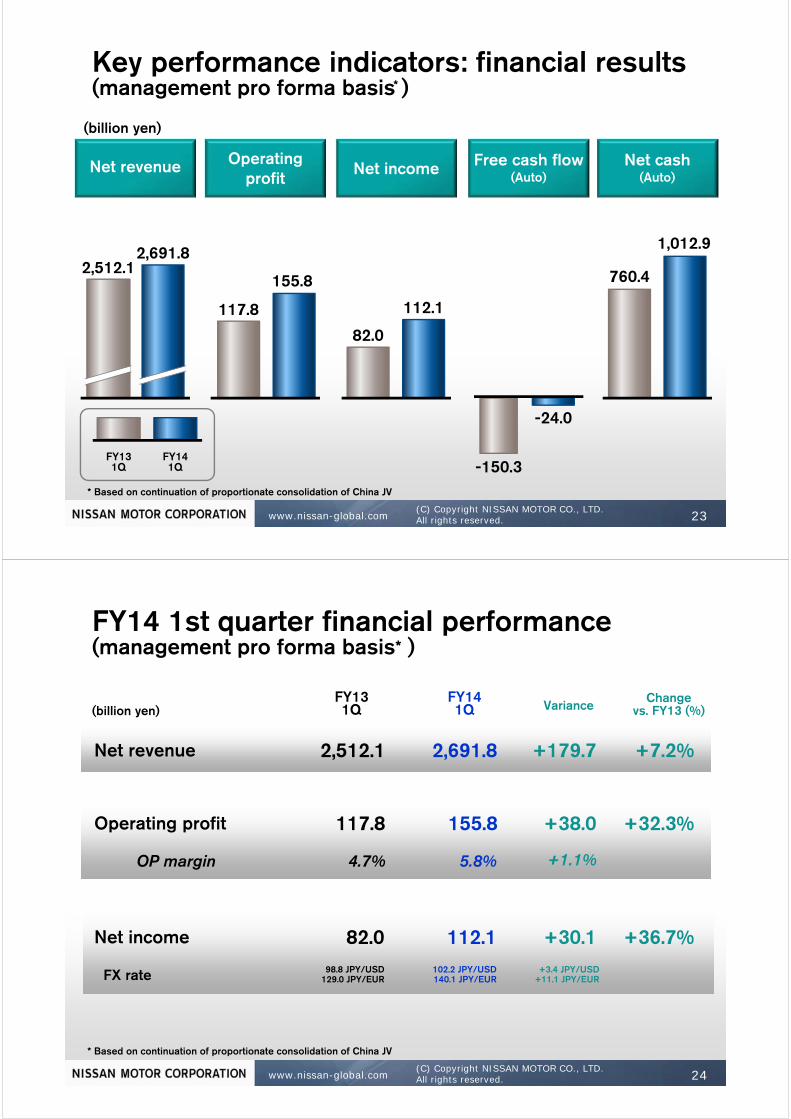
Net revenue
(billion yen)
Operating profit Net income Free cash flow
(Auto)Net cash
(Auto)
117.8
155.8
82.0
112.1
-150.3
-24.0
760.4
1,012.92,512.1
2,691.8
FY141Q
FY131Q
*Key performance indicators: financial results(management pro forma basis )
* Based on continuation of proportionate consolidation of China JV
www.nissan-global.com 24(C) Copyright NISSAN MOTOR CO., LTD.xxxx All rights reserved. www.nissan-global.com
(C) Copyright NISSAN MOTOR CO., LTD.All rights reserved. 24
(billion yen) VarianceFY131Q
Net revenue 2,512.1 2,691.8 +179.7 +7.2%
Change vs. FY13 (%)
FY141Q
(management pro forma basis* )FY14 1st quarter financial performance
FX rate 102.2 JPY/USD 140.1 JPY/EUR
98.8 JPY/USD129.0 JPY/EUR
Net income +30.1 +36.7%82.0 112.1+3.4 JPY/USD
+11.1 JPY/EUR
Operating profit 117.8 155.8 +38.0 +32.3%
OP margin 5.8%4.7% +1.1%
* Based on continuation of proportionate consolidation of China JV
www.nissan-global.com 25(C) Copyright NISSAN MOTOR CO., LTD.xxxx All rights reserved. www.nissan-global.com
(C) Copyright NISSAN MOTOR CO., LTD.All rights reserved. 25
www.nissan-global.com 26(C) Copyright NISSAN MOTOR CO., LTD.xxxx All rights reserved. www.nissan-global.com
(C) Copyright NISSAN MOTOR CO., LTD.All rights reserved. 26
Appendix
www.nissan-global.com 27(C) Copyright NISSAN MOTOR CO., LTD.xxxx All rights reserved. www.nissan-global.com
(C) Copyright NISSAN MOTOR CO., LTD.All rights reserved. 27
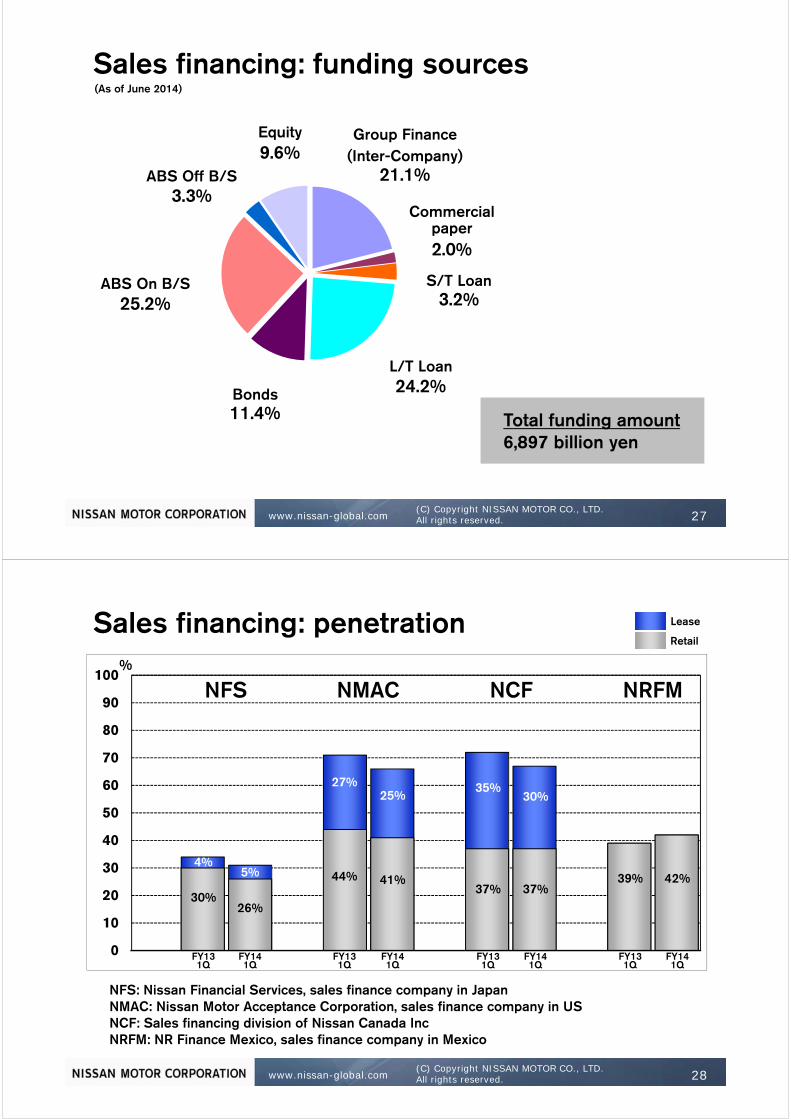
Sales financing: funding sources(As of June 2014)
Total funding amount6,897 billion yen
11.4%
Group Finance(Inter-Company)
21.1%ABS Off B/S3.3%
Equity9.6%
ABS On B/S25.2%
L/T Loan24.2%
Commercialpaper2.0%
S/T Loan3.2%
Bonds
www.nissan-global.com 28(C) Copyright NISSAN MOTOR CO., LTD.xxxx All rights reserved. www.nissan-global.com
(C) Copyright NISSAN MOTOR CO., LTD.All rights reserved. 28
0
10
20
30
40
50
60
70
80
90
100
Lease
Retail
%
NMACNFS NCF NRFM
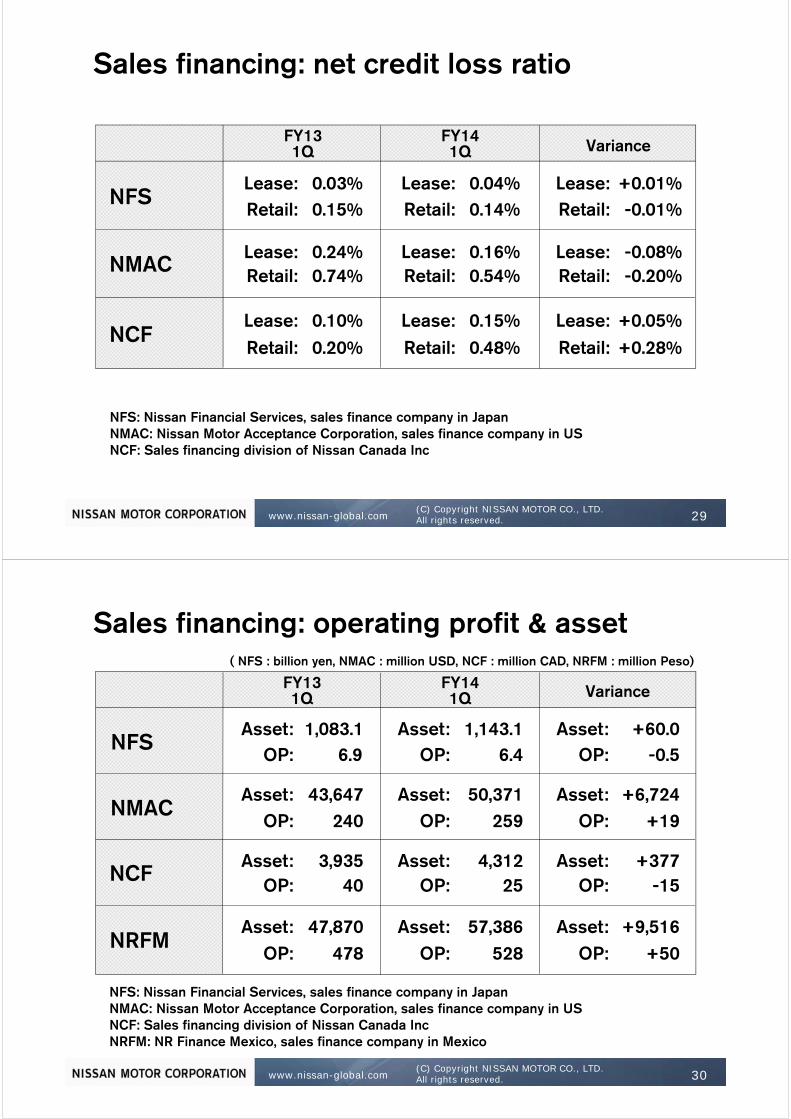
30%26%
44% 41%37% 37%
39% 42%
27%25%
4%5%
30%
FY131Q
FY131Q
FY131Q
FY131Q
35%
FY141Q
FY141Q
FY141Q
FY141Q
Sales financing: penetration
NFS: Nissan Financial Services, sales finance company in JapanNMAC: Nissan Motor Acceptance Corporation, sales finance company in USNCF: Sales financing division of Nissan Canada IncNRFM: NR Finance Mexico, sales finance company in Mexico
www.nissan-global.com 29(C) Copyright NISSAN MOTOR CO., LTD.xxxx All rights reserved. www.nissan-global.com
(C) Copyright NISSAN MOTOR CO., LTD.All rights reserved. 29
NFS: Nissan Financial Services, sales finance company in JapanNMAC: Nissan Motor Acceptance Corporation, sales finance company in USNCF: Sales financing division of Nissan Canada Inc
Sales financing: net credit loss ratio
NFS
NMAC
NCF
FY131Q Variance
FY141Q
Lease: 0.03%0.15%Retail:
Lease: 0.24%0.74%Retail:
Lease: 0.10%0.20%Retail:
Lease: 0.04%0.14%Retail:
Lease: 0.16%0.54%Retail:
Lease:-0.01%Retail:
+0.01%
-0.20%-0.08%Lease:
Retail:
+0.05%+0.28%
Lease:Retail:
Lease:0.48%Retail:0.15%
www.nissan-global.com 30(C) Copyright NISSAN MOTOR CO., LTD.xxxx All rights reserved. www.nissan-global.com
(C) Copyright NISSAN MOTOR CO., LTD.All rights reserved. 30
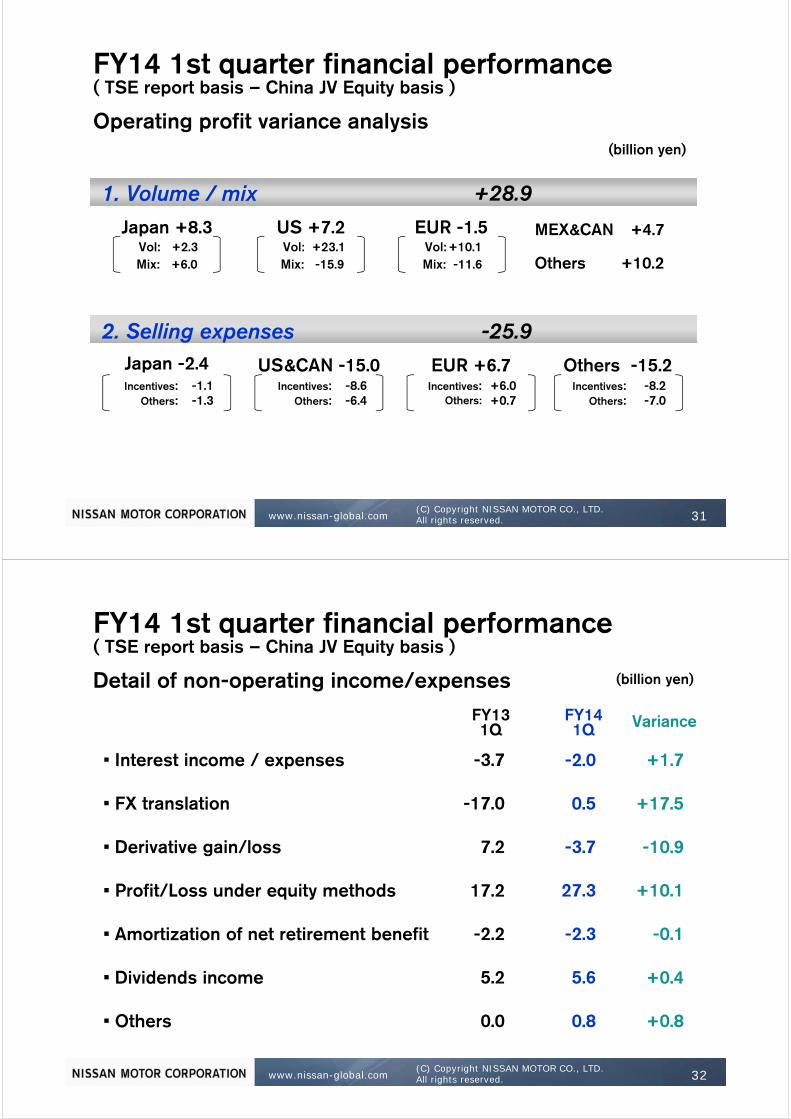
( NFS : billion yen, NMAC : million USD, NCF : million CAD, NRFM : million Peso)
Sales financing: operating profit & asset
NFS
FY131Q
NMAC
Variance
NCF
FY141Q
NRFM
OP: 6.9Asset: 1,083.1
43,647240
Asset:OP:
403,935Asset:
OP:
47847,870Asset:
OP:
6.41,143.1Asset:
OP:
52857,386Asset:
OP:
25950,371Asset:
OP:
254,312Asset:
OP:
-0.5+60.0Asset:
OP:
+19+6,724Asset:
OP:
-15+377Asset:
OP:
+50+9,516Asset:
OP:
NFS: Nissan Financial Services, sales finance company in JapanNMAC: Nissan Motor Acceptance Corporation, sales finance company in USNCF: Sales financing division of Nissan Canada IncNRFM: NR Finance Mexico, sales finance company in Mexico
www.nissan-global.com 31(C) Copyright NISSAN MOTOR CO., LTD.xxxx All rights reserved. www.nissan-global.com
(C) Copyright NISSAN MOTOR CO., LTD.All rights reserved. 31
( TSE report basis – China JV Equity basis )FY14 1st quarter financial performance
+28.9
Others
-25.9
1. Volume / mix
2. Selling expenses
MEX&CAN
+10.2
+4.7Japan +8.3 EUR -1.5+10.1-11.6
Vol:Mix:
+2.3+6.0
US +7.2+23.1-15.9
Vol:Mix:
Vol:Mix:
Japan -2.4Incentives:
Others:-1.1-1.3
EUR +6.7Incentives:
Others:+6.0+0.7
Others -15.2Incentives:
Others:-8.2-7.0
US&CAN -15.0Incentives:
Others:-8.6-6.4
(billion yen)
Operating profit variance analysis
www.nissan-global.com 32(C) Copyright NISSAN MOTOR CO., LTD.xxxx All rights reserved. www.nissan-global.com
(C) Copyright NISSAN MOTOR CO., LTD.All rights reserved. 32
VarianceFY141Q
• Profit/Loss under equity methods 27.3 +10.117.2
• Interest income / expenses -2.0 +1.7-3.7
• FX translation 0.5 +17.5-17.0
• Derivative gain/loss -3.7 -10.97.2
FY131Q
• Others +0.80.0 0.8
• Amortization of net retirement benefit -2.3 -0.1-2.2
• Dividends income 5.6 +0.45.2
( TSE report basis – China JV Equity basis )FY14 1st quarter financial performance
Detail of non-operating income/expenses (billion yen)
www.nissan-global.com 33(C) Copyright NISSAN MOTOR CO., LTD.xxxx All rights reserved. www.nissan-global.com
(C) Copyright NISSAN MOTOR CO., LTD.All rights reserved. 33
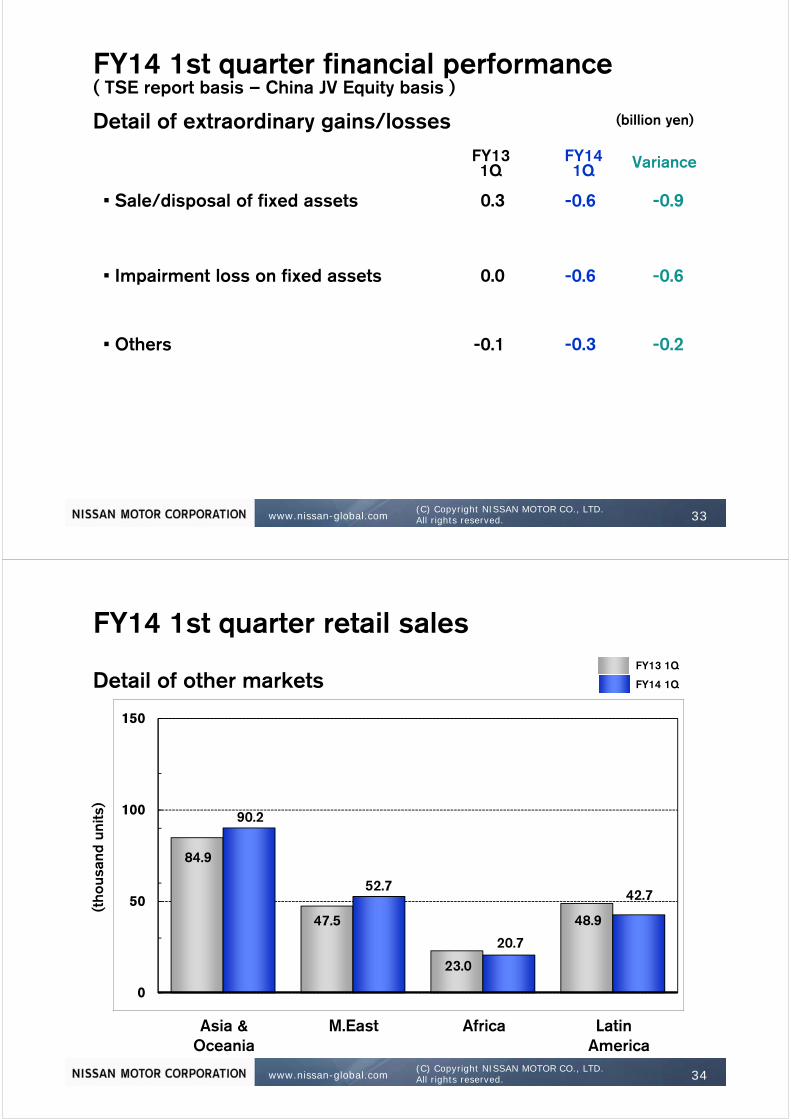
( TSE report basis – China JV Equity basis )FY14 1st quarter financial performance
Detail of extraordinary gains/losses
VarianceFY141Q
FY131Q
• Sale/disposal of fixed assets -0.6 -0.90.3
• Impairment loss on fixed assets -0.6 -0.60.0
• Others -0.3 -0.2-0.1
(billion yen)
www.nissan-global.com 34(C) Copyright NISSAN MOTOR CO., LTD.xxxx All rights reserved. www.nissan-global.com
(C) Copyright NISSAN MOTOR CO., LTD.All rights reserved. 34
84.9
47.5
23.0
48.9
90.2
52.7
20.7
42.7
0
50
100
150
Asia & Oceania
M.East Africa Latin America
FY14 1Q
FY13 1Q
(tho
usan
d un
its)
FY14 1st quarter retail sales
Detail of other markets