nourish thistown business plan -...
TRANSCRIPT

www.FranchiseDirect.com © Copyright 2015 Franchise Direct. All Rights Reserved
Nourish Thistown Business Plan
Franchisee Name(s) Address Phone Number Email Copyright 2015 by Franchise Direct. All rights reserved. This material may not be copied online, reproduced in print or on a disk without written permission from Franchise Direct.

www.FranchiseDirect.com © Copyright 2015 Franchise Direct. All Rights Reserved
Table of Contents
Executive Summary....................................................................................................................................2 Company Description .................................................................................................................................3 Product Description...................................................................................................................................4 Management Structure......................................................... ....................................................................4 Market Analysis ……....................................................................................................................................5 Marketing Plan..........................................................................................................................................6 Financials ....................................................................................................................................................7
Projected Sales and Break Even Analysis Pro Forma Profit and Loss Pro Forma Cash Flow Balance Sheet Business Ratios
Appendix
Copy of Franchise Agreement Copy of Floor Plan and Architectural Detail of the Premises Copy of Rental Contract for Premises Resume of Courtney Smith Resume of Rachel Martin

www.FranchiseDirect.com © Copyright 2015 Franchise Direct. All Rights Reserved
Executive Summary Nourish is a franchise delicatessen restaurant to be located in central Thistown. Nourish specializes in providing its customers a fresher alternative to typical fried fast food products with the convenience of fast food-like rapid delivery. Nourish is a brand of franchisor Neighborhood Restaurant Corporation (also referred to as NRC). Last year, sales topped $8,000,000 for the rapidly growing company. The Nourish chain is positioned in the fast casual segment between traditional fast food restaurants and sit-down restaurants. Nourish Thistown aims to offer its products at a competitive price to meet the demand of the middle-to higher-income local market area residents and tourists. According to research data, customers within this market segment are more attuned to the health benefits of their eating habits, and are willing to pay more for what they consider a “better” food choice when compared to the general population. Our goal is to be the top choice for that market segment in the Thistown Metro area. Nourish Thistown expects to catch the interest of a regular loyal customer base with its broad variety of products, primarily sandwiches, soups and drinks. The company plans to build a strong market position in the town, due to the partners’ extensive industry experience and mild competitive climate in the area. Nourish Thistown is managed by two partners. These partners have significant marketing, sales and management experience in the food service space. The partners will provide funding ($110,000) from their own savings, which will cover start-up expenses and provide a financial cushion for the first months of operation. The requested ten-year loan for $100,000 will cover the rest of the required financing. The Nourish Thistown franchise will be a holding of the partners’ LLC. Nourish Thistown anticipates sales of about $491,000 in the first year, $567,000 in the second year, and $655,000 in the third year of the plan. The franchise should break even by the fourth month of its operation as it steadily increases its sales. Profits for this time period are expected to be approximately $13,000 in year 1, $36,000 by year 2, and $46,000 by year 3. The company does not anticipate any cash flow problems.

www.FranchiseDirect.com © Copyright 2015 Franchise Direct. All Rights Reserved
Company Description NRC franchises, and sometimes owns and operates, a variety of restaurants. One of these restaurants is called “Nourish,” which is taking the fast casual segment by storm by producing a better product than its competitors at a moderately low price. According to NRC, “the mission of Nourish is to provide people high-quality, healthy fast food at a reasonable price. We pledge to provide seating areas that are clean with a location where the ambiance is pleasing to the senses overall. Customers can be sure their food will be good and the service, friendly and fast.” The Nourish concept was born in the kitchen of the owner and president of Neighborhood Restaurant Corporation. The goal of the owner is to provide great food in a clean, urban environment at a reasonable price. The owner began selling sandwiches, soups, and other food items in 1997 as a sole proprietorship in Thattown, State. The company was incorporated in December of 2003, and the company began franchising in early 2004. Nourish now boasts 75 restaurants in six states. Nourish Thistown will be equally owned by two partners, Courtney Smith and Rachel Martin, under a limited liability company. Financing will come from the partners' capital and a ten-year XYZ Bank loan. The following tables summarize the company's projected initial start-up costs and projected funding.
START-UP REQUIREMENTS
Start-up Expenses
Franchise Fee $15,000
Legal $3,000
Premise renovation $15,000
Expensed equipment $30,000
Other $1,000
Total Start-up Expenses $64,000
Start-up Assets
Cash Required $70,000
Other Current Assets $12,000
Long-term Assets $65,000
Total Assets $147,000
TOTAL REQUIREMENTS $211,000

www.FranchiseDirect.com © Copyright 2015 Franchise Direct. All Rights Reserved
START-UP FUNDING
Start-up Expenses to Fund $64,000
Start-up Assets to Fund $147,000
Total Funding Required $211,000
Assets
Non-cash Assets from Start-up $77,000
Cash Requirements from Start-up $70,000
Additional Cash Raised $0
Cash Balance on Starting Date $70,000
Total Assets $147,000
Liabilities
Current Borrowing $0
Long-term Liabilities $100,000
Accounts Payable (Outstanding Bills) $1,000
Other Current Liabilities (Interest-free) $0
Total Liabilities $101,000
Capital
Planned Investment
Smith $55,000
Martin $55,000
Other $0
Additional Investment Requirement $0
Total Planned Investment $110,000
Loss at Start-up (Start-up Expenses) ($64,000)
Total Capital $46,000
TOTAL FUNDING $211,000
Product Description Products for sale are determined by corporate headquarters. Nourish offers a large variety of sandwiches, salads, soups, chips, cookies, drinks, and more. Menu items are available for customization and made with NRC’s proprietary condiments and trimmings.The majority of menu items including the bread, soups, salads, chili and cookies are made fresh daily on site. Our sandwiches, soups, etc. will all of the finest quality, and have recipes refined through taste tests sponsored by NRC. NRC does welcome product suggestions from its franchisees, and if approved, may become part of the future product mix.

www.FranchiseDirect.com © Copyright 2015 Franchise Direct. All Rights Reserved
Management Structure We are a Limited Liability Company (LLC) with two managing owners each holding equal shareand interest in the franchise. We have a combined 25 years of experience in the food service industry. A little on our background: Courtney Smith, General Managing Owner, owned and managed a deli downtown for 15 years. During this period, she turned the deli into a full-service convenience mart, added a dining area, and increased the menu offerings substantially prior to her exit from the company. Courtney sold the company to a husband/wife entrepreneur team, and has been living off personal investments and other short-term ventures for the last two years. Courtney has a BA in finance as well as a MBA. Rachel Martin, Vice Managing Owner/Sales, has a BA in Marketing, and worked for over 10 years as manager of the Firegrill Restaurant in Thistown. Firegrill restaurant is known for its friendly wait staff, diverse and award-winning menu, outdoor seating, and excellent service. She helped the owners find investors, and helped write the marketing and business expansion plan. She also managed the day-to-day operations of the business, trained and hired all wait staff, set the menu, and managed all advertising spending. We will be supported by a small team of workers. As the company grows, staff will be taken on to fill positions as deemed necessary.Most of our employees will come from the University. They will be part-time students and will not need healthcare benefits or 401K benefits. This will decrease the burden on our payroll. However, our employees will be paid more the average scale of employees at most other fast food restaurants. Studies have shown this will make them more content workers, which should lead to minimal turnover and a more satisfied customer base.
PERSONNEL PLAN
Year 1 Year 2 Year 3
Managers $100,000 $105,000 $110,250
Cooks $40,800 $42,840 $44,982
Wait Staff $120,000 $126,000 $132,300
Other $0 $0 $0
Total People 10 10 10
TOTAL PAYROLL $260,800 $273,840 $287,532

www.FranchiseDirect.com © Copyright 2015 Franchise Direct. All Rights Reserved
MONTHLY PERSONNEL COST FOR YEAR 1
Managers $8,333
Cooks $3,400
Wait Staff $10,000
Other $0
Total People 10
Total Payroll $21,733
As is customary in franchise operation, we are required to attend NRC initial training to take place at its corporate headquarters. The training will emphasize both classroom and on-the-job training on accounting and administrative procedures along with other subjects related to restaurant management. We will also be given, on loan, a confidential manual for the Nourish franchise business, which contains the standards of operation, manager systems, training material for employees and recipes.
Market Analysis The franchise agreement we have signed contains specifications for what the franchisor describes as a “Profile A” location. This type of site must contain a minimum of 25,000 daytime customers within a five mile radius. The pedestrian traffic also must be adequate and the lunch habits of the customers must be conducive to eating out. In keeping with these specifications, Nourish Thistown will be located between Main St. and Capital St. on Highway 11. The location is within a busy business district and is very close to Rose Park, a popular recreation area. South Valley University is also located within 10 miles of the restaurant location. Thistown is the second largest city in the state with a population of 397,225. With an estimated growth rate of 3%, it is anticipated that Thistown will become the largest city in South River Valley before 2018. Nourish customers will come from all age and income levels of the market. However, within the general population we will focus on three distinct groups: young adults (including students and business people), families, and tourists. Rationale for these three market segments follow:
Young adults have the potential of providing large volume sales to the company during the peak hours of 11 a.m. to 2 p.m. The lunch business is driven by individuals. Many go out to lunch to get off campus, out of the office setting, or have business meetings at lunch either in or out of the office.
Families are a growing population, both numerically and in their choice for convenient foods. Two-income families have less time to prepare meals, while single and working parents tend to turn to fast and convenient food choices as well to accommodate family demands.
Approximately 80,000 tourists visit Thistown annually for its premier recreational activities and the premium shopping in downtown Thistown. Our location near Rose Park will make us one of the closest restaurants for visitors to eat at.

www.FranchiseDirect.com © Copyright 2015 Franchise Direct. All Rights Reserved
There are a number of competitors in the area including on-campus sandwich shops, fast food restaurants, and downtown eateries. Our closest direct competitor is Local Café. Local Café licenses franchises throughout the nation, and currently has 12,900 franchises. There are two Local Café shops and eight additional fast food restaurants within a 10-mile radius of our location. Nourish Thistown offers a distinct advantage over our competitors in not only the food, but in that none of these competitors offer delivery service. Additionally, NRC offers to its franchisees protected territory rights. Under this territory arrangement, no other NRC franchisee can open a Nourish within our territory.
Marketing Plan There will be an aggressive marketing launch with flyer distribution detailing our starter offers. We’ve utilized the business contacts we have made over the years to make the launch of Nourish Thistown a community events. To go along with traditional grand opening celebrations, there will be media and the City Mayor is scheduled to make an appearance. Our regular sales literature will consist of menus supplied by The Neighborhood Restaurant Corporation and flyers designed by NRC and customized in-house. After the opening, regular flyer distribution will continue along with deals for special occasions such as Independence Day and Halloween. The custom flyers will offer catering prices, explain the difference between our lunch specials and those of our competitors, and show our hours of operation.We will place the catering and lunch service flyers strategically on and near the University campus, park events, with local businesses, and in County community centers. The franchise agreement with NRC includes constant marketing support and training which will ensure the optimization of the franchisor’s marketing campaigns. NRC’s corporate office handles the promotion of its brands and products on the national level.

www.FranchiseDirect.com © Copyright 2015 Franchise Direct. All Rights Reserved
Financials Our financial plan is based on past experience, general knowledge of the industry, growth expectations for the fast casual sector nationwide, and information provided by the franchisor.
Projected Sales and Break Even Analysis As the chart and table show, Nourish Thistown anticipates sales of about $491,000 in the first year, $567,000 in the second year, and $655,000 in the third year of the plan.Projections are based on the performance of other Nourish franchises in similar locations.
SALES FORECAST
Year 1 Year 2 Year 3
Unit Sales
Drinks 135,000 148,500 163,350
Food Items 86,000 94,600 104,060
Other 0 0 0
Total Unit Sales 221,000 243,100 267,410
Unit Prices Year 1 Year 2 Year 3
Drinks $3.00 $3.15 $3.31
Food Items $1.00 $1.05 $1.10
Other $0.00 $0.00 $0.00
Sales
Drinks $405,000 $467,775 $540,280
Food Items $86,000 $99,330 $114,726
Other $0 $0 $0
Total Sales $491,000 $567,105 $655,006
Direct Unit Costs Year 1 Year 2 Year 3
Drinks $0.25 $0.26 $0.28
Food Items $0.50 $0.53 $0.55
Other $0.00 $0.00 $0.00
Direct Cost of Sales
Drinks $33,750 $38,981 $45,023
Food Items $43,000 $49,665 $57,363
Other $0 $0 $0
SUBTOTAL DIRECT COST OF SALES $76,750 $88,646 $102,386
If sales follow an anticipated track, Nourish Thistown should break even by the fourth month of its operation.
BREAK-EVEN ANALYSIS Monthly Units Break-even 17,255
Monthly Revenue Break-even $38,336
Assumptions:
Average Per-Unit Revenue $2.22
Average Per-Unit Variable Cost $0.35
Estimated Monthly Fixed Cost $32,343

www.FranchiseDirect.com © Copyright 2015 Franchise Direct. All Rights Reserved
DETAILED SALES FORECAST FOR FIRST 6 MONTHS
Month 1 Month 2 Month 3 Month 4 Month 5 Month 6
Unit Sales
Drinks 5,000 7,500 10,000 12,500 12,500 12,500
Food Items 2,000 3,000 6,000 8,333 8,333 8,333
Other 0 0 0 0 0 0
Total Unit Sales
7,000 10,500 16,000 20,833 20,833 20,833
Unit Prices
Drinks $3.00 $3.00 $3.00 $3.00 $3.00 $3.00
Food Items $1.00 $1.00 $1.00 $1.00 $1.00 $1.00
Other $0.00 $0.00 $0.00 $0.00 $0.00 $0.00
Sales
Drinks $15,000 $22,500 $30,000 $37,500 $37,500 $37,500
Food Items $2,000 $3,000 $6,000 $8,333 $8,333 $8,333
Other $0 $0 $0 $0 $0 $0
Total Sales $17,000 $25,500 $36,000 $45,833 $45,833 $45,833
Direct Unit Costs
Drinks $0.25 $0.25 $0.25 $0.25 $0.25 $0.25
Food Items $0.50 $0.50 $0.50 $0.50 $0.50 $0.50
Other $0.00 $0.00 $0.00 $0.00 $0.00 $0.00
Direct Cost of Sales
Drinks $1,250 $1,875 $2,500 $3,125 $3,125 $3,125
Food Items $1,000 $1,500 $3,000 $4,167 $4,167 $4,167
Other $0 $0 $0 $0 $0 $0
Subtotal Direct Cost of Sales
$2,250 $3,375 $5,500 $7,292 $7,292 $7,292

www.FranchiseDirect.com © Copyright 2015 Franchise Direct. All Rights Reserved
Pro Forma Profit and Loss As the Profit and Loss table shows, Nourish Thistown expects to continue its steady growth in profitability over the next three years of operations. Due to bulk buying by NRC, and their standardized franchise-based supply line, our purchasing costs will be 10% below similar costs incurred by a non-franchise restaurant. To maintain a conservative financial perspective, we have not built this 10% discount into our cost of goods in the Profit and Loss Statement.
PRO FORMA PROFIT AND LOSS
Year 1 Year 2 Year 3
Sales $491,000 $567,105 $655,006
Direct Cost of Sales $76,750 $88,646 $102,386
Other $0 $0 $0
Total Cost of Sales $76,750 $88,646 $102,386
Gross Margin $414,250 $478,459 $552,620
Gross Margin % 84.37% 84.37% 84.37%
Expenses
Payroll $260,800 $273,840 $287,532
Sales and Marketing and Other Expenses $27,000 $35,200 $71,460
Depreciation $60,000 $69,000 $79,350
Utilities $1,200 $1,260 $1,323
Payroll Taxes $39,120 $41,076 $43,130
Other $0 $0 $0
Total Operating Expenses $388,120 $420,376 $482,795
Profit Before Interest and Taxes $26,130 $58,083 $69,825
EBITDA* $86,130 $127,083 $149,175
Interest Expense $10,000 $9,500 $8,250
Taxes Incurred $3,111 $12,146 $15,650
NET PROFIT $13,019 $36,437 $45,925
NET PROFIT/SALES 2.65% 6.43% 7.01%
*Note: EBITDA stands for earnings before interest taxes depreciation amortization

www.FranchiseDirect.com © Copyright 2015 Franchise Direct. All Rights Reserved
Projected Cash Flow The cash flow projection shows that provisions for ongoing expenses are adequate to meet Nourish Thistown’s needs until the business generates cash flow sufficient to support operations.
PRO FORMA CASH FLOW
Year 1 Year 2 Year 3
Cash Received from Operations
Cash Sales $491,000 $567,105 $655,006
Subtotal Cash from Operations $491,000 $567,105 $655,006
Additional Cash Received
Sales Tax, VAT, HST/GST Received $0 $0 $0
New Current Borrowing $0 $0 $0
New Other Liabilities (interest-free) $0 $0 $0
New Long-term Liabilities $0 $0 $0
Sales of Other Current Assets $0 $0 $0
Sales of Long-term Assets $0 $0 $0
New Investment Received $0 $0 $0
Subtotal Cash Received $491,000 $567,105 $655,006
Expenditures from Operations
Cash Spending $260,800 $273,840 $287,532
Bill Payments $143,607 $186,964 $237,731
Subtotal Spent on Operations $404,407 $460,804 $525,263
Additional Cash Spent
Sales Tax, VAT, HST/GST Paid Out $0 $0 $0
Principal Repayment of Current Borrowing $0 $0 $0
Other Liabilities Principal Repayment $0 $0 $0
Long-term Liabilities Principal Repayment $0 $10,000 $15,000
Purchase Other Current Assets $0 $0 $0
Purchase Long-term Assets $0 $20,000 $20,000
Dividends $0 $0 $0
Subtotal Cash Spent $404,407 $490,804 $560,263
Net Cash Flow $86,593 $76,301 $94,744
CASH BALANCE $156,593 $232,894 $327,637

www.FranchiseDirect.com © Copyright 2015 Franchise Direct. All Rights Reserved
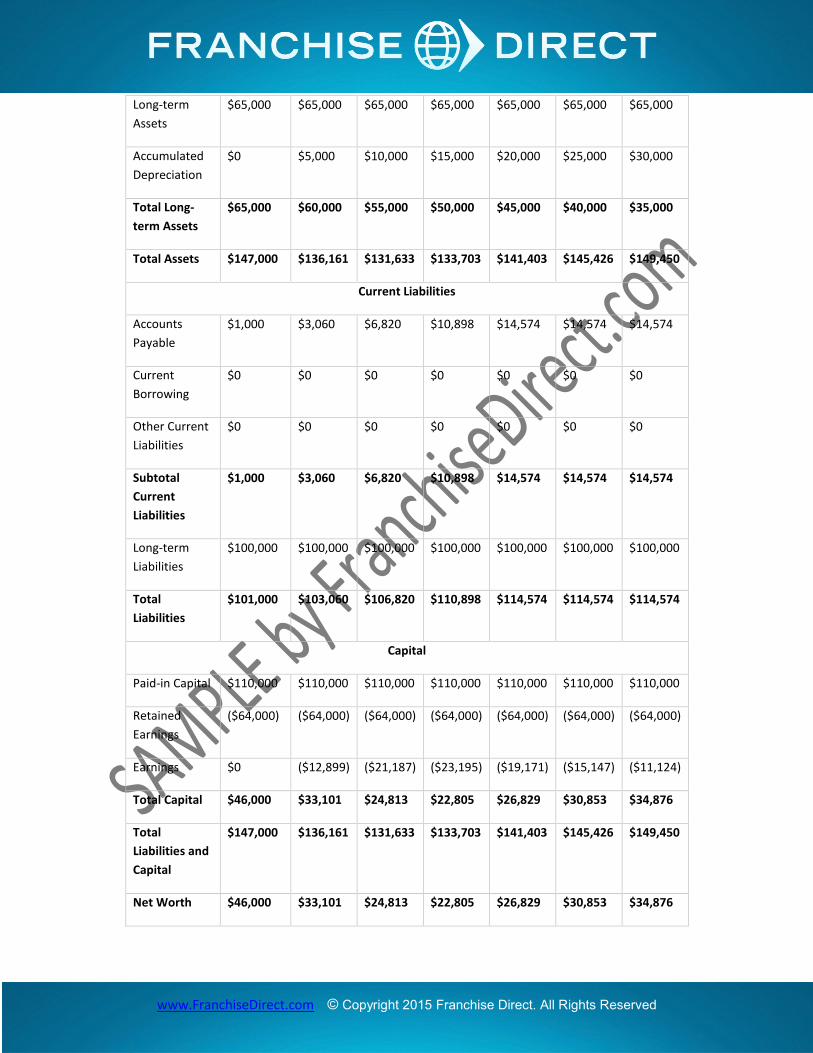
Balance Sheet The following are projected Balance Sheets for Nourish Thistown.
PRO FORMA BALANCE SHEET
Year 1 Year 2 Year 3
Assets
Current Assets
Cash $156,593 $232,894 $327,637
Other Current Assets $12,000 $12,000 $12,000
Total Current Assets $168,593 $244,894 $339,637
Long-term Assets
Long-term Assets $65,000 $85,000 $105,000
Accumulated Depreciation $60,000 $129,000 $208,350
Total Long-term Assets $5,000 ($44,000) ($103,350)
Total Assets $173,593 $200,894 $236,287
Current Liabilities
Accounts Payable $14,574 $15,438 $19,907
Current Borrowing $0 $0 $0
Other Current Liabilities $0 $0 $0
Subtotal Current Liabilities $14,574 $15,438 $19,907
Long-term Liabilities $100,000 $90,000 $75,000
Total Liabilities $114,574 $105,438 $94,907
Paid-in Capital $110,000 $110,000 $110,000
Retained Earnings ($64,000) ($50,981) ($14,544)
Earnings $13,019 $36,437 $45,925
Total Capital $59,019 $95,456 $141,381
Total Liabilities and Capital $173,593 $200,894 $236,287
Net Worth $59,019 $95,456 $141,381
DETAILED PRO FORMA BALANCE SHEET FOR FIRST 6 MONTHS
Starting
Balances
Month 1 Month 2 Month 3 Month 4 Month 5 Month 6
Current Assets
Cash $70,000 $64,161 $64,633 $71,703 $84,403 $93,426 $102,450
Other Current
Assets
$12,000 $12,000 $12,000 $12,000 $12,000 $12,000 $12,000
Total Current
Assets
$82,000 $76,161 $76,633 $83,703 $96,403 $105,426 $114,450
Long-term Assets
www.FranchiseDirect.com © Copyright 2015 Franchise Direct. All Rights Reserved
Long-term
Assets
$65,000 $65,000 $65,000 $65,000 $65,000 $65,000 $65,000
Accumulated
Depreciation
$0 $5,000 $10,000 $15,000 $20,000 $25,000 $30,000
Total Long-
term Assets
$65,000 $60,000 $55,000 $50,000 $45,000 $40,000 $35,000
Total Assets $147,000 $136,161 $131,633 $133,703 $141,403 $145,426 $149,450
Current Liabilities
Accounts
Payable
$1,000 $3,060 $6,820 $10,898 $14,574 $14,574 $14,574
Current
Borrowing
$0 $0 $0 $0 $0 $0 $0
Other Current
Liabilities
$0 $0 $0 $0 $0 $0 $0
Subtotal
Current
Liabilities
$1,000 $3,060 $6,820 $10,898 $14,574 $14,574 $14,574
Long-term
Liabilities
$100,000 $100,000 $100,000 $100,000 $100,000 $100,000 $100,000
Total
Liabilities
$101,000 $103,060 $106,820 $110,898 $114,574 $114,574 $114,574
Capital
Paid-in Capital $110,000 $110,000 $110,000 $110,000 $110,000 $110,000 $110,000
Retained
Earnings
($64,000) ($64,000) ($64,000) ($64,000) ($64,000) ($64,000) ($64,000)
Earnings $0 ($12,899) ($21,187) ($23,195) ($19,171) ($15,147) ($11,124)
Total Capital $46,000 $33,101 $24,813 $22,805 $26,829 $30,853 $34,876
Total
Liabilities and
Capital
$147,000 $136,161 $131,633 $133,703 $141,403 $145,426 $149,450
Net Worth $46,000 $33,101 $24,813 $22,805 $26,829 $30,853 $34,876

www.FranchiseDirect.com © Copyright 2015 Franchise Direct. All Rights Reserved
Business Ratios The following table represents key ratios for the franchised delicatessen industry. These ratios are determined by the Standard Industry Classification (SIC) Index code 5812, Eating Places.
RATIO ANALYSIS
Year 1 Year 2 Year 3 Industry Profile
Sales Growth 0.00% 15.50% 15.50% 7.60%
Percent of Total Assets
Other Current Assets 6.91% 5.97% 5.08% 35.60%
Total Current Assets 97.12% 121.90% 143.74% 43.70%
Long-term Assets 2.88% -21.90% -43.74% 56.30%
Total Assets 100.00% 100.00% 100.00% 100.00%
Current Liabilities 8.40% 7.68% 8.42% 32.70%
Long-term Liabilities 57.61% 44.80% 31.74% 28.50%
Total Liabilities 66.00% 52.48% 40.17% 61.20%
Net Worth 34.00% 47.52% 59.83% 38.80%
Percent of Sales
Sales 100.00% 100.00% 100.00% 100.00%
Gross Margin 84.37% 84.37% 84.37% 60.50%
Selling, General & Administrative Expenses 74.74% 71.43% 71.39% 39.80%
Advertising Expenses 0.49% 1.76% 6.87% 3.20%
Profit Before Interest and Taxes 5.32% 10.24% 10.66% 0.70%
Main Ratios
Current 11.57 15.86 17.06 0.98
Quick 11.57 15.86 17.06 0.65
Total Debt to Total Assets 66.00% 52.48% 40.17% 61.20%
Pre-tax Return on Net Worth 27.33% 50.90% 43.55% 1.70%
Pre-tax Return on Assets 9.29% 24.18% 26.06% 4.30%
Additional Ratios
Net Profit Margin 2.65% 6.43% 7.01% N/A
Return on Equity 22.06% 38.17% 32.48% N/A
Activity Ratios
Accounts Payable Turnover 10.79 12.17 12.17 N/A
Payment Days 27 29 27 N/A
Total Asset Turnover 2.83 2.82 2.77 N/A
Debt Ratios
Debt to Net Worth 1.94 1.10 0.67 N/A
Current Liabilities to Liabilities 0.13 0.15 0.21 N/A
Liquidity Ratios
Net Working Capital $154,019 $229,456 $319,731 N/A
Interest Coverage 2.61 6.11 8.46 N/A
Additional Ratios
Assets to Sales 0.35 0.35 0.36 N/A
Current Debt/Total Assets 8% 8% 8% N/A
Acid Test 11.57 15.86 17.06 N/A
Sales/Net Worth 8.32 5.94 4.63 N/A
Dividend Payout 0.00 0.00 0.00 N/A