not just fat: investigating novel physiological state
TRANSCRIPT

NOT JUST FAT: INVESTIGATING NOVEL PHYSIOLOGICAL STATE BIOMARKERS IN CETACEAN BLUBBER
Joanna Kershaw
A Thesis Submitted for the Degree of PhD
at the University of St Andrews
2019
Full metadata for this item is available in St Andrews Research Repository
at: http://research-repository.st-andrews.ac.uk/
Please use this identifier to cite or link to this item: http://hdl.handle.net/10023/17977
This item is protected by original copyright

Not just fat: Investigating novel physiological state
biomarkers in cetacean blubber
Joanna Kershaw
This thesis is submitted in partial fulfilment for the degree of
Doctor of Philosophy (PhD)
at the University of St Andrews
September 2018

TABLE OF CONTENTS
DECLARATIONS ............................................................................................................ 1
ACKNOWLEDGMENTS ................................................................................................. 3
ABSTRACT ......................................................................................................................... 6
CHAPTER 1 : GENERAL INTRODUCTION ...................................................................... 7
CHAPTER 2 : EVALUATING MORPHOMETRIC INDICES OF BODY CONDITION
OVER A 425:1 MASS RANGE IN CETACEANS ............................................................. 11
1. ABSTRACT ............................................................................................................. 12
2. INTRODUCTION .................................................................................................... 13
3. METHODS .............................................................................................................. 15
3.1. Morphometrics Dataset.......................................................................................... 15
3.2. Body Condition Indices Calculations ..................................................................... 17
3.3. Statistical Analysis ................................................................................................ 21
4. RESULTS ................................................................................................................ 23
4.1. Harbour porpoises ................................................................................................. 23
4.2. Ziphiids ................................................................................................................. 26
4.3. Minke whales ........................................................................................................ 28
5. DISCUSSION .......................................................................................................... 31
Girth Based and Mass Based Indices ............................................................................ 31
Blubber Thickness is a Poor Indicator of Condition ...................................................... 32
Species Specific Condition Indices ............................................................................... 32
Conclusions and Future Directions ............................................................................... 35
CHAPTER 3: VARIATION IN BLUBBER LIPID CONTENT SUGGESTS TRADE-OFFS
BETWEEN ENERGY STORAGE AND OTHER BLUBBER FUNCTIONS ACROSS
CETACEAN FAMILIES .................................................................................................... 36
1. ABSTRACT ............................................................................................................. 37
2. INTRODUCTION .................................................................................................... 38
3. METHODS .............................................................................................................. 40
3.1. Blubber Biopsies in Context .................................................................................. 40
3.2. Sample Collection from Stranded Cetaceans .......................................................... 41
3.3. Lipid Extraction .................................................................................................... 42
3.4. Quality Assurance and Quality Control for Lipid Extraction ................................. 44
3.5. Statistical Analysis ................................................................................................ 45
4. RESULTS ................................................................................................................ 47

4.1. Variation through Blubber Depth ........................................................................... 47
4.2. Variation with Other Covariates ............................................................................ 48
5. DISCUSSION .......................................................................................................... 52
Lipid Content Stratification through Blubber Depth ..................................................... 52
Lipid Content Variation as an Indicator of Body Condition .......................................... 53
Implications of the Dominance of Wax Esters in Ziphiids ............................................ 54
Much More than Just an Energy Store .......................................................................... 56
Conclusions and Future Directions ............................................................................... 57
CHAPTER 4 : BLUBBER CORTISOL - A NOVEL MARKER OF PHYSIOLOGICAL
STATE IN CETACEANS? ................................................................................................. 58
1. ABSTRACT ............................................................................................................. 59
2. INTRODUCTION .................................................................................................... 60
3. METHODS .............................................................................................................. 62
3.1. Sample Collection ................................................................................................. 62
3.2. Cortisol Extraction and Quantification ................................................................... 64
3.2.1. Subsample Processing ................................................................................................ 64
3.2.2. Cortisol Extraction ..................................................................................................... 64
3.2.3. Cortisol Quantification .............................................................................................. 65
3.2.4. Quality Assessment and Quality Control..................................................................... 65
3.3. Statistical Analysis ................................................................................................ 69
3.3.1. Harbour Porpoises ...................................................................................................... 70
3.3.2. Balaenopterids ............................................................................................................ 70
4. RESULTS................................................................................................................ 72
4.1. Harbour Porpoises ................................................................................................. 72
4.2. Balaenopterids ....................................................................................................... 74
5. DISCUSSION .......................................................................................................... 76
Quality Assurance – Quality Control ............................................................................ 76
Variation Across Sampling Sites and through Blubber Depth ....................................... 76
Cortisol Concentrations as a Potential Marker of Condition ......................................... 78
Future Directions ......................................................................................................... 80
Turnover Time Scales? ........................................................................................................ 80
Localised Cortisol Production?............................................................................................. 81
Conclusions ................................................................................................................. 82
CHAPTER 5 : APPLYING ENCOCRINE BIOMARKERS TO INVESTIGATE VARIATION
IN REPRODUCTION AND BODY CONDITION IN A NORTH ATLANTIC POPULATION
OF HUMPBACK WHALES (MEGAPTERA NOVAEANGLIAE) ........................................ 83

1. ABSTRACT ............................................................................................................. 84
2. INTRODUCTION .................................................................................................... 85
3. METHODS .............................................................................................................. 88
3.1. Blubber Biopsy Sample Collection with Life History Data .................................... 88
3.1.1. Female Samples Collected by the MICS between 2004 and 2017 ................................ 88
3.1.2. Male and Female Samples with Accompanying Photogrammetry Data ....................... 88
3.2. Blubber Endocrine Profiling .................................................................................. 89
3.2.1. Cortisol and Progesterone Extraction ......................................................................... 89
3.2.2. Cortisol and Progesterone Quantification .................................................................... 90
3.2.3. Quality Assurance and Quality Control ....................................................................... 90
3.2.4. Statistical Analysis ..................................................................................................... 92
3.2.4.1. Blubber Progesterone Concentrations as an Indicator of Pregnancy Status ............ 92
3.2.4.2. Blubber Cortisol and an Acute Stress Response.................................................... 93
3.2.4.3. Blubber Cortisol Variation within the Population ................................................. 94
3.3. Aerial Photogrammetry using an Unmanned Aerial Vehicle .................................. 95
3.3.1. Image Collection ........................................................................................................ 95
3.3.2. Calculation of the Length Standardised Surface Area Index ........................................ 96
3.3.3. Statistical Analysis ..................................................................................................... 99
4. RESULTS.............................................................................................................. 100
4.1. Endocrine Profiling ............................................................................................. 100
4.1.1. Identifying Pregnant Females ................................................................................... 100
4.1.2. Variation in Pregnancy Rates and Reproductive Success ........................................... 100
4.1.3. Blubber Cortisol and the Acute Stress Response ....................................................... 101
4.1.4. Blubber Cortisol Variation within a Population ......................................................... 102
4.2. Aerial Photogrammetry ....................................................................................... 104
5. DISCUSSION ....................................................................................................... 105
Variation in Pregnancy Rates ..................................................................................... 105
Measuring Acute Stress or an Integrative Physiological Marker? ............................... 107
Variation in Blubber Cortisol Concentrations ............................................................. 109
Using Aerial Photogrammetry and LSSAI .................................................................. 111
Conclusions and Future Directions ............................................................................. 112
CHAPTER 6: INVESTIGATING THE PROTEOME OF CETACEAN BLUBBER TISSUE
......................................................................................................................................... 113
1. ABSTRACT ........................................................................................................... 114
2. INTRODUCTION .................................................................................................. 115
3. METHODS ............................................................................................................ 117

3.1. Method Development and Optimisation .............................................................. 117
3.1.1. Sample Collection and Preparation ........................................................................... 117
3.1.2. Total Protein Extraction Methods ............................................................................. 117
3.1.2.1. Method 1: Methanol-Chloroform Precipitation with Methanol Pellet Wash ........ 118
3.1.2.2. Method 2: TCA-Acetone Precipitation with Acetone Pellet Wash ...................... 118
3.1.2.3. Method 3 - RIPA Lysis and Extraction Buffer .................................................... 119
3.1.3. Total Protein Quantification Assays .......................................................................... 121
3.1.4. 1D SDS-PAGE Protein Separation ........................................................................... 122
3.1.5. Quality Assurance / Quality Control ......................................................................... 122
3.2. Application to Minke Whale Biopsies ................................................................. 123
3.3. Protein Identification .......................................................................................... 123
4. RESULTS.............................................................................................................. 126
4.1. Method Development and Optimisation .............................................................. 126
4.2. Protein Identification ........................................................................................... 129
5. DISCUSSION ........................................................................................................ 134
Method Development and Optimisation ..................................................................... 134
Proteins Identified ...................................................................................................... 135
Tissue Specific and Circulatory Proteins .................................................................... 137
Potential for Biomarker Development ........................................................................ 139
CHAPTER 7: THE CHALLENGES AND OPPORTUNITIES FOR QUANTITATIVE
PROTEOMICS TO INVESTIGATE BLUBBER BIOMARKERS .................................... 140
1. ABSTRACT ........................................................................................................... 141
2. INTRODUCTION .................................................................................................. 142
3. METHODS ............................................................................................................ 144
3.1. Sample Collection ............................................................................................... 144
3.2. Total Protein Extraction and Quantification ......................................................... 145
3.3. Total Protein Separation ...................................................................................... 145
3.4. 1D SDS-PAGE Band Detection, Characterisation and Processing ....................... 146
3.5. Statistical Analysis .............................................................................................. 149
4. RESULTS ............................................................................................................. 152
4.1. Total Protein Yield and Extraction Variability ..................................................... 152
4.2. Sample Degradation through Storage................................................................... 152
4.3. Non-Metric Multidimensional Scaling (NMDS) .................................................. 154
4.4. Linear Models ..................................................................................................... 157
5. DISCUSSION ........................................................................................................ 162
Sample Storage and Processing Confounding Factors ................................................ 162

Band Group Profiles and Qualitative Variables .......................................................... 163
Band Profiles and Quantitative Variables ................................................................... 165
Future Directions ....................................................................................................... 165
CHAPTER 8: GENERAL DISCUSSION ......................................................................... 167
1. Synopsis ................................................................................................................. 167
1.1. Assessing Standard Indices of Condition ..................................................................... 167
1.2. Investigating Novel Biomarkers of Condition .............................................................. 167
2. The Value of Strandings Scheme Data ................................................................... 169
3. Improving our Understanding of Cetacean Physiology ........................................... 171
4. Sentinels of Ecosystem Health ............................................................................... 174
5. Future Directions.................................................................................................... 175
REFERENCES ................................................................................................................. 177
SUPPLEMENTARY MATERIAL .................................................................................... 199

1
DECLARATIONS
Candidate's declaration
I, Joanna Kershaw, do hereby certify that this thesis, submitted for the degree of PhD, which is
approximately 63,700 words in length, has been written by me, and that it is the record of work carried
out by me, or principally by myself in collaboration with others as acknowledged, and that it has not
been submitted in any previous application for any degree.
I was admitted as a research student at the University of St Andrews in January 2014.
I received funding from an organisation or institution and have acknowledged the funder(s) in the full
text of my thesis.
Date Signature of candidate
Supervisor's declaration
I hereby certify that the candidate has fulfilled the conditions of the Resolution and Regulations
appropriate for the degree of PhD in the University of St Andrews and that the candidate is qualified to
submit this thesis in application for that degree.
Date Signature of supervisor
Permission for publication
In submitting this thesis to the University of St Andrews we understand that we are giving permission
for it to be made available for use in accordance with the regulations of the University Library for the
time being in force, subject to any copyright vested in the work not being affected thereby. We also
understand, unless exempt by an award of an embargo as requested below, that the title and the abstract
will be published, and that a copy of the work may be made and supplied to any bona fide library or
research worker, that this thesis will be electronically accessible for personal or research use and that
the library has the right to migrate this thesis into new electronic forms as required to ensure continued
access to the thesis.

2
I, Joanna Kershaw, confirm that my thesis does not contain any third-party material that requires
copyright clearance.
The following is an agreed request by candidate and supervisor regarding the publication of this thesis:
Printed copy
No embargo on print copy.
Electronic copy
No embargo on electronic copy.
Date Signature of candidate
Date Signature of supervisor
Underpinning Research Data or Digital Outputs
Candidate's declaration
I, Joanna Kershaw, hereby certify that no requirements to deposit original research data or digital
outputs apply to this thesis and that, where appropriate, secondary data used have been referenced in
the full text of my thesis.
Date Signature of candidate

Acknowledgments
3
ACKNOWLEDGMENTS
I would like to first thank Ailsa. Thank you for taking me on all those years ago when I first
arrived in St Andrews, and for getting me started in the lab. Thank you for continuing to
encourage, guide and support me ever since. Thank you for all the time you’ve spent teaching
me and pushing me forward when we kept reaching dead-ends! Thank you for being so
enthusiastic and for always being ready with help and advice whenever I needed it. Basically,
thank you for being such a fantastic supervisor and for being so invaluable to me over the last
8 years. Thank you to Patrick for all the incredible opportunities both in the field, and out.
Thank you for giving me the chance to learn and develop new skills that I never even imagined
I’d have.
Thank you to the SMASS team, to Andrew, Mariel and Nick whose efforts (whilst braving the
elements) to collect bits of dead things for me, have made this whole project possible. Thank
you for working so hard and for being so meticulous. Thank you to Andrew in particular for
always being so keen, and ready to bounce ideas, plans and mad schemes off.
Thank you to my incredible MICS family who’ve made me the field biologist I am today.
Thank you to Christian, Alain, David, Katy and SCO who taught me everything I know about
working with whales, and who believed in me even when I found it hard to believe in myself.
Thank you for all your support, your encouragement and your patience. Thank you especially
to Alain for your constant enthusiasm, your sense of humour and your awful jokes that made
every day on the water such an absolute pleasure. Thank you to all the rest of the MICS team
at the Blue House - to Josie, Miranda, Viri, Marie, Rachel, Anna, and SCY for all the dance
parties, the baking, the Mingan river adventures, the Session mishaps, the ‘bleuet’ picking, the
midnight swimming, the log-book writing and the movie nights that made up my summers for
so many years. Je vous aime tous. MICS for life eh?
Thank you to my motely St Andrews Crew. I feel so, so incredibly lucky to have found you. I
could not have wished for better friends to work hard and play harder with. Thank you to
Heather, my Work Wife. Thank you for being nothing short of absolutely wonderful. Thank
you for making me laugh so much that my face hurts, and my belly aches. Thank you for being
such a constant source of strength, motivation and encouragement in all aspects of my life.
Thank you for all the sleepovers, the pep talks and for being my rock during the Great Typhoid
Incident of 2017. Thank you for being the Frasier to my Niles. “You’re a true friend of Jo. Dilly
Dilly.” Thank you to Chris for all the years of excellent cooking and even better dancing. Thank
you for the nights in, in front of questionable TV, and the days out, walking in questionable
terrain. Thank you for always having a sympathetic ear and for knowing exactly what to say.
In short, thank you for being you, and for being by my side though the whole of this journey.
Even when you’re spamming me with hideous internet junk, I’m so happy to call you my
Saucisson.
Thank you to Izzy and Holly as members of the First Wives Club. Thank you to Izzy for being
my international smuggling partner in crime, and for being such a thoughtful and loyal friend.
Thank you too for introducing me to the Guilty Feminist, and the wise words of Deborah
Frances-White that have truly changed how I feel about myself and my contribution to the

Acknowledgments
4
world. Thank you to Holly for being a constant (gurning) ray of sunshine and optimism, no
matter what comes along. Thank you to both of you for helping to keep me sane in the last few
months.
Thank you to Aubrie and Joe for the heart-to-hearts about anything and everything, the carpool
karaoke binges, the kitchen dancing, the 4am cocktails and for always making me feel so happy,
and so welcome during my ‘staycations’ down in the East Neuk. To be continued, neighbours.
Thank you to my lab buddies, Kelly, Caroline and Meredith for the hours spent giggling and
putting the world to rights in the basement. Thank you to my field work buddies, Lucia, Saana,
Tomoko, Mike and Takashi for your essential help, and for both the intentional and
unintentional comedy moments on board various boats. Thank you to everyone else in SMRU
who have made it feel like home, Chloe, Monica, Sian, ‘Veggie’ Matt, Debbie, Popi and so
many more.
Thank you to Jenny ‘do-what-I-can, go-where-I’m-needed’ Allen. You’ve always done what
you could, and gone where I’ve needed, and I can’t tell you how grateful I am to have you in
my life and know that I can always, always count on you for anything. Despite leaving tiny
little bits of food on your plate to irritate me, my life just wouldn’t be as good without you in
it. Thank you to Bannaner, my oldest friend. Thank you for all the weekend-away trips, the
getting lost wanderings, the embarrassing moments, starting the Yaris Club with me and not
being cross when people thought we were the same person. Thank you for being such a true
and fantastic friend ever since I can remember.
Thank you to Amy for being the absolute best housemate anyone could ask for. Really. Thank
you for always looking out for me, and looking after me through all the ups and downs and
round and rounds. Thank you for your friendship when it was needed most. Thank you for all
the laughs, the ridiculous quotes, the baking, the hacks and the late night Vikings. And please,
please, please remember that you ARE hilarious, and ignore anyone who tells you otherwise.
Thank you to Trudy for sharing your determined and confident outlook and attitude towards
life with me. You are truly inspirational, and I can’t express what a positive impact you’ve had
on me. I’m so grateful that out paths crossed when they did, and that you became such a good
friend.
Thank you to my best friends from Durham, to Hannah, Katrina, Megs, Cat and Sasha who
continue to love me, humour me, visit me, holiday with me, laugh at me and unfailingly be
there for me. As I write this, it’s 11 years ago to the week that you all walked into my life
(except Han who didn’t so much walk as jump dramatically and enthusiastically), and I can
honestly say I would not be the person I am today without you all. It’s been an absolute
privilege to know I’ve always got a gang of such incredible women behind me, and I look
forward to what the next 11 years will bring for us.
Thank you to my family, to Mum, Dad, Beck and PJ. Even though you’re all more often than
not in far-flung, exotic places, I know that you’re always only a phone call away. Thank you
for your unwavering love, support and confidence in me that have made this whole chapter of
my life possible.

Acknowledgments
5
And last, but by no means least, a very special thank you to Denver, Rocky, Woody, Vic, Alfie
and Amber for the hours and hours of fun distractions, entertainment, cuddles and
unconditional love that helps put everything into perspective at the end of a long day.

Abstract
6
ABSTRACT
Despite its importance as a predictor of fitness, no consensus has been reached about how to
assess the nutritive body condition of free-ranging cetaceans. Standard indices of condition
used in terrestrial ecology were assessed in cetaceans using data and samples from stranded
animals. The most appropriate morphometric indices were identified as mass/length2 and
girth/length (where mass data were unavailable). Blubber thickness, and blubber lipid content
were poor indicators of condition. Variation in lipid content suggested that there may be trade-
offs occurring between different blubber functions involved in energy storage, controlling
buoyancy, and preserving thermoregulatory properties in species with different life-history
strategies.
Novel blubber biomarkers of physiological state were investigated as objective and widely
applicable tools for estimating body condition. Blubber cortisol concentrations were negatively
correlated with morphometric indices of condition in stranded animals from two cetacean
families. Blubber cortisol concentrations were thus identified as a candidate biomarker. When
applied to a 13-year dataset of biopsy samples from female humpback whales (Megaptera
novaeangliae), cortisol concentrations showed significant inter-annual variation.
Concentrations were weakly correlated with annual pregnancy rates. High individual
variability in blubber cortisol concentrations was likely a result of the multi-functional nature
of cortisol. Cortisol concentrations thus probably provide a ‘snap shot’ of the metabolic state
of the tissue when sampled.
A proteomic approach was developed to extract and identify proteins in blubber. A range of
proteins involved in numerous metabolic processes and pathways were identified. These
proteins likely capture the range of physiological processes experienced by individuals at the
time of sampling. This new proteomic approach will help to assign novel functions to marine
mammal blubber in keeping with current understanding of the multi-functional role of adipose
tissue as an endocrine organ in mammals. It will also allow the future development of protein
biomarkers of health and physiological state.

Chapter 1 : General Introduction
7
CHAPTER 1 : GENERAL INTRODUCTION
Body condition can be defined in various ways. Here, the focus is on nutritive condition
quantified as the energy stores of an individual (Aguilar and Borrell, 1990; Pitt et al., 2006).
The size of these energy stores reflects an individual’s foraging effort and success, as well as
their reproductive needs throughout their life cycle (Aguilar and Borrell, 1990). Animals in
poorer condition have smaller energy stores than those in better condition. In females, overall
body condition is a good predictor of fitness by affecting both survival and reproductive
success (Hall et al., 2001; Lockyer, 1986; Pitcher et al., 1998; Pomeroy et al., 1999; Williams
et al., 2013). For males, individual body condition also affects reproductive success because
larger energy reserves are advantageous when Fighting for access to, or defending receptive
females (Forsyth et al., 2005; Lane et al., 2010). Body condition will also affect an individual’s
ability to resist infectious diseases, and its ability to survive periods of food shortage (Møller
et al., 1998; Verrier et al., 2011). More broadly, body condition has also been shown to affect
an animal’s behavioural patterns in relation to foraging strategies, predator avoidance, and
migratory movements (Bêty et al., 2003; Heithaus et al., 2007).
Variation in body condition has been linked to environmental quality and anthropogenic
activities and disturbance in a number of species (Bourbonnais et al., 2014; Delgiudice et al.,
2001; Harwood et al., 2000; Parker et al., 2009). Therefore, determining how body condition
influences vital rates and population dynamics is important for understanding species ecology,
and measuring resilience to environmental or anthropogenic stresses. Moreover, top marine
predators like marine mammals, can be valuable sentinel species of environmental quality as
their health may ultimately reflect the health of the ecosystems of which they are part.
Accurate measurement of body condition across age and sex classes is therefore a valuable tool
for conservation physiologists to assess individual health. The intrinsic complications of
studying cetaceans, however, make direct measurements of energetic reserves impossible in
live animals as the ‘standard’ set of morphometric measurements and biological samples
(blood, faeces and urine) cannot be routinely obtained. There are currently increasing efforts
to develop standardized methodologies for robust, minimally invasive measures that can be
applied across large numbers of individuals for population monitoring programmes.
Cetaceans have a thick layer of subcutaneous adipose tissue called blubber which is their main
site of lipid energy storage (Koopman et al., 2002; Lockyer, 1987). It typically makes up
anywhere between 15% and 55% of the body mass, depending on the species (McLellan et al.,
2002; Ryg et al., 1993). For this reason, body condition and energy stores of cetaceans were
traditionally examined using measurements of blubber thickness, total blubber volume, and
blubber lipid content of carcasses in conjunction with whaling operations (Konishi, 2006;
Lockyer, 1986; Lockyer, 1987; Víkingsson, 1995). Now, blubber samples from live animals
are routinely collected. Dart biopsying has rapidly become a common collection method for
obtaining biological tissue samples (Hunt et al., 2013).
Dart biopsy samples are collected using either a crossbow or a pneumatic rifle with modified
dart tips. These tips are hollow, thin-walled, surgical grade stainless-steel or titanium cylinders,

Chapter 1 : General Introduction
8
between 4 - 6 mm in diameter and 20 - 60 mm in length. Each dart has a cutting lead edge and
small internal barbs to retain the sample after impact (Barrett-Lennard et al., 1996; Larsen,
1998). The core sample collected from the dart is typically between 4 - 6 mm in diameter with
varying lengths, usually between 5 and 30 mm, depending on the species and the impact site.
This core sample consists of both skin and underlying blubber tissue. The species-specific
thickness of the skin and the blubber will determine the depth to which the core sample
penetrates through the tissue, and therefore how representative it is of the full blubber layer.
Biopsy samples have previously provided information about diet through fatty acid analysis of
the blubber (Waugh et al., 2012) and stable isotope analysis of the skin (Gavrilchuck et al.,
2014). Pollutant exposure has been assessed through contaminant concentrations measured in
the blubber (Krahn et al., 2007; Metcalfe et al., 2004). Genotype profiling of DNA from skin
samples has provided information on population genetics (Morin et al., 2017; Palsbøll et al.,
1997). The analysis of biopsy samples can therefore provide a wide range of ecological
information. Biopsy samples are also increasingly being used to study different physiological
processes in sampled individuals. For example, altered stress response protein expression has
been measured in skin samples (Dizon et al., 2002; Southern et al., 2002). It was suggested that
this method may be suitable for assessing chronic stress rather than the acute stress associated
with sampling. The genes involved in the vitamin D3 pathway have been detected in the skin
and may provide information on immune system function (Ellis et al., 2009). Finally,
cytochrome-P related enzymes in the mammalian liver are effective biomarkers of pollutant
burden. These enzymes have now been measured in skin samples from several cetacean species
and appear to be useful indices of contaminant exposure (Fossi et al., 2010; Waugh et al., 2011).
To date, physiological state markers in the blubber have focused on lipophilic steroid hormones
to investigate reproductive status (Clark et al., 2016; Pallin et al., 2018a; Pallin et al., 2018b;
Perez et al., 2011), sexual maturity (Kellar et al., 2009), and adrenal function and the stress
response (Champagne et al., 2017; Champagne et al., 2018; Kellar et al., 2015; Schwacke et
al., 2014; Trana et al., 2016). Recent advances in molecular sequencing and biochemical
detection techniques have led to the application of transcriptomic analyses of blubber tissues
to investigate adipogenesis, lipolysis and fasting metabolism in phocid seals (Khudyakov et
al., 2017; Martinez et al., 2018). This approach has not yet been applied to cetacean blubber
samples. The blubber is therefore now being increasingly recognised as a valuable tissue for
conservation physiologists for three main reasons. Firstly, the blubber plays a key role in
energy storage and metabolic homeostasis. Secondly, there is a growing field of research to
maximise the ecological and physiological information available in biopsy samples. Thirdly,
blubber is easily accessible for sampling.
The next stage is to identify measurable parameters, or biomarkers, in the tissue that can serve
as reliable and cost-effective indicators of nutritive body condition and physiological state in
order to make inferences about individual health. A biomarker is defined as a naturally
occurring molecule, gene, or characteristic which allows a particular pathological or
physiological process to be identified (Atkinson et al., 2001). The application of biomarker
techniques is currently widely used in human medicine and ecotoxicology (Steffen et al., 2016;
Zhang et al., 2004). New biomarker approaches applied to cetacean research will benefit from

Chapter 1 : General Introduction
9
interdisciplinary collaborations between cetacean biologists and experts in other areas of health
and medical sciences for the integration of different methods.
The development of new biomarkers is an emergent and timely approach as the recent ‘omics’
revolution has provided new tools and methods for both the qualitative and the quantitative
assessment of a wide range of biomolecules from the genome to the metabolome level
(Gomez-Cabrero et al., 2014; Horgan and Kenny, 2011). The term ‘omics’ refers to a group of
technologies that characterise and quantify biological molecules in order to explore their roles
in cells and tissues. The ‘omics’ suffix has been added to describe the use of these technologies
to examine proteins (proteomics), metabolites (metabolomics) and RNA (transcriptomics)
(Horgan and Kenny, 2011). As a result, explorative analysis (instead of hypothesis driven
research) has become applicable to a range of different cell types, tissues and organs (Gomez-
Cabrero et al., 2014). Here, these approaches will improve our ability to determine body
condition in its broadest sense because they encompass a range of processes that contribute
to an individual’s heath and physiological state at the time of sampling. This kind of
information may not be captured in basic measures of morphometrics, lipid stores or fatty
acid profiles, for example.
For effective method development and biomarker identification, full depth blubber samples are
required from individuals of a known body condition and physiological state for ‘ground
truthing’ purposes. Samples with accompanying individual covariates from stranded animals
are therefore particularly important for this kind of work. Specifically, samples from
individuals of different species with varied life-history strategies are important for comparison.
Samples associated with post-mortem data including basic case descriptors, morphometrics,
identification of pathological processes and, where possible, a cause of death are especially
valuable. The use of different biomarkers of nutritive condition can thus be established using
samples from fresh, dead, stranded animals first in order to accurately interpret results from
live biopsy samples and to put them into a population-level context.
There are broadly two main themes of this work. The first is the validation of previously used,
standard indices of body condition in cetaceans. The second is the investigation of novel
blubber biomarkers of body condition, health and overall physiological state. These two main
themes are split into the following aims:
1) Identify the most appropriate morphometric indices of overall body condition that reflect
total body energy stores.
2) Investigate the use of blubber lipid content, a previously used index of body energy stores,
as a biomarker of overall condition applicable to remotely obtained biopsy samples.
3) Investigate the use of blubber cortisol and blubber progesterone as endocrine biomarkers
of body condition and pregnancy status, respectively.
4) Use a proteomic approach to explore the proteome of cetacean blubber tissue and
investigate other potential biomarkers of health and physiological state.
The identification of the most appropriate morphometric indices of body condition for
cetaceans can be used as a reference for ‘ground-truthing’ blubber biomarker development and

Chapter 1 : General Introduction
10
validation investigations. The assessment of both previously used and novel blubber
biomarkers of body condition, physiological state and pregnancy status has important
applications for the analysis of remote biopsy samples that can be rountinely collected from
free-ranging cetaceans. The identification of useful biomarkers will thus help to develop and
establish potential population health monitoring tools that can be applied across a range of
different species. Finally, this work will improve our understanding of the potential functions
of cetacean blubber as an endocrine tissue involved in the metabolic control of many of the
extreme life-history strategies characteristic of these animals.

Chapter 2 : Morphometric Indices
11
CHAPTER 2 : EVALUATING MORPHOMETRIC
INDICES OF BODY CONDITION OVER A 425:1
MASS RANGE IN CETACEANS
The harbour porpoise data analysis and discussion part of this chapter has been published in
Ecology and Evolution (2017).
Kershaw JL, Sherrill M, Davison NJ, Brownlow A, Hall AJ. Evaluating morphometric and
metabolic markers of body condition in a small cetacean, the harbor porpoise (Phocoena
phocoena). Ecology and Evolution. 2017;7(10):3494-3506.

Chapter 2 : Morphometric Indices
12
1. ABSTRACT
No consensus currently exists on the best measure to quantitatively estimate body condition
from body measurements in many species, including cetaceans. Here, the morphometric body
condition index most diagnostic of nutritional status based on a set of biologically plausible
hypotheses was assessed across three families of cetaceans. Morphometric data collected from
stranded cetaceans by the Scottish Marine Animal Strandings Scheme from Phocoenids,
Ziphiids and Balaenopterids were used to identify an informative condition index based on its
ability to distinguish between individuals of varying condition according to their cause of death
and their age class. Across all three species groups, blubber thickness was a consistently poor
indicator of condition. The mass/length2 ratio was the most appropriate morphometric index of
10 indices tested for the Phocoenids, explaining 50% of the variation in condition in stranded,
male harbour porpoises (Phocoena phocoena) with different causes of death and across age
classes (n = 291). The scaling relationship between mass and length was important to include
for this species in order to obtain a condition index that was largely independent of body size
and thus applicable across different age classes. Mass data were not available for all the
Ziphiiid and Balaenopterid individuals, but estimations of mass using previously published
relationships between girth and length were poor fits to the data for the small number of
individuals where mass had been recorded. Thus, the girth/length ratio was identified as the
most appropriate index for both the Ziphiids and the Balaenopterids in the absence of mass
data.
The girth/length index was a good fit to the data from male minke whales (Balaenoptera
acutorostrata) (n = 14), explaining 64% of the variation in the data with the expected
relationships between cause of death and age class. The same index, while the best fitting of
the four indices tested, was a poor fit to the Ziphiid data (n = 18), explaining just 16% of the
variation. Here, the expected relationships between cause of death and age class were not
observed, and there was little variation in overall condition between individuals. This
unexplained variation could be a result of the bias in the data towards juveniles, and because
the cause of death was not established for all animals. The lack of variation could also be
specific to the Ziphiid family that shows less variability in their energy reserves. The
morphometric condition indices identified here as the most appropriate to assess the nutritive
body condition of these species can be used in comparative studies to assess other potential
markers and indices of condition where a ‘ground truthing’ approach is required to evaluate
novel methods.

Chapter 2 : Morphometric Indices
13
2. INTRODUCTION
Several methods have been used to assess the body condition of mammals, and these generally
fall into two categories : direct and indirect measures (Pitt et al., 2006). Direct measures
quantify the amount of stored lipids within an individual which typically involves sacrificing
the animal and measuring the amount of subcutaneous, visceral and muscle fat. Measuring the
condition of live animals is more difficult and indirect measures are used that generally relate
body mass to linear measures of body size. These morphometric measures therefore provide a
non-destructive means of estimating an individual’s body condition (Pitt et al., 2006). The
ultimate goal of using a relationship between body mass and length measurements is to
interpret variations of body mass for a given body size as an attribute of the individual’s
condition in terms of the size of its energy reserves, and therefore it’s overall wellbeing (Peig
and Green, 2010).
A wide range of different formulae and statistical methods have been proposed to standardise
body size measurements, but there is still much debate about which methods are the most
suitable to provide informative condition indices (Peig and Green, 2010). The most
conventional methods include simple ratios between mass and length, and also girth and length,
but other, more complex relationships have also been established as indicators of body
condition in a number of different taxa. These include the Fulton Index, Quetelet’s Index,
Relative Condition, Relative Mass and the Residual Index (Peig and Green, 2010). Currently,
no overall consensus has been reached about the best condition index, or criteria which allow
the objective determination of the most appropriate index for any given species or a particular
study. Instead, different disciplines tend to follow the traditions within their field, for example,
the Residual Index is typically used in terrestrial ecology while mass to length ratios are
consistently used in fisheries and health sciences. However, there have been a growing number
of studies that criticise these approaches for being overly simplistic (Albrecht et al., 1993;
Freckleton, 2002; Garcia-Berthou, 2001; Green, 2001; Packard and Boardman, 1999). This is
because they assume that the proportion of mass associated with energy reserves is independent
of body size, and do not take into account normal growth processes. This makes them
inappropriate measures of condition (Green, 2001; Peig and Green, 2009, 2010; Schulte-
Hostedde et al., 2005).
As most of the fat stores in cetaceans are found in the blubber, it has been previously assumed
that indirect indices which reflect the amount of blubber an individual has, such as blubber
thickness and body girth, are good indicators of nutritive condition (Koopman, 1998; Koopman
et al., 2002; Kuiken et al., 1994; Lockyer, 1986; Lockyer et al., 1985; Moore et al., 2001). For
this reason, blubber thickness continues to be used as a standard condition index despite
evidence that this measure may not provide an accurate indication of overall condition as it
assumes that blubber thickness is directly proportional to changes in lipid mass, and by
extension, body energy stores that reflect nutritive condition (Aguilar et al., 2007; Caon et al.,
2007; Evans et al., 2003; Gómez-Campos et al., 2011; Koopman, 2007; Read, 1990; Ruchonnet
et al., 2006). This assumption may be incorrect because cetacean blubber serves other functions
as well as energy storage including thermoregulation, streamlining and buoyancy (Iverson,
2009). These other functions limit the extent to which the blubber can change in mass and in

Chapter 2 : Morphometric Indices
14
thickness if they are to be preserved. In addition, Christiansen et al. (2013) modelled total
blubber volume of minke whales (Balaenoptera acutorostrata) using blubber thickness and
morphometric measurements, and concluded that across body variations in blubber deposition
in this species are too large to be captured by a single thickness measurement (Christiansen et
al., 2013). This may be the same for other species too. For these reasons, more robust
morphometric measures of body condition that directly reflect the energy stores of the
individual should be investigated rather than relying on a single measurement of blubber
thickness.
The body condition of cetaceans has also been estimated using various other measurements
obtained from whales killed during whaling operations. For example, total lipid content of
blubber, muscle and visceral fat have been estimated for a number of species (Ackman et al.,
1975a; Lockyer, 1986; Lockyer, 1987; Lockyer et al., 1985). These data are generally only
available from whaling datasets, and typically only one measurement was taken in each case,
so there are few data available to compare different indices. Other common indices used in
cetaceans are maximum girth, length and mass (Read, 1990; Víkingsson, 1995). More recent
efforts have considered different scaling relationships between these measures (Hart et al.,
2013), and estimations of total blubber volume (Christiansen et al., 2013). In addition, live-
fisheries of killer whales (Orcinus orca) for aquaria, have generated valuable data on mass-
length relationships (Bigg and Wolman, 1975), but because of the size-selective nature of
captive animals, there is little information on the largest individuals. Captive cetaceans have
also provided information on the health, physiology, metabolism and energy requirements
(Rechsteiner et al., 2013; Rosen and Trites, 2013; Worthy et al., 2013), but these data are
unlikely to be representative of wild populations. Thus, there are few data sets available to
fully assess which metrics are best used to estimate the condition of cetacean species. Data
collected from stranded animals can help to fill this gap as often a suite of measures are
available for each individual, and can be used to assess different indices of condition
simultaneously (Caon et al., 2007; Gómez-Campos et al., 2011; Read, 1990). These data are
ideal for comparative studies as a range of individuals from a population across different age
and sex classes can be sampled.
The aim of this work was therefore to identify the most appropriate morphometric condition
index across three families of cetaceans; Balaenopteridae, Ziphiidae and Phocoenidae, chosen
here for comparison due to their different life-history strategies, and thus their varying reliance
on endogenous fat stores. Here, morphometric data collected from stranded, male cetaceans by
the Scottish Marine Animal Strandings Scheme were analysed to identify a morphometric
index most diagnostic of nutritional status based on a set of biologically plausible hypotheses.
Females were not included in the analysis so as to remove the confounding effects of
reproductive state. The most appropriate morphometric condition index identified for each
family will later be used to investigate variations in alternative physiological biomarkers of
condition in Chapters 2 to 6.

Chapter 2 : Morphometric Indices
15
3. METHODS
3.1 Morphometrics Dataset
Data collected by the Scottish Marine Animal Strandings Scheme (SMASS) from stranded
male cetaceans around Scotland were collated between January 1991 and January 2018 to
assess different morphometric measures of body condition. These data were from 327
individuals from five different species across three cetacean families, Balaenopteridae,
Ziphiidae and Phocoenidae. These were minke whales, Sowerby’s beaked whales
(Mesoplodon bidens), Cuvier’s beaked whales (Ziphius cavirostris), Northern bottlenose
whales (Hyperodon ampullatus) and harbour porpoises (Phocoena phocoena). These data are
summarised in Table 2.1.
For these animals, the cause of death (COD) was determined either by necropsy, or based on
visual observations of the carcass showing signs of trauma, disease or emaciation. Two COD
categories were generated: ‘acute’ cases were individuals that died of an acute trauma (bycatch,
entanglement, storm damage, and predatory attacks e.g. bottlenose dolphin or grey seal attacks
on harbour porpoises), and ‘chronic’ cases were individuals that died of general debilitation
either though infectious disease (parasitic, bacterial, viral, or mycotic infections), starvation
(severely emaciated animals that died of starvation/hypothermia) or chronic injury (e.g. long-
term entanglement). Measurements of mass, length (tip of rostrum to fluke notch), girth
(immediately anterior of the dorsal fin) and blubber thickness (immediately anterior of the
dorsal fin) to the dorsal fin along the dorsal, lateral and ventral axes were taken (Kuiken and
Hartmann, 1991), but due to the logistical constraints presented by their larger body size, mass
was not recorded for all the ziphiids or the minke whales. Females were not included in the
analysis as the reproductive status (pregnant, lactating or resting) was not known for all
individuals sampled and measured over the same time period. Reproductive status would likely
have affected the estimated condition of the individuals as pregnant females increase in both
mass and girth irrespective of their condition. Thus, without knowing the pregnancy status of
females, all metrics that contain mass and girth are inherently confounded as they represent
changes in both body condition and pregnancy status.

Chapter 2 : Morphometric Indices
16
Table 2.1 – Summary of the mysticete and odonotcete data across three cetacean families used
for analysis.
Family Species Sample Size
Phocoenidae Harbour porpoise
(Phocoena phocoena)
291
Ziphiidae
Sowerby’s beaked whale
(Mesoplodon bidens)
12
Balaenopteridae
Cuvier’s beaked whale
(Ziphius cavirostris)
2
Northern bottlenose whale
(Hyperodon ampullatus)
8
Minke whale
(Balenoptera acutorostrata)
14
Harbour porpoises: Over a ten-year period, between 2006 and 2016, data from 291 male
harbour porpoises were used for analysis. For these animals, the cause of death had been
determined, and a full set of morphometric measurements had been taken. The individuals were
grouped into age classes based on the size of males at sexual maturity. Adults were ≥ 135cm
(Ólafsdóttir et al., 2002), calves were ≤ 90cm (Lockyer, 1995), and others were classed as
juveniles. These data were collected across all months of the year and were further grouped
into two different life history stages to investigate potential annual changes in condition as a
result of the different energetic costs of the harbour porpoise life cycle. The data were separated
into ‘Breeding’ and ‘Non-Breeding’ stages of the life cycle. As the peak calving months are
June and July in the North Sea (Lockyer, 1995), and a spike in male testes mass in August
suggests that mating occurs largely in this month (Lockyer, 1995), data from June, July and
August were grouped as ‘Breeding’ (n= 66) and the rest of the year was considered ‘Non-
Breeding’ (n = 225).
Ziphiids: As a result of the small sample size of ziphiid individuals collected by the SMASS,
data were collated between 1994 and 2017 from 22 male individuals of three species (Table
2.1). These individuals had accompanying morphometric measurements of girth, length and
three blubber thickness measurements. Mass was recorded for only four of the individuals.
Here, individuals were assigned cause of death categories of chronic and acute as before. As a
result of the smaller sample size, individuals where the ultimate cause of death was live
stranding, but where the underlying causes of the stranding had not been determined were
retained for analysis and classed as ‘Live Stranding’ cases as well. These were identified based
on evidence of asymmetry in the lungs as well as bruising and damage to the body associated
with the stranding event. The beaked whales include some of the world’s most cryptic and
difficult to study mammals, and little is known about their behaviour and ecology (MacLeod,
2018). For this reason, size estimates at maturity are less well documented and their breeding
and reproductive cycles are largely unknown in the North Sea and the eastern North Atlantic.
Species-specific body size estimates were used to classify them as adults, juveniles and calves.
Northern bottlenose whales are thought to measure between 7-9m in length, with calves

Chapter 2 : Morphometric Indices
17
measured between 3.0-3.3m (Whitehead et al., 1997). Here, individuals of greater than 7m
were considered as adults, and smaller than 3.3m were calves. All eight individuals measured
here were juveniles. Cuvier’s beaked whales grow to between 5-7m in length, with no
significant size difference between the sexes (Heyning, 2002). Here, individuals larger than 5m
were classed as adults. The two individuals measured were an adult and a juvenile. Finally,
adult Sowerby’s beaked whales were the smallest of the beaked whales measured here and are
between 4.5-5.5m in length with calves measuring between 2.4-2.7m (Hooker and Baird, 1999;
Mead, 1989). Individuals smaller than 3m were classified as calves, and larger than 4.5m were
classified as adults. Here, two calves, six juveniles and four adults were measured. Few data
are available regarding the reproductive or migratory patterns of these species, the data were
not classified into breeding and non-breeding animals as was the case for the harbour porpoises.
Minke whales: Data from 14 male minke whales collected between 1995 and 2016 were used
here for analysis. Morphometric measurements of girth, length and three blubber thickness
measurements were collected, but mass was not recorded. The cause of death was established
through post-mortem examination, and individuals were classed as acute or chronic cases as
before. Adult males were > 6m, calves were <4.5m and the rest were considered as juveniles
(Hauksson et al., 2011). A total of three adults, four juveniles and seven calves were measured.
Like most mysticete species, minke whales undertake long-distance seasonal migrations
between highly productive feeding grounds in the summer and less productive breeding
grounds in the winter. Breeding and non-breeding parts of their life-cycle are therefore both
temporally and spatially segregated. Summer feeding grounds are located in various areas
across the North Atlantic, but breeding grounds are unknown, and are believed to be located
close the equator (Vikingsson and Heide-Jørgensen, 2005). As little is known about the
reproductive cycle or biology of this species away from their summer feeding grounds, and as
these data all came from northerly latitudes that are thought to be more important for feeding
rather than breeding, these data were not split into seasons for analysis.
3.2 Body Condition Indices Calculations
Seven body condition indices commonly used to assess condition in mammals were calculated
based on previous work across a number of vertebrate species (Peig and Green, 2009, 2010)
(Table 2.2). As well as these seven indices, the thickness of the ventral blubber and dorsal
blubber were also investigated as potential body condition indices based on previous work that
suggests that blubber thickness at these two sites can be used to estimate condition in small
odontocetes (Koopman, 1998; Koopman et al., 2002) and baleen whales (Lockyer, 1986;
Lockyer et al., 1985). Across the species groups sampled, there is currently no evidence to
suggest that deposition and mobilisation of lipids occurs laterally as a result of energy store
variation. So, the blubber thickness of this site was not incorporated into any of the condition
indices investigated here. Two additional condition metrics, blubber thickness/girth and
blubber thickness/length were also assessed as potentially more useful indices than blubber
thickness alone that may vary as a function of overall size of the individual irrespective of its
relative condition. Mass was not measured for the majority of the ziphiids, or any of the minke
whales as a result of the logistical constraints associated with measuring such large animals.
Attempts were therefore made to estimate mass based on published mass-length-girth

Chapter 2 : Morphometric Indices
18
relationships for these species. Previous work by Bloch and colleagues (1996) estimated the
relationship between mass and length in northern bottlenose whales for both sexes as:
W = 0.0000131 x L3.07
Where W is mass in kg and L is length in cm.
This equation was used to estimate the mass of the ziphiids based on their length measurements
here, but it was found that this overestimated the mass by between ~40% and ~80% where
mass had been recorded for four individuals (Fig. 2.1a). This is likely because this relationship
is not appropriate for some of the smaller beaked whale species that were sampled here because
it was proposed for Northern bottlenose whales (Bloch et al., 1996). In addition, using length
alone is likely an inappropriate way to estimate mass, because it cannot account for any changes
in the body composition of the individuals in varying condition which will affect their mass,
and an extra metric, such as body girth, should be included to obtain better estimates.
Based on whaling records for baleen whales, the estimated relationship between mass, length
and girth in fin and sei whales (Balaenoptera borealis) (Lockyer and Waters, 2006; Víkingsson
et al., 1988) was calculated as:
W = aGkLk’
Where W is mass in tonnes, G is the mean of three girth measurements taken anterior (n = 2)
and caudal (n = 1) to the dorsal fin in meters, and L is the length in meters.
For sei whales, as the smaller of the two species that are therefore closer in size to minke
whales, a = 0.11, k = 1.32 and k’ = 1.097. This equation was used to estimate the mass of four
minke whale females that were not included in the larger dataset because of their sex, but their
mass had been recorded. These were two juveniles and two calves. Their mass was calculated
using this equation based on their length and a single girth measurement, and used for
comparison with the measured mass of the individuals (Fig. 2.1b). Similarly to the ziphiids, the
calculated masses were overestimated by between ~50% and ~100% (Fig. 2.1b). There may be
very different species-specific scaling relationships between these morphometric
measurements for balaenopterids which means that these model parameters are a poor fit to
data from other species. This likely led to the disparity between the estimated and the measured
masses here. It is also likely that these relationships between girth, length and mass are biased
towards larger, adult animals which were typical of whaling catches. For this reason, they were
not as appropriate for the much smaller calves and juveniles for which data were available here.
Had these estimated masses been used for the calculation of any of the mass-dependent body
condition indices, the conclusion about the condition of the animals would be different. For
this reason, the morphometric indices using a mass measurement were not calculated and used
for evaluation for the ziphiids or the minke whales.

Chapter 2 : Morphometric Indices
19
Fig. 2.1. Measured and estimated masses of ziphiids and minke whales. a) Estimated
masses of four male ziphiids were calculated based on the relationship between mass and length
in northern bottlenose whales published by Bloch and colleagues (1996). All mass estimates
were higher than the measured masses of the individuals by between 48% and 84%. b)
Estimated masses for four female minke whales were calculated based on the relationship
between mass, length and girth in Sei whales published by Vikingsson and colleagues (1988).
All masses were also overestimated for these animals by between 47% and 99%.

Chapter 2 : Morphometric Indices
20
Table 2.2 – Body condition indices and their calculation. With the exception of ventral blubber
thickness, ventral blubber : girth and ventral blubber : length, formulae are taken from Peig and
Green, 2010.
Index Formula and Explanation
Blubber Thickness
Full ventral blubber depth (Phocoenids, and Ziphiids)
Full dorsal blubber depth (Balaenopterids)
Ventral Blubber : Girth Full ventral or dorsal blubber depth / girth
Ventral Blubber : Length Full ventral or dorsal blubber depth / length
Girth : Length Girth / Length
Mass : Length Mass / Length
Fulton’s Index K = Mass/Length3
Quetelet’s Index BMI = Mass/Length2
Relative Condition Kn = Mi/Mi* (individual Mass/Predicted Mass)
Mi* = a Lib where a and b are determined by ordinary least
squares (OLS) regression of M against L for the whole
study population
Residual Index
Ri, the residuals from an OLS regression of M against L,
after log transformation
Scaled Mass Index
�̂�𝑖 = 𝑀𝑖 [
𝐿𝑜
𝐿𝑖]
𝑏𝑆𝑀𝐴
Where Mi and Li are the mass and length of an individual. bSMA is the scaling component estimated by the
standardized major axis (SMA) regression of lnM on lnL.
L0 is the arithmetic mean of the length of the study
population.
�̂�𝑖 is the predicted body mass of the individual when the
linear body measure is standardised to L0.

Chapter 2 : Morphometric Indices
21
3.3 Statistical Analysis
All statistical analyses were performed using the statistical package, R, version 3.1.2 (R Core
Development Team, 2014).
The most representative morphometric index of body condition was investigated based on three
ground truthing assumptions:
1. ‘Chronic’ cases will have a lower body condition index than ‘acute’ cases because the
acute cases died as a result of critical physical injury and did not become debilitated
with a gradual decline in their health.
2. Overall, juveniles will have a lower condition index than adults. These individuals are
foraging independently for the first time making them vulnerable to nutritional stress.
This age group is also most likely to be physiologically stressed due to immunological
challenge by parasites encountered for the first time, and any extra energy acquired is
likely used for growth rather than retained as fat stores.
3. Body condition in the breeding season will be lower than the rest of the year because
males expend energy on reproduction.
A reliable condition index should therefore be able to differentiate between individuals with
different CODs, age classes and life-history stages. Each species group was modelled
individually. The condition of an individual was assumed to be independent of the condition
of others, there was no evidence of different standard deviations across the COD classes, age
classes, or season groups for each index (leveneTest in the Rcmdr R package to test for
homogeneity of variance between groups, p values all > 0.05), and all indices were normally
distributed for each species group. Linear regression models were used to investigate the
relationship between the index and the suite of covariates discussed above as well as an
interaction between season and age class in the phocoenids. Backwards model selection was
performed using the dredge function (MuMIn package in R) which identifies the variables
and/or interactions that best explain the variation in the data. Dredge performs automated
model selection with subsets of a supplied ‘global’ model including all covariates and
interactions of interest, and optional choices of other model properties (such as different link
functions). All possible combinations of covariates and their interactions were generated, and
the model with the lowest AIC value (Akaike Information Criterion) with at least a value of
two smaller than the next smallest AIC value, was identified as the best model for each index,
and was used for further interpretation. For each index, the model with the smallest AIC met
these criteria, so there were no models that would have been considered of equivalent fit to the
data.
Visual inspections of the model residual plots and fitted values were used to check the fit and
assumptions of the final models. When residuals are plotted against the fitted values, if the
model is suitable and has not violated any major assumptions, there should be no obvious
patterns or trends across the data points. If the model fits well, the fitted values should be
similar to the observed values and when plotted together would lie approximately along the 45o
line. If this is not the case, there may be some autocorrelation in the data and some over- or
under-prediction occurring in the model.

Chapter 2 : Morphometric Indices
22
The relationships between the covariates retained after model selection for each index were
evaluated, and the model fit was assessed using the Adjusted R2. As well as evaluating the
model fit, the variance explained by each variable retained in the final models was also
assessed. When there is more than one predictor, the partial eta-squared (partial η2) is the
proportion of the variance explained by a given predictor after excluding variance explained
by the others (Levine and Hullett, 2002). For each body condition index model, partial η2
values were used to assess the importance of each variable retained after model selection.
Partial η2 values were calculated using the ‘etasq’ function in the heplots library in R; the sums
of squares for the effect of interest was divided by the combined sums of squares of the effect
of interest and the associated error term.
The condition index that showed the expected relationships based on the ground truthing
assumptions and was a good fit to the data (a high adjusted R2) and thus had good predictive
power, was identified as the most appropriate morphometric index for that species group.

Chapter 2 : Morphometric Indices
23
4. RESULTS
4.1 Harbour porpoises
The interaction between age class and season was not retained in any of the linear models. The
predominant COD varied by age class. Fewer calves died as a result of trauma (25%) compared
to both juveniles and adults (47.8% and 49.1% respectively). There was a significant effect of
COD on all body condition indices (Table 2.3). All indices showed that the chronic cases were
in poorer condition than the acute cases, as hypothesised based on the ground truthing
assumptions, but the results varied by age class. Five of the indices suggested that adults were
in better condition than the other age classes, and the other five suggested that there was either
no effect or they were in poorer condition (Table 2.3).
As it is unlikely that, overall, adults would have smaller energy reserves than both juveniles
and calves, these condition indices (blubber thickness/girth, blubber thickness/length and
Fulton’s Index) were not used for further interpretation. As girth/length and the Scaled Mass
Index showed no differences between age classes, these were also dropped for further
interpretation. Of the remaining indices (blubber thickness, mass/length, Quetelet’s Index,
Relative Condition and the Residual Index), there was little variation in the effect size for COD
between the final models for each index with partial η2 values ranging from 0.11 to 0.19 (Table
2.3). However, there was more variation in the effect size for age class between these models,
with partial η2 values ranging from 0.06 to 0.69 (Table 2.3). The model for mass/length was
the best fit to the data with an adjusted R2 value of 0.72 (Table 2.3), but, as seen with the partial
η2 values for COD and age class, the variation is largely explained by the age class, and thus
the different size of individuals.
Generally, mass shows a strong non-linear relationship with length, which was also the case
for these male porpoises (Fig. 2.2a), such that much of the variation in mass is accounted for
by changes in length (Hayes and Shonkwiler, 2001). Thus, indices of condition that are not
explicitly based on allometric models are affected implicitly by the scaling of mass and length
(Hayes and Shonkwiler, 2001). For this reason, the simplest mass/length condition index,
identified here as the best fit to the data, is correlated with body size (Fig. 2.2b). Mass/length
as a condition index is therefore flawed because it inherently incorporates an association
between length and condition and can therefore be misleading because the effects of condition
are likely confounded with the effects of size for this species.
The second best fitting model for these data was the Quetelet’s Index (mass/length2) with an
adjusted R2 value of 0.50. In addition, for mass/length2, the effect size for COD was highest
with a partial η2 value for COD of 0.19. Thus, using differences in COD as the most relevant
ground truthing assumption for detecting changes in condition, this index explains the most
variation in the COD data. In general, the relationship between mass and length can be
modelled as:
mass = δ + α lengthβ (Hayes and Shonkwiler, 2001).
This equation shows that mass is a power function of length plus an intercept term, and the
parameters of this equation can be estimated empirically by non-linear regression. When the

Chapter 2 : Morphometric Indices
24
goal is to generate a condition index that is independent of size, use of the mass/length ratio
may be reasonable if mass scales with length such that β = 1 and δ is close to 0 (Hayes and
Shonkwiler, 2001). If the scaling exponent does not equal 1, then obtaining a size-independent
condition ratio requires that some scaling exponent other than 1 should be used.
The above non-linear model was fitted to the harbour porpoise data (nls function in the R
package nlstools) (Fig. 2.2a). The δ parameter estimate was -3.17 with large 95% confidence
interval of -9.10 to 1.66. As a negative intercept is not biologically plausible, this is likely
driven by a lack of data for very small calves and foetuses. As this non-linear model would not
be used to extrapolate beyond the smallest individuals measured here, and the intercept
parameter estimate confidence interval incorporates 0, the intercept is assumed to be around 0.
The β exponent was estimated as 2.33 (with 95% confidence intervals of 1.89 - 2.77) which
suggests that while mass/length2 showed a poorer overall fit to the data compared to
mass/length, it is a better index to use here in order to obtain an index largely independent of
body size (Fig. 2.2c). Using this index, the condition of adults and juveniles can be better
compared (Fig. 2.2c), but the condition index of calves compared to the other two age classes
should be interpreted with caution. Using mass/length2, acute cases were in significantly better
condition than the chronic cases (p value < 0.005) (Fig. 2.3a), and adults were in the best
condition and calves in the poorest (p values all < 0.005) (Fig. 2.3b), but season was not
retained in the best-fitting model (Table 2.3).
Fig. 2.2. Relationships between mass and length and their ratios for male harbour
porpoises. a) Non-linear scaling relationship between mass and length for male harbour
porpoises modelled using non-linear least squares regression where mass = -3.71 x
0.0004length2.33. b) Positive correlation between mass/length and length with calves shown in
white, juveniles in black and adults in grey. Using mass/length as a condition index is therefore
not independent of body size. c) Relationship between mass/length2 and length demonstrating
that mass/length2 is a more appropriate index for this species to compare between adults and
juveniles as it is largely independent of body size.

Chapter 2 : Morphometric Indices
25
Table 2.3 - Summary of the covariates used in the linear regression models for each body
condition index for the harbour porpoise data. * indicates that the variable was retained after
model selection. ** indicates that the variable was retained and statistically significant (p <
0.05). If ground truthing assumptions were met, the relationships are marked with a ‘+’, while
different relationships are marked with ‘-’. Partial η2 is the proportion of variance explained by
that variable in the final model after excluding variance explained by the other variables.
Body Condition Index Model
Model Covariates used in
Model Selection
Model
Adjusted
R2 COD Age Class Season
Ventral Blubber Thickness
Variable Retained
Assumptions Met
Partial η2
**
+
0.15
**
+
0.06
**
+
0.01
0.22
Ventral Blubber / Girth
Variable Retained
Assumptions Met
Partial η2
**
+
0.14
**
-
0.05
**
+
0.01
0.09
Ventral Blubber / Length
Variable Retained
Assumptions Met
Partial η2
**
+
0.14
**
-
0.05
*
+
0.01
0.15
Girth / Length
Variable Retained
Assumptions Met
Partial η2
**
+
0.19
*
-
0.01
0.19
Mass/Length
Variable Retained
Assumptions Met
Partial η2
**
+
0.17
**
+
0.69
0.72
Fulton’s Index
Variable Retained
Assumptions Met
Partial η2
**
+
0.13
**
-
0.08
0.17
Quetelet’s Index
Variable Retained
Assumptions Met
Partial η2
**
+
0.19
**
+
0.40
0.50
Relative Condition
Variable Retained
Assumptions Met
Partial η2
**
+
0.17
**
+
0.08
0.25
Residual Index
Variable Retained
Assumptions Met
Partial η2
**
+
0.11
**
+
0.17
0.21
Scaled Mass Index
Variable Retained
Assumptions Met
Partial η2
**
+
0.14
0.14

Chapter 2 : Morphometric Indices
26
4.2 Ziphiids
All final models for each body condition index were poor fits to the data (Table 2.4). As 68%
of the animals (15 / 22) were juveniles, the dominance of juveniles in the dataset likely affected
covariate selection. All acute cases were juveniles and 67% of the chronic cases were also
juveniles. Unfortunately, the cause of death could be not attributed to either an acute or chronic
cause for 50% of the animals which were therefore classed as live stranded cases. This small
sample size of acute and chronic cases is likely the reason why cause of death was not retained
as an important covariate following model selection in the three best fitting models for these
species. Only the ventral blubber thickness model retained COD after variable selection, but
the effect size was small with a partial η2 value of 0.10, and this model was the poorest fit to
the data (Table 2.4). The best fitting model was the girth/length model although this did not
show the expected relationship with age class as while juveniles were not significantly different
to the adults, calves were in significantly better condition (p = 0.04). The relationship between
girth and length was not plotted and assessed for these individuals as the multi-species nature
of the data would not produce a realistic scaling relationship of these two measures for these
animals, but girth/length as an index appears to be independent of body size (Fig. 2.4). As
girth/length explained the most variation in the data with the best fitting model, this was taken
to be the most appropriate index of condition for these species even though the expected
relationship with age class was not seen. This discrepancy could be the result of the small
sample size of adults and calves used for comparison.
Fig. 2.3. Output from the final mass/length2 linear regression model for harbour
porpoises: lm(Mass/Length2~as.factor(COD)+as.factor(Age Class)) (n=291). a) The
chronic cases had a significantly lower mass/length2 index than the acute cases (p value <
0.005). b) Adults had the highest mass/length2 index of all three age classes (p value < 0.005).

Chapter 2 : Morphometric Indices
27
Table 2.4 - Summary of the covariates used in the linear regression models for each body
condition index, and the results of the model selection for the ziphiids. * Variable retained after
model selection. ** Variable retained after model selection and statistically significant (p <
0.05). Where ground truthing assumptions were met, the relationships are marked with a ‘+’,
while different relationships are marked with ‘-’. Partial η2 is the proportion of variance
explained by that variable in the final model after excluding variance explained by the other
variables. These models are all a poor fit to the data with little to distinguish between them.
Body Condition Index Model
Model Covariates used
in Model Selection
Model
Adjusted R2
COD Age Class
Ventral Blubber Thickness
Variable Retained
Assumptions Met
Partial η2
*
+
0.10
0.001
Ventral Blubber / Girth
Variable Retained
Assumptions Met
Partial η2
*
+
0.13
0.03
Ventral Blubber / Length
Variable Retained
Assumptions Met
Partial η2
*
+
0.16
0.07
Girth / Length
Variable Retained
Assumptions Met
Partial η2
**
-
0.24
0.16
Fig. 2.4. Girth/Length as a condition index against total body length for the ziphiids.
There is no relationship between girth/length and total body length, indicating that this is
an appropriate index for this species as it is largely independent of body size with calves
shown in white, juveniles in black and adults in grey.

Chapter 2 : Morphometric Indices
28
4.3 Minke whales
There was an uneven spread of individuals across the age classes as 50% of the minke whale
dataset were calves, and 30% were juveniles. The dominant causes of death for these animals
were attributed to acute traumas, and the cause of death for just one animal was inconclusive
and thus classed as a live stranding case. Even with the dominance of smaller animals and acute
causes of death in this dataset, there was significant variation across COD groups and age
classes for all body condition indices with the exception of dorsal blubber thickness. The
poorest fitting model was the dorsal blubber thickness model which retained only COD as an
important explanatory variable, but it was not individually significant (Table 2.5). The two
best fitting models were of almost equivalent fit to the data (Table 2.5). The first was the dorsal
blubber thickness/girth, but only age class was retained as an important explanatory variable
and did not show the expected variation in condition between adults, juveniles and calves
(Table 2.5). The second was girth/length which retained both COD and age class, and showed
the expected relationships with each covariate (Table 2.5). Importantly, the effect size of the
COD explained more of the variation in the data, with a partial η2 value of 0.71.
A linear model was fitted to the girth and length data instead of a non-linear model used for the
mass and length data in harbour porpoises. This was chosen because the dominance of young
animals in the dataset means that they likely represent the more exponential phase of a standard
growth curve, and there are therefore few data here to model how length and girth may reach
an asymptote in larger individuals of this species (Fig. 2.5a). The girth/length condition index
appears to be largely independent of body size (Fig. 2.5b), and this together with its good fit to
the data and the expected relationships with COD and age class make it the most appropriate
condition index assessed here. Specifically, chronic cases had a significantly lower girth/length
ratio than acute cases (p < 0.005), and both juveniles and calves were in poorer condition than
adults (Fig. 2.6).

Chapter 2 : Morphometric Indices
29
Table 2.5 - Summary of the covariates used in the linear regression models for each body
index, index, and the results of the model selection for male minke whales. * Variable retained
after model selection. ** Variable retained after model selection and statistically significant (p
< 0.05). Where ground truthing assumptions were met, the relationships are marked with a ‘+’,
while different relationships are marked with ‘-’. Partial η2 is the proportion of variance
explained by that variable in the final model after excluding variance explained by the other
variables.
Body Condition Index Model
Model Covariates used
in Model Selection
Model
Adjusted R2
COD Age Class
Dorsal Blubber Thickness
Variable Retained
Assumptions Met
Partial η2
*
+
0.22
0.15
Dorsal Blubber / Girth
Variable Retained
Assumptions Met
Partial η2
**
-
0.70
0.65
Dorsal Blubber / Length
Variable Retained
Assumptions Met
Partial η2
**
+
0.45
**
-
0.46
0.56
Girth / Length
Variable Retained
Assumptions Met
Partial η2
**
+
0.71
**
+
0.37
0.64
Fig. 2.5. Relationship between girth and length for male minke whales. a) Linear scaling
relationship between girth and length for male minke whales where girth = 0.51 x length -
26.4. b) No relationship between girth/length and total body length, indicating that this is an
appropriate index for this species as it is largely independent of body size with calves shown
in white, juveniles in black and adults in grey.

Chapter 2 : Morphometric Indices
30
Fig. 2.6. Output from the final girth/length linear regression model for minke whales:
lm(girth/length~as.factor(COD)+as.factor(Age Class)) (n=14). a) The chronic cases had a
significantly lower girth/length index than the acute cases (p value < 0.005). b) Adults had
the highest girth/length index of all three age classes, and were in significantly better
condition than calves (p = 0.046).

Chapter 2 : Morphometric Indices
31
5. DISCUSSION
Girth Based and Mass Based Indices
Different models for each condition index retained varying combinations of important
explanatory variables for each species group. In addition, depending on which index is used,
different patterns become significant in the data within a species group. For example, for the
harbour porpoises, while some indices suggest that adults are in better condition than both
juveniles and calves, others show that adults are in the poorest condition of the three age
classes. These results highlight that caution must be taken when interpreting body condition
estimates, and identifying the most appropriate one for any species group is important. The
identification of the most appropriate condition index in harbour porpoises as mass/length2 was
straightforward given the variation in the data and the large sample size. As a result of the
smaller sample size, species-specific differences, and the lack of mass data, the ziphiid models
were poor fits to the data, and the identification of the most appropriate index was therefore
less clear. While the sample size for the minke whales was also small, the best model for
girth/length was a good fit to the data and was identified as an appropriate index for this species
in the absence of mass data.
Cetaceans store most of their energy in muscle and adipose tissue (blubber and visceral fat),
but a considerable amount may also be stored in internal organs, bones and other tissues
(Christiansen et al., 2013; Lockyer, 1986; Lockyer, 1987; Víkingsson, 1995). As such,
condition indices based on the mass of non-pregnant individuals are able to capture the extent
of these full body energy reserves, and are the most informative as they can provide information
on body composition. Of course, for pregnant females, the proportion that foetuses contribute
towards the total body mass will increase throughout gestation, so condition indices using mass
will therefore be affected. Disparities between the estimated masses and measured masses of
the few ziphiid and minke whale individuals used for comparison here demonstrate that the
existing relationships of length-mass, and girth-length-mass based on whaling data, are both
highly species specific, and likely biased towards larger animals.
For larger animals where mass measurements cannot be taken for logistical reasons, girth
measurements may become more important for estimating condition. Girth measurements
alone have previously been used as indices of condition in cetaceans as a proxy for energy
stores (Best and Rüther, 1992; Lockyer, 1987; Miller et al., 2012a; Víkingsson, 1995), but this
metric was not modelled here as girth measurements provide information on both body
condition and on changing body size through growth. Here, girth alone was not used so as not
to mistake variations in natural growth of the animals for changes in body fat stores. As these
changes are not mutually exclusive and it is difficult to tease them apart, the condition indices
investigated here were standardised against length.
Girth is measured by the SMASS in front of the dorsal fin because this measurement can be
standardised across individuals of different species by using the dorsal fin as a point of
reference. Attempts to measure the maximal girth can be more subjective and logistically
challenging to assess on large cetaceans because of their size. Although this measurement is

Chapter 2 : Morphometric Indices
32
often still the maximum girth for many species, it may not be in all species, particularly large
baleen whales where the dorsal fin is positioned further back on the body towards the tail fluke.
For this reason, the girth measurements used here may not be a true reflection of an individual’s
condition as this girth measurement may not accurately capture variation in the energy stores
of the individuals depending on where, for a particular species, there is most change in size as
a result of variation in fat deposition. A single mass measurement is not subject to the same
biases as a result of measurement location, so when standardised against length, will provide a
more meaningful estimate of overall body condition.
Blubber Thickness is a Poor Indicator of Condition
Across all three species groups, blubber thickness was a consistently poor indicator of
condition, often with the worst fitting models and not retaining the covariates as significant
explanatory variables. The two indices of blubber thickness in relation to girth and length were
mostly better fits to the data but were still consistently poor indicators. Blubber thickness was
also found to be a poor index of condition in a number of other studies (Aguilar et al., 2007;
Caon et al., 2007; Evans et al., 2003; Gómez-Campos et al., 2011; Koopman, 2007; Read,
1990; Ruchonnet et al., 2006). This is likely because condition in these animals is not solely a
function of blubber reserves, but also of muscle mass as starving animals begin to catabolise
muscle as well (Stegall et al., 1999). The reasons for this are likely twofold. Firstly, the blubber
must maintain a certain thickness to fulfil its other roles in thermoregulation, streamlining and
buoyancy (Iverson, 2009), so the extent to which it can be reduced in thickness during
nutritional stress is limited. Secondly, starving animals may begin to catabolise muscle to
access vital proteins (Stegall et al., 1999), and for this reason, starved indivduals have likely
depleted significant amounts of lean tissue. By using a body condition index that includes mass,
other structural body components, like skeletal muscle, are taken into account as these will also
be affected by food limitation and are therefore more representative of overall condition.
Species Specific Condition Indices
Harbour porpoises: The predominant cause of death varied by age class as a higher proportion
of juveniles and adults died as a result of physical trauma (49.1% and 47.8% respectively)
compared to calves (25.0%). This is possibly because juveniles are more likely to be attacked
by bottlenose dolphins due to their small size (Patterson et al., 1998), and both juveniles and
adults that are actively foraging for themselves are more likely to be caught up in fishing nets
in the pursuit of prey than maternally dependent calves. The chronic and acute cases are
therefore not equally distributed across each age class. Mass/length2 was determined to be the
most appropriate morphometric index for valid inferences about the condition of harbour
porpoises. It showed good fit to the data, was consistent with the hypothesised relationships
between both COD and age class, and was more independent of body size than mass/length
alone. Correlations with body size are a problem because one main objective of condition
indices is often to be able to compare the condition of animals of different sizes. The scaling
of mass with length therefore needs to be considered when using indices that attempt to
summarise the variation in mass relative to length, and attribute this variation to changes in
condition.

Chapter 2 : Morphometric Indices
33
There was little difference between the effect size of COD between the different condition
indices, showing that it explained similar proportions of the variance in each model. Acute
cases were in better body condition because these animals tended to have suffered a sudden
critical event which led to their death, in comparison to the chronic cases where a general
debilitation and decline in health occurred in individuals that had used up more of their energy
reserves. There was more variation explained by age class than COD in the mass/length2 model.
As expected, based on the ground truthing assumptions, adults were in significantly better
condition than both juveniles and calves. Juveniles were hypothesised to be in the poorest
condition overall because this age group is likely under nutritional stresses after weaning when
finding food may be problematic and more energetically demanding (Lockyer et al., 1985). In
addition, they would have the smallest fat stores because the energy that they acquire is likely
not deposited, but is used for growth as they face the thermoregulatory problems associated
with a large surface area to volume ratio (Caon et al., 2007), especially in cold waters. The fact
that they were of intermediate condition here may be a result of how the individuals were
assigned an age class following the work by Ólafsdóttir and colleagues (2002). Some of the
smallest individuals may have only just been weaned, while others were almost at sexual
maturity, resulting in a large range in the sizes of individuals in this age group.
Calves were shown to be in the poorest condition, but this would not necessarily imply that the
calves are in poorer health. Rather, it more likely demonstrates that caution is required when
comparing the condition of calves to the condition of adults using the same mass/length2 index
as even though it is more independent of body size than mass/length in this species, it does not
take into account rapid growth processes or the different proportion of mass associated with
energy reserves or insulation for these two age classes of significantly different body sizes.
This is likely also the case, although to a lesser extent, with smaller juveniles because energy
allocation in porpoises has been shown to shift from an emphasis on developing an insulative
blubber layer in young animals to preparing the body for annual reproduction at sexual maturity
(McLellan et al., 2002). While the Scaled Mass Index appeared to capture the changes in
condition between different age classes in small mammals (Peig and Green, 2009), it was not
a good fit to these harbour porpoise data. The mass/length2 index may be better suited to small
odontocetes than small mammals previously investigated as they are large with a relatively
simple body shape, and their energy reserves in the blubber and muscle constitute a much larger
proportion of their entire body mass, between 50-60% (McLellan et al., 2002), compared to
energy reserves in terrestrial species.
There were no differences in condition between males during the breeding season and over the
rest of the year using the mass/length2 index. In theory, males could be in poorer condition
during the breeding season as a result of the increased energetic demands associated with
reproduction. For example, mature individuals are thought to seasonally allocate up to 4% of
their total body mass to testicular growth (Neimanis et al., 2000). However, a decrease in
condition over the breeding season for sexually mature males has not been reported as it has
for females. It is expected that the mass/length2 index is the most informative body condition
index for females as well as males, and differences in the reproductive state of females between
resting, pregnant and lactating would be detected (Read, 1990). It is hypothesised that

Chapter 2 : Morphometric Indices
34
mass/length2 is likely also a good condition index for other small and medium sized
odontocetes.
Ziphiids: The SMASS have few records of ziphiid strandings because these species typically
live offshore in waters more than 200m deep feeding on deep-water fish and squid (MacLeod,
2018). In addition, most species, especially those found around the UK, are mostly solitary or
live in small groups (MacLeod and D'Amico, 2006). Their distribution, habitat preferences and
social behaviour together with their fewer numbers therefore make stranding events uncommon
in the UK, so there is little morphometric data available for analysis. The bias towards juveniles
in the dataset could be because younger animals become disorientated more easily and find
themselves in shallower waters along coastlines which makes their carcasses more likely to be
found.
All models were a very poor fit to the data, likely because of the limited sample sizes in each
age class and COD category because the data were dominated by measurements from juveniles
and live strandings cases. It is therefore hard to make inferences about the different CODs or
age classes. In addition, the mix of three species grouped together, rather than using a single
species likely also contributed to the poor fit of the models. These species were grouped
together to increase the sample size for analysis. While they are all of similar body shape and
ecology, they differ in body size. Were the sample size large enough to split the analysis by
species, the model fit to the data may have been improved. It may also have been improved
with more available data on size at sexual maturity in order to classify individuals as adults and
juveniles more accurately for each species. Finally, a measured mass and more detailed
information on cause of death to enable the animals to be classified as acute and chronic cases
would likely have improved the model. In the absence of mass data, girth / length is thought to
be the most appropriate index of condition for these animals although there appears to be little
variation between individuals measured here. Unfortunately, there is little published
information with which to compare these results and interpret the lack of variation between
individuals. It is possible that this lack of individual variability in energy stores is characteristic
of these species if they do not rely on endogenous energy reserves to the same extent as other
cetacean species.
Minke whales: As with the Ziphiid data, the individuals measured were biased towards
juveniles and especially calves, and acute causes were the most dominant causes of death across
all three age classes. Even with these biases in this small dataset, there were significant
differences in condition between different CODs and age classes in three of the four indices
modelled. The best fitting model that showed the expected relationships with COD and age
class was the girth/length model where, based on the effect size, COD explained most of the
variation in the data. Balaenopterids are fast-adapted species that are able to annually cycle
their fat stores as they move between high latitude feeding grounds and low latitude breeding
grounds (Lockyer, 2007). The range in condition of these animals is therefore likely to be
greater than the smaller odontocetes that do not experience annual extremes in feeding and
fasting periods. This would explain why COD accounted for more variation in the data than
age class in these animals compared to the other species groups. As expected, juveniles and
calves were in poorer condition than the adults. On their feeding grounds, juvenile minke

Chapter 2 : Morphometric Indices
35
whales have been shown to invest most of their excess energy into growth in order to reach
size at sexual maturity faster and start reproducing earlier (Christiansen et al., 2013), rather
than laying down fat stores. In the absence of better models to estimate mass from the girth and
length measurements, using girth/length as an indicator of condition, appears to be an
appropriate metric to measure the energy stores of this species.
Conclusions and Future Directions
The morphometric condition indices identified here as the most appropriate to assess the
nutritive body condition of these species can be used in comparative studies to assess other
potential markers and indices of condition where a ‘ground truthing’ approach is required to
evaluate novel methods. Obtaining morphometric measurements from wild cetaceans is
notoriously very difficult, but recent advances in technology and analytical techniques have
improved our ability to estimate the size of free-ranging individuals. Photogrammetry involves
obtaining accurate measurements from 2D images, and aerial photogrammetry methods have
been used in a number of cetacean species since the 1980s to obtain multiple measurements
across the body in order to better estimate the size of individuals, investigate growth and assess
body condition (Best and Rüther, 1992; Cubbage and Calambokidis, 1987; Durban et al., 2015;
Fearnbach et al., 2018; Konishi, 2006; Miller et al., 2012a; Perryman and Lynn, 2002). Aerial
photogrammetry using unmanned aerial vehicles (UAVs) specifically, looks like a particularly
promising area of research to be able to obtain multiple morphometric measurements from live
animals to assess changes in body condition (Christiansen et al., 2016; Christiansen et al., 2018;
Durban et al., 2016).

Chapter 3 : Blubber Lipid Content
36
CHAPTER 3: VARIATION IN BLUBBER LIPID
CONTENT SUGGESTS TRADE-OFFS BETWEEN
ENERGY STORAGE AND OTHER BLUBBER
FUNCTIONS ACROSS CETACEAN FAMILIES
The ziphiid and balaenopterid data analysis and discussion part of this chapter are currently in
press in a manuscript in Aquatic Conservation: Marine and Freshwater Ecosystems.
Kershaw, JL. Brownlow, A. Ramp, CA. Miller, PJO. Hall, AJ. (2019) Assessing cetacean
body condition: Is total lipid content in blubber biopsies a useful monitoring tool?
Aquatic Conservation: Marine and Freshwater Ecosystems.

Chapter 3 : Blubber Lipid Content
37
1. ABSTRACT
Energy reserves in cetaceans are maintained primarily as blubber lipid stores. However, there
is little information on what the variation in these stores can tell us about the condition of
individuals. The variation in blubber lipid content across three families of cetaceans -
delphinids (n = 10; Lagenorhynchus albirostris), ziphiids (n = 8; Mesoplodon bidens, Ziphius
cavirostris, Hyperodon ampullatus) and balaenopterids (n = 9; Megaptera novaeangliae,
Balaenoptera acutorostrata) was investigated. Full depth, dorsal blubber samples were
collected from dead stranded adult and juvenile individuals that died as a result of acute trauma
or chronic debilitation. Total lipid was extracted to investigate firstly, variation in blubber lipid
content through the blubber depth and, secondly, how blubber lipid content varies with
morphometric body condition estimates and other individual covariates. The balaenopterids
showed the most variation in blubber lipid content both within and between individuals (2.40
± 0.3% to 77.55 ± 0.2%), which is consistent with these species’ ability to annually cycle their
fat stores. Conversely, the ziphiids showed the least variation in blubber lipid content which
was consistently high both within and between individuals (51.30 ± 0.4% to 84.06 ± 1.1%).
Both the balaenopterids and the delphinids showed significant differences in lipid content
between the outer, middle and inner blubber layers, and as a result of this variation, it was
concluded that the lipid content measured in shallow depth biopsy samples gives little
information on an individual’s condition because it provides no information on the layers that
are involved in lipid deposition and mobilisation. There were no differences in lipid content
with blubber depth in the ziphiids.
Balaenopterids that died as a result of acute trauma had significantly higher blubber lipid
content than those that died as a result of chonic debilitation, but this was not the case for either
the ziphiids or the delphinids. Full depth blubber lipid content was not correlated with
morphometric body condition estimates across any group. This suggests that while measuring
full depth blubber lipid content at the dorsal site sampled can provide information on gross
differences as a result of different causes of death between balaenopterid individuals, it gives
little information on subtler differences in overall body condition in these three cetacean
families. The lack of variation both within and between the ziphiid individuals is especially
interesting. Ziphiid blubber may play a fundamentally different role compared to other cetacean
species. It is known to consist primarily of wax esters that are less easily metabolised, but are
less dense than triacylglycerols. Deep divers may benefit from stores of these low density wax
esters to remain closer to neutral buoyancy at depth. These species likely have to prioritise
maintaining consistent blubber hydrodynamic, thermal and buoyancy parameters which comes
at the expense of having variable fat deposits for energy storage. For this reason, caution should
be taken when estimating the condition of these animals using any of the standard blubber
indices used for other species.

Chapter 3 : Blubber Lipid Content
38
2. INTRODUCTION
The high energy yield of fats, specifically triacylglycerols (esters made up of a glycerol and
three fatty acids), relative to carbohydrates or proteins make them the favoured energy storage
form in mammals (Coleman and Lee, 2004; Young, 1976), and an appropriate capacity for
triacylglycerol storage in adipocytes is important for normal metabolic regulation (Wang et al.,
2015). Adipose tissue lipid content has therefore been linked with total fatness in a range of
mammalian species (Beck et al., 1993; Shier and Schemmel, 1975; Stirling et al., 2008) such
that, when coupled with demographic and ecological data, using lipid content as a body
condition index can be a biologically relevant, relatively inexpensive and rapidly assessed
marker (McKinney et al., 2014).
Cetaceans have evolved atypical and widespread deposits of lipids as a thick, subcutaneous
blubber layer which is biochemically distinct from the fat deposits of terrestrial mammals
(Pond, 1978). It is involved in insulation, buoyancy and the maintenance of hydrodynamic
shape, and is their most important site of energy storage (Iverson, 2009). Lipids in the blubber
are mobilized in times of energetic need and nutritional stress, and then deposited when food
is in excess. The biochemical characteristics of blubber lipids have been extensively studied
(Ackman et al., 1965; Litchfield et al., 1975; Lockyer et al., 1985; Varanasi and Malins, 1971),
and two main lipid classes, triacylglycerols and wax esters, have been identified and shown to
vary in relative abundance among cetacean family groups. More recently, the extensive
occurrence of positive selection in triacylglycerol metabolism-related genes, involved mainly
in triacylglycerol synthesis and lipolysis, has been documented in cetaceans (Endo et al., 2018;
Wang et al., 2015). The positive selection of these genes suggests that cetaceans have evolved
an enhanced capacity for inhibiting unrestricted lipolysis and are able to finely control the lipid
content of their blubber (Wang et al., 2015).
Similarly to other mammal species, the direct quantification of blubber lipid content has been
used as a metric of overall energy stores and body condition in mysticetes (Ackman et al.,
1975b; Aguilar and Borrell, 1990; Konishi, 2006; Lockyer, 1986) and, to a lesser extent, in
odontocetes (Evans et al., 2003; Gómez-Campos et al., 2011; Montie et al., 2008; Read, 1990).
Variation in overall body condition and lipid content tend to be more extreme in mysticetes
because their seasonality in feeding and reproduction is stronger than in odontocetes (Boness
et al., 2002). For example, pregnant female mysticetes typically display the best body condition
with the highest blubber lipid content as they accumulate fat reserves for reproductive
investment and to ensure adequate energy transfer to the calf during lactation (Aguilar and
Borrell, 1990; Lockyer, 1986). However, blubber lipid content also varies between
reproductive states in a few delphinid species including striped dolphins (Stenella
coeruleoalba) (Gómez-Campos et al., 2011) and bottlenose dolphins (Tursiops truncatus)
(Montie et al., 2008). Another, less well studied group of cetaceans are the deep diving beaked
whales and, to date, while the blubber layer of beaked whales has been shown to be highly lipid
rich (Koopman, 2007; Singleton et al., 2017) there have been no studies investigating the
relationships between blubber lipid content, condition and reproductive status in this less well
understood family of cetaceans.

Chapter 3 : Blubber Lipid Content
39
Lipid content analysis is inexpensive and straightforward, and thus applicable on a broad scale.
However, the robustness of the method and validation of lipid content relative to multiple
accepted condition indices and other indicators of health has not been fully evaluated across
different cetacean families, and especially not for beaked whales. For example, how the lipid
content varies through blubber depth and across the body of different cetacean species is not
well understood (Koopman, 2007). It is important to appreciate the degree of variability in
blubber lipid content within an individual in order to correctly interpret the results from blubber
samples collected by biopsy dart from live animals, which has become a standard method of
collecting tissue samples from live cetaceans (Hunt et al., 2013).
Here, full depth, dorsal blubber samples were collected from dead-stranded individuals across
three cetacean families; delphinids, ziphiids and balaenopterids by the Scottish Marine Animal
Strandings Scheme. The aim was to assess if blubber lipid content obtained though remote
biopsy sampling provides a robust measure of overall body condition across these three
families of cetaceans with different life-history strategies that will shape the function, structure
and chemical composition of the blubber. Firstly, changes in lipid content through the full
blubber depth were investigated to estimate the representativeness of shallow depth biopsies
collected from live animals. Secondly, the relationships between blubber lipid content and
other individual covariates were assessed. If blubber lipid content is reflective of body
condition, it should exhibit certain biological differences. Specifically, here, it should be
correlated with morphometric condition indices and the cause of death of these stranded
individuals. By comparing the variation in the two better studied families, the delphinids and
the balaenopterids, the lipid content variation of the ziphiids can be put into context so as to
better interpret estimates of condition in these species.

Chapter 3 : Blubber Lipid Content
40
3. METHODS
3.1 Blubber Biopsies in Context
Over the last 30 years, dart biopsy sampling has become one of the most common collection
methods for obtaining biological tissue samples from free-ranging cetaceans, with samples
typically taken from the dorsal area of the animals (Hunt et al., 2013). However, as cetacean
blubber has been shown to be highly stratified both histologically and chemically (Koopman
et al., 1996; Krahn et al., 2004; Samuel and Worthy, 2004; Smith and Worthy, 2006), it is
important to understand the extent to which remotely obtained biopsy samples are
representative of the variation of various tissue components through the full blubber depth.
Dart biopsy samples are typically collected using a crossbow or a pneumatic rifle with modified
arrows and dart tips which are usually hollow, thin-walled, surgical grade stainless-steel
cylinders, between 4 - 6 mm in diameter and 20 - 60 mm in length. They each have a cutting
lead edge and small internal barbs to ensure that the sample is retained within the tip upon
collection. The core sample collected from the dart will vary in length, depending on the force
of the impact, the angle of impact and the impact site. This core sample consists of both the
skin and the underlying blubber tissue which are typically separated and used for different
analyses.
The full dorsal blubber thickness and thus the extent to which shallow biopsy samples are able
to sample the various components of the blubber layer will vary by species. The data on dorsal
blubber thicknesses of all ziphiid species (n = 44) (Blainville’s beaked whale (Mesoplodon
densirostris), Cuvier’s beaked whale (Ziphius cavirostris), Northern bottlenose whale
(Hyperoodon ampullatus) and Sowerby’s beaked whale (Mesoplodon bidens)) as well as all
balaenopterid species (n = 66) (fin whale (Balaenoptera physalus), humpback whale
(Megaptera novaeangliae), minke whale (Balaenoptera acutorostrata) and sei whale
(Balaenoptera borealis) sampled by the Scottish Marine Animal Strandings Scheme (SMASS)
between 1990 and 2017 were collated to investigate the variation in dorsal blubber thickness
of these species from which biopsy samples are routinely taken. These dorsal blubber thickness
measurements were taken from adults, juveniles and calves of both sexes and with varying
causes of death such that the maximum possible range in blubber thickness could be assessed
(Fig. 3.1).
This variation across species was plotted against the measured blubber thicknesses of remote
biopsy samples obtained from Northern bottlenose whales and humpback whales (Fig. 3.1).
The Northern bottlenose whale samples were collected in Jan Mayen, Norway (79° 0' N, 17°
39' W), in June 2014 and June 2015 (n = 47). Samples were collected using the ARTS system;
a pressurised rifle-type tool, using LKDarts (LKARTS-Norway) with a stainless steel tip
measuring 6mm in diameter and 60mm in length. The blubber thicknesses of the samples
obtained varied considerably from just 5mm to 52mm. The humpback whale samples were
collected in the Gulf of St Lawrence, Quebec, Canada (49° 36’ N, 64° 20’W) between June
and September 2013 and 2015 using a crossbow and a modified arrow with a stainless steel tip
measuring 40 mm in length and 8 mm in diameter (n = 33). These samples showed more

Chapter 3 : Blubber Lipid Content
41
consistency in sample size with the blubber thickness ranging between 10mm and 32mm in
length (Fig. 3.1).
It can be seen for both species with recorded blubber thicknesses ranging from between 42mm
to 74mm and from 44mm to 68mm in Northern bottlenose whales and humpback whales
respectively, that the remote biopsy samples are much smaller and thus likely only sample the
outer layers of most of the sampled individuals (Fig. 3.1). For this reason, it is of vital
importance to investigate the variation in different biomarkers of interest, in this case, lipids,
through the blubber layer and put this variation into the context of remotely obtained biopsy
samples that only sample the outermost part of the tissue.
3.2 Sample Collection from Stranded Cetaceans
Dorsal blubber samples collected from a total of 27 individuals, from three cetacean families,
were sampled and are summarised in Table 3.1. These were delphinids (n = 10) – white-beaked
dolphins (Lagenorhynchus albirostris); ziphiids (n = 8) - Cuvier’s beaked whales, Sowerby’s
beaked whales and Northern bottlenose whales; and balaenopterids (n = 9) - minke whales and
humpback whales. These were freshly dead individuals that showed minimal signs of
decomposition, 25 of which were sampled by the SMASS between 2013 and 2015, and the
other two were sampled by the Mingan Island Cetacean Study (MICS) during their 2013 and
2010 field seasons in the Gulf of St Lawrence, Quebec, Canada. For the SMASS sampled
animals, as described in Chapter 1, cause of death and morphometric measurements were
available. The final two individuals sampled by the MICS were an adult female minke whale
and an adult female humpback whale, but no cause of death was confirmed for these animals
and morphometric measurements were not taken.
Fig. 3.1. Boxplots of dorsal blubber thicknesses of full depth blubber and biopsy samples
recorded for different ziphiid and balaenopterid species. Blubber thicknesses for dead
animals were recorded by the SMASS. Blubber thicknesses of remote biopsies taken from live
Northern bottlenose whales in Jan Mayen, Norway, and humpback whales in Quebec, Canada,
are shaded in yellow and plotted for comparison.
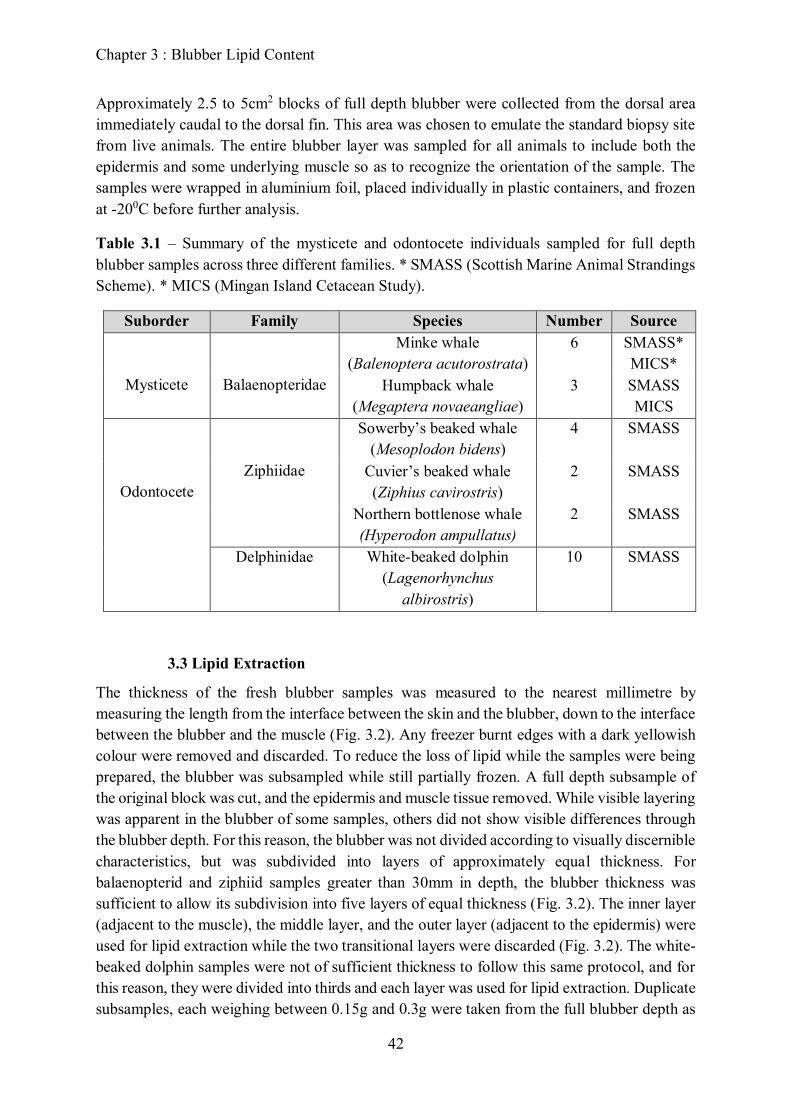
Chapter 3 : Blubber Lipid Content
42
Approximately 2.5 to 5cm2 blocks of full depth blubber were collected from the dorsal area
immediately caudal to the dorsal fin. This area was chosen to emulate the standard biopsy site
from live animals. The entire blubber layer was sampled for all animals to include both the
epidermis and some underlying muscle so as to recognize the orientation of the sample. The
samples were wrapped in aluminium foil, placed individually in plastic containers, and frozen
at -200C before further analysis.
Table 3.1 – Summary of the mysticete and odontocete individuals sampled for full depth
blubber samples across three different families. * SMASS (Scottish Marine Animal Strandings
Scheme). * MICS (Mingan Island Cetacean Study).
Suborder Family Species Number Source
Mysticete
Balaenopteridae
Minke whale
(Balenoptera acutorostrata)
6 SMASS*
MICS*
Humpback whale
(Megaptera novaeangliae)
3 SMASS
MICS
Odontocete
Ziphiidae
Sowerby’s beaked whale
(Mesoplodon bidens)
4 SMASS
Cuvier’s beaked whale
(Ziphius cavirostris)
2 SMASS
Northern bottlenose whale
(Hyperodon ampullatus)
2 SMASS
Delphinidae White-beaked dolphin
(Lagenorhynchus
albirostris)
10 SMASS
3.3 Lipid Extraction
The thickness of the fresh blubber samples was measured to the nearest millimetre by
measuring the length from the interface between the skin and the blubber, down to the interface
between the blubber and the muscle (Fig. 3.2). Any freezer burnt edges with a dark yellowish
colour were removed and discarded. To reduce the loss of lipid while the samples were being
prepared, the blubber was subsampled while still partially frozen. A full depth subsample of
the original block was cut, and the epidermis and muscle tissue removed. While visible layering
was apparent in the blubber of some samples, others did not show visible differences through
the blubber depth. For this reason, the blubber was not divided according to visually discernible
characteristics, but was subdivided into layers of approximately equal thickness. For
balaenopterid and ziphiid samples greater than 30mm in depth, the blubber thickness was
sufficient to allow its subdivision into five layers of equal thickness (Fig. 3.2). The inner layer
(adjacent to the muscle), the middle layer, and the outer layer (adjacent to the epidermis) were
used for lipid extraction while the two transitional layers were discarded (Fig. 3.2). The white-
beaked dolphin samples were not of sufficient thickness to follow this same protocol, and for
this reason, they were divided into thirds and each layer was used for lipid extraction. Duplicate
subsamples, each weighing between 0.15g and 0.3g were taken from the full blubber depth as

Chapter 3 : Blubber Lipid Content
43
well as the inner, middle and outer layers, and lipid was independently extracted from each of
the blubber samples using a modified version of a previously published protocol (Folch et al.,
1957).
Specifically, the blubber was homogenized with a 2:1 dichloromethane-methanol mixture
containing 0.05% BHT (butylhydroxytoluene) with a 1:21 ratio of blubber (g) to solvent (ml).
The blubber was ground manually in the solvent with a glass homogenizer until thin and
transparent and no longer releasing lipid, and left overnight. The homogenate was then mixed
thoroughly with 0.25 its volume of 0.9% potassium chloride (KCl) solution for 10 minutes.
The mixture was centrifuged at 900 rcf for 20 minutes to allow it to separate into two phases.
The upper phase containing all of the non-lipid substances was discarded. The lower phase,
consisting of a solution of tissue lipids, was rinsed twice with anhydrous sodium sulphate to
remove any residual non-lipid components at a ratio of 4:1 sodium sulphate to blubber. After
rinsing, the lipid-only extract was then transferred to a pre-weighed centrifuge tube. Finally,
the solvent was evaporated under dry nitrogen at 300C until the solvent had evaporated enough
for the lipid residue to become more solid. The centrifuge tube containing the lipid extract was
then left open at room temperature for 24 - 48 hours to allow any remaining solvent to evaporate
slowly. After complete evaporation of the solvent, the centrifuge tube containing the pure lipid
extract was weighed, and the lipid content of the blubber was expressed as a percentage of the
wet weight of the sample. This method of lipid extraction is advantageous as it is simple, it can
be applied at any scale, there is minimal lipid loss incidental to the washing procedure, and it
yields a washed extract which can be taken to dryness without degradation of the lipids (Folch
et al., 1957).
Fig. 3.2. Separation of the full depth blubber samples > 30mm thick into five layers of
approximately equal thickness prior to lipid extraction. The vertical dashed line shows
where the blubber was divided in half to generate duplicate subsamples. The horizontal dashed
lines show where the blubber was divided such that the outer, middle and inner layers were
retained for analysis while the two transitional layers were discarded.

Chapter 3 : Blubber Lipid Content
44
3.4 Quality Assurance and Quality Control for Lipid Extraction
All statistical analyses were performed using the statistical package, R, version 3.1.3 (R Core
Development Team, 2015). Statistical significance was taken at p ≤ 0.05.
Quality assurance and quality control tests were performed to assess the limitations and
potential sources of error in this lipid extraction method for cetacean blubber samples to better
interpret the final results. The limiting factor for the analysis of most remotely obtained biopsy
samples is the mass of tissue collected, and for this reason, measurement and extraction errors
with sample mass were assessed.
Sample Mass Variability: The effect of sample mass on percentage lipid recovered was
assessed, and it was seen that lipid content was not correlated with sample mass using this
extraction method (Fig. 3.3a). This indicates no changes in blubber lipid extraction efficiency
with samples of varying sizes, and as such, sample masses of between 0.15g and 0.3g are
appropriate for extraction to provide robust results.
Extraction Variability: There was no change in the extraction variability, quantified as the
measurement standard error between duplicate samples, with increasing lipid content (Fig.
3.3b). There was no difference in the measurement error between the blubber layers (ANOVA;
df = 3, F = 1.786, p = 0.154). However, there was significantly higher variation in measurement
standard error as well as a higher overall measurement standard error in the white-beaked
dolphin samples compared to both the balaenopterids and the ziphiids (ANOVA; df = 2, F =
34.23, p < 0.0001). This could be because the full depth white-beaked dolphin samples were
thinner, with an average blubber depth of 17.4 ± 1.28mm (mean ± standard error), than the
samples taken from the other two species groups which have a much thicker dorsal blubber
layer with means of 53.25 ± 7.56mm and 37.0 ± 5.57mm for the ziphiids and the
balaenopterids, respectively. As such, by subsampling a thicker blubber layer, the likelihood
of subsampling a more homogenous part of the tissue is higher than when sampling from the
thinner layer where the tissue properties may change within the piece that is sampled. As the
species that are typically sampled through remote dart biopsy, including ziphiids and
balaenopterids, are much larger than white-beaked dolphins, the samples obtained will likely
be more homogeneous than from smaller species, so a large standard deviation between
duplicate samples is less likely, and this extraction method is robust for such species.

Chapter 3 : Blubber Lipid Content
45
3.5 Statistical Analysis
The data from the white-beaked dolphins, ziphiids and balaenopterids were modelled
separately. Two different statistical approaches were used firstly to investigate differences in
the distribution of lipids through blubber depth and, secondly, to investigate what other factors
may be affecting blubber lipid content including blubber thickness sex, species, age class, cause
of death and morphometric body condition. For the white-beaked dolphins, mass/length2 was
used as the most appropriate morphometric index of body condition, and girth/length was used
for the ziphiids and the balaenopterids (Chapter 1).
The main challenges for analysing these data were that multiple lipid content measurements
came from the same individuals, and these were not normally distributed. The modelling
approach used here takes advantage of the statistical structure of generalized linear mixed effect
models (GLMMs). GLMMs combine the properties of two statistical frameworks, linear mixed
models, which are able to incorporate both fixed and random effects, and generalised linear
models which are typically used for non-normal data (Bolker et al., 2008). Random effects can
encompass variation among individuals when multiple responses are measured per individual.
GLMMs are thus the best tool for analysing non-normal data that involve random effects
(Bolker et al., 2008). For this reason, GLMMs were used here to investigate lipid content
through the blubber depth whilst accounting for the repeated measurements from the same
individuals. A GLMM (glmer function in the package ‘lme4’) with a gamma distribution, a log
link function and each individual treated as a random effect was used to investigate the effect
of blubber layer (full, outer, middle, inner) on the lipid content of the samples from each species
group.
Fig. 3.3. Variation in lipid content and extraction variability with sample mass (n = 108).
a) No correlation between lipid content and sample mass suggests no changes in lipid
extraction efficiency of tissue samples of between 0.15-0.30g used here. b) No correlation
between the measurement standard error and the lipid content suggesting that measurement
error does not increase or decrease with increasing lipid content of the samples.

Chapter 3 : Blubber Lipid Content
46
Generalised Linear Models (GLMs) were then used to investigate the effects of cause of death
(COD), blubber thickness, morphometric body condition (either mass/length2 or girth/length),
sex, species (for the balaenopterid and the ziphiid data that were made up of multiple species)
and age class on the blubber lipid content of the full depth samples from each individual. GLMs
with a gamma distribution and a log link function were used to model the non-normal
distribution of the lipid content data. All sampled individuals were used for the white-beaked
dolphins (n = 10) and for the ziphiids (n = 8). However, for the balaenopterids, the two
individuals sampled by the MICS, an adult humpback whale and an adult minke whale, for
which COD and morphometric data were not available, were not included in this second part
of the analysis (n = 7).
For each species group, a full GLM was generated to include the effects of all explanatory
variables. To ensure that the explanatory variables were not correlated, and thus to avoid
multicollinearity in the final model, variables were selected for inclusion based on variance
inflation factors (VIFs). VIFs are used to determine when two or more predictors in a regression
are highly correlated, and measure how much the variance of an estimated regression
coefficient increases if the predictors are correlated. Starting with the full model, the VIF for
each covariate in the model was calculated (car package). The covariate with the highest VIF
value was removed from the model in a stepwise fashion until the VIF values for all covariates
were below three (Zuur et al., 2010). These covariates were retained for further analyses. The
threshold VIF value of 3 was selected based on previous work that showed this to be a
conservative cut-off VIF value for the removal of collinear variables (Zuur et al., 2010). When
there is collinearity in a model, the standard errors of the parameters are inflated, producing
higher VIF values. This results in larger p-values and makes it more difficult to detect an effect
(Zuur et al., 2010). It is thought that high, or even moderate, collinearity is especially
problematic when ecological signals are weak. When this is the case, VIF cut-off threshold
values need to be low, otherwise the inclusion of parameters with high VIF values may cause
nonsignificant parameter estimates compared to when there is no collinearity (Zuur et al.,
2010).
Then, the ‘dredge’ model selection function (MuMIn package) was used to identify from this
subset of uncorrelated variables, which ones best explained the variation in blubber lipid
content data, and should be included in the final model. The dredge function is a backwards
selection tool that runs models with all possible combinations of the explanatory variables
including both the specified interactions between variables and their respective main effects.
The goodness of fit of each model was assessed using the AICc (Second-order Akaike
Information Criterion which uses a correction for small sample sizes). The models were ranked
by their AICc to determine which combination of variables best explains the relationships in
the data. The model with the lowest AICc value was used for further interpretation because this
contained only the variables and / or interactions of importance. Summary statistics of the
model coefficients were used to assess the effect of each covariate on blubber lipid content.

Chapter 3 : Blubber Lipid Content
47
4. RESULTS
4.1 Variation through Blubber Depth
Each species group showed a different pattern in lipid content through blubber depth. The
balaenopterids showed the most variation in blubber lipid content both within and between
individuals (full dataset range ± standard error from 2.40 ± 0.3% to 77.55 ± 0.2%), followed
by the white-beaked dolphins (full dataset range ± standard error from 29.3 ± 8.5% to 74.2 ±
5.0%). The ziphiids showed the least variation (full dataset range from 51.30 ± 0.4% to 84.06
± 1.1%). For the white-beaked dolphins, the outer layer and the full depth samples both had a
higher lipid content than the inner and middle layers (p values both 0.01) that were not
significantly different from each other (Fig. 3.4). For the ziphiids, there were no differences in
lipid content between layers (Fig. 3.4). There were significant differences between all layers in
the balaenopterids, showing that the outer layer had the highest lipid content and the inner layer
had the lowest (p values < 0.005) (Fig. 3.4).
Fig. 3.4. Barplots of mean blubber lipid
content ( ± standard error) through
blubber depth for each species group.
Balaenopterids were the only group to
show variation in lipid content across all
blubber layers, and showed the greatest
overall variation in lipid content of all
three species groups.

Chapter 3 : Blubber Lipid Content
48
4.2 Variation with Other Covariates
The lipid content in the full blubber depth samples was not correlated with blubber thickness
for any of the three species groups. No covariates were retained following generalised linear
model selection for the white-beaked dolphins or the ziphiids. Sex, age class, cause of death
and morphometric body condition therefore did not contribute to the explanation of the
variabity in the blubber lipid content of these full depth, dorsal samples. The best fitting GLM
for the balaenopterid data included only COD as an important explanatory variable with a
significantly lower lipid content in the chronic cases compared to the acute cases (p = 0.004)
(GLM: df = 3, weight = 0.87, Δ AICc of 4.18 to the next best fitting model) (Table 3.2). In fact,
individuals that died as a result of an acute trauma had significantly higher blubber lipid content
across all blubber layers than those with a chronic cause of death (ANOVA; F = 44.71, df = 1,
p < 0.0001) (Fig. 3.5).
Table 3.2 – Summary table of the generalised linear model results investigating the effects of
various covariates on blubber lipid content for the three species groups. *VIFs: variance
inflation factors measure collinearity between predictor variables. The predictor variables with
high VIFs were excluded from the analysis.
Family
Sample Size
Covariates
Discarded Based
on VIFs*
Covariates Retained
following GLM model
selection
Delphinids 10 Sex, Age Class -
Ziphiids 8 Sex, Age Class -
Balaenopterids 7 Girth / Length COD
The effect of body condition, either as mass/length2 for the white-beaked dolphins, or as
girth/length for the ziphiids and the balaenopterids, was not retained as an important
explanatory variable in the full blubber depth lipid content models. The relationship between
the lipid content of each layer and morphometric body condition was then assessed separately.
For the balaenopterids, there was a significant positive relationship between lipid content and
girth/length in the middle blubber layer alone (linear model; p = 0.035, Adjusted R2 = 0.4),
which was not seen in the other two groups (Fig. 3.6). Variation in this layer therefore likely
drives the differences in full blubber depth lipid content that are associated with different
causes of death.

Chapter 3 : Blubber Lipid Content
49
Fig. 3.5. Boxplots of blubber lipid content across blubber layers between COD categories
for the three cetacean families. The balaenopterids were the only group to show significant
differences in blubber lipid content between acute and chronic cases. Blubber lipid content was
significantly lower across all blubber layers in the chronic compared to the acute cases (ANOVA;
F = 44.71, df = 1, p < 0.0001).

Chapter 3 : Blubber Lipid Content
50
The lack of a relationship between lipid content and morphometric body condition in the white-
beaked dolphins and the ziphiids could have been a result of the small sample size of
individuals. It is possible that only a small number of animals in either good or poor condition
were sampled here. To investigate this possibility, the range in individual morphometric
condition estimates for each species group was assessed using the same data collected by the
SMASS used to examine dorsal blubber thickness described above. These data were from 51
balaenopterids from four species (minke, humpback, fin and sei whales), 42 ziphiids from four
species (Northern bottlenose whales, Sowerby’s, Cuvier’s and Blainville’s beaked whales
Fig. 3.6. Lipid content in the middle blubber layer plotted against the morphometric body
condition estimate for each species group. There was a significant correlation between the
lipid content in the middle layer and morphometric body condition in the balaenopterids alone
(p = 0.035, Adjusted R2 = 0.4).

Chapter 3 : Blubber Lipid Content
51
(Mesoplodon densirostris)) and 90 white-beaked dolphins. The range in condition estimates
varied between each group. There was a four-fold difference between the white-beaked
dolphins in the thinnest and the fattest condition (mass/length2 range between 0.0012 – 0.0049),
and a ten-fold difference in the balaenopterids (girth/length range between 0.064 – 0.67). For
the ziphiids however, there was less than a factor of two difference between the individuals in
the thinnest and the fattest condition (girth/length range between 0.37 – 0.63), indicating a very
narrow range in body condition in these species. The individuals sampled for lipid extraction
covered a large part of these ranges for the white-beaked dolphins and the ziphiids (Fig. 3.7).
Thus the absence of any correlations between blubber lipid content and morphometric
condition is likely not a result of the sample size, or a bias in the sampled individuals. The
balaenopterids sampled were from only a small range of the potential variation (Fig. 3.7), yet
there was still a positive correlation between girth/length and the lipid content in the middle
layer, as well as differences between the animals with acute or chronic causes of death.
Fig. 3.7. Body condition histograms for the three species groups using morphometric data
collected by the SMASS. The shaded bars indicate the range in condition indices of the
individuals sampled for blubber lipid extraction.

Chapter 3 : Blubber Lipid Content
52
5. DISCUSSION
Lipid Content Stratification through Blubber Depth
Stratification of lipid content through blubber depth was seen in both the white-beaked dolphins
and the balaenopterids. In both of these groups, the middle and inner layers had a lower lipid
content than the outer layer closest to the skin, and the inner layer of the balaenopterids had the
lowest lipid content overall. The stratification observed here is likely the result of differential
metabolism of fatty acids, and thus deposition and mobilisation of lipid stores through the
blubber depth (Lockyer et al., 1984; Samuel and Worthy, 2004; Smith and Worthy, 2006).
Long-chain polyunsaturated fatty acids of dietary origin are present in higher concentrations in
the inner layer compared to the outer layer, and these are preferentially metabolised due to their
proximity to the body core (Krahn et al., 2004; Lockyer et al., 1984). This makes the inner and
middle layers more metabolically active in terms of lipolysis and lipogenesis compared to the
outermost layer which is made up primarily of short chain monosaturated fatty acids (Olsen
and Grahl-Nielsen, 2003; Ruchonnet et al., 2006; Samuel and Worthy, 2004). The outer layer
therefore likely has a more structural and possibly thermoregulatory role with a more stable
composition over time as it is more metabolically inert. Koopman and colleagues (2002) found
that the outermost layer of the blubber in starved harbour porpoises (Phocoena phocoena) was
virtually indistinguishable from normal animals, but throughout the rest of the blubber, the
adipocytes shrank and ‘disappeared’ during starvation.
Here, only the lipid content of the middle layer of the balaenopterids was significantly
correlated with morphometric condition. This is consistent with previous reports that the
middle layer of fin and sei whale blubber consisted of loose, fatty tissue, and was the most
variable in thickness across individuals compared to the other two layers (Lockyer et al., 1985).
The lowest lipid content seen in the inner layers of both the delphinids and the balaenopterids
is consistent with the findings in other species whereby the inner layer contained proportionally
more fibrous tissue than the other two layers (Krahn et al., 2004; Lockyer et al., 1984). Thus,
had shallow biopsy samples been taken from these animals, they would provide inflated
estimates of blubber lipid content as the outermost layer did not reflect the lipid available for
mobilisation in the other layers. In addition, a number of studies have now shown that the lipid
content measured in a biopsy sample is not reflective of that of the tissue when sampled at
necropsy (Krahn et al., 2004; McKinney et al., 2014; Ryan et al., 2012). The discrepancies are
thought to be a result of incomplete sampling of the full blubber depth as well as lipid loss
during dart retrieval as the adipocytes are disrupted upon dart impact.
In contrast to the other two families, the ziphiids showed no variation in lipid content through
depth. The blubber of ziphiids has been shown to display stratification of fatty acids and wax
esters through blubber depth, but the overall lipid content appears to be uniform (Koopman,
2007; Litchfield et al., 1976; Singleton et al., 2017). Ziphiid blubber therefore does not show
the same stratified characteristics as seen in other cetacean species in terms of layers of lipid
deposition and mobilisation that were seen in the balaenopterids and the white beaked dolphins
here. This suggests that the tissue is not being used in the same way for the same energy storage
functions as in other cetacean species. Blubber lipids in ziphiids are dominated by wax esters

Chapter 3 : Blubber Lipid Content
53
(Bagge et al., 2012; Koopman, 2007; Litchfield et al., 1976; Singleton et al., 2017), and this
different composition of the tissue likely affects the patterns of lipid deposition and
mobilisation, as well as tissue function, which will be discussed in detail below.
Lipid Content Variation as an Indicator of Body Condition
The wide variation in lipid content both within and between the balaenopterid samples
compared to the other two species groups is likely a result of the life-history strategies of these
species whereby they cycle their energy stores during seasonal migrations that link temporally
and spatially separated breeding and feeding seasons (Koopman, 2007). As they are adapted to
cycle their fat stores, the range in blubber lipid content is likely to vary much more than for
species that are not adapted to undertake prolonged fasting periods, and thus live within much
narrower limits of stored energy reserves. This was highlighted in the larger dataset of
morphometric measures from the SMASS with the 10-fold difference between the girth/length
index of individuals in the thinnest and fattest condition. Cause of death was retained following
model selection, showing that individuals that died as a result of acute trauma had a higher
lipid content across the full blubber depth compared to chronically debilitated animals. This is
to be expected because chronically debilitated animals have likely depleted their fat reserves
following a more gradual decline in health and perhaps reduced foraging opportunities.
These results from dorsal blubber samples are consistent with previous work on fin and sei
whales, where the dorsal posterior area of the body has been shown to be a major site for lipid
storage in both the blubber and the muscle, leading to the suggestion that this area may be
useful as an indicator of overall body fat condition (Lockyer et al., 1985). While the full
blubber depth samples could be used to differentiate between gross differences as a result of
different cause of death categories, only the lipid content measured in the middle layer was an
appropriate metric to detect subtler differences in condition among the balaenopterid
individuals. Neither sex nor age class were retained as important explanatory variables which
was surprising given previous evidence of variation in fat stores across sex and reproductive
classes in balaenopterids (Aguilar and Borrell, 1990; Lockyer and Smellie, 1985). These data
were dominated by juvenile minke whales, and for this reason little can be inferred about the
effect of age class on blubber lipid content. Similarly, as the animals had probably not reached
sexual maturity, the lack of differences between the sexes could be indicative that sex
differences only appear once animals start to deposit and mobilise fat stores associated with
the costs of reproduction.
Model selection for the delphinid and the ziphiid data retained no covariates as important
explanatory variables. When plotted individually, there were no correlations between the lipid
content in any blubber layer and morphometric body condition. One explanation for the lack
of variation here could be a consequence of the dorsal site of the blubber sample. Dorsal
blubber samples were taken immediately caudal to the dorsal fin in all species in order to
investigate the potential use of lipid content as measured in remotely obtained biopsy samples
which target this area. However, in small odontocetes, the blubber in the thoracic-abdominal
region is hypothesized to play an important role in insulation and energy storage, whereas the
region posterior to the dorsal fin is thought to primarily act to maintain hydrodynamic and

Chapter 3 : Blubber Lipid Content
54
locomotory functions and is metabolically inert (Gómez-Campos et al., 2015; Koopman, 1998;
Koopman et al., 2002; Tornero et al., 2004). Specifically, harbour porpoises and common
dolphins (Delphinus delphis) showed the highest blubber lipid content in the anterior-ventral
region (Koopman et al., 2002; Tornero et al., 2004), and patterns of lipid distribution in starved
harbour porpoises showed that they are mobilised from their ventral girth region but not from
other areas of the body (Koopman, 1998). It was hypothesised that altering the structure of the
posterior blubber by mobilizing lipids could have serious effects on the locomotory efficiency
of the animal as this region of the blubber acts to reduce the costs of locomotion by acting as a
biological spring (Koopman et al., 2002).
This pattern of lipid deposition and mobilisation may also extend to other odontocete species
such as the white-beaked dolphins and the ziphiids sampled here, which could explain why
lipid content at this dorsal sampling site did not correlate with morphometric indices of body
condition or cause of death of the individuals. Thus, there are apparent differences in the
function of the blubber as an energy store across the bodies of the larger cetaceans, the
balaenopterids, and the smaller odontocetes studied to date. These differences are likely due to
a combination of the different hydrodynamic body shapes, swimming gaits and
manoeuvrability of the species, as well as their life histories and reproductive strategies that
determine their reliance on endogenous energy stores. Some areas of the body are therefore
more important for energy storage than others, and this variation is not necessarily captured in
the dorsal sampling site of biopsy samples for some species.
Implications of the Dominance of Wax Esters in Ziphiids
The apparent absence of variation in lipid content both within and between the ziphiids sampled
here could be a result of the different lipid-type composition of the tissue. Ziphiid blubber is
made up of between 80% and 100% wax esters (Hooker et al., 2001; Koopman, 2007;
Litchfield et al., 1975), and their relative contribution to the tissue changes with different age
and reproductive classes (Singleton et al., 2017). It is possible that beaked whale blubber lipid
storage properties differ from other species because wax esters have different chemical
properties to the triacylglycerols that are more easily and rapidly metabolised (Place, 1992;
Pond, 1998). In fact, most mammals are incapable of metabolizing wax esters and thus
eliminate them in their faeces. The proportion of the lipid stored in the blubber that is available
for mobilisation to provide energy during times of reduced foraging may therefore be much
smaller in beaked whales than species of a similar size that preferentially store triacylglycerols.
Though more research is needed to understand the capability of cetaceans to mobilize wax ester
stores, the preponderance of this less easily metabolised lipid-class in the blubber of these
species is a further indication that the tissue is not being used as an energy store in the same
way as other cetacean species.
Recent studies on the composition of fresh undigested forestomach and colon contents of minke
whale and right whale (Eubalaena glacialis) faeces suggested that they may have evolved an
unusual metabolic capability, such as specialized enzymes or a particular gut symbiont, which,
unlike most other mammals, enables them to utilize the wax esters in their diet (Nordøy, 1995;
Swaim et al., 2009). Baleen whales that rely on a wax ester-rich diet from their copepod prey

Chapter 3 : Blubber Lipid Content
55
thus seem to have overcome the digestive limitations of most terrestrial mammals.
Interestingly, however, the ingestion of wax esters does not necessarily mean that these
compounds will be stored in their adipose tissue. Even though balaenopterids consume large
quantities of wax esters, and are apparently able to metabolise them, their blubber is composed
almost entirely of triacylglycerols. Given the importance of these lipids in beaked whale
blubber, it is likely that these species have also evolved this metabolic capability, but unlike
the balaenopterids, beaked whales are also depositing these lipids in the blubber. For example,
as beaked whales and sperm whales (Physeter macrocephalus) approach adult size, the blubber
is increasingly made up of wax esters (Koopman, 2007; Singleton et al., 2017), suggesting that
wax ester storage is minimal at birth, and they then develop the ability to synthesize and deposit
it.
The differences in the basic structure and common constituents of wax esters and
triacylglycerols give them distinct physical properties. Specifically, wax esters have lower
densities (specific gravities) than triacylglycerols, such that a unit volume of wax esters will
provide more positive buoyancy than the same unit volume of triacylglycerols in sea water
(Sargent, 1978). In addition, wax esters are also less sensitive to phase change with changing
temperature than triacylglycerols (Nevenzel, 1970) which affects tissue buoyancy as they
change from a liquid to a solid. As wax esters are the dominant lipid storage class of calanoid
copepods (Sargent et al., 1977), and deep water and vertically migrating fishes (Nevenzel,
1970), it has been suggested that lipids are preferentially stored as wax esters in many marine
organisms as they provide greater buoyancy (Sargent, 1978). This may be especially the case
for beaked whale species that are particularly deep divers (Tyack et al., 2006), and may use the
positive buoyancy provided by wax esters, unaffected by changing temperatures through the
water column, to maintain an overall body status close to neutral buoyancy as gas stores
compress with depth (Miller et al., 2004; Miller et al., 2016). Neutral buoyancy is thought to
minimize locomotion costs both for vertical transits (Adachi et al., 2014; Miller et al., 2012b)
and for horizontal swimming (Sato et al., 2013).
Wax esters in the blubber have also been suggested to play a potentially important role in
thermoregulation (Bagge et al., 2012; Singleton et al., 2017). The blubber of deep diving
species with a higher wax ester content, but with the same overall lipid content as shallower
divers, has been shown to be a superior insulating material (Bagge et al., 2012). Deep divers
can experience large variations in ambient temperatures during the course of a single dive, and
it has been suggested that this increased insulative capacity of the blubber may facilitate
deeper, longer dives in these species (Bagge et al., 2012). It was concluded that the function of
blubber as an insulator is highly complex and is likely affected by a number of factors including
lipid class, stratified composition and dynamic heat storage capabilities as well as currently
unmeasured characteristics such as vascularization, collagen content or water content (Bagge
et al., 2012). These beaked whale results highlighting the lack of variation in lipid content add
to a body of work aiming to understand the selective pressures leading to the presence and
abundance of wax esters in the blubber of odontocetes, and their potential physiological
functions.

Chapter 3 : Blubber Lipid Content
56
Currently, there is no evidence to suggest that any of the beaked whale species experience
substantial or predictable fasting cycles, or periods of food shortage when lipid reserves might
be drawn upon (MacLeod, 2018). Species that rely on blubber lipids during fasting may be
constrained to storing only triacylglycerols, because this lipid source can be reliably and rapidly
mobilized. By extension, perhaps as beaked whales do not experience prolonged fasting
periods, they are preferentially able to store blubber lipids that provide some elements of
physiological or mechanical advantage during diving instead of energy storage. For these
reasons, the role of beaked whale blubber in diving physiology may determine the extent to
which it can change in lipid composition because the structural and mechanical properties of
the tissue are prioritised at the expense of available energy stores. Small changes in the blubber
lipid content may affect their thermoregulatory homeostasis, their hydrodynamic shape
required for capture of fast-swimming prey, the nitrogen solubility of the tissue, and possibly
most importantly, the maintenance of neutral buoyancy which enables them to forage
efficiently at depth. As a result, they maintain a narrow range of blubber lipid content. The very
narrow range in the girth/length condition estimates using the larger morphometric dataset from
the SMASS further supports the possibility that these species survive within very narrow
physiological limits.
Much More than Just an Energy Store
Here, there was no relationship between blubber thickness and blubber lipid content for any of
the individuals sampled, regardless of species group. Results of this study therefore support the
idea that blubber thickness alone is an inadequate index of fat stores because the lipid content
of the tissue varies independently of its thickness (Aguilar et al., 2007; Dunkin et al., 2005;
Evans et al., 2003). There are two possible reasons for this lack of a relationship: either the
small sample size of this dataset prevented the detection of any correlations between lipid
content and blubber thickness, or the other functional roles of the blubber not involved in
energy storage also affect blubber thickness. This is a small sample size of 27 individuals, and
it is possible that the lack of correlation between lipid content and blubber thickness here could
be because there was not a great enough range in blubber thicknesses or lipid content within
each species group. However, because the individuals sampled, with the exception of the
balaenopterids, covered the range of potential morphometric body condition estimates from the
larger SMASS dataset, this is likely not the case.
Various other studies have also shown similar resuls in which blubber thickness was
determined to be a poor index of nutritive condition because it was not correlated with changes
in overall body fat reserves (Aguilar et al., 2007; Caon et al., 2007; Evans et al., 2003; Gómez-
Campos et al., 2015; Koopman, 2007; Read, 1990; Ruchonnet et al., 2006). This is because the
extent to which blubber lipids can be mobilised is limited by thermoregulatory and
hydrodynamic considerations, and is not simply a function of its energy reserves. It is well
recognised that in addition to its role as a depot of energy, cetacean blubber also serves
important functions as an insulator, it is involved in active thermoregulation, it streamlines the
body, facilitates hydrodynamic locomotion, contributes to water balance, and provides
buoyancy (Iverson, 2009). For example, adipocyte fluid content and blubber collagen content
also likely dictate blubber thickness. For these reasons, attempts should be made to move away

Chapter 3 : Blubber Lipid Content
57
from using blubber thickness as an indicator of condition, and alternative methods should be
investigated across all species, not just beaked whales, as discussed in Chapter 1.
Conclusions and Future Directions
Cetaceans have evolved highly specialized adipose tissues to meet the challenges of their
aquatic environment. Varying habitats and life history strategies have shaped different typical
blubber functions and composition such that the blubber may serve a fundamentally different
purpose across different species. Here, the lipid content of the middle layer in the
balaenopterids was correlated with morphometric body condition, in keeping with previous
work suggesting that this layer is the most important in terms of lipid deposition and
mobilisation. However, it still remains unclear for most cetacean species whether changes in
lipid content and blubber thickness in this part of the tissue occur as a result of adipocyte
hyperplasia or hypertrophy, or a combination of both. The lipid content measured in the outer
part of the tissue for these species, available through remote dart biopsy, thus gives little
information on an individual’s condition, because it provides no information on the layers that
are involved in lipid deposition and mobilisation.
There was a lack of stratification of total lipid through the blubber depth of the ziphiid samples,
as well as a lack of variability among individuals. The lack of variability here together with the
known high wax ester content of the blubber suggests that its other roles in diving physiology
for example, may be of greater importance than its role as an energy depot. The blubber in
these species may therefore not be optimized as an energy store as it is in many other cetacean
species. The relationship between blubber lipid content and overall energy stores is not
straightforward in these animals of different body sizes, life history strategies, foraging
ecologies and physiological capabilities. Using the proportions of different saturated /
unsaturated fatty acids or the proportion of triaclyglycerols to wax esters, for example, might
be a more reliable indicator of condition. Thus, because of the inherent variability in the
structure and composition of blubber among families, species, individuals, and even within
individuals, extreme caution should be exercised when making inferences and generalizations
based on the lipid content of only a small portion of this extremely complex tissue. Further
work should prioritise measuring other components of blubber biopsies as potential markers of
condition.

Chapter 4 : Blubber Cortisol Concentrations
58
CHAPTER 4 : BLUBBER CORTISOL - A NOVEL
MARKER OF PHYSIOLOGICAL STATE IN
CETACEANS?
Cortisol was extracted and quantified in a subset of the harbour porpoise blubber samples by
Meredith Sherrill, and these data were used for her MSc Thesis in 2015.
The harbour porpoise data analysis and discussion part of this chapter has been published in
Ecology and Evolution (2017).
Kershaw JL, Sherrill M, Davison NJ, Brownlow A, Hall AJ. Evaluating morphometric and
metabolic markers of body condition in a small cetacean, the harbor porpoise (Phocoena
phocoena). Ecology and Evolution. 2017;7(10):3494-3506.

Chapter 4 : Blubber Cortisol Concentrations
59
1. ABSTRACT
Cortisol is the main glucocorticoid hormone involved in the regulation of lipolysis and overall
energy balance in mammals, and circulating concentrations could therefore provide
information on physiological state. As a potential metabolic condition marker, blubber cortisol
concentrations were investigated across two cetacean species groups with different life-history
strategies; firstly, harbour porpoises (Phocoena phocoena), and secondly, humpback whales
(Megaptera novaeangliae) and minke whales (Balaenoptera acutorostrata), grouped here as
balaenopterids. Blubber cortisol concentrations did not significantly vary around the girth of
harbour porpoises (n = 20), but there was significant vertical stratification through the blubber
depth with highest concentrations in the innermost layer. Concentrations in the dorsal,
outermost layer were representative of concentrations though the full blubber depth, and
showed variation by sex, age class and were negatively correlated with a morphometric index
of body condition (mass/length2) in this species. There was no variation in cortisol
concentrations between different blubber layers in the balaenopterid samples, so
concentrations measured in the outermost layer were representative of those through the full
blubber depth (n = 9). The balaenopterid individuals also showed variation between the sexes,
and concentrations in the outer blubber layer were negatively correlated with a morphometric
index of condition (girth/length). Higher blubber cortisol concentrations measured in animals
in poorer condition that are likely metabolising fat stores, rather than depositing them, therefore
appear to be consistent in both non-fast adapted and fast-adapted species. Using these species
as models for live cetaceans from which blubber biopsy samples are routinely collected,
cortisol concentrations in the dorsal, outermost blubber layer could be used as a biomarker of
the metabolic state of the tissue and of physiological state in free-ranging animals.

Chapter 4 : Blubber Cortisol Concentrations
60
2. INTRODUCTION
Marine mammals encounter a diverse range of both psychological and physiological
anthropogenic stressors including habitat alteration and degradation, industrial pollution, noise
pollution, incidental entrapment in fishing gear and a reduction in prey abundance, to name
just a few (Fair and Becker, 2000). These stressors are likely to induce a physiological response
which can be either short-term (acute) or long-term (chronic). This reaction is generally termed
the stress response. It is characterised by the release of cortisol, a glucocorticoid, from the
adrenal glands, and epinephrine and norepinephrine, the catecholamines, from the adrenal
glands and from nerve terminals, which together prepare the individual for the demands of
metabolic, physical and psychological stressors (Negrão et al., 2000). Because of the harmful
effects of chronic stress, including reproductive failure, immune system suppression,
promotion of protein loss from skeletal muscle, neuronal cell death, and suppression of growth
(McEwen et al., 1993; Munck et al., 1984; Sapolsky, 1987; Sapolsky et al., 2000), there is
increasing interest in measuring the stress response in free-ranging marine mammals.
The adrenal secretion of cortisol in response to stressful psychological stimuli (e.g.
anthropogenic disturbance) and physiological stimuli (e.g. nutrient limitation) is controlled by
the hypothalamic-pituitary-adrenal (HPA) axis (Liberzon et al., 1997). Cortisol is the major
glucocorticoid stress hormone released following stimulation of the HPA axis in many
mammals, including cetaceans (Ortiz and Worthy, 2000; St. Aubin et al., 1996) and pinnipeds
(Barrell and Montgomery, 1989; Gardiner and Hall, 1997). As a result, cortisol and its
metabolites have been measured in various marine mammal matrices including the blood
(Atkinson et al., 2011; Barrell and Montgomery, 1989; Thomson and Geraci, 1986), faeces
(Hunt et al., 2006; Rolland et al., 2012), saliva (Pedernera-Romano et al., 2006), hair
(Bechshøft et al., 2012; Macbeth et al., 2012) skin (Bechshøft et al., 2015), blow expirate
(Thompson et al., 2014) and blubber (Champagne et al., 2017; Kellar et al., 2015; Trana et al.,
2015, 2016) in order to measure their responses to combinations of environmental and
anthropogenic stressors.
However, in terrestrial mammals, the glucocorticoids have also been proposed as long-term
regulators of both energy intake and storage (Strack et al., 1995). Glucocorticoids are metabolic
hormones that increase in circulation in response to energetic needs, and their concentrations
can be interpreted as indicators of allostatic load (Bonier et al., 2009). Cortisol is of particular
interest in the regulation of whole body energy stores because it is involved in maintaining the
balance between fat storage where triglycerides are deposited, and fat depletion where they are
catabolised and released into circulation (McMahon et al., 1988; Peckett et al., 2011). Cortisol
is known to play an active role in lipolysis in subcutaneous adipose tissue (Divertie et al., 1991;
Djurhuus et al., 2004; Samra et al., 1998), stimulate gluconeogenesis, mobilise amino acids,
and increase circulating concentrations of plasma proteins (Bergendahl et al., 1996; Exton et
al., 1972). Thus, overall, cortisol is a catabolic hormone, and together these processes act to
increase the availability of all fuel substrates by mobilisation of glucose, free fatty-acids and
amino acids from endogenous stores (Dinneen et al., 1993; Djurhuus et al., 2002).

Chapter 4 : Blubber Cortisol Concentrations
61
Cortisol exerts these effects on target tissues after uptake of free hormone from circulation and
binding to intracellular glucocorticoid receptors which are members of the steroid/thyroid
receptor hormone superfamily of transcription factors (Arlt and Stewart, 2005). The binding of
cortisol to the glucocorticoid receptor in the cytosol results in activation of the steroid receptor
complex and its translocation to the nucleus. After translocation to the nucleus, gene
transcription is stimulated or repressed following binding of dimerized glucocorticoid
receptor/ligand complexes to specific DNA sequences, called glucocorticoid response
elements, in the promoter regions of a range of target genes (Arlt and Stewart, 2005). Cortisol
therefore plays an important role in the activation of numerous metabolic pathways that control
carbohydrate, protein and lipid metabolism (Arlt and Stewart, 2005) among other physiological
processes.
To date, investigation of this hormone in marine mammal energy regulation and fasting
metabolism has focused on pinnipeds (Guinet et al., 2004; Kershaw and Hall, 2016; Ortiz et
al., 2003). Specifically, similar to terrestrial mammals, there is an increase in plasma cortisol
concentrations with prolonged fasting events in subantarctic fur seals (Arctocephalus
tropicalis) and northern elephant seals (Mirounga angustirostris) (Guinet et al., 2004; Ortiz et
al., 2001). It has been hypothesised that these higher circulating cortisol concentrations may
contribute to significantly increased fat oxidation during the fast, and may also serve as a cue
to terminate fasting and initiate feeding (Ortiz et al., 2001). Blubber cortisol concentrations
have been shown to increase during natural fasting periods of the life cycle of harbour seals
(Phoca vitulina), particularly during the moult (Kershaw and Hall, 2016), suggesting that
cortisol may play a key role in increased fat metabolism in the tissue during highly energetically
demanding periods. Blubber cortisol concentrations decreased inversely with proportion
blubber lipid content in California sea lions (Zalophus californianus) (Beaulieu-McCoy et al.,
2017). This hormone could therefore potentially be used to monitor long-term nutritional
status.
The aim of this work was to investigate blubber cortisol concentrations as an alternative
physiological, endocrine marker of condition in cetacean species with very different life history
strategies; firstly, harbour porpoises (Phocoena phocoena), and secondly, humpback whales
(Megaptera novaeangliae) and minke whales (Balaenoptera acutorostrata), grouped here as
balaenopterids. Harbour porpoises, like most odontocetes are considered as income breeders,
because they continue to feed throughout the reproductive cycle, while balaenopterids are
considered capital breeders because stored energy reserves acquired on high latitude feeding
grounds are depleted to cope with the costs of reproduction on low latitude breeding grounds
(Lockyer, 1987). Full depth blubber samples were collected from stranded individuals, and
variation in cortisol concentrations by blubber depth, body location, age class, sex and
morphometric body condition were explored to investigate the potential use of blubber cortisol
concentrations as an informative condition biomarker in dorsal, remotely obtained biopsy
samples.

Chapter 4 : Blubber Cortisol Concentrations
62
3. METHODS
3.1 Sample Collection
Harbour Porpoises: Full depth skin, blubber and underlying muscle samples were collected
from 20 dead harbour porpoise by the Scottish Marine Animal Strandings Scheme (SMASS)
between 2013 and 2015. Only freshly dead animals, classified as those that originally stranded
alive or had only recently died and thus showed no evidence of bloating, and the meat is
considered to be edible (Kuiken and Hartmann, 1991), were sampled for this work in order to
prevent erroneous hormone concentration measurements as a result of tissue decomposition
after death. As described in Chapter 1, mass, length and girth measurements were taken.
Samples were collected from the dorsal, lateral and ventral axes around the girth of the animal,
immediately caudal to the dorsal fin. Blubber depth was recorded at each sampling site. Tissue
samples were individually wrapped in aluminium foil and stored at -200C in plastic vials before
hormone analysis. These individuals were both adults (n = 13) and juveniles (n = 7), and males
(n = 11) and females (n = 9). The cause of death was determined following post-mortem
examination, and classified as either acute (n = 13) or chronic (n = 7), as previously described
in Chapter 1. Individual details are shown in Table 4.1.
Balaenopterids: Full depth, dorsal blubber samples were collected from 9 stranded
balaenopterids (3 humpback whales and 6 minke whales). Samples were collected by the
SMASS (2013-2015), and by the MICS (2010 and 2013) from the dorsal area immediately
caudal to the dorsal fin. For the samples collected by the SMASS, information on the cause of
death was used to classify each individual as an ‘acute’ or ‘chronic’ case. Morphometric
measurements including girth, length and blubber thickness were also collected from the
SMASS animals only, and lipid content data were available for all samples from previous
analyses in Chapter 2 (Table 4.1).

Chapter 4 : Blubber Cortisol Concentrations
63
Table 4.1 – Summary table of the harbour porpoise and balaenopterid individuals used for
analysis with the data available for each one. ID codes starting with an ‘M’ were collected by
the SMASS, while codes starting with a ‘GSL’ were collected by the MICS. Blubber lipid
content values taken from Chapter 2. * Body Condition Index: mass / length2 for harbour
porpoises and girth / length for the balaenopterids.
Species
Group
Species
ID
Age
Class
Sex
COD
Class
Body
Condition
Index*
Blubber
Lipid
Content
Harbour
Porpoise
Harbour
Porpoise
M018/13 Adult Male Chronic
M020/15 Adult Female Acute
M028/14 Juvenile Male Acute
M055/14 Adult Male Acute
M060/13 Adult Male Acute
M072/13 Juvenile Male Chronic
M134/14 Adult Female Acute
M147/14 Adult Female Acute
M265/13 Adult Female Chronic
M307/14 Adult Male Acute
M315/13 Adult Female Acute
M319/14 Adult Male Chronic
M343/13 Juvenile Female Acute
M373/13 Juvenile Female Acute
M377/13 Adult Male Chronic
M38.2/14 Juvenile Male Acute
M396/13 Adult Female Acute
M040/14 Juvenile Male Chronic
M061/15 Juvenile Female Chronic
M068/14 Juvenile Female Chronic
Balaenopterid
Humpback M159/14 Juvenile Male Acute
Humpback M163/15 Juvenile Female Acute
Humpback GSL-2010 Adult Female
Minke M292/13 Juvenile Female Acute
Minke M297/14 Juvenile Male Chronic
Minke M180/15 Juvenile Male Acute
Minke M319/15 Juvenile Male Chronic
Minke M396/15 Juvenile Female Acute
Minke GSL-2013 Adult Female

Chapter 4 : Blubber Cortisol Concentrations
64
3.2 Cortisol Extraction and Quantification
3.2.1. Subsample Processing
Harbour Porpoises: Duplicate subsamples (0.1-0.2g) were taken from each sample while still
frozen and used for cortisol extraction. Full-depth blubber subsamples were taken from the
three sampling sites (dorsal, lateral and ventral) for all 20 harbour porpoises. Subsamples of
the outer (adjacent to the epidermis), middle and inner (adjacent to the muscle) blubber layers
were taken across these sampling sites for six of the 20 individuals. For thicker blubber samples
(depth ≥15 mm), all subsamples were 5mm in depth with the outer layer subsamples taken
immediately below the skin and inner layer subsamples taken immediately above the muscle
layer. The middle layer subsamples were taken immediately above the inner layer subsamples.
For thinner samples (≤15 mm depth), the blubber thickness was divided into three equal parts
to give outer, middle and inner layer subsamples of equal thickness. The outer layer only was
subsampled from the dorsal site of all 20 individuals (Table 4.2).
Balaenopterids: For samples 20 - 30mm in depth, the blubber was divided into three equal
layers; outer, middle and inner. For the thicker samples that were >30mm in depth, the tissue
was divided into five equal parts so that the inner layer, the middle layer, and the outer layer
were used for processing while the two transitional layers were discarded, as described in
Chapter 2. Duplicate subsamples (0.1-0.2g) were taken from each of these layers while still
frozen and used for cortisol extraction.
Table 4.2 - Number of sub-samples processed for cortisol extraction and quantification from
the harbour porpoise and the balaenopterid full depth blubber samples.
Blubber
Layer
Sampling Location
Dorsal Lateral Ventral
Harbour
Porpoises
Outer Layer 20 6 6
Middle Layer 6 6 6
Inner Layer 6 6 6
Full Depth 20 6 6
Balaenopterids
Outer Layer 9 - -
Middle Layer 9 - -
Inner Layer 9 - -
3.2.2. Cortisol Extraction
Given the similarities in the structure and physical properties of the steroid hormones, the same
method has been used for the extraction of progesterone and cortisol from human adipose tissue
(Newton et al., 1986). For this reason, the extraction method developed by Kellar and
colleagues (2006) for reproductive hormones from cetacean blubber samples was used here to
extract cortisol. The protocol involves tissue homogenisation followed by tissue debris removal
in a series of solvent rinses with recovery of the supernatant each time. The resulting residues
are washed to remove any remaining lipid, and the final extract dried down for resuspension
and assaying.

Chapter 4 : Blubber Cortisol Concentrations
65
Specifically, the 0.1 - 0.2g blubber sub-samples are accurately weighed and manually
homogenized in 1000µl ethanol for 2 minutes to standardize the homogenization process.
Homogenates are then centrifuged at 3,000 rcf for 10 minutes and the supernatants collected
into a clean tube. These are then evaporated under nitrogen while incubating at 250C. Two
milliliters of ethanol : acetone (4:1) are added to the residue and after vortexing and
centrifugation at 3,000 rcf for another 10 minutes, the solution is again evaporated under
nitrogen at 250C to leave a new residue. 1ml of diethyl ether is added to this residue, vortexed
and centrifuged again at 3,000 rcf for 10 minutes. The solution is again evaporated under
nitrogen at 250C. 1ml of acetonitrile is added, the solution is vortexed and 1ml of hexane is
added. The solution is vortexed and centrifuged for 20 minutes at 3,000 rcf. The solvents form
two immiscible layers with hexane on top. The hexane layer is removed, and the acetonitrile
layer re-extracted with another 1ml hexane, centrifuged for 20 minutes at 3,000 rcf and the
final acetonitrile layer aspirated and evaporated under nitrogen at 250C. The final residue is
centrifuged briefly and then either frozen before analysis or re-suspended in 500µl phosphate
buffered saline (PBS) (pH 7.5) if the cortisol assay is performed immediately.
3.2.3. Cortisol Quantification
Cortisol concentrations were determined using a commercially available Enzyme Linked
Immunosorbent Assay (ELISA) kit (DRG International Inc., Marburg, Germany: Cortisol
ELISA EIA-1887). This kit has been used to quantify cortisol in blubber biopsies from harbour
seals (Kershaw and Hall, 2016). Cortisol concentrations were measured according to the
ELISA kit instructions with a standard curve ranging from 0 to 800ng/ml, with a sensitivity of
2.5ng/ml. The hormone concentrations in the samples were calculated from the standard curve
using a 4 parameter log-logistic model. All extracts were above the limit of detection, were
assayed in duplicate, and the mean hormone concentration was reported in ng/g (cortisol per
wet weight of the tissue).
Extracts of varying concentrations, high, medium and low (n=10), were used to calculate inter-
assay (between different plates) and intra-assay (within a plate) coefficients of variation (CVs),
with mean percentage CVs of <20% and <10% set as the acceptable limits, respectively
(Andreasson et al., 2015). The mean inter-assay CV was 10.84%, and the mean intra-assay CV
was 5.65%, and were therefore below the acceptable limits of variation. This ELISA has a
reported 45% cross-reactivity with corticosterone and a 9% cross-reactivity with
progesterone.
3.2.4. Quality Assessment and Quality Control
Quality assurance and quality control tests were performed to validate the use of this cortisol
ELISA with cetacean blubber extracts. Limitations and sources of error in the cortisol
extraction method were also assessed to help interpret the results and adapt this method for
remotely obtained biopsy samples.
Parallelism Assays: For the harbour porpoise and the humpback samples separately, three
subsample extracts, from the outer, middle and inner layers were pooled and serially diluted
four times using the 0 ng/ml cortisol standard provided by the ELISA kit from the undiluted

Chapter 4 : Blubber Cortisol Concentrations
66
sample to a 1/16 dilution. The resulting curve of the detection metric (optical density of the
sample read at 450nm) as a function of the dilution ratio (1, ½, ¼, 1/8, 1/16) was then compared
to the standard curve for each species. In order to statistically assess parallelism, two linear
regression models for dilution state against optical density, one with and one without an
interaction with sample type (ELISA standard or blubber extract), were compared (ANCOVA
function in statistical package R, version 3.1.3, R Core Development Team, 2015). If the
regression lines for each model do not have significantly different slopes, then these data
indicate that the standard curve and the extract dilution curve are parallel. Parallelism of these
regression lines supports the assumption that the antigen binding characteristics allow the
reliable determination of hormone levels in the diluted blubber extracts (Andreasson et al.,
2015), and the ELISA kit is therefore reliably measuring cortisol in the tissue samples.
The comparison between the two linear regression models, one with and one without an
interaction with sample type showed that removing the interaction did not significantly affect
the fit of the model for the harbour porpoise or the humpback blubber extract dilutions
(ANCOVA; F = 10.78, p = 0.1, and F = 0.079, p = 0.7 for each species model comparison,
respectively). Therefore, it was concluded that the effect on optical density with increasing
sample dilutions is the same for the standard curve samples and the blubber extracts, and that
the regression lines are parallel (Fig. 4.1). This ELISA is therefore suitable for the
quantification of harbour porpoise and humpback whale cortisol.
Matrix Effect Test: Successful immunologic assays require an optimal pH and ionic strength
that promotes specific antibody–antigen complexes while reducing the nonspecific binding of
other proteins in the samples that increase assay interference. As the ELISA kit used here was
designed for use with serum or plasma samples, the compatibility of the kit with extracts
resuspended in PBS was assessed. Equal volumes of each standard were spiked with PBS and
assayed in tandem with the unspiked standard curve. The known and the apparent
concentrations in the spiked samples should show a positive linear relationship with a slope of
approximately 1.0 (Hunt et al., 2014). The matrix effect test was successful with a slope of 1.08
(a slope of between 0.8-1.2 was considered acceptable) (Fig. 4.2). It was concluded that matrix
effects are minimal and this sample diluent is therefore compatible with the immunoassay.

Chapter 4 : Blubber Cortisol Concentrations
67
Extraction Efficiency: In order to assess the extraction efficiency of this method, cortisol
recovery from spiked samples was measured. As blubber biopsies from live animals vary in
size, it was necessary to determine the extraction efficiency of this method across tissue
samples of different masses. Samples ranging between 0.1 and 0.3g, the typical range of masses
of biopsy samples obtained from free-ranging cetaceans, were used for analysis. One full depth
Fig. 4.1. Linearity assessment for the cortisol ELISA with harbour porpoise and
humpback whale blubber tissue extracts. Serial dilutions of three pooled extracts for each
species show parallelism with the ELISA standard curve (ANCOVA: F = 10.783, p = 0.103
and F = 0.079, p = 0.7 for each species linear model comparison respectively).
Fig. 4.2. Matrix Effect Test
Validation. The linear
regression lines for the expected
against the observed
concentrations are shown for the
expected 1:1 relationship and
the measured relationship from
the assay results. The assay
results show a positive linear
relationship with a slope of 1.08,
thus confirming that PBS is an
acceptable sample diluent
compatible with this cortisol
ELISA kit.

Chapter 4 : Blubber Cortisol Concentrations
68
blubber sample from a harbour porpoise was divided into masses of 0.05g, 0.1g, 0.15g, 0.2g,
0.25g, and 0.3g (all ±0.025g), each one in triplicate, such that one sample of each mass was
unspiked while the other two were spiked with 100ng of cortisol. Cortisol was then extracted
and measured as outlined above, and the average percent recovery calculated for each sample.
The extraction efficiencies ranged from an average of 88.4% for the 0.05g samples, down to
an average of 75.7% for the 0.3g samples. However, the relationship between the extraction
efficiency and sample mass was not linear (Fig. 4.3a). For this reason, a 4 parameter log-logistic
model was fitted to these data to model the effect of tissue mass on extraction efficiency (Fig.
4.3a). This model was used to calculate the expected extraction efficiencies for all the blubber
subsamples processed in this study based on their mass. These extraction efficiencies were then
used to correct the measured cortisol concentrations in each sample to give a final cortisol
concentration used for statistical analysis.
Minimum Sample Mass and Correction Factors: Remotely obtained blubber biopsy
samples are often used for multiple analyses in order to maximize the potential information
gained from the tissue. Subsampling remotely obtained biopsies for multiple analyses can
therefore result in small amounts of tissue available for processing, and the minimum amount
of tissue needed to obtain robust, replicable measurements of cortisol concentrations in the
blubber samples using this extraction method should be established. Here, multiple extractions
from the same piece of tissue of differing masses were assayed. Again, full depth, duplicate
subsamples of different masses between 0.05 and 0.3g (all ±0.025g) at 0.05g intervals were
taken from the same blubber sample. Cortisol was extracted and measured in these samples in
tandem, and the mean cortisol concentration calculated for each one (Fig. 4.3b).
As the sample mass increased, both the cortisol concentration measured and the variation
between the duplicate subsamples decreased (Fig. 4.3b). Only the 0.15g, 0.2g and 0.25g
subsamples overlapped in their measured cortisol concentrations (Fig. 4.3b). Thus, based on
the decrease in extraction efficiency (Fig. 4.3a) and increase in measurement variability (Fig.
4.3b), it is recommended for maximum extraction efficiency and measurement replicability,
that blubber samples for extraction should be between 0.15 and 0.2g. For this method to be
applicable to remotely obtained biopsy samples that are sometimes smaller than this
recommended 0.15 - 0.2g mass range, a ‘correction factor’ model was built using these data.
The ‘true’ concentration was taken as the average concentration measured in the 0.15g and the
0.2g samples. The concentrations measured in the samples of other masses were divided by
this ‘true’ concentration to give a correction factor. A 4 parameter log-logistic model was fit to
these data to model the effect of tissue mass on the correction factor required (Fig. 4.3c). As
sample mass decreases from the average recommended 0.175g, the correction factor increases,
indicating that smaller sample masses give inflated cortisol concentration estimates (Fig. 4.3c).
This approach could be used to correct cortisol measurements from remotely obtained biopsy
samples to avoid overestimating cortisol concentrations as an artefact of a small biopsy sample
mass analysed.

Chapter 4 : Blubber Cortisol Concentrations
69
3.3 Statistical Analysis
All statistical analyses were performed using the statistical package, R, version 3.1.3 (R Core
Development Team, 2015).
Fig. 4.3. Cortisol extraction efficiency and quantification errors based on sample mass.
a) Extraction efficiency decreases with increasing blubber sample mass in a non-linear fashion.
b) Mean cortisol concentration in duplicate sub-samples decreases with increasing sample
mass in a non-linear fashion. Measured concentrations overlap in sample masses between
0.15g and 0.25g. c)Smaller samples masses than the ideal sample mass recommended as
between 0.15-0.2g give inflated cortisol concentrations and therefore a larger correction factor
is applied to measured cortisol concentrations to compensate for this bias.

Chapter 4 : Blubber Cortisol Concentrations
70
3.3.1. Harbour Porpoises
Two different modelling approaches were used to assess firstly, the effects of both sampling
site and sampling depth on blubber cortisol concentration and, secondly, the effects of other
explanatory covariates (age class, sex, COD and morphometric body condition). A summary
of each set of subsamples used for the various models is given in Table 4.3.
Body Location and Blubber Layer: Generalised Linear Mixed Effect Models (GLMMs) were
used to investigate cortisol concentrations both across body locations and through the blubber
depth whilst accounting for the repeated measurements from the same individuals that were
considered as random effects (Bolker et al., 2008). Two GLMMs (glmer function in the R
package lme4) with a gamma distribution to model the right skew in the cortisol concentration
data, a log link function, and each individual treated as a random effect were used to investigate
firstly, the effect of body location on cortisol concentration in full depth subsamples (n = 20
individuals with three samples each, Table 4.3), and secondly, the effect of body location and
blubber layer (n = 6 individuals consisting of three females and three males, four acute cases
and two chronic cases with 12 samples each, Table 4.3). An interaction between body condition
(mass/length2) and location, as well as between body condition and layer were also included to
consider the possibility that animals in varying condition may show differences in their cortisol
distribution though the blubber depth and across their bodies as a result of differential energy
store mobilisation. Backwards model selection using the dredge function was used to identify
the variables and/or interactions that best explain the variation in hormone concentrations and
thus to include in the final models. The goodness of fit of each model was assessed using the
AICc. The model with the lowest AICc value was used for further interpretation.
Individual Covariate Analysis: Generalised Linear Models (GLMs) were used to assess the
effects of other variables on the cortisol concentrations measured in the outer layer of the dorsal
samples. The outer layer, dorsal subsamples are representative of biopsies taken from live
animals (n = 20, Table 4.3). GLMs were used to model the right skew in hormone
concentrations using a gamma distribution and a log link function. The full GLM including all
the explanatory variables (age class, sex, COD category as either acute or chronic, and
mass/length2) was generated. Again, backwards model selection using the dredge function was
used to identify the variables that best explain the variation in hormone concentrations, and
thus to include in the final model based on the smallest AICc. Visual inspections of the model
residual plots and fitted values were used to check the fit and assumptions of the final model.
3.3.2. Balaenopterids
As with the harbour porpoise data, two different modelling approaches were used to assess
firstly, the effect of sampling depth on blubber cortisol concentration and, secondly, the effects
of other explanatory covariates (sex, COD, body condition and lipid content). A summary of
each set of subsamples used for the various models is given in Table 4.3.
Blubber Layer: As with the harbour porpoise data, GLMMs were used to investigate cortisol
concentrations through blubber depth whilst accounting for the repeated measurements from
the same individuals. Firstly, a GLMM with a gamma distribution, a log link function, and each

Chapter 4 : Blubber Cortisol Concentrations
71
individual treated as a random effect was used to investigate variation in cortisol concentration
by blubber depth (n = 9 individuals with three samples each, Table 4.3). An interaction between
body condition (girth/length) and layer was also included to consider the possibility that
animals in varying condition may show differences in their cortisol distribution though the
blubber depth.
Individual Covariate Analysis: The cortisol concentrations in the outer blubber layer were
modelled using a GLM including sex, body condition (girth/length), outer blubber lipid content
and COD as other explanatory variables to investigate variation in cortisol concentrations. For
this second model, only the samples collected by the SMASS where COD and morphometric
measurements had been recorded were used, thus reducing the sample size down to just seven
animals (Table 4.3). As previously described, the largest model was built first, and backwards
model selection using the dredge function was used to identify the variables that best explain
the variation in hormone concentrations, and thus to include in the final model based on the
smallest AICc. Visual inspections of the model residual plots and fitted values from the final
model gave confidence in the results and allowed interpretation of the model coefficients to
assess the effects of each covariate.
Table 4.3 - Summary of each harbour porpoise and balaenopterid sample subset used for
different models to assess cortisol variation by body location, blubber layer and other
individual covariates. *GLMM: Generalised Linear Mixed Effect Model. **GLM: Generalised
Linear Model.
Species
Group
Number of
Individuals
Body Location Blubber
Layer
Model
20 Dorsal, Lateral,
Ventral
Full GLMM* of Body
Location
GLMM of Body
Location and Layer
together
Harbour
porpoises
6 Dorsal, Lateral
Ventral
Full, Outer,
Middle, Inner
20 Dorsal Full, Outer GLM** of
Individual
Covariates
Balaenopterids
9 Dorsal Outer,
Middle, Inner
GLMM of Blubber
Layer
7 Dorsal Outer GLM of Individual
Covariates

Chapter 4 : Blubber Cortisol Concentrations
72
4. RESULTS
4.1 Harbour Porpoises
Body Location and Blubber Layer: Blubber cortisol concentrations ranged between 3.65 -
759.51ng/g. The final GLMMs following variable selection did not retain either body location
or the interaction with body location and body condition as significant explanatory variables.
Mean concentrations of 69.09 ± 31.30ng/g, 90.48 ± 52.22ng/g and 83.22 ± 59.95ng/g were
measured in the full depth dorsal, lateral and ventral samples, respectively. Thus, there were
no significant differences in blubber cortisol concentrations across these three different
sampling locations (Fig. 4.4a). When blubber layer was considered together with body location
and condition, the final GLMM following variable selection retained only blubber layer as an
important explanatory variable. This suggests that the pattern of cortisol distribution through
blubber depth does not change with sampling site, or animal condition. The highest
concentrations were measured in the inner and middle layers (means of 180.02 ± 177.06ng/g
and 156.28 ± 167.02ng/g, respectively) (p values < 0.01) (Fig 4.4b), and there was no
significant difference between the concentrations in the full depth samples compared to the
outer layer alone (means of 88.65 ± 68.38ng/g and 77.84 ± 48.32ng/g, respectively) (Fig. 4.4b).
Fig. 4.4. Final GLMM outputs for cortisol concentrations across the body and through
the blubber layer for the harbour porpoises. a) GLMM output for blubber cortisol
concentrations around the girth. There were no significant differences in cortisol concentration
in full depth blubber samples from three different sampling locations. b) GLMM output
following variable selection for blubber cortisol concentrations with both location and blubber
depth. The inner and middle layers had significantly higher cortisol concentrations than the full
depth and outer layers (p values < 0.01), while the outer layer was not significantly different to
the full depth sample overall.

Chapter 4 : Blubber Cortisol Concentrations
73
Individual Covariates: Variable selection for the GLM of cortisol concentration in the dorsal,
outer layer samples revealed that there were less than two points difference in the AICc
between the two best fitting models, indicating that they were of equivalent fit to the data (Table
4.4). These models retained both age class and sex, and body condition and sex as important
explanatory variables (Table 4.4). Juveniles had higher cortisol concentrations than adults (p =
0.05), and there was a negative relationship between mass/length2 and cortisol concentration
which was significant at the 10% level (p = 0.1). Overall, females had significantly higher
cortisol concentrations than males with means of 111.37 ± 59.86ng/g compared to 66.77 ±
29.73ng/g (p = 0.02) (Fig. 4.5). This could be as a result of some reported cross-reactivity of
the ELISA kit with progesterone (< 9%). However, one adult female that died as a result of
dystocia (classed here as an acute case) did not have an elevated blubber cortisol concentration
(53.90ng/g) as would be expected if there were high levels of blubber progesterone associated
with pregnancy (Trego et al., 2013). Nonetheless, to investigate the potential confounding
effect of this cross-reactivity, the male and female data were modelled separately with the same
covariates and model selection process. For the male dataset, again, the final model selection
showed that there was less than a two point difference in the AICc between the two best fitting
models including both age class and mass/length2 although neither was individually significant.
For the female dataset, variable selection excluded all covariates, and these results are likely a
result of the small sample size used for analysis when the data are split by sex. COD was not
retained in the final model likely because it is tightly linked to the body condition of the
individuals as the acute cases were generally in better condition, and showed a smaller range
in mass/length2 than the chronic cases with mean mass/length2 values of 0.0022 ± 0.0035 and
0.0018 ± 0.00050 for each group respectively. The body condition of the animals therefore
explained more of the variation in the data than the COD.
Fig. 4.5. Partial termplots for the covariates retained in the final two best fitting GLMs
following variable selection for the harbour porpoise data: glm(Outer.Cort ~ Sex +
Age.Class, family=Gamma(link="log")) and glm(Outer.Cort ~ Sex + Mass/Length2,
family=Gamma(link="log")) (n=20). Termplots plot regression terms against their predictors
with the associated standard errors, while holding other predictors at their mean values.
Significantly higher cortisol concentrations were measured in females than males (p = 0.02),
and in juveniles than adults (p=0.05). There was a weak negative relationship between
mass/length2 and blubber cortisol concentration (p = 0.1).

Chapter 4 : Blubber Cortisol Concentrations
74
4.2. Balaenopterids
Blubber Layer: Cortisol concentrations showed less variation in the balaenopterids than in
the harbour porpoises with a range of between 53.89 – 154.95 ng/g. Model selection for the
GLMM which investigated variation in cortisol concentration through blubber depth showed
that there were no significant differences in cortisol concentration between the inner, middle
and outer layers (means of 93.7 ± 10.0ng/g, 98.3 ± 5.3ng/g and 89.5 ± 9.9ng/g, respectively)
(Fig. 4.6). The interaction between body condition and blubber layer was not retained in the
final model either.
Individual Covariates: Variable selection for the GLM which investigated other factors
contributing to the variation in measured cortisol concentrations in the outermost layer of the
balaenopterid samples retained girth/length and sex as important explanatory variables (Table
4.4). There was a strong negative correlation with girth/length (p < 0.001), such that individuals
in poor condition had higher blubber cortisol concentrations than those in better condition (Fig.
4.7). As with the harbour porpoises, females had a higher blubber cortisol concentration than
males (p = 0.002) with mean concentrations of 91.4 ± 8.86ng/g and 87.9 ± 15.88ng/g,
respectively, although the highest concentration was measured in a male. There was no
difference in cortisol concentrations between animals with acute or chronic CODs. So,
similarly to the harbour porpoise data, it appears that body condition explains more variation
in cortisol concentrations than COD. Finally, lipid content was not retained following model
selection either. In fact, cortisol concentrations were not correlated with lipid content across
any of the samples (n = 27) collected from all nine individuals (Linear regression model:
Adjusted R2 = 0.04, p = 0.93).
Fig. 4.6. Final GLMM output for cortisol concentrations through the blubber depth for
the balaenopterids. Model selection did not retain layer as an important explanatory variable
as there were no significant differences in cortisol concentration between the inner, middle and
outer layers.

Chapter 4 : Blubber Cortisol Concentrations
75
Table 4.4 - Results of GLM model selection for outer layer blubber cortisol concentrations for
harbour porpoises (n=20) and balaenopterids (n = 7) showing the three best-fitting models with
the lowest AICc values. Harbour porpoise models 1 and 2 are of equivalent fit to the data.
Species Model Covariates Retained
df AICc ΔAICc weight
1 Cortisol ~ Sex + Age Class
4 209.4 0.0 0.29
Harbour
Porpoises
2 Cortisol ~ Sex + Mass/Length2 4 210.9 1.5 0.14
3 Cortisol ~Age class
3 211.9 2.5 0.08
1 Cortisol ~ Girth/Length + Sex
4 190.4 0.0 0.36
Balaenopterids 2 Cortisol ~ Girth/Length + Sex +
Lipid
5 192.6 2.2 0.12
3 Cortisol ~ Girth/Length + Sex +
COD
5 193.9 3.5 0.06
Fig. 4.7. Partial termplots for the covariates retained in the final best fitting GLM
following variable selection for the balaenopterid data: glm(Outer.Cort ~ Girth/Length +
Sex, family=Gamma(link="log")) (n=7). There was a significant negative relationship between
girth/length and blubber cortisol concentration (p < 0.001), and significantly higher cortisol
concentrations were measured in females than males (p = 0.002).

Chapter 4 : Blubber Cortisol Concentrations
76
5. DISCUSSION
Quality Assurance – Quality Control
Based on the extraction efficiency and variability, an optimum sample mass of between 0.15
and 0.2g of tissue was identified for cortisol extraction using these methods. Larger samples
have poorer extraction efficiency as both the homogenisation of the tissue becomes less
efficient with larger pieces, and the mass:solvent ratio is no longer optimal for efficient cortisol
extraction. Smaller sample masses will produce inflated cortisol concentration estimations as
a result of the error associated with small measurements, and then the multiplication effect as
sample mass is used to estimate the concentration in ng/g of tissue. It is recommended that
biopsy samples obtained from live animals should therefore be within this mass range for
reliable cortisol quantification using this extraction method.
Cortisol concentrations are reported as per gram of blubber tissue, which includes non-lipid
components of the blubber, such as proteins and water. Other studies have reported blubber
cortisol concentrations as nanograms of cortisol per gram of lipid extracted from the tissue
(Champagne et al., 2017; Champagne et al. 2018) because lipid mass was thought to be a more
stable reference than wet tissue mass. For this work, cortisol concentrations were not
normalised by lipid content for two reasons. Firstly, as the effects of cortisol on tissue
metabolism are of interest in terms of increased lipolysis or lipogenesis, normalising by lipid
content would not allow the investigation of a potential correlative relationship between
hormone concentrations and lipid content of the tissue. Here, there was no correlation between
lipid content and cortisol concentrations in any of the balaenopterid samples. Secondly, when
measuring blubber cortisol concentrations, these are likely a combination of circulatory cortisol
within the extra-cellular matrix, cytoplasmic cortisol within the adipocytes, and cortisol
associated directly with the adipocyte lipid droplets themselves as a result of its lipophilic
nature. Variability in cortisol measurements is therefore likely the result of variability in these
different sources of ‘tissue’ cortisol, and is not solely a function of the lipid content within the
lipid droplets inside the adipocytes. Had cortisol concentrations been normalised to lipid
content, there may have been greater individual variation in hormone concentrations, especially
for the balaenopterid samples where total lipid content of the tissue showed marked differences
between individuals (Chapter 3) compared to the wet tissue mass which was standardised as
much as possible. The sources of this individual variability would then require some careful
interpretation for the reasons outlined above.
Variation Across Sampling Sites and through Blubber Depth
Blubber cortisol concentrations measured in harbour porpoises, between 3.65 - 759.51ng/g,
and in the balaenopterids, between 53.89 – 154.95ng/g, were higher than those previously
reported in common dolphins (Delphinus delphis) (Kellar et al. 2015) and belugas
(Delphinapterus leucas) (Trana et al., 2016) with reported average ranges of between 3.99-
24.3ng/g and 0.26-1.76ng/g for each species, respectively. The order of magnitude differences
between the maximum concentrations measured in each of these studies compared to this one
could be a result of species-specific differences in hormone concentrations, as well as small
method alterations in the extraction and quantification processes between studies.

Chapter 4 : Blubber Cortisol Concentrations
77
Here, no significant variation in blubber cortisol concentrations was seen across the three
different sampling locations on harbour porpoises. Dorsal sampling through the collection of
remote biopsies could therefore provide information on typical blubber cortisol concentrations
across this area of the body. These results are consistent with the notion that while harbour
porpoises and other small odontocetes may selectively mobilise lipids unevenly across
different areas (Koopman et al., 2002), blubber composition remains relatively consistent
across the body (Koopman et al., 2002).
Evidence of stratification in cortisol concentration was seen through the blubber depth in
harbour porpoises with highest concentrations measured in the middle and inner layers.
Overall, the highest concentrations were measured in the inner layer, which was also found in
belugas (Trana et al., 2015). This is perhaps because the inner layers are more highly
vascularised in shallow diving odontocetes compared to the superficial blubber layers closer to
the skin (McClelland et al., 2012). Inner layers are also closer to larger blood vessels that supply
the underlying muscle tissue. Together, these likely result in a higher concentration of cortisol
from the circulatory system in this part of the blubber.
This stratification in cortisol concentration is unsurprising given that cetacean blubber is
stratified into three layers that can be differentiated visually, histologically and biochemically
in many cetacean species (Olsen and Grahl-Nielsen, 2003; Smith and Worthy, 2006). In
harbour porpoises specifically, the inner and middle blubber layers are more dynamic, and are
likely used for lipid deposition and mobilization at a much faster rate than the outermost layer
next to the skin (Koopman et al., 1996). Given the differences in the rate of turnover of the
tissue, the cortisol concentrations measured in the full depth blubber samples represent the
integration of the hormone through the tissue over a longer time period than either the middle
or inner layers alone. There were no significant differences in the concentrations measured in
full depth blubber samples compared to the outer layer. Thus, these superficial samples could
be representative of the longer term presence of cortisol in the blubber that is not subject to
strong fluctuations as a result of short term changes in the blood flow through the tissue to the
skin during thermoregulation (Barbieri et al., 2010; Noren et al., 2009). Cortisol concentrations
in the outer blubber layer available through remote dart biopsy could thus be used as a potential
indicator of longer-term physiological changes.
The cortisol concentrations measured in the balaenopterid samples were both lower, on
average, and showed less variation than those measured in the harbour porpoises.
Concentrations in the outer layer are representative of concentrations measured though the full
blubber depth as there was no variation in cortisol concentrations through the different blubber
layers in these samples. This was surprising given previous findings of stratification of this
hormone through the blubber depth in belugas (Trana et al., 2015), and the variation in
concentrations measured in harbour porpoises here. It is also surprising given the documented
differences in tissue structure, lipid content and fatty acid signatures of the different blubber
layers in mysticetes (Ackman et al., 1975a; Lockyer et al., 1984, 1985) which demonstrate the
different potential functions of the layers in terms of nutrient transport, lipid storage and
mobilisation, and structural support. It seems logical therefore, that hormone concentrations
would also show similar variation.

Chapter 4 : Blubber Cortisol Concentrations
78
Currently, the only published data on steroid hormone concentrations in mysticete blubber are
progesterone concentrations measured in dead minke whales and bowhead whales (Balaena
mysticetus) (Kellar et al., 2013; Mansour et al., 2002) and shallow depth biopsy samples from
free-ranging humpback whales (Clark et al., 2016; Pallin et al., 2018a; Pallin et al., 2018b).
There was no stratification in progesterone concentrations though blubber depth in minke
whales (Mansour et al., 2002), and concentrations through the blubber depth were indicative
of pregnancy status. Stratification through blubber depth was not investigated in the bowhead
whale samples, but concentrations measured in the superficial blubber tissue next to the
epidermis were able to distinguish between pregnant and non-pregnant females (Kellar et al.,
2013). Superficial blubber biopsy samples were also able to distinguish between confirmed
pregnant and non-pregnant humpback whales (Pallin et al., 2018a). The lack of stratification
in cortisol concentrations seen here could be comparable to the lack of stratification recorded
for progesterone in these species.
While obtaining good sample sizes of individuals for comparison is easier for the smaller
odontocete species, the dephinids and porpoises for example, good quality samples collected
from stranded mysticetes are harder to come by. There is therefore a huge gap in our
understanding of both the physical and chemical properties of large cetacean blubber tissue
since studies conducted using whaled samples. Consequently, nothing is known of the
vascularisation of mysticete blubber, and it may be that there is reduced blood flow through
the thicker blubber layer of these animals compared to smaller odontocete species. Thus,
without fluctuations in perfusion of the blubber, cortisol, as a small steroid hormone, could
diffuse passively into the tissue until it is equally distributed, and the time scales over which
these concentrations change compared to the smaller species may be much longer. In addition,
the extent to which these species may also be able to control a peripheral shut down of blood
flow to the blubber is completely unknown. If there is a strong pressure to reduce blood flow
to the tissue in these animals during certain periods of their life cycle, or perhaps even during
certain activities, deep diving for example, this could explain why there was no increase in
cortisol concentration in the inner-most blubber layer as would be expected. Finally, the small
sample size of just nine individuals used for analysis needs to be acknowledged. It is possible
that had a large number of animals been sampled, greater variation in blubber cortisol
concentrations may have been observed.
Cortisol Concentrations as a Potential Marker of Condition
Covariate analyses revealed that, even with a small sample size of just 20 individuals for the
harbour porpoises, and seven individuals for the balaenopterids, as well as high levels of
individual variation, cortisol concentrations in dorsal, outer layer samples were negatively
correlated with morphometric indices of body condition, and females showed higher
concentrations than males. In terrestrial mammals (Castellini and Rea, 1992), humans
(Bergendahl et al., 1996) and pinnipeds (Champagne et al., 2012; Champagne et al., 2006;
Guinet et al., 2004), extended periods of food restriction are associated with an increase in the
circulating concentrations of cortisol. During these periods of reduced food intake or fasting,
cortisol increases lipolysis to provide energy (Bergendahl et al., 1996), and is involved in the
maintenance of circulating glucose concentrations through increased gluconeogenesis (Exton

Chapter 4 : Blubber Cortisol Concentrations
79
et al., 1972). It is likely that the same principles apply to cetaceans, and as such, increased
cortisol concentrations in the blubber of harbour porpoises and balaenopterids in poorer
condition could be a result of increased mobilisation of fat reserves in these individuals.
Similarly, higher concentrations measured in the blubber of juvenile harbour porpoises could
be as a result of these individuals mobilising energy reserves to maximise growth to achieve
size at sexual maturity (McLellan et al., 2002) instead of depositing lipid stores. Juveniles are
likely also under both more nutritional and physiological stress than adults associated with
foraging independently for the first time and being immunologically challenged by new
pathogens, again, leading to the mobilisation rather than the deposition of fat stores. The small
sample size of balaenopterid individuals with accompanying morphometric data and cause of
death information was confounded by both species (dominated here by minke whales) and age
class (all individuals were juveniles), and for these reasons, it was not possible to assess age-
class variation or potential species-specific differences in blubber cortisol concentrations.
Interestingly, the COD category was not retained as an important explanatory variable
following model selection for either species group, demonstrating that the body condition of
individuals explained more variation than the way in which an animal died. Previous work on
short beaked common dolphins and California sea lions showed that animals that died as a
result of fishery bycatch had significantly lower blubber cortisol concentrations than stranded
individuals (Beaulieu-McCoy et al., 2017; Kellar et al., 2015). These differences were
attributed to the average time to death for these two groups of animals, with the conclusion that
the stranded animals had a longer perception of the threat-to-self until death which resulted in
a measureable increase in blubber cortisol concentrations as a result of elevated circulating
concentrations in both species (Beaulieu-McCoy et al., 2017; Kellar et al., 2015). However, it
is possible that for acute causes of death by entrapment in fishing gear, an equally large,
circulating, cortisol stress response would have taken place over the course of minutes before
death. But, because of the potential for profound vasoconstriction during the dive response in
a drowning animal, this cortisol increase was not measurable in the blubber. This is likely true
for the short beaked common dolphin and California sea lion studies, as well as the porpoise
and balaenopterid individuals sampled here. There are therefore other factors related to changes
in peripheral circulation and the dive response that need to be considered when interpreting the
variability in blubber cortisol concentrations of stranded animals.
With these additional sources of variability in mind, the results here, for both species groups,
highlight the need to investigate the effect of the condition and physiological state of
individuals before concluding that cortisol concentrations measured in the blubber are the result
of heightened psychological stress alone. These data suggest that the relationship between
blubber cortisol concentrations and overall body condition is similar in these two groups of
non-fast-adapted and fast-adapted species with different life-history strategies as well as
differences in blubber composition and morphology.
Total cortisol concentrations measured here show the same relationship with overall
morphometric condition indices in the fast-adapted and non-fast adapted species. However,
there is no information from these data about the rate at which the increased glucocorticoid
response to reduced food intake or fasting occurs in the two species groups. The rate at which

Chapter 4 : Blubber Cortisol Concentrations
80
cortisol increases to facilitate lipolysis during periods of food deprivation will likely differ in
fast-adapted and non-fast-adapted species. For example, there may be a slower ramp-up in
cortisol concentrations in balaenopterids compared to spikes in cortisol over much shorter
periods in porpoises. Then, these cortisol spikes may be cleared quickly upon resumption of
feeding in porpoises, but concentrations may remain high in the blubber of balaenopterids as
the tissue is typically required to maintain a lipolytic state for much longer. Different rates in
the glucocorticoid increase in response to fasting are likely also coupled with increases in
protective mechanisms that prevent tissue damage caused by rapid lipid mobilisation with the
production of reactive oxygen species, for example. Despite un-answered questions regarding
the rate of change of tissue cortisol concentrations between species with different life-history
strategies, given the current understanding of the pleiotropic role of cortisol in mammalian fat
and protein metabolism, it is expected that concentrations in this tissue, in these species, may
be used to infer an animals’ physiological state.
Future Directions
Turnover Time Scales?
The greatest challenge for robust interpretation of cortisol concentrations in this ‘new’ matrix,
is how to quantify the time frame captured by this single hormone measurement. The time
frame over which steroid hormones, like cortisol, and their metabolites are distributed around
the body in the blood and are then excreted in the faeces, or sequestered in the blubber for
example, will vary greatly. As such, there is little known about how they may be stored and
mobilised in the blubber, and at what rates. Currently, there is still conflicting evidence as to
the time scales over which circulating steroid hormones are thought to be reflected in the
blubber. For example, no significant relationship was seen between serum and blubber
progesterone concentrations in non-pregnant harvested bowhead whales (Kellar et al., 2013).
It was therefore suggested that progesterone concentrations are mirrored in these two sample
types over longer periods (e.g. over weeks to months, the time frame of reproductive changes)
but not shorter periods (e.g. over hours to days, the time frame of daily fluctuations). In
addition, in wild caught harbour seals, blubber cortisol concentrations were shown not to be
significantly affected by capture time, and thus were likely not driven by a stress response to
the capture event, but were indicative of longer term physiological changes (Kershaw and Hall,
2016). In bottlenose dolphins however, blubber cortisol was found to qualitatively reflect
circulating cortisol concentrations after oral administration of hydrocortisone (Champagne et
al., 2017). As a result, there remains some disagreement of the interpretation of cortisol
concentrations in this tissue as an indicator of a shorter term stress response (Champagne et al.,
2018), or a longer term indicator of overall physiological state, uncoupled from short term
fluctuations in the circulating concentrations of the hormone.
While the turnover of cortisol in the blubber of marine mammals remains unknown, steroids
are known to diffuse passively from the blood into human adipose tissue (Deslypere et al.,
1985), but the turnover in adipose tissue is slow (Hughes et al., 2010). Here, there was no
relationship between blubber lipid content and cortisol concentration in the balaenopterid
samples, suggesting that the presence of cortisol in the tissue is not just a function of the
lipophilic nature of the hormone. Blubber cortisol concentrations thus probably provide

Chapter 4 : Blubber Cortisol Concentrations
81
information on both the stress response of an individual, and a physiological response to
energetic requirements, but these are most likely over longer term time scales than those
apparent in circulation. As the blubber of shallow diving cetaceans has been shown to be more
highly vascularised than the adipose tissue typical of terrestrial species (McClelland et al.,
2012), a greater perfusion of the tissue could result in the high concentrations of cortisol
measured in both species groups here, but it is still unknown to what extent steroid hormones
are in dynamic equilibrium between the blubber and the circulatory system. As such, further
work is urgently needed to establish the relationships between hormone levels in different
tissues and excreta, how these concentrations relate to each other, and what this means in terms
of the physiology of the animal, the stimulation of the HPA axis and the overall impact on the
individual.
Localised Cortisol Production?
Adipose tissue in mammals is known to be a major site for the metabolism of glucocorticoids
and other steroids as it has been shown to express a range of enzymes involved in the activation,
interconversion and inactivation of both the steroid sex hormones, and the glucocorticoids
(Bélanger et al., 2002; Meseguer et al., 2002; Seckl and Walker, 2001; Stulnig and Waldhäusl,
2004). The metabolism of glucocorticoids in adipose tissue is thought to be mediated primarily
by one enzyme, 11β-hydroxysteroid dehydrogenase type 1 (11 β-HSD1), which catalyses the
conversion of hormonally inactive precursors (cortisone and dehydroxycorticosterone) to their
hormonally active metabolites (cortisol and corticosterone) (Seckl and Walker, 2001; Stimson
et al., 2009; Stulnig and Waldhäusl, 2004). Therefore, in terrestrial mammals, as well as its
release following the activation of the HPA axis, cortisol is also produced within the adipose
tissue and the liver from its inert precursor, cortisone. However, while 11 β-HSD1 amplifies
local concentrations of glucocorticoids in the adipose tissue, it does not contribute significantly
to systemic glucocorticoid concentrations, as has been shown with transgenic mice (Masuzaki
et al., 2001). Specifically, overexpression of 11 β-HSD1 in the adipocytes of transgenic mice
results in normal serum concentrations of glucocorticoids and normal HPA axis function, but
highly elevated levels of glucocorticoids locally in adipose tissue (Masuzaki et al., 2001).
In vitro studies have recently shown that bottlenose dolphin blubber microsomes exhibit the
ability to metabolize cortisol to cortisone, and potentially the reverse reaction as well, cortisone
to cortisol, presumably through the activity of 11βHSD (Galligan et al., 2018). As such, the
blubber may act as an important site for both the metabolism and production of glucocorticoids,
and it is possible that blubber could act as an independent endocrine organ, and is not merely
a storage tissue reflective of the past or present circulating concentrations of glucocorticoid
hormones. While it is unknown how much of the cortisol pool in cetacean blubber may be
derived from local production, the cortisol concentrations measured in the blubber here likely
reflect a combination of both circulating concentrations of this hormone through passive
diffusion from the blood, and the local production of the hormone in the tissue itself. For these
reasons, care should therefore be taken when interpreting glucocorticoid hormone levels in
blubber biopsies and associating them with a response to chronic stress until the metabolic
activities of blubber are better understood (Galligan et al., 2018).

Chapter 4 : Blubber Cortisol Concentrations
82
Blubber cortisol concentrations should therefore be interpreted with the multi-functional roles
of cortisol in the regulation of the distribution of fat deposits, adipogenesis and adipose
metabolic and endocrine function in mind (Lee et al., 2014), rather than as a passive hormonal
store with no metabolic effect on the tissue itself. Given the mass of adipose tissue as blubber
in marine mammals, it is possible that the relative contribution of the blubber to an individual’s
steroid hormone metabolism is quite significant, and the endocrinological functions of blubber
in terms of glucocorticoid metabolism should thus be further investigated. Efforts to extract
and quantify cortisol’s inactive precursor, cortisone, from the tissue, and investigate the
equilibrium between the two should be prioritised. Attempts were made to measure cortisone
concentrations in the blubber extracts using a commercially available ELISA but the results
were not successfully reproducible here. The enzyme activity of 11 β-HSD1 during periods of
fasting and feeding in these species would help us to understand how much of the cortisol
within the blubber tissue originates from the adipocytes themselves during energetically
demanding periods.
Conclusions
While very little is known about how cortisol may be produced, stored and mobilised in marine
mammal blubber, and at what rates, the evidence of involvement in the regulation of
physiological state and its presence in adipose tissue, make it a good candidate biomarker of
condition worth investigation in cetaceans. Determining the dynamics of blubber cortisol
throughout the life cycle of these species would be a key step towards understanding the
endocrine control of energy regulation in marine mammals. Of key importance now is a better
understanding of species specific concentrations in order to establish a baseline library of
endocrine information for comparison with future studies. If these results showing a negative
correlation between blubber cortisol concentrations and morphometric indices of body
condition persist across other cetacean species, the analysis of cortisol concentrations in
remotely obtained blubber biopsies, the metabolic site of action of this hormone, has the
potential to be a valuable tool for studying physiology and body condition particularly in free-
ranging cetaceans. More generally, given the importance of cortisol in the regulation of
lipolysis, concentrations in the adipose tissue of other mammalian species for which
morphometric measurements cannot be obtained could also be of use as an informative
indicator of the metabolic state of the tissue and whether the animal is likely to be laying down
or mobilising fat.

Chapter 5 : Endocrine Biomarkers in a Population of Humpback Whales
83
CHAPTER 5 : APPLYING ENCOCRINE
BIOMARKERS TO INVESTIGATE VARIATION
IN REPRODUCTION AND BODY CONDITION IN
A NORTH ATLANTIC POPULATION OF
HUMPBACK WHALES (MEGAPTERA
NOVAEANGLIAE)
I collected the aerial photogrammetry video footage of humpback whales using a Phantom 4
UAV. Images were extracted from the video footage and processed for the calculation of the
Length Standardised Surface Area Index by Charlotte Bellot and Professor Patrick Miller.
These data were used for Charlotte Bellot’s MPhil Thesis in 2018, and are also presented
here.

Chapter 5 : Endocrine Biomarkers in a Population of Humpback Whales
84
1. ABSTRACT
The Gulf of St Lawrence, Quebec, Canada, is a major summer feeding area for humpback
whales (Megaptera novaeangliae) and other baleen whales in the North Atlantic. Annual
surveys conducted by the Mingan Island Cetacean Study during the summer since the 1980s
have resulted in a well-established catalogue of photo-identified individuals and an extensive
archive of tissue samples. Blubber biopsy samples (n = 185) collected from female humpback
whales between 2004 and 2017 were analysed to investigate variation in annual reproductive
and physiological state through the quantification of progesterone and cortisol concentrations,
respectively. Annual pregnancy rates varied from 0% to 33%, which were lower than
previously published for other humpback whale populations, but are in-keeping with the low
calving rates seen in this population. In addition, unlike for other populations, there was no
evidence for annual reproduction in either the blubber progesterone data or sightings data.
These low pregnancy rates could be an artefact of the small number of mature females sampled
every year, or they could indicate a low fecundity rate leading to slow population growth.
Blubber cortisol concentrations were not correlated with total disturbance time, used as a proxy
for an acute stress response to the research vessel. Blubber cortisol concentrations are therefore
thought to reflect variation as a result of changes in physiological condition and metabolic state
rather than an acute stress response. Linear mixed model selection showed that cortisol
concentrations varied across sampling years, and there was a negative relationship with
pregnancy rates. Overall, as cortisol concentrations decreased from year to year, the proportion
of pregnant females increased, and vice versa. There was no change in blubber cortisol
concentrations across the feeding season. The expected seasonal variation was probably
masked by individual variation. Cortisol concentrations did not vary by reproductive state
(pregnant, lactating, resting, immature), but there was some evidence that juveniles and calves
had higher measured concentrations than adults. This is thought to be a result of these two age
classes mobilising their energy reserves for growth and development rather than laying down
fat reserves. Finally, for a subset of females and males, cortisol concentrations were positively,
but not significantly, correlated with a morphometric body condition index, the Length
Standardised Surface Area Index (LSSAI), calculated from photogrammetry aerial images
collected using an unmanned aerial vehicle (UAV). Overall, linear model selection showed that
LSSAI varied between the sexes, with males having larger fat stores than females. The LSSAI
also varied between reproductive classes with lactating females in the poorest body condition
and pregnant females in the best condition. When combined with endocrine profiling to
determine reproductive status, aerial photogrammetry could be a valuable tool to measure
population health. A better understanding of baleen whale body condition and its link to
reproductive status and success is fundamental to appreciate how populations recovering from
over exploitation though whaling will be affected by changing environments in the coming
decades.

Chapter 5 : Endocrine Biomarkers in a Population of Humpback Whales
85
2. INTRODUCTION
The Gulf of St Lawrence, off the east coast of Canada, is a major feeding area for humpback
whales (Megaptera novaeangliae) and other baleen whales in the North Atlantic. Humpback
whales are top marine predators, and the population that feeds in the Gulf shows strong site
fidelity to this summer feeding area (Ramp et al., 2010a). The Mingan Island Cetacean Study
has been conducting annual surveys of parts of the Gulf during the summer feeding season
since the 1980s, which has resulted in a well-established catalogue of photo-identified
individuals and an extensive archive of tissue samples. The retrospective analysis of these long-
term data sets has enabled the investigation of patterns in persistent organic pollutant
concentrations (Metcalfe et al., 2004), habitat use and distribution (Doniol-Valcroze et al.,
2007), sex specific survival (Ramp et al., 2010a) and social structure (Ramp et al., 2010b).
Long term datasets of photo-identified individuals allow for population monitoring over time,
which is particularly valuable as we aim to assess the potential impacts of anthropogenically
altered habitats. For example, analysis of the temporal variation in the occurrence of humpback
whales and fin whales in the Gulf has shown an approximate 2-week difference in their arrival
between 1984 and 2010 (Ramp et al., 2015). This difference was strongly related to earlier ice
break-up in the Gulf as a result of rising sea surface temperature, which likely triggers earlier
primary production (Ramp et al., 2015). The observed changes in phenology in response to
ocean warming are a remarkable example of the behavioural plasticity of these species (Ramp
et al., 2015), but whether the observed rate of change in timing is maintained, and how this
change will affect the health of the populations are unknown.
In addition to long term survey effort and observational studies in this area, the collection of
biopsy samples between 1992 and 2010 has enabled studies on trophic niche partitioning within
the four species of rorqual whales in the Gulf (minke whales (Balaenoptera acutorostrata),
humpback whales, fin whales (Balaenoptera physalus) and blue whales (Balaenoptera
musculus)) (Gavrilchuck et al., 2014) following the collapse of the several commercial
groundfish populations in the early 1990s (Hutchings and Myers, 1995; Myers et al., 1996).
There has been an increase in feeding on higher trophic-level prey, such as small pelagic fish,
particularly for humpback and fin whales since the collapse of the groundfish populations
(Gavrilchuck et al., 2014). This work provides evidence for differential resource use following
ecosystem change in this area, further demonstrating the behavioural plasticity of these species.
However, how these changes in diet may affect population health and thus vital rates are
unknown. The next step to contribute to a better understanding of this apparent population
resilience to environmental change is to use inter-disciplinary, newly developed methods to
investigate variation in reproduction and body condition that can have population-level effects
by affecting fecundity and survival.
Knowledge of population pregnancy rates and calving rates provides information on both
population health and potential for growth. Historically, the pregnancy status of cetaceans was
assessed by examining carcasses taken in commercial whale hunts (Chittleborough, 1965).
More recently, endocrinological techniques have shown that blubber progesterone
concentrations are indicative of pregnancy in both mysticetes (Kellar et al., 2013; Mansour et

Chapter 5 : Endocrine Biomarkers in a Population of Humpback Whales
86
al., 2002) and odontocetes (Kellar et al., 2006; Perez et al., 2011; Trego et al., 2013).
Progesterone is a lipophilic steroid hormone that is produced by the corpus luteum, and is the
primary regulator of oestrous cycling and pregnancy in mammals (Pineda, 2003). Its lipophilic
properties mean that increases in circulating concentrations are measurable in the blubber.
Pregnancy was confirmed in these studies by physical examination of the stranded carcasses
and recording the number of corpora, corpus lutea and size and/or length of the foetus, if
present.
The collection and analysis of blubber biopsy samples is therefore a readily obtainable and
non-lethal way of assigning pregnancy in free-ranging cetaceans, and has been applied to free-
ranging bottlenose dolphins (Tursiops truncatus) (Perez et al., 2011), long-finned pilot whales
(Globicephala melas) (Perez et al., 2011) and humpback whales (Clark et al., 2016; Pallin et
al., 2018a; Pallin et al., 2018b). From these previous studies, it appears that there may be
species-specific blubber progesterone concentration thresholds that are indicative of
pregnancy. Each investigation therefore requires progesterone threshold validation for the
sample processing and hormone quantification methods employed.
Comparison of trends in body condition between different reproductive classes (pregnant,
resting and immature females) can provide valuable insights into relative rates of energy
acquisition and expenditure, and how these may affect the reproductive cycle. As previously
discussed in Chapter 3, blubber cortisol concentrations could be used as a marker of overall
physiological state in cetaceans. However, there is evidence that blubber cortisol
concentrations in bottlenose dolphins are correlated with circulating concentrations after oral
administration of hydrocortisone to simulate an artificial stress response (Champagne et al.,
2017). As such, it was suggested that blubber samples from remote sampling may be useful to
detect stress loads in this species (Champagne et al., 2017). If this is the case in larger cetaceans
as well, the interactions of whales with the research vessels that follow and approach them for
biopsy sampling could result in a stress response that is detectable in the blubber sample
collected. This potential stress response would be similar to that seen when animal handling
cannot be avoided for the collection of physiological samples from wildlife. Increases in
circulating cortisol concentrations are characteristic of a stress response to such handling and
physical restraint procedures in pinnipeds (Champagne et al., 2012; Engelhard et al., 2002;
Harcourt et al., 2010) and in small cetaceans (Schwacke et al., 2014; Champagne et al., 2018).
It is therefore very important to appreciate if the magnitude and duration of this potential stress
response to the research vessels may compromise the specific aims of the study by masking
any underlying variation in hormone concentrations. This issue was addressed for the first time
here in baleen whales by recording the total duration of the research vessel’s interaction with a
subset of the sampled individuals. The relationship between the duration of the interaction and
the cortisol concentrations measured in the blubber was investigated.
As well as using endocrine profiling to estimate the physiological state of individuals,
morphometric measurements are valuable for body condition estimates. Due to the challenge
of obtaining direct morphometric measurements in free-ranging cetaceans, the use of
photographic images to make these measurements, a process called photogrammetry, has
become increasingly popular. Photogrammetry techniques employed to date include laser

Chapter 5 : Endocrine Biomarkers in a Population of Humpback Whales
87
photogrammetry, which only captures part of the animal’s body (Durban and Parsons, 2006),
stereo-photogrammetry, which uses known morphological dimensions of the species to
determine unknown dimensions by scaling (Bräger and Chong, 1999), and under-water
videography, which is limited by clarity of the water and close approaches of cetaceans to
swimmers (Spitz et al., 2000). Aerial photogrammetry studies have previously used fixed-
winged aircraft or helicopters to obtain full body aerial images of individuals (Miller et al.,
2012a; Perryman and Lynn, 2002), and increasingly now use unmanned aerial vehicles (UAVs)
to obtain images. The use of UAVs has made these techniques much more accessible (Durban
et al., 2015; Durban et al., 2016).
To date, however, only a handful of studies using UAVs have obtained data at a high enough
resolution and with sufficient sample sizes to link morphometric measurements to body
condition. Specifically, changes in the body condition of four reproductive classes of
humpback whales across a breeding season were investigated to infer the relative energetic cost
that each class faces over this period (Christiansen et al., 2016). In another study of baleen
whales on their breeding grounds, photogrammetric measurements were used to determine the
relationship between calf growth rate and maternal rate of energy store loss in Southern right
whales (Eubalaena australis) using repeated measurements of body volume (Christiansen et
al., 2018). Most recently, changes in the body condition of endangered, southern resident killer
whales (Orcinus orca) were assessed using high-resolution images from UAVs to show a
decline in the body condition of mature females over a 5-year period (Fearnbach et al., 2018).
Thus, by combining long-term information of known individuals with new and accessible UAV
technology, these studies can provide data on trends in body condition and the costs associated
with reproduction.
A dataset of archived blubber biopsy samples from female humpback whales collected by the
MICS is used to investigate: Firstly, variation in pregnancy rates over a 13-year time period.
Secondly, if blubber cortisol concentrations are related to a potential acute stress response as a
result of interactions with the research vessel. Thirdly, the relationship between reproductive
state and blubber cortisol concentrations as an indicator of physiological state over time.
Fourthly, how blubber cortisol concentrations are related to photogrammetric measures of body
condition obtained using images collected by a UAV. By combining new methods in endocrine
profiling and aerial photogrammetry, we can start to measure the health of individuals and
develop tools for integration into long term monitoring protocols of populations.

Chapter 5 : Endocrine Biomarkers in a Population of Humpback Whales
88
3. METHODS
3.1. Blubber Biopsy Sample Collection with Life History Data
3.1.1. Female Samples Collected by the MICS between 2004 and 2017
A long-term dataset of 185 remotely obtained, shallow, blubber biopsy samples was collected
from 114 female humpback whales between 2004 and 2017, excluding 2014, by the Mingan
Island Cetacean Study (MICS). Sampling occurred from May to October in the Gulf of St.
Lawrence, Quebec, Canada (Fig. 5.1). Biopsies were collected from rigid-hulled, inflatable
boats using a crossbow and arrow system with hollow-tipped, stainless-steel biopsy darts (40
mm in length and 8 mm in diameter) (Gavrilchuck et al., 2014) from the dorsal and flank areas
of the individuals. Samples were stored either in aluminium foil, plastic vials, or glass vials on
ice immediately after collection, and were subsequently frozen at −20°C until analysed. The
sex of these individuals was determined through genetic analysis of the skin (Palsbøll et al.,
1992).
Annual surveys of humpback whales in the Gulf of St Lawrence (Fig. 5.1) by the MICS since
1982 have generated a catalogue of 432 known individuals. Individuals were photo-identified
using natural markings, with particular emphasis on the pigmentation on the ventral face of the
fluke and the size and shape of the dorsal fin (Katona and Whitehead, 1981). Demographic
data were obtained for the sampled individuals using this catalogue and sightings database.
Detailed sightings histories of these individuals have been recorded throughout a season where
they are sighted multiple times in the area between May and October, and also between years.
Female humpbacks typically reach maturity at 4–5 years of age (Chittleborough, 1965), thus
to be conservative, individuals were considered as adults when they were sighted for the first
time with a calf, or they were known for at least 5 years (Ramp et al., 2010a). Individuals were
considered as juveniles when they were known for less than 5 years or if they were first sighted
as a calf, and their exact age was therefore known (Ramp et al., 2010a). Lactating females were
defined as large individuals that were accompanied consistently by a smaller one
(approximately 1/3 of its size) during an entire feeding season (Ramp et al., 2010a). Calves
were considered as these smaller individuals that were closely associated with the adult during
an entire season. Finally, confirmed pregnant females were defined as those that were seen in
the subsequent year with a calf.
3.1.2. Male and Female Samples with Accompanying Photogrammetry Data
A second set of 22 blubber biopsy samples from both males and females were obtained as a
collaborative project between the University of St Andrews and the MICS during the summer
field seasons of 2016 and 2017. These samples were collected as part of a study funded by the
Strategic Environmental Research and Development Program (SERDP) to investigate methods
of quantifying the body condition of free ranging cetaceans. The field protocol for this study
involved first tagging the animals with bio-loggers equipped with suction cups for attachment,
obtaining aerial footage for photogrammetric analyses of body size using unmanned aerial
vehicles (UAVs), and finally, taking biopsy samples as described above. Where samples were

Chapter 5 : Endocrine Biomarkers in a Population of Humpback Whales
89
taken from unknown animals, these were also sexed though genetic analysis of the skin. The
samples from females were also included in the larger, long-term dataset described above.
3.2. Blubber Endocrine Profiling
3.2.1. Cortisol and Progesterone Extraction
The same steroid extraction protocol developed by Kellar and colleagues (2006), and
previously described in Chapter 3, was used to simultaneously extract cortisol and progesterone
from the biopsy samples. Hormones were either extracted from the whole sample, or where
tissue mass was great enough, longitudinal sub-samples of the biopsies were used for analysis.
Fig. 5.1. Map of the Gulf of St Lawrence study area adapted from the Department of
Fisheries and Oceans Canada website (http://www.dfo-mpo.gc.ca). The first main study area
stretches along the northern shore of the Gulf between Pointe-des-Monts and Pointe-Parent,
with particular focus on the area between Mingan and Anticosti Island. This study area is known
as ‘Mingan’. The second main study area is along the Gaspé penninsula from Percé to Grande-
Vallée. This study area is known as ‘Gaspé’. The whole of the Gulf is an important summer
foraging ground for baleen whales in the North Atlantic.

Chapter 5 : Endocrine Biomarkers in a Population of Humpback Whales
90
3.2.2. Cortisol and Progesterone Quantification
Cortisol: Cortisol concentrations were determined using the same commercially available
ELISA kit (DRG International Inc., Marburg, Germany: Cortisol ELISA EIA-1887), as
described and validated in Chapter 3. Cortisol concentrations are expressed as ng/g of wet
tissue. This kit has been used to quantify cortisol concentrations in blubber biopsies from
harbour seals (Kershaw and Hall, 2016). Extracts of varying concentrations (n = 18), were used
to calculate inter-assay and intra-assay coefficients of variation (CVs). Mean percentage CVs
of <20% and <10% were set as the acceptable limits for inter-assay and intra-assay variability
respectively (Andreasson et al., 2015). The mean and inter-assay CV was 15.4% (with a range
of between 3.1% and 27.4%) and the mean intra-assay CV was 7.2% (with a range of between
0.1% and 14.7%), and were therefore below the acceptable limits of variation.
Progesterone: A commercially available ELISA (DRG International Inc. Progesterone ELISA
EIA-1561) was used for the quantification of progesterone in the biopsy sample extracts. The
concentrations were measured according to the ELISA kit instructions with a standard curve
ranging between 0 and 40ng/ml with a sensitivity of 0.045ng/ml. As with the cortisol
concentrations, the progesterone concentrations in the samples were determined using a 4
parameter log-logistic model based on the standard curve, and final concentrations expressed
as ng/g of wet tissue. All samples were assayed in duplicate and the mean hormone
concentration reported as progesterone per wet weight of the blubber sample in ng/g. Extracts
of varying concentrations were used to calculate inter-assay (n = 22) and intra-assay (n = 12)
CVs. The mean inter-assay CV was 14.7% (with a range between 0.2% and 25.5%), and the
mean intra-assay CV was 5.2% (with a range between 0.2% and 14.1%), and were therefore
below the acceptable limits of variation. This ELISA reports a 0.2% cross-reactivity with
corticosterone and < 0.02% cross-reactivity with cortisol.
3.2.3. Quality Assurance and Quality Control
Quality assurance and quality control tests were performed to validate the use of this cortisol
ELISA with cetacean blubber extracts in Chapter 3. Here, the same quality assurance and
quality control tests were performed to validate the use of this progesterone ELISA with
cetacean blubber extracts.
Parallelism Assays: Three biopsy extracts from females were pooled and serially diluted four
times using the 0 ng/ml standard provided by the ELISA kit. The resulting curve of the
detection metric (optical density of the sample read at 450nm) as a function of the dilution state
(1, ½, ¼, 1/8, 1/16) was then compared to the standard curve. As described in Chapter 3, two
linear regression models for dilution state against optical density were compared (ANCOVA
function in statistical package R, version 3.1.3, R Core Development Team, 2015) to assess
parallelism between the two curves. There were no significant differences between either
model (ANCOVA; F=0.81, p = 0.4). Therefore, we can conclude that the effect on optical
density with increasing sample dilutions is the same for the standard curve samples and the
blubber extracts, and that the regression lines are parallel (Fig. 5.2a). This ELISA is therefore
suitable for the quantification of humpback whale progesterone.

Chapter 5 : Endocrine Biomarkers in a Population of Humpback Whales
91
Matrix Effect Test: As the progesterone ELISA kit was designed for use with serum or plasma
samples, the compatibility of the kit with extracts resuspended in PBS was assessed. As
described in Chapter 3, equal volumes of each standard were spiked with PBS and assayed in
tandem with the unspiked standard curve. The known and the apparent concentrations in the
spiked samples should show a positive linear relationship with a slope of approximately 1.0
(Hunt et al., 2014). The matrix effect test was successful with a slope of 0.98 (a slope of
between 0.8-1.2 was considered acceptable). It was concluded that matrix effects are minimal
and this sample diluent is therefore compatible with the immunoassay (Fig. 5.2b).
Extraction Efficiency and Correction Factors: Given the similarities in structure and
physical properties of the steroid hormones, the same extraction efficiency values with
increasing sample mass calculated in Chapter 3 for cortisol were used for progesterone. In
addition, the effect of decreasing sample mass on inflated progesterone concentrations was
assumed to be the same as measured for cortisol in Chapter 3. Thus, the previously calculated
extraction efficiencies and sample mass correction factors were used to correct both the
measured cortisol and progesterone concentrations in each sample to give the final hormone
concentrations used for statistical analysis.
Fig. 5.2. a) Linearity assessment for the progesterone ELISA with humpback whale
blubber extracts. Serial dilutions of three pooled extracts for each species show parallelism
with the ELISA standard curve. b) Matrix Effect Test validation for the progesterone
ELISA kit with samples re-suspended in PBS. The linear regression lines for the expected
against the observed concentrations are shown for the expected 1:1 relationship and the
measured relationship from the assay results. The assay results show a positive linear
relationship with a slope of 0.98, thus confirming that PBS is an acceptable sample diluent
compatible with this ELISA kit.

Chapter 5 : Endocrine Biomarkers in a Population of Humpback Whales
92
3.2.4. Statistical Analysis
3.2.4.1. Blubber Progesterone Concentrations as an Indicator of Pregnancy Status
In the full sample set of 185 females, there were 14 confirmed pregnant individuals. A mixture
of immature females (known to be less than 5 years old) and calves (n = 31) were used as non-
pregnant controls. An additional set of nine biopsy samples from adult and immature males
collected as part of the 2016 - 2017 SERDP funded project were added to the 31 non-pregnant
controls. The progesterone concentrations measured in these 40 control samples are shown in
Fig. 5.3a. Using these two datasets of progesterone concentrations from individuals of known
pregnancy status, an empirical cumulative distribution function (ECDF) modelling approach
was used to estimate empirical probabilities (proportion of observations) that a certain
measured progesterone value is above or below those of the confirmed pregnant or non-
pregnant animals.
An ECDF is a probability model. It is a non-parametric estimator of the underlying cumulative
distribution function of a random variable, x (blubber progesterone concentration here). It
assigns a probability of 1/n (where n is the sample size) to each data point, orders the data from
smallest to largest in value, and calculates the sum of the assigned probabilities up to and
including each data point (Fig. 5.3b). The ECDF can then give the fraction of sample
observations less than or equal to a particular value of x. Here, two ECDFs were modelled for
the progesterone concentrations in the confirmed pregnant and non-pregnant animals. A
probability of being pregnant and non-pregnant was then assigned to all of the unknown
animals using the stat_ecdf function in the ggplot2 package in R. If the probability of being
pregnant was > 0.05, the individual was classified as pregnant, and if the probability of being
not-pregnant was > 0.05, the individual was classified as not pregnant. If any individuals were
assigned an intermediate probability of either being pregnant or not pregnant, these animals
were classified as ‘inconclusive’.

Chapter 5 : Endocrine Biomarkers in a Population of Humpback Whales
93
3.2.4.2. Blubber Cortisol and an Acute Stress Response
In order to investigate the possibility that the measured blubber cortisol concentrations are
reflective of an acute stress response to the approaches and interactions with the research
vessel, the total ‘disturbance time’ was recorded for whales that were biopsied in the 2016 and
2017 field seasons as part of the SERDP funded project (n = 27). The disturbance time was
taken as the time from when tagging approaches were started on either a group of animals or
an individual, to when the biopsy sample was taken (Fig. 5.4). This time ranged from between
just 16 minutes (an individual that was approached only for biopsy sampling as it had been
tagged on a previous day), to 4 hours and 48 minutes (an individual that was tagged, followed
for UAV photogrammetry footage and then biopsied on the same day). This time therefore
encompasses the entire duration of the potential stressor event from initial approach by the
research vessel to sampling, and is used as a proxy for the magnitude of the potential acute
stress response. If this stress response is captured in the blubber cortisol concentration
measurement, we would expect a positive correlation between disturbance time and cortisol
concentration.
Fig. 5.3. a) Histogram of blubber progesterone concentrations measured in 53
humpback whale biopsies of known reproductive status collected between 2004 and
2017. The concentrations measured in the confirmed pregnant females are shown in blue while
the confirmed non-pregnant individuals are shown in red. b) ECDF models for the pregnant
and non-pregnant animals built based on the progesterone concentrations shown in a).
These models were then used to assign a pregnancy status to the other females of unknown
reproductive status based on their blubber progesterone concentrations.

Chapter 5 : Endocrine Biomarkers in a Population of Humpback Whales
94
3.2.4.3. Blubber Cortisol Variation within the Population
The cortisol concentrations measured in all the humpback whale biopsies were modelled using
a linear mixed model (LMM) using individual as a random effect to take into account that
cortisol concentrations were measured in 38 of the 114 females multiple times (up to 5 for
some individuals) both within the same year and across different years. The cortisol
concentrations were normally distributed, so the data were not transformed. A LMM with a
Gaussian distribution and an ‘identity’ link function was fitted to the data using the lmer
function in the lme4 package in R (R version 3.4.3, 2017). A global model was generated
including the following explanatory variables: year, reproductive status (as determined though
blubber progesterone quantification: resting, pregnant, lactating, immature), age class (adult,
juvenile, calf), annual pregnancy rate (% of pregnant females of the total number of adult
females sampled), Julian day, an interaction between Julian day and reproductive status, study
area within the Gulf (Mingan or Gaspé) and time in storage (years between the sample being
collected and being analysed). An interaction between Julian day and reproductive status was
included in order to consider a potential changing relationship across the feeding season
between the reproductive classes.
As previously described, backwards model selection using the dredge function was used to
identify the variables that best explain the variation in hormone concentrations, and thus to
include in the final model based on the smallest AIC. Backwards model selection showed that
two models were of equal fit to the data as they showed an AIC within two units of each other.
This subset of models was then used for model averaging using the model.avg function in the
MuMIn package in R. Model averaging is used to average regression coefficients across
multiple models in order to capture the overall effects of the different variables (Banner and
Fig. 5.4. Typical time line for the total ‘disturbance time’ spent interacting with
humpback whales during fieldwork as part of the SERDP funded project in 2016 and
2017. This varied by individual depending on the weather conditions (suitable/ unsuitable for
flying the UAV) or their behaviour making them easier / harder to approach which shortened
or lengthened the total disturbance time.

Chapter 5 : Endocrine Biomarkers in a Population of Humpback Whales
95
Higgs, 2017). Model averaging is particularly useful when there is little to differentiate between
a set of candidate models, and avoids the justification of a single, final model. The relative
importance of each variable was calculated, which reflects both its prevalence in the candidate
set of models, and its influence on the likelihood of the model it was included in. The model-
averaged coefficients were calculated based on full averages, which sets the coefficients of
absent variables to zero, rather than excluding them from the average (conditional averages).
The full average ensures that the presence of variables does not bias the model-averaged
estimate away from zero. Interpretations of the averaged model coefficients were used to assess
the effects of each covariate.
3.3. Aerial Photogrammetry using an Unmanned Aerial Vehicle
3.3.1. Image Collection
To obtain overhead photogrammetry images of humpback whales, a DJI Phantom 4 UAV was
flown above the individuals in wind speeds of less than 15 km/hr and in sea conditions less
than Beaufort 3. The DJI Phantom 4 is fitted with bottom-side landing gear which was used as
handles for safe launch and recovery from the research vessel. It was flown using the DJI GO
App as the interface through an android tablet. By communicating with the controller, this
provides a live feed from the camera on-board the UAV, and details of its status and settings.
Video footage at a 4K resolution was recorded continuously when the UAV was airborne. This
ensured that the whole surfacing sequence of a whale was captured, and the ‘best’ position of
the whale at the surface when the body was fully extended could then be extracted.
The UAV flew at a target elevation of between 15 and 20m above the whales while the research
vessel followed the targeted individual or group of individuals at a slow speed of less than 5
knots, roughly 200m away so as to minimise disturbance. Target whales were carefully
observed throughout all UAV flights, and no response (startle, avoidance, trumpeting or
shallow diving) was observed during any of the flights. Typically, UAV flights were made
after a suction-cup tag had been deployed on a study animal, and that animal was the primary
target for imaging. Once the UAV was airborne, any animal in the same groups as the tagged,
target individual was also followed for imaging.

Chapter 5 : Endocrine Biomarkers in a Population of Humpback Whales
96
Table 5.1 - Total photogrammetry records with and without an accompanying biopsy.
*Unknown animals are adult animals where the sex was unknown so their reproductive status
could not be confirmed.
Sex / Reproductive Status Total Total Biopsy / Photogrammetry
Calf (males and females) 5 0
Immature (males and females) 3 3
Mature Males 5 5
Resting Females 9 7
Lactating Females 5 2
Pregnant Females 5 5
Unknown* 5 0
37 22
3.3.2. Calculation of the Length Standardised Surface Area Index
Video footage was edited using VLC media player 3.0.2. Only sequences of interest with
whales at or near the surface and clearly visible in the frame were retained for analysis. From
these sequences individual frames were extracted using a freely available software called Free
Video to JPG Converter 5.0.101.201. From the images extracted, the best quality frames were
selected using the following criteria: 1) The depth and the angle of the individual relative to
the UAV’s position meant that the full body was visible from directly above. 2) The posture of
the individual meant that the full dorsal surface was visible. 3) The elevation of the drone meant
that the whale made up most of the frame. 4) The brightness of the image meant that the outline
of the body was clearly visible. Examples of poor and good images are shown in Fig. 5.5.

Chapter 5 : Endocrine Biomarkers in a Population of Humpback Whales
97
Frames judged to be of usable quality to measure relative body dimensions were measured in
R studio (version 1.1.447, 2017), using image processing and analysis software protocols as
described by Christiansen and colleagues (2016), and modified for use here. Briefly, the
positions of the tip of the rostrum and the notch in the flukes are marked on the image, and this
is considered to be the total length of the whale in pixels. The software then automatically
calculates the body axis and creates lines perpendicular to the body axis, dividing the length
(from the rostrum tip to the fluke notch) into 20 equal sections (Fig. 5.6a). Then, the external
boundary of the whale is marked manually to create an outline of the whale’s body shape
enabling measurement of the width of the whale, in pixels, at different points (Fig. 5.6a). The
software used by Christiansen and colleagues (2016) was specifically modified to enable
detailed zoom to mark the edges of the whale. The outline measurements of each whale were
used to calculate a length-standardized surface area index (LSSAI). The length-standardized
surface area of each of the 20 sections of each whale’s body was calculated using the
trigonometric equation for the area of a trapezoid as:
Fig. 5.5. Examples of images extracted from the 4K video sequences recorded with the
DJI Phantom 4. In the left panel are unusable images. From top to bottom: curved posture
of the whale, the UAV is too high relative to the water’s surface, poor light conditions create
too much glare on the surface. In the right panel are images of sufficient quality to be used
for photogrammetry analysis.

Chapter 5 : Endocrine Biomarkers in a Population of Humpback Whales
98
𝑨 = (𝑩/𝑳 + 𝒃/𝑳) ∗ (𝒉
𝑳)/𝟐
Where A is surface area, B and b are the widths of the top and bottom of each trapezoid region
of the whale’s body in pixels, and h is the height of each trapezoid region in pixels (see blue
trapezoid example shown in Fig. 5.6a). To standardize the area by length, each dimension is
divided by total length of the whale (L), also in pixels. A was then summed over the regions
most likely to reflect changes in body condition of individual whales, identified as those in the
middle of the body that showed the most inter-individual variation (Fig. 5.6b). Specifically,
these were the body sections between lines 7 and 17, representing 10 body sections across the
middle of the body (Fig. 5.6b). These regions excluded the areas nearest the rostrum and flukes
that also varied but are not expected to vary as the animals deplete lipid stores, but are more
likely to change as growth occurs.
Fig. 5.6. a) Example image of a whale selected for analysis. Black dots mark the tip of the
rostrum and fluke notch representing total length. The software divides the whale into 20 equal
length sections shown as horizontal black lines. Each section of the whale’s body can then be
represented as a trapezoid for calculation of surface area (example shown in blue). b) Length-
standardized width measurements of different whales. Each whale is represented by a
different coloured line. The width measurements across the body demonstrate that the central
regions of the whales’ bodies show the highest inter-individual variability. These regions were
used for calculation of the LSSAI as a metric of body condition.

Chapter 5 : Endocrine Biomarkers in a Population of Humpback Whales
99
3.3.3. Statistical Analysis
Linear regression models were used to determine which factors best explained the variation in
the LSSAI. The LSSAI data showed a normal distribution. Covariates of interest to explain the
variation in the LSSAI data were: blubber cortisol concentration, Julian day, sex, reproductive
status (calves, immature males and females, resting females, pregnant females and lactating
females) and age class (adults and juveniles). A full model including all explanatory variables
was generated, and the stepAIC function in the MASS package was used for backward and
forward stepwise model selection by AIC by specifying direction = “both”. The final model
containing only the covariates that contributed to the explanation of the variation in the data
was the one with the smallest AIC of more than two points compared to the next best fitting
model. This model was chosen for further interpretation. Model validation tests were used to
identify potential violations of the assumptions of the linear regression model. Specifically,
scatter plots of residuals versus fitted values as well as the residuals against each explanatory
variable showed equal variances in the final model used for interpretation. Additionally,
normality of residuals was interpreted from a quantile–quantile plot which showed no deviation
from normality. Influential points and outliers were also assessed using leverage and Cook’s
distance, but no such values were identified. Finally, the gvlma function in the gvlma package
was used to perform a global validation that linear model assumptions had been met for the
model, thus confirming the applicability of this modelling approach.

Chapter 5 : Endocrine Biomarkers in a Population of Humpback Whales
100
4. RESULTS
4.1. Endocrine Profiling
4.1.1. Identifying Pregnant Females
Of the 185 biopsies from females, 15 were lactating, 14 were confirmed pregnant, an additional
18 were identified as pregnant based on measured progesterone concentrations, and 11 had
‘inconclusive’ progesterone concentrations, so their reproductive status was undetermined.
Non-pregnant females had an average blubber progesterone concentration of 2.77 ± 0.059 ng/g,
while pregnant females had an average blubber progesterone concentration of 21.3 ± 3.82 ng/g.
One lactating female had an ‘inconclusive’ progesterone concentration, so was classed as
lactating here. None of the other lactating females showed elevated progesterone
concentrations indicative that they were simultaneously lactating and pregnant. Over the 13-
year period, nine females were sampled twice in one season. These were four resting females,
two pregnant females, two juveniles and a calf. Progesterone concentrations extracted in the
duplicate samples from each of these females classified them into the same reproductive class
each time, thus giving confidence in the consistency of this method and these results.
4.1.2. Variation in Pregnancy Rates and Reproductive Success
The percentage of pregnant females in each year was calculated as the number of pregnant
females divided by the number of adult (and therefore reproductively mature) females also
sampled in that year. The percentage of pregnant females ranged from 0% in 2005 and 2011
Fig. 5.7. Blubber progesterone concentration by reproductive status. Pregnant females
had significantly higher blubber progesterone concentrations than the other reproductive
classes (ANOVA; df = 4, F = 28, p < 0.001), that were not significantly different from each
other.

Chapter 5 : Endocrine Biomarkers in a Population of Humpback Whales
101
up to 33% in 2008 and 2010 although sample sizes were small (between one and six pregnant
females across years) (Fig. 5.7). Based on the detailed sightings histories of individuals
recorded by the MICS, the percentage of successful pregnancies could be calculated for 2004,
2007 and 2016 because all pregnant females were re-sighted the following year either with or
without a calf. The percentage of successful pregnancies was calculated for these three years
as the number of pregnant females seen the following year with a calf, divided by the total
number of pregnant females, and ranged from 67% in 2016 to 100% in both 2004 and 2007
(Fig. 5.8).
4.1.3. Blubber Cortisol and the Acute Stress Response
Blubber cortisol concentrations were not significantly correlated with total disturbance time
measured for 27 individuals (linear regression model: F-statistic 1.49, Adjusted R2 = 0.02, p =
0.23) (Fig. 5.9). If a stress response is captured in the blubber cortisol concentration
measurement, we would expect a positive correlation between disturbance time and cortisol
concentration. We are confident that measured blubber cortisol concentrations in this species,
over this time period of approximately 5 hours, are not indicative of an acute stress response to
our approaches on the animals. In order to assess this potential acute stress response, cortisol
concentrations in another matrix should be measured.
Fig. 5.8. Variation in pregnancy rates between 2004 and 2017. The percentage of successful
pregnancies is indicated in white inside the bars for 2004, 2007 and 2016 as all pregnant
females were re-sighted in the following years. In 2005, 2011 and 2013, no pregnant females
were sampled. The total number of mature females sampled (n) is indicated for each year.

Chapter 5 : Endocrine Biomarkers in a Population of Humpback Whales
102
4.1.4. Blubber Cortisol Variation within a Population
There was considerable variation seen in cortisol concentrations ranging from 49.09ng/g to
237.79ng/g. LMM variable selection revealed that the two best fitting models, within two AIC
points of each other included combinations of year, age class and annual pregnancy rate as
important explanatory variables. Results from the model averaging of these two best-fitting
LMMs showed that year alone was individually statistically significant. Specifically, 2007 and
2017 showed significantly higher and lower cortisol concentrations compared to a number of
other years (2008, 2009, 2011, 2012, 2013 and 2015) (p values all < 0.01) (Fig. 5.10). Year
showed the highest relative variable importance with a value of 1.0 because it was included in
both of the models used for averaging. While age class was not individually significant (p value
> 0.05), and had a relative variable importance of 0.32, it’s inclusion in the model showed that
overall, calves and juveniles had higher blubber cortisol concentrations than adults.
Annual pregnancy rate had a relative variable importance of 0.50 but, as with age class, was
not individually significant (p value > 0.05). Model averaging results showed that there was an
overall negative relationship between annual pregnancy rate and blubber cortisol
concentrations. Higher pregnancy rates were seen in years with lower measured cortisol
concentrations. Qualitatively, of the 12 consecutive year comparisons, this relationship
between higher cortisol concentrations and lower pregnancy rates was consistent for eight of
them. For example, between 2007 and 2008, and 2011 and 2012, there was an overall decrease
in cortisol concentrations with an increase in pregnancy rate (Fig. 5.10). Conversely, between
Fig. 5.9. Blubber cortisol concentrations are not correlated with the disturbance time by
the research vessel. The disturbance time was recorded for 27 whales that were both tagged
and biopsy sampled during the summer field seasons in 2016 and 2017. Individuals are
coloured by reproductive state.

Chapter 5 : Endocrine Biomarkers in a Population of Humpback Whales
103
2010 and 2011 there was an increase in cortisol concentrations and a decrease in pregnancy
rate (Fig. 5.10). Pregnancy rate the year after the samples were taken was not retained as an
important explanatory variable following model selection, indicating that there doesn’t appear
to be a time lag in the correlation.
Reproductive state (immature, resting, pregnant, lactating) was not retained following variable
selection, so the variability in the cortisol concentrations therefore appears to be explained
more by differences between the age classes. In addition, Julian day was not retained as an
important explanatory variable either. Individual variation appears to mask any variation linked
to changes over the May – October feeding season. Of the nine females that were sampled
twice within a season, the average difference in cortisol concentrations measured in the samples
was +14.0% of the first sample extracted, with a difference range of between -21.9% and
+66.5%. Therefore, for these nine females that were sampled longitudinally, it appears that
there was an overall increase in blubber cortisol concentrations measured over the feeding
season. Importantly, storage time was not retained following variable selection so,
measurement artefacts as a result of sample degradation through prolonged freezing do not
appear to be a problem here.
Fig. 5.10. Annual variation in blubber cortisol concentrations and pregnancy rates.
Blubber cortisol concentrations are shown using the boxplots that indicate the median, inter-
quartile ranges and outliers. Years that showed significant differences in measured
concentrations compared to other years are indicated by the red asterisks. Variation in the
percentage of pregnant females across years is shown by the blue line.

Chapter 5 : Endocrine Biomarkers in a Population of Humpback Whales
104
4.2. Aerial Photogrammetry
Stepwise model selection showed that the best fitting model included sex, reproductive status
and blubber cortisol concentration as important explanatory variables (ΔAIC 3.1 to the next
best fitting model), although no relationships were individually significant (p values all > 0.05).
Overall, males had a larger LSSAI than females and there was a weak positive relationship
with blubber cortisol. Pregnant females had the largest LSSAI while lactating females had the
smallest, but there was considerable overlap between all reproductive classes (Fig. 5.11). As
no calves were biopsied, their relationship between LSSAI and cortisol concentration could not
be assessed. Julian day was not included in the final model likely because of the 37 LSSAI
measurements, 32 of them were from individuals imaged in the early part of the feeding season,
in June and July, while only five of them were imaged in later in the feeding season, in
September. Age class was also excluded from the final model.
Fig. 5.11. Prediction plots for the final linear regression model for LSSAI:
lm(LSSAI~Cortisol+as.factor(Sex)+as.factor(Reproductive_State). The relationships are
shown by the solid lines with the associated 95% confidence intervals indicated by the dashed
lines. Overall, there was a weak positive correlation between LSSAI and blubber cortisol but
this was not significant, nor was the difference between males and females. There was some
variation in LSSAI by reproductive status, but differences between groups were not
significant.

Chapter 5 : Endocrine Biomarkers in a Population of Humpback Whales
105
5. DISCUSSION
Variation in Pregnancy Rates
The results of the progesterone extraction and quantification further support the use of this
method as a tool to identify pregnancy in humpback whales. Results showed previously
unobserved trends in pregnancy rates in this population over the 13-year period of this study.
However, the difference in blubber progesterone concentrations between pregnant and non-
pregnant females was smaller than in previously published studies on baleen whales (Clark et
al., 2016; Kellar et al., 2013; Mansour et al., 2002; Pallin et al., 2018a; Pallin et al., 2018b).
This resulted in the pregnancy status of some individuals being inconclusive. Serum
progesterone concentrations of bottlenose dolphins and killer whales (Orcinus orca) remain
high in the early and middle stages of pregnancy, then decline in the later stages shortly before
parturition (Bergfelt et al., 2011; Robeck et al., 2016). Similarly, progesterone concentrations
measured in the baleen of bowhead whales showed that concentrations remained stable
throughout pregnancy and then decreased at or near parturition (Hunt et al., 2014). While not
the same sampling matrix (serum or baleen), the general trend appears to be that circulating
concentrations of progesterone decrease towards the end of pregnancy. The exact timing of
calving is unknown for the Gulf of St Lawrence humpback whales. It is possible that lower
concentrations measured in the blubber of females later in the feeding season could be the result
of this decrease in concentrations at the end of gestation, and these females were therefore
classified as ‘inconclusive’ when they were in fact pregnant. More longitudinal sampling of
individual females across a season would provide a better understanding of changes in hormone
concentrations during pregnancy.
Alternatively, pseudopregnancies could have resulted in intermediate progesterone
concentrations. Pseudopregnancy occurs in many mammal species and is the process whereby
the longevity of the corpus luteum and the duration of elevated progesterone concentrations
are prolonged in the absence of fertilisation (Robeck and O’Brien, 2018). Captive studies on
false killer whales (Pseudorca crassidens) and Pacific white-sided dolphins (Lagenorhynchus
obliquidens), for example, have shown that they can exhibit elevated progesterone
concentrations during ovulation and for extended periods (up to 103 days for one individual,
for example) subsequent to ovulation (Atkinson et al., 1999; Robeck et al., 2009). While this
has been documented in captive cetaceans, the rate at which this anomaly might occur in wild
populations remains unknown (Pallin et al., 2018a) and therefore cannot be tested or controlled
for here.
The most conservative estimates of annual pregnancy rates are presented, and ranged from 0%
to 33% across different sampling years. These rates are very low compared to the pregnancy
rates previously published for other humpback whale populations. For example, variation in
pregnancy rates over a 6-year period between 2010 and 2016 for a population on its summer
feeding grounds around the Western Antarctic Peninsula were between 36% and 86% (n = 268)
(Pallin et al., 2018b). This population also showed significant increases in the proportion of
pregnant females from the start of the feeding season to the end, consistent with demographic

Chapter 5 : Endocrine Biomarkers in a Population of Humpback Whales
106
variation in migratory timing (Pallin et al., 2018b). Sample sizes of pregnant females were too
small here to assess variation across the feeding season in the Gulf of St Lawrence.
Estimated annual pregnancy rates of between 18.5% and 48.4% in 58 females feeding in
Monterey Bay, California, in 2010 and 2011 (Clark et al., 2016) were lower than in the
Antarctic, but higher than in the Gulf of St Lawrence. The pregnancy rates calculated here were
also lower than the estimated 37.2% generated by Chittleborough (1965) from whaling data.
While examination of the reproductive tracts of humpback whales killed during whaling
operations indicated an average ovulation rate of approximately once per year (Chittleborough,
1965), it is thought that on average, female humpback whales have a longer, 2–3 year
reproductive cycle (Steiger and Calambokidis, 2000). This cycle consists of a one year
gestation period, approximately one year for lactation and weaning and, for some whales, one
resting year before subsequent reproduction (Steiger and Calambokidis, 2000). In the recent
study of Antarctic peninsula humpback whales however, there was strong evidence of annual
reproduction as 54.5% of lactating females were also pregnant (Pallin et al., 2018b). These
high pregnancy rates combined with the prevalence of females that were both pregnant and
lactating were thought to be consistent with a growing population recovering from past
exploitation, and suggests favourable environmental conditions (Pallin et al., 2018b).
Consecutive year calving has also been documented using sightings data alone from photo-
identified humpback whales, but was observed at only 2% every year in the Gulf of Maine
population (Robbins, 2007). There was no evidence for annual reproduction in the Gulf of St
Lawrence humpbacks sampled here through either the blubber progesterone data or sightings
records.
Even with the 13-year dataset of samples used for analysis here, the sample sizes of
reproductively mature females every year was low. This is because the individuals often
targeted for sampling were unknown animals where the priority was to obtain a skin sample
for genetic sexing in order to add these individuals to the MICS catalogue of photo-identified
and sexed animals. Many of the samples were therefore from juveniles and calves. Had more
routine sampling been performed of known, sexually mature, adult females, the annual
pregnancy estimates may have been higher. This having been said, the low pregnancy rates
measured here are in keeping with the low numbers of calves sighted every year in the Gulf of
St Lawrence (Ramp, C. personal communication).
In order to understand whether the low calving rates in the population are as a result of the
apparent low pregnancy rates, foetal loss, perinatal mortality and / or calf mortality on the
breeding grounds or on migration, information on pregnancy success rates would be important.
Reproductive success rates (calculated here for only three of the study years because not all
pregnant females were re-sighted the following year) ranged from 67% to 100%. Reproductive
failure, defined as identified pregnancies failing to produce a calf, or failing to produce a calf
that survives long enough to be observed in the following feeding season, was estimated at
13.3% for the Gulf of Maine population (Pallin et al., 2018a). Such longitudinal studies of well-
known individuals with detailed sightings histories allow reproductive success to be
investigated over time.

Chapter 5 : Endocrine Biomarkers in a Population of Humpback Whales
107
Responses in the demography of baleen whales to climate change have already been
documented (Leaper et al., 2006; MacLeod, 2009), and long-term studies are invaluable for
such responses to be detected. Thus, while this population of humpback whales has shown
behavioural plasticity to cope with environmental changes (Gavrilchuck et al., 2014; Ramp et
al., 2015), the low pregnancy rates measured here could be evidence that this population does
not show as much resilience to change as previously thought, and population health could be
affected.
A meta-analysis of published humpback whale population growth rates suggests that, globally,
they are increasing, but growth rates in the Northern Hemisphere are predicted to be slower
than those in the Southern Hemisphere (Wedekin et al., 2017). To date, there are no published
growth rates for the Gulf of St Lawrence population specifically, but the most recent estimate
from another population in the North West Atlantic is an annual increase of 9.4% (SE = 0.01)
(Heide-Jørgensen et al., 2012). Moving forward, estimating population growth rates for the
Gulf of St Lawrence would help to determine if apparent low fecundity rates are counteracted
by high calf survival, for example, or if this population shows signs of reduced population
growth.
Measuring Acute Stress or an Integrative Physiological Marker?
Studying natural variation in glucocorticoid hormone concentrations in wild populations is
inherently very difficult because a stress response to the temporary tracking, approach, capture
and restraint necessary for sampling of many species may alter these physiological parameters
of interest (Ortiz and Worthy, 2000; Schwacke et al., 2014; St. Aubin et al., 2013). The
collection of biopsy samples from large cetaceans typically involves three stages: sighting the
individuals to be targeted, tracking the targets over multiple surfacings between dives, and final
close approaches (between 10 – 40m depending on the biopsy equipment to be used) for
sampling. These encounters with the research vessel could elicit a stress response in the target
animals. It is therefore very important to appreciate if the magnitude and duration of this
potential stress response to the interaction with the research vessel could compromise the
specific aims of different studies by masking any underlying variation in blubber cortisol
concentrations.
The relationship between the disturbance time, as a proxy for an acute stress response, and
blubber cortisol concentrations was assessed for the first time in a baleen whale. There was no
correlation between the two. Within the 5-hour time window measured here, the blubber is an
appropriate tissue to sample in order to investigate natural, physiological variation rather than
short term changes in circulating concentrations as a result of activation of the hypothalamic-
pituitary-adrenal (HPA) axis in response to an acute stressor. Currently, however, there is
conflicting evidence as to the rate at which circulating cortisol concentrations are taken up into
blubber.
Plasma cortisol concentrations in wild caught harbour seals were positively correlated with
capture time, suggesting that they were largely driven by a stress response to the capture event

Chapter 5 : Endocrine Biomarkers in a Population of Humpback Whales
108
(Kershaw and Hall, 2016). However, blubber cortisol concentrations taken at the same time
were shown not to be significantly affected (Kershaw and Hall, 2016). In a study on captive
bottlenose dolphins, individuals received oral hydrocortisone every six hours to elevate
circulating cortisol concentrations over a 5-day period (Champagne et al., 2017). There was an
initial increase in blubber cortisol concentrations between days 1 and 3. In four of the five
study animals, blubber cortisol concentrations then decreased from day 3 to day 5 despite
persistent elevations in serum cortisol concentrations (Champagne et al., 2017). There therefore
appears to be at least a partial de-coupling of circulating concentrations and blubber
concentrations in these two studies.
During a standardised ‘out of water’ stress test in captive bottlenose dolphins, blubber cortisol
concentrations increased significantly over the two-hour sampling period (Champagne et al.,
2018). Blubber concentrations were correlated with concentrations measured in simultaneously
collected serum samples (Champagne et al., 2018). However, these dolphins were stationed
out of the water on mats during the acute stress test to facilitate the simultaneous sampling of
both blood and blubber. This sampling protocol out of water is likely associated with significant
impacts on overall physiology because individuals experience the action of gravity on their
body mass as well as the thermoregulatory challenges of keeping cool in air. Peripheral
perfusion of the blubber is likely to have increased significantly in order to compensate for a
reduced ability by the dolphins to dissipate body heat. Circulating cortisol was therefore likely
more available for blubber uptake, so the extrapolation of these results to wild animals may not
be appropriate.
Uptake and turnover of cortisol by the blubber is most likely linked to the extent and rate of
perfusion of the tissue. Perfusion is mediated firstly by the microvasculature in the blubber and
secondly, by the blood flow through the vasculature. Microvasculature of mysticete blubber
has yet to be investigated, but odontocete blubber is more highly vascularised than porcine
adipose tissue (McClelland et al., 2012). This suggests that there is a possibility for the tissue
to be highly perfused. Differences in blood flow through this microvasculature as a result of
vasoconstriction and vasodilation will contribute to changes in blood flow through the tissue.
Thermal-imaging studies have shown that marine mammals are able to finely control and
dramatically alter blood flow to the skin in order to lose heat (Barbieri et al., 2010) and to
facilitate hair re-growth (Paterson et al., 2012). There will also be differences in blood flow
through the tissue as a result of cardiac output. When diving, the heart rate is dramatically
reduced in cetaceans, and then increases again during surface intervals (Williams et al., 2017;
Williams et al., 2015). Measured changes in blood flow through the blubber to the skin over
these time periods have yet to be published, but these periods of bradycardia and tachycardia
will likely result in changes in perfusion to the periphery. These perfusion patterns may be even
more pronounced in animals experiencing an acute stress response (Williams et al., 2017).
Immediately following release from net entanglement, narwhals (Monodon monoceros)
showed a more pronounced bradycardia compared to other dives (Williams et al., 2017). By
extension, a more pronounced bradycardia as a result of a fight or flight acute stress response
would result in a reduction of blood flow to the periphery, and therefore a reduced availability
of circulatory cortisol for uptake in the blubber.

Chapter 5 : Endocrine Biomarkers in a Population of Humpback Whales
109
The high variability in blubber cortisol concentrations among individuals was not surprising
because concentrations may be influenced by a number of factors that were not measured here.
These include, for example, changes in cortisol carrier protein concentrations that will affect
free hormone availability. Over 90% of circulating cortisol, in most mammals studied to date,
is bound to carrier proteins (e.g., corticosteroid-binding globulin and serum albumin), and it is
thought that only free, unbound, cortisol is incorporated into body tissues (for a review see
Breuner and Orchinik, 2002). In addition, recent evidence suggests that the conversion of
cortisol to cortisone occurs in the blubber, speculatively through the activity of the enzyme
11β-Hydroxysteroid dehydrogenase (11βHSD) (Galligan et al., 2018). The conversion of
cortisone to cortisol may occur as well (Galligan et al., 2018). These results provide preliminary
evidence that blubber tissue is able to metabolise steroid hormones, in keeping with what has
previously been described and recognised as an important function of adipose tissue in other
mammals (for a review see Ahima, 2006). Concentrations measured here are therefore likely
both circulatory in origin and from the blubber itself. In addition, as with blood sampling, these
measurements represent one cross sectional sample at a single point in time which may in itself
produce variable results depending on the metabolic state of the tissue at the time of sampling.
These complications therefore need to be considered before using tissue concentrations to
characterise central endocrine function as a result of HPA axis activation and the acute stress-
response alone.
Variation in Blubber Cortisol Concentrations
Glucocorticoid variability in cetacean populations has been associated with poor environmental
conditions and changes in prey availability (Ayres et al., 2012), anthropogenic disturbance
(Ayres et al., 2012; Rolland et al., 2012) and chronically contaminated environments (Fair et
al., 2017). Here, there was significant variation in blubber cortisol concentrations between
different sampling years. The highest concentrations were measured in 2007 and the lowest
concentrations measured in 2017. Inter-annual differences in blubber cortisol concentrations
explained most of the variability in the data, and could be indicative of annual variation in
environmental conditions that affected the foraging and therefore physiological state of
individuals. Lower concentrations may have been measured in more favourable years with
increased prey availability for example. An important next step for this work is to add time-
series environmental data to these results in order to investigate links with inter-annual
variation in ecosystem productivity.
Unexpectedly, the reproductive status of females was not retained following model selection.
Age class was retained, and showed that adults had lower blubber cortisol concentrations than
both calves and juveniles. It was hypothesised that the variation by reproductive status would
be more pronounced than variation by age class as lactating females undergo extreme lipolysis
to meet the energetic demands of lactation (Christiansen et al., 2016). Conversely, it was
hypothesised that pregnant females would have the lowest blubber cortisol concentrations. It
has been estimated that they must increase their body mass by up to 65% to meet the energetic
costs of reproduction for the following year (Lockyer, 1981), and would therefore be depositing
rather than mobilising fat stores to a greater extent than other reproductive classes. Specifically,

Chapter 5 : Endocrine Biomarkers in a Population of Humpback Whales
110
pregnant female baleen whales acquired an estimated extra 10–15% of fat reserves compared
to resting females over a feeding season (Lockyer, 1984). The lack of variation by reproductive
state but the inclusion of age class in the final model suggests that the variation in cortisol
concentrations is perhaps more strongly explained by the energetic demands of growth in
juveniles and calves. This is in keeping with the blubber cortisol results presented in Chapter
3 whereby higher cortisol concentrations were measured in juvenile harbour porpoises
compared to adults. This could be because humpback whale juveniles and calves are mobilising
rather than depositing energy reserves in order to maximise growth. This would, firstly, reduce
their surface area to volume ratio which will affect their thermoregulatory requirements in cold
water. Secondly, it would reduce their predation risk from killer whales. Thirdly, it would help
to achieve size at sexual maturity faster.
While not individually significant, annual pregnancy rate was retained in the final model.
Overall, years with higher cortisol concentrations showed a lower pregnancy rate, and this
relationship was consistent when the majority of consecutive sampling years were compared.
Qualitatively, an increase in cortisol concentrations from one year to the next led to a decrease
in the pregnancy rate, and a decrease in cortisol concentrations correlated with an increase in
pregnancy rate. Interestingly, there was no such correlation between the pregnancy rates and
blubber cortisol concentrations in the previous year, suggesting that there does not appear to
be a time-lag between the two.
Embryonic/foetal resorption or early termination of pregnancy during periods of stress,
including disease and nutritional stress, for example, occurs in a number of mammals
(Conaway et al., 1960; Huck et al., 1988). This foetal resorption may be an adaptive mechanism
in response to poor environmental conditions. Such a mechanism has not been directly
documented in baleen whales, but, female right whales (Eubalaena australis) (Seyboth et al.,
2016) and killer whales (Ward et al., 2009) have been shown to not become pregnant in years
of low food availability. Reduced reproductive success has also been shown in fin whales in
response to a reduction in prey abundance (Williams et al., 2013). So, if such a foetal
reabsorption mechanism does occur, it could allow pregnant female humpback whales to
respond to unpredictable environmental conditions on the feeding grounds. This would allow
them to maximise reproductive success in years when foraging conditions were favourable and
only experience the minimal costs associated with the early stages of pregnancy in poorer years.
This process could explain the link between annual pregnancy rates and blubber cortisol
concentrations if high blubber cortisol concentrations measured on the feeding grounds are
indicative of generally reduced foraging success, and therefore poorer environmental
conditions.
There was no variation by Julian day, which was also unexpected as individuals sampled at the
beginning of the feeding season were hypothesised to have higher cortisol concentrations than
those at the end of the season as a result of increased lipogenesis. It appears that the expected
seasonal variation was masked by individual variation, possibly as a result of the cross sectional
nature of the sampling, as discussed above. The lack of any seasonal relationship could be the
result of different timings of the migration of individuals which affects how long they have
been fasting or foraging for. Demographic segregation of migration was observed for

Chapter 5 : Endocrine Biomarkers in a Population of Humpback Whales
111
humpback whales during the whaling era (Chittleborough, 1965), and it is possible that
individual differences determine migratory timing as well. For example, the individuals
sampled later in the season could in fact be animals that are ‘left behind’ if they have not
accumulated enough fat reserves and will therefore not migrate. Non-pregnant females and
juveniles specifically may benefit from staying in feeding areas for extended periods of time.
They may possibly overwinter there in order to improve body condition in preparation for
another reproductive cycle. In addition, there is no way to determine when the individuals first
started foraging after the breeding season fast. For many of them, while their first sightings
within the study area covered by the MICS have been recorded for each year, there is no way
to know if, or for how long, they have been foraging in other areas of the Gulf. So, samples
taken at the ‘beginning’ and the ‘end’ of the feeding season here, do not necessarily represent
the ‘beginning’ or the ‘end’ of the season for all whales.
Using Aerial Photogrammetry and LSSAI
Morphometric data were obtained from images collected using a UAV. These were used to
calculate a condition index that aimed to capture the variation in width across the body of the
individuals. It was assumed that changes in width, and therefore girth of the animals, reflect
changes in body fat reserves. The flat dorsal surface area of the most variable parts of the body
was estimated for each individual, and used for the calculation of the Length Standardised
Surface Area Index (LSSAI). The LSSAI was calculated for a total of 37 animals of all different
sex, age and reproductive classes. Of these individuals, 21 were also biopsied and therefore
had matched blubber cortisol data for comparison. This was a comparatively small dataset
collected over the beginning of the feeding season, and no relationships were individually
significant but some trends in the data were seen following model selection. The pregnant
females were in the best body condition, with the largest LSSAIs, and lactating females in the
poorest, with the smallest LSSAIs, as would be expected. There was considerable overlap
suggesting that the variation in measurements within this small sample size was not enough to
clearly distinguish between reproductive classes. Overall, males had a larger LSSAI than
females which was unexpected as females are known to be larger in size than males (Clapham,
1996), but this suggests that males are able to deposit larger energy reserves.
There was no significant relationship between blubber cortisol concentrations and the LSSAI.
Individuals with larger energy reserves were expected to have lower cortisol concentrations, as
blubber cortisol concentrations were negatively correlated with morphometric indices of
condition in balaenopterids in Chapter 3. The positive, but non-significant, correlation seen
here could be a result of the small range in the LSSAI estimates between individuals compared
to the morphometric measurements taken from the stranded individuals in Chapter 3. Future
work should aim to also image and sample both males and females on the breeding grounds.
The greatest range in body condition estimates could be obtained for comparison. Depending
on the stage of gestation, the shape of females may also change. Changes in body shape
throughout pregnancy should not be confounded with changes in energy reserves. Longitudinal
images of pregnant females through the early, middle and late stages of gestation would help
to better take potential changes in body shape into account.

Chapter 5 : Endocrine Biomarkers in a Population of Humpback Whales
112
To overcome the challenge of obtaining direct morphometric measurements from free-ranging
cetaceans, the use of photogrammetry has become increasingly popular. Aerial
photogrammetry appears to be the most promising method of image analysis for cetaceans, and
has received the most attention with recent advances in UAV technology. Newly developed
UAV methods are particularly popular as information about allometric relationships are not
required. In addition, the full dorsal surface of the body can be imaged, and the high costs of
taking aerial photographs from fixed-winged aircrafts and helicopters have been removed. The
use of UAVs has thus made aerial photogrammetry techniques much more accessible. Different
morphometric measurements from UAV images of cetaceans have been collected from a
number of species (Christiansen et al., 2016; Christiansen et al., 2018; Durban et al., 2015;
Durban et al., 2016), and these body dimension estimates have also been used to assess body
condition (Christiansen et al., 2016; Christiansen et al., 2018; Fearnbach et al., 2018). It is
expected that with a larger sample size of individuals, especially between feeding and breeding
seasons, greater differences in body condition estimates would be observed with the LSSAI
method used here. When coupled with endocrine profiling to determine reproductive status,
this could be a valuable tool to measure individual and population health.
Conclusions and Future Directions
Our results demonstrate variation in hormone concentrations at a population level over time,
highlighting the importance of longitudinal studies and linking endocrine measures with
observational data. Pregnancy rates in this population appear to be very low, and targeted
sampling of known, adult females would help to improve these estimates and assess
reproductive success rates as well. There is evidence of inter-annual differences in measured
cortisol concentrations that correlate with the estimated pregnancy rates. The variability in the
cortisol concentrations suggests different physiological states in terms of animals either going
through lipolysis or lipogenesis, and therefore provides a ‘snap shot’ of tissue metabolism at
the time of sampling. Depending on how long the individuals have been on the feeding ground,
and how successful their foraging has been, their physiological state will likely change. The
addition of environmental data on primary productivity, prey abundance and sea ice extent, for
example, could be added to these results to better investigate the drivers of inter-annual changes
in cortisol concentrations and pregnancy rates. Taken together, the results of this study provide
preliminary results to improve our understanding of the reproductive biology and physiology
of humpback whales on their feeding grounds, which will assist monitoring, management and
conservation efforts in the future.
Compared with conventional aircraft, UAVs are less expensive and safer to operate, and can
be operated in more remote regions. This inexpensive and non-invasive approach provides a
valuable tool to monitor the health of cetacean populations because it is applicable across
different species and different habitats. Further work should prioritise how measurement errors
can be quantified and incorporated into analyses of body condition estimates. Further work in
this field should also prioritise the development of a standardised condition index for cetaceans
from morphometric data collected by UAV image analyses to allow for comparison with other
populations.

Chapter 6 : Blubber Proteome
113
CHAPTER 6: INVESTIGATING THE
PROTEOME OF CETACEAN BLUBBER TISSUE
Dr. Catherine Botting at the Biomedical Sciences Research Complex in the School of
Chemistry at the University of St Andrews performed the protein identification part of this
work using nanoflow Liquid Chromatography Electrospray Ionisation in tandem with Mass
Spectrometry.
The harbour porpoise data analysis and discussion part of this chapter has been published in
Conservation Physiology (2018).
Kershaw, J.L. Botting, C.H. Brownlow, A. Hall, A.J. 2018. Not just fat: investigating the
proteome of cetacean blubber tissue. Conservation Physiology. 6;1.

Chapter 6 : Blubber Proteome
114
1. ABSTRACT
Mammalian adipose tissue is increasingly being recognized as an endocrine organ involved in
the regulation of a number of metabolic processes and pathways. It responds to signals from
different hormone systems and the central nervous system, and expresses a variety of protein
factors with important paracrine and endocrine functions. This study presents a first step
towards the systematic analysis of the protein content of cetacean adipose tissue, the blubber,
in order to investigate the kinds of proteins present and their relative abundance. Full depth
blubber subsamples were collected from dead-stranded harbour porpoises (Phocoena
phocoena) (n = 21), and remotely obtained, shallow, biopsy samples were collected from live
minke whales (Balaenoptera acutorostrata) (n = 10) to assess the feasibility and reliability of
applying proteomic methods to different sample types across species. Three total protein
extraction methods were trialled. The highest total protein yields with the lowest extraction
variability were achieved using a RIPA cell lysis and extraction buffer based protocol.
Extracted proteins were separated using 1D Sodium Dodecyl Sulfate Polyacrylamide Gel
Electrophoresis (SDS-PAGE), and identified using nanoflow Liquid Chromatography
Electrospray Ionisation in tandem with Mass Spectrometry (nLC-ESI-MS/MS).
A wide range of proteins were identified across the two species (n = 409), and classed into ten
functional groups, the most abundant of which were involved in cell function and metabolism,
immune response and inflammation, and lipid metabolism. While a number of different
individual proteins were identified in the extracts from the two species, the overall patterns in
terms of the relative abundance of each functional group were very similar. These proteins
likely originate both from the various cell types within the blubber tissue itself, and from the
circulation. They therefore have the potential to capture information on the cellular and
physiological stresses experienced by individuals at the time of sampling. The importance of
this proteomic approach is two-fold: Firstly, it could help to assign novel functions to marine
mammal blubber in keeping with current understanding of the multi-functional role of adipose
tissue in other mammals. Secondly, it could lead to the development of a suite of biomarkers
to better monitor the physiological state and health of live individuals though remote blubber
biopsy sampling.

Chapter 6 : Blubber Proteome
115
2. INTRODUCTION
White adipose tissue, the predominant type of adipose tissue in most mammals, is made up of
adipocytes containing usually a single lipid droplet and a non-centrally located nucleus.
Adipose tissue provides an excess fat storage site in the form of triglycerides that are
metabolised depending on fluctuating energy requirements (Ahima and Flier, 2000). As well
as its importance as a highly metabolically active energy storage organ, adipose tissue in
mammals is increasingly being recognised as an endocrine organ in its own right through the
secretion of proteins that are actively involved in energy homeostasis and the regulation of
neuroendocrine, autonomic and immune functions (Ahima and Flier, 2000; Gimeno and
Klaman, 2005; Kershaw and Flier, 2004). To date, however, the potential role of blubber, as
the main white adipose tissue deposits in marine mammals, as an endocrine organ in terms of
contributing to whole body metabolism has yet to be explored.
As well as the fully differentiated adipocytes themselves, mammalian adipose tissue is made
up of numerous other cell types including fibroblasts, pre-adipocytes, macrophages and other
immune cells, endothelial cells and smooth muscle cells, connective tissue matrix, nerve tissue
and blood vessels (Frayn et al., 2003; Gimeno and Klaman, 2005). These components function
as a structured whole which is known to express and secrete a variety of bioactive peptides
which include proteins, metabolites and hormones, and are collectively known as adipokines
(Trayhurn and Wood, 2004). These can act at both a local and systemic level (Kershaw and
Flier, 2004; Trayhurn and Wood, 2004), and are derived from both adipocyte and non-
adipocyte fractions of the tissue (Gimeno and Klaman, 2005). Considerable metabolic
heterogeneity has been documented among various adipose deposits with the secretion of these
bioactive peptides that include the sex steroids (eg. androgens and estrogens), glucocorticoids
(e.g. cortisol and corticosterone), complement factors (e.g. adipsin and acylation-stimulating
protein), proinflammatory cytokines (e.g. tumor necrosis factor α and interleukin 6), growth
factors (e.g. transforming growth factor-β) and adipokine hormones (eg. leptin and
adiponectin). While most of these products act through paracrine or autocrine mechanisms in
the adipose tissue itself, others, such as leptin, are released into circulation and are capable of
influencing other target organs (Ahima and Flier, 2000).
In addition to these secreted signals, adipose tissue expresses numerous receptors that allow it
to respond to signals from a variety of hormone systems as well as the central nervous system.
Its functions are therefore regulated by multiple external influences, such as the rate of blood
flow into the tissue and thus the delivery of substrates and hormones in the plasma, autonomic
nervous system activity (Frayn et al., 2003), and localised signalling and feedback loops within
the tissue itself (Frühbeck et al., 2001). These networks of adipose tissue signalling pathways
enable the organism to adapt to a wide range of metabolic challenges including starvation,
stress, infection and periods of energy excess (Frühbeck et al., 2001). Through this network,
adipose tissue is integrally involved in coordinating a variety of biological processes including
the regulation of appetite and energy balance, immune system function, insulin sensitivity,
angiogenesis, inflammation and the acute-phase response, blood pressure, nutrient transport
and lipid metabolism, and haemostasis (Trayhurn and Wood, 2004).

Chapter 6 : Blubber Proteome
116
It is therefore now clear that adipose tissue is a complex and highly active metabolic and
endocrine organ with fat cells playing an active role in modulating their own metabolism
(Frühbeck et al., 2001; Kershaw and Flier, 2004; Trayhurn and Wood, 2004). The presence and
concentrations of certain proteins and their metabolites in the tissue as well as circulating
concentrations in the blood stream can therefore provide information on various processes and
metabolic challenges. For example, circulating concentrations of the adipokines leptin and
adiponectin, are positively and negatively correlated with adiposity respectively (for review
see (Gimeno and Klaman, 2005). More generally, protein screening and identification are
commonly used as diagnostic markers in medicine to detect disease and perturbations to
metabolic pathways (Steffen et al., 2016). Thus, both adipokines and other metabolic factors
within the tissue are of interest to understand whole tissue function, the regulation of whole
body metabolism and overall systemic health.
I aimed to investigate whether cetacean blubber could show equivalent pleiotropic functions to
the adipose tissue in terrestrial animals by starting to identify some of the main protein
components in the tissue. To achieve this, I had two main aims. Firstly, to reliably extract and
separate the protein components in cetacean blubber. Secondly, to identify these components
and link their presence to potential blubber functions. This process was split into three main
stages. Firstly, method development for the extraction and separation of total protein from
cetacean blubber tissue for the first time. Secondly, the identification of the extracted proteins
by mass spectrometric analysis of protein digests and searching against a protein database for
matches to homologous proteins from other vertebrate species. Thirdly, an investigation of
which types of proteins were present and most represented in the extracts to make inferences
about potential blubber functions and links to metabolic state.
Two cetacean species, the harbour porpoise (Phocoena phocoena) and the minke whale
(Balaenoptera acutorostrata) were studied. Full depth blubber samples from stranded harbour
porpoises were used for protein extraction method development, and to assess the range of
proteins present through the full blubber depth. Minke whale biopsy samples collected from
live animals were used to assess the applicability of this method to remotely obtained, shallow,
biopsy samples collected from different species. The separation and identification of proteins
in blubber tissue from different species are important steps in establishing a database of
baseline, identifiable proteins, and the subsequent use of various proteins as biomarkers of
health and condition in live animals with otherwise limited sampling opportunities.

Chapter 6 : Blubber Proteome
117
3. METHODS
3.1. Method Development and Optimisation
3.1.1. Sample Collection and Preparation
Full-depth skin, blubber, and underlying muscle samples were collected from dead harbour
porpoises by the Scottish Marine Animal Strandings Scheme (SMASS) between 2013 and
2015. Only freshly dead animals, specifically those that either stranded alive or had recently
died, and thus showed no evidence of bloating and decomposition, were used in order to
investigate blubber proteins that had not been subject to extensive degradation and metabolism
after death. Samples showed no evidence of trauma or bruising as blood in the tissue would
disproportionally represent proteins in circulation rather than proteins present in the blubber
matrix itself. Samples were collected from the dorsal area immediately caudal to the dorsal fin.
As previously described, this site was chosen as this area is typically sampled through remote
biopsy of free-ranging individuals and therefore has the most relevance for investigating the
potential use of these total protein extraction methods on samples collected from live animals.
A total of 24 samples were used from 21 individuals that were a mixture of both males (n = 10)
and females (n = 11), and adults (n = 12) and juveniles (n = 9). The cause of death was
determined following post-mortem examination to classify individuals as either acute or
chronic cases (as described in Chapter 1). For full details of the samples used for analysis see
Table 6.1.
Samples were collected and frozen in individual plastic vials at -200C prior to analysis. For the
total protein extraction, sub-samples were taken on ice while the tissue was still frozen, and
care was taken to remove all skin and muscle from the blubber. Full depth subsamples were
used for total protein extraction in order to investigate the proteins through all layers of the
tissue.
3.1.2. Total Protein Extraction Methods
Protein extraction from a tissue typically involves three stages: 1) tissue and cell disruption
through homogenisation 2) precipitation of the protein fraction of the homogenate into a pellet
form 3) re-suspension of the protein pellet into solution for quantification and downstream
applications.
In a comparative study of different detergent-free protein extraction protocols using these three
stages, the most suitable method for the extraction of white adipose tissue proteins from a wide
range of cellular and structural compartments was a de-lipidation protocol based on the Bligh
and Dyer method (1959) (Sajic et al., 2011). The optimal tissue and cell disruption part of the
protocol described by Sajic and colleagues was replicated here using blubber samples collected
from harbour porpoises. Then, two different protein precipitation methods were trialled. A
protein precipitation method using a methanol-chloroform solution adapted by Friedman and
colleagues (Friedman et al., 2009) for the recovery of proteins in dilute solution in the presence
of detergents and lipids (Wessel and Flügge, 1984), was trialled first (method 1). A second
protein precipitation method using a trichloroacetic acid (TCA)-acetone solution was also
trialled which aggressively removes non-protein compounds (Wu et al., 2014) (method 2).

Chapter 6 : Blubber Proteome
118
TCA is often used for precipitation as it is effective at low concentrations (Wu et al., 2014).
The sample volume therefore does not increase dramatically, and the protein concentration
remains high which increases the efficiency of the precipitation (Wu et al., 2014).
Finally, a simpler extraction method using radio immunoprecipitation assay (RIPA) cell lysis
and extraction buffer was trialled to assess if fewer sample processing stages, without the
precipitation of protein into a pellet and resuspension into solution, results in a higher protein
yield and less extraction variability (method 3). RIPA cell lysis buffer is highly effective for
protein extraction from a variety of cell types because it contains three non-ionic and ionic
detergents. One disadvantage, however, is that this detergent formulation is incompatible with
certain downstream applications compared to other lysis reagents, and there is no possibility to
suspend the extracted protein in a different buffer for further analysis. For a summary of the
three sample processing methods (methods 1, 2 and 3) with their different stages see Fig 6.1.
3.1.2.1. Method 1: Methanol-Chloroform Precipitation with Methanol Pellet Wash
Full depth, duplicate blubber subsamples from eight individuals (n=16) were accurately
weighed (0.4 - 0.6g) and homogenised with 0.5mL of isolation medium (50mM Tris, 150mM
NaCl, 0.2mM EDTA and 10ug/mL protease inhibitors), and 1.875mL of 1:2
chloroform/methanol. Samples were then placed on ice for 15 minutes with thorough mixing
every three minutes. 625ul of chloroform and 625ul of deionised water were added to the
sample. The sample was vortexed and centrifuged at 800g for 5 minutes at 40C. This creates
three layers, a lower lipid layer, an upper protein layer and a protein disc between the two. The
upper protein phase and the protein disc were collected and transferred to a new tube.
Three volumes of water, four volumes of methanol and one volume of chloroform were added
to the solution and vortexed vigorously for 5 min so that only one phase was visible in the tube.
The mixture was centrifuged at 4700g at 40C for 30 min. This forms two immiscible layers
with the protein precipitate at the interface between the two. The water /methanol top layer was
removed, and care was taken not to disturb the interface as often precipitated proteins do not
form a visibly white surface. Another four times the volume of methanol was added to wash
the precipitate, and the mixture was again vortexed vigorously for 5 min. The mixture was
centrifuged at 4700g at 40C for 45 min. This forms a protein pellet in the bottom of the tube.
The supernatant was removed and the pellet was dried under nitrogen at room temperature.
Care was taken not to over dry the pellet causing it to become flaky and stick to the centrifuge
tube which reduces the resuspension efficiency. Finally, the pellet was resuspended in 500ul
of SDS/Tris (0.1% SDS in 40mM Tris).
3.1.2.2. Method 2: TCA-Acetone Precipitation with Acetone Pellet Wash
Using another 16, different, full-depth blubber subsamples from eight individuals, the same
protocol as previously described was followed up to the collection of the upper protein phase
and the protein disc, and its transfer to a new tube. 10% TCA in acetone solution was added to
the sample with a ratio of 1:3 of sample to TCA-acetone solution. The sample was frozen
overnight at -200C. The sample was allowed to warm to room temperature and then centrifuged

Chapter 6 : Blubber Proteome
119
at 4700g at 40C for 45 minutes the following day. Proteins form a pellet in the bottom of the
tube. The pellet was washed twice by adding 1mL of ice cold acetone which was then
discarded. Any remaining acetone following the final wash was evaporated under nitrogen at
room temperature. Care was taken not to over-dry the protein pellet, and the pellet was
resuspended in 500µl of SDS/Tris. Of the two protein precipitation methods, using a TCA-
acetone solution showed least total protein inter-assay variability (Fig. 6.2). For this reason,
alterations were made to improve this protocol in an attempt to firstly, further clean the extract,
and secondly, to improve protein pellet resuspension by altering the pellet washing procedure.
Alteration 1: TCA-Acetone Precipitation with Butanol De-Lipidation and Acetone
Pellet Wash
As cetacean blubber tissue has such a high lipid content, an extra butanol de-lipidation step
was added before the precipitation of the protein pellet in an attempt to further ‘clean’ the
extract (Zhao and Xu, 2010). Another 16 blubber subsamples were taken, as previously
described, from the same individuals used for the TCA-acetone precipitation protocol.
Following the collection of the upper protein phase and protein disc (after homogenisation and
centrifugation), butanol was added in a ratio of 1:3 sample to butanol. This was then centrifuged
at 1750g at 100C for 10 min and the upper phase containing any remaining lipids was removed
and discarded. 10% TCA in acetone was added to the lower phase, and the precipitation and
pellet wash continued as described above. The final protein pellet was resuspended in 500ul of
SDS/Tris.
Alteration 2: TCA-Acetone Precipitation with Water Wash
Poor resuspension of the protein pellet in the SDS-Tris Buffer could result in under-estimates
of total protein content if some pellets resuspend less efficiently than others. The effect of a
different pellet wash was tested by using de-ionised water instead of acetone for the final wash
stage. This was an attempt not to dehydrate the pellet, and therefore make its resuspension back
into solution more efficient. As before, 16 blubber subsamples were taken from the same eight
individuals used for the TCA-acetone precipitation protocol. Specifically, following the
precipitation of the proteins in TCA-acetone, care was taken to discard all TCA-acetone
solution, and the pellet was washed by adding 1mL of deionised water. It was vortexed briefly,
and then centrifuged again for 5 min at 4700g at 40C. The supernatant was again discarded,
and the pellet washed a second time with deionized water. Care was taken not to disturb the
washed pellet that was then re-suspended in 500µl of SDS/Tris.
3.1.2.3. Method 3 - RIPA Lysis and Extraction Buffer
Another 16, full depth blubber samples were used for analysis from 8 individuals. The
subsamples were accurately weighed (0.1 ± 0.01g). The frozen tissue was placed on ice in a
1.5mL low protein binding micro-centrifuge tube and 200µl RIPA lysis and extraction buffer
(Thermo Fisher Scientific) with 2X concentration of protease inhibitors (Pierce Protease
Inhibitor Mini Tablets) was added to the tissue. The samples were homogenised with a pestle
designed for a 1.5mL tube for two minutes to give a cloudy white solution and small piece of
connective tissue that could not be further homogenised. The samples were replaced on ice and

Chapter 6 : Blubber Proteome
120
then centrifuged at 4700g at 40C for 15 minutes before being replaced on ice. The supernatant,
the hardened lipid containing fraction, was pushed to one side, and the protein containing
infranatant was removed and placed into a clean, low protein binding microcentrifuge tube.
Care was taken not to disturb the insoluble/unhomogenised connective tissue pellet. The
protein fraction was centrifuged, as before, as a second de-lipidation step, and replaced on ice.
Again, the infranatant was removed and placed in a clean, low protein binding microcentrifuge
tube taking care not to disturb any remaining lipid supernatant and insoluble pellet. This
solution was used for further analysis.
Fig. 6.1. Workflow showing the sample processing methods for protein extraction,
quantification, separation and identification. Sample processing methods 1 and 2 involve
various extract cleaning, protein precipitation and protein pellet wash stages. Sample
processing method 3 involves fewer processing stages. The extracts using all three methods
were used for downstream analyses; protein quantification, separation and identification.

Chapter 6 : Blubber Proteome
121
3.1.3. Total Protein Quantification Assays
To assess the effectiveness of the different protein extraction methods, two different
commercially available total protein quantification kits were used to measure the protein in the
blubber extracts. Firstly, a Pierce™ BCA Protein Assay Kit (23225, Thermo Scientific,
Rockford, USA) was used to quantify the total protein in the extracts resuspended in SDS-Tris
using the chloroform-methanol and TCA-acetone precipitation methods. The assay is a
detergent-compatible formulation based on bicinchoninic acid (BCA) for the colourimetric
detection and quantitation of total protein. This assay has a broad working range of protein
concentrations between 20-2000µg/mL. A series of dilutions of known concentrations of
bovine serum albumin were prepared using the same SDS/Tris solution used to re-suspend the
protein extracts, and assayed alongside the blubber extracts to determine their protein
concentrations based on the standard curve produced using a four parameter log-logistic model.
As blubber extract sample volumes are small, the microplate procedure was chosen for this
analysis and assays were carried out following the kit instructions with the absorbance of the
samples read at 560nm. Each extract was assayed in duplicate on every plate, a negative control
of SDS/Tris was run on every plate, and total protein concentrations were reported as µg per
wet weight of the sample. Each extract was assayed on three different plates in order to
determine the inter-assay coefficient of variation (% CV), and the average concentration
measured across the three plates was used as the final estimated total protein content of a
sample.
Secondly, a Pierce™ 660nm Protein Assay (22662, Thermo Scientific, Rockford, USA) was
used to quantify the total protein in the extracts processed in RIPA lysis and extraction buffer.
This is a quick, ready-to-use colourimetric method for total protein quantitation, and is
compatible with high concentrations of most detergents and reducing agents, and is therefore
compatible with the RIPA buffer supplemented with 2X protease inhibitors used here. The
blubber extracts were prepared following the assay instructions for cell lysates in RIPA buffer
by adding Triton™ X-100 to a final concentration of 0.8% to the sample before performing the
assay. The absorbance of the samples was read at 660nm. A series of dilutions of known
concentrations of bovine serum albumin were used to generate a standard curve. A negative
control of RIPA with 2X protease inhibitors was used as the zero standard on each plate. The
absorbance measured for this negative control was used to correct the absorbance of the
standard curve measurements which were then used to produce a 4 parameter log-logistic
model and calculate the protein concentrations in the samples. The assay was performed
following the microplate protocol and the absorbance read at 660nm. Each extract was assayed
in duplicate and total protein concentrations are reported as µg per wet weight of the sample.
Each extract was assayed on two different plates in order to determine the inter-assay CV (%
CV), and the average concentration measured across the two plates was used as the final
estimated total protein content of a sample.

Chapter 6 : Blubber Proteome
122
3.1.4. 1D SDS-PAGE Protein Separation
The final stage of the method development was to optimise protein separation and visualisation
using 1D SDS-PAGE (Sodium Dodecyl Sulfate - Polyacrylamide Gel Electrophoresis) which
separates denatured proteins based on their molecular weight. The XCell SureLock® Mini-
Cell (Life Technologies, UK) gel electrophoresis unit was used to run 4-12% NuPAGE Bis-
Tris mini gels (8.0cm x 8.0cm x 1.0mm) (NP0321BOX, Thermo Fisher Scientific, Paisley,
UK) with a wide protein separation range of 3.5 kDa to 160 kDa. The recommended sample
and running buffers for de-natured proteins as listed by the manufacturers were used to run the
gels: 1x NuPAGE LDS Sample Buffer (NP0007, Thermo Fisher Scientific, Paisley, UK) and
1x NuPAGE MES SDS Running Buffer (NP000202, Thermo Fisher Scientific, Paisley, UK).
Standard running conditions as recommended by the manufacturers were also chosen: a
constant voltage of 200V and a current of 125mA for 35 minutes. A wide protein range ladder,
InvitrogenTM NovexTM Mark 12TM Unstained Standard (LC5677, Fisher Scientific, USA) was
run on each gel. The blubber extracts resuspended in SDS-Tris were run undiluted on the gels
while the extracts in RIPA buffer were run at ½ and 1/3 dilutions as the protein content of these
extracts was much higher. NuPAGE LDS Sample Buffer (5µl of 4X) was added to 20µl of
each of the blubber extracts (neat or diluted). 10µl of each of these were loaded onto the gel.
Upon completion of the run, the gels were removed from the cassettes and rinsed in de-ionised
water briefly to remove residual SDS that affects the staining procedure. The gels were stained
in 500mL of Bio-Safe Coomassie Stain (1610786, Bio-Rad, UK) for 1.5 hours with gentle
agitation on a platform shaker. This stain is fast, simple, sensitive and convenient in it’s ready
to use and non-hazardous solution. The gels were then removed from the stain, rinsed and de-
stained in de-ionised water overnight. The de-stained gels were photographed on a white
background using a BioDoc-It™ Imaging System (Ultra-Violet Products Ltd, Cambridge, UK).
3.1.5. Quality Assurance / Quality Control
Total protein extraction method comparison studies use various approaches to assess the
protein extraction efficiencies for particular tissues. These approaches include assessing total
protein yield, the distribution of molecular weights of extracted proteins separated using 1D
SDS-PAGE, the reproducibility of protein bands with minimal streaking and background using
1D SDS-PAGE, the presence of specific protein markers from different cellular compartments
using Western Blot techniques, the presence / absence of individual protein spots using 2D
SDS-PAGE, and the reproducibility of protein spot patterns using 2D SDS-PAGE in both
animal (Cilia et al., 2009; Jiang et al., 2007; Panchout et al., 2013; Sajic et al., 2011) and plant
(Natarajan et al., 2005; Sheoran et al., 2009) studies. In keeping with such studies, here, the
performance of the different extraction protocols in terms of their ability to efficiently and
consistently extract protein from blubber tissue was assessed in four ways: by (i) measuring
total protein yield; (ii) measuring extraction variability between duplicate extracts of the same
sample extracted and assayed in tandem; (iii) measuring assay variability in terms of the protein
measured in the same sample over multiple assays; (iv) and visually inspecting the molecular
weight distribution, the number and reproducibility of protein bands separated by 1D SDS-
PAGE.

Chapter 6 : Blubber Proteome
123
All statistical analyses were performed using the statistical package, R, version 3.1.3 (R Core
Development Team, 2015). A one-way analysis of variance (ANOVA) was used to compare
between the mean protein yields of all extracts processed using the five different method
variations (method 1, three alterations of method 2, and method 3) (Fig. 6.2). The extraction
variability for each sample extracted in duplicate was calculated as a % coefficient of variation,
and again, a one-way ANOVA was used to compare between the mean % extraction variability
across the 5 method variations (Table 6.2). The inter-assay coefficients of variation for samples
assayed multiple times across different plates were also assessed using a one-way ANOVA to
determine differences in the repeatability of the measurements of the same extracts (Table 6.2).
Finally, the 1D SDS-PAGE gels were assessed for the range of molecular weights of the bands
that were separated, the number of protein bands separated and the consistency with which
these bands appeared in multiple extracts and across multiple gels. For a comparative example
of 1D gel images of extracts processed using the different methods, see Fig. 6.3.
3.2. Application to Minke Whale Biopsies
In order to investigate the use of the most appropriate total protein extraction method on biopsy
samples from live animals of a different species, remotely obtained, shallow, biopsy samples
collected from minke whales by the Mingan Island Cetacean Study in Quebec, Canada in 2013,
were used for comparative analyses. Sampling occurred from June to September in the Jacques
Cartier Passage of the Gulf of St. Lawrence (49° 36’ N, 64° 20’W). Biopsies were collected
from rigid-hulled, inflatable boats using a crossbow and hollow-tipped (40 mm in length and 8
mm in diameter) arrow system from the dorsal and flank areas of the individuals. All samples
were stored in glass vials and on ice immediately after collection, and subsequently at −20°C
until analysis. These animals were sexed genetically using the skin (Palsbøll et al., 1992), and
were all females. Sub-samples of these biopsies were taken, and total protein was extracted
using method 3 as described above. Total protein in the extracts was quantified using the
Pierce™ 660nm Protein Assay, and then separated and visualised using the same 4-12%
NuPAGE Bis-Tris mini gel running, staining, de-staining and imaging processes as described
above.
3.3. Protein Identification
A total of 36 protein bands were excised from five harbour porpoise individuals run on 4
different 1D SDS-PAGE gels. A total of 11 protein bands were excised from four minke whale
individuals run on the same 1D SDS-PAGE gel. All bands were stored in individual
microcentrifuge tubes at 4 - 80C before subsequent protein identification. The bands were from
blubber extracts processed using methods 2 (both alterations) and 3 (Table 6.1), and covered
the full size range of separated proteins from the largest ones of more than 200kDa, down to
the smallest bands visible at ~10kDa. The darkest stained bands (indicating highest protein
concentration) were chosen, which allowed the clear visual separation of the band on the gels.
In order to capture the full range of proteins that could be present in the tissue, bands from
harbour porpoises were all of different molecular weights and were chosen from a mixture of

Chapter 6 : Blubber Proteome
124
males and females, and from adults and juveniles with varying causes of death (Table 6.1). For
the minke whale samples, in order to capture the full range in proteins present, bands from
individuals sampled early in the feeding season (June) and late in the feeding season
(September) were used for analysis. All bands were analysed using nanoflow Liquid
Chromatography Electrospray Ionisation in tandem with Mass Spectrometry (nLC-ESI
MS/MS) of in-gel trypsin digests.
The excised gel band was cut into 1mm cubes. These were then subjected to in-gel digestion,
using a ProGest Investigator in-gel digestion robot (Genomic Solutions, Ann Arbor, MI) using
standard protocols (Shevchenko et al., 1996). Briefly, the gel cubes were destained by washing
with acetonitrile and subjected to reduction and alkylation before digestion with trypsin at
37°C. The peptides were extracted with 10% formic acid and concentrated down 20 times
using a SpeedVac (ThermoSavant). The peptides were then injected on an Acclaim PepMap
100 C18 trap and an Acclaim PepMap RSLC C18 column (ThermoFisher Scientific) using a
nanoLC Ultra 2D plus loading pump and nanoLC as-2 autosampler (Eksigent). The peptides
were eluted with a gradient of increasing acetonitrile, containing 0.1 % formic acid (5-40%
acetonitrile in 6 min, 40-95 % in a further 2.5 min, followed by 95% acetonitrile to clean the
column, before re-equilibration to 5% acetonitrile). The eluate was sprayed into a TripleTOF
5600+ electrospray tandem mass spectrometer (Sciex, Foster City, CA) and analysed in
Information Dependent Acquisition (IDA) mode, performing 250 msec of MS followed by 100
msec MSMS analyses on the 20 most intense peaks seen by MS. The MS/MS data file
generated via the ‘Create mgf file’ script in PeakView (Sciex) was analysed using the Mascot
search algorithm (Matrix Science), against the NCBInr database (Apr and Oct 2015 and Aug
2016) with no species restriction (65519838 to 93482448 sequences), trypsin as the cleavage
enzyme, and carbamidomethyl as a fixed modification of cysteines and methionine oxidation
as a variable modification. The peptide mass tolerance was set to 20 ppm and the MSMS mass
tolerance to ± 0.05 Da.
A protein was accepted as identified if it had 2 or more peptides with Mascot Ion Scores above
the Identity Threshold (p<0.05), and, for those proteins identified by only 2 peptides, the
MSMS spectral assignments fulfil the criteria described in Jonscher, 2005 (Jonscher, 2005).
The sequences matched homologous vertebrate proteins.

Chapter 6 : Blubber Proteome
125
Table 6.1 - Blubber samples used for total protein extraction, separation and protein
identification. ‘Gel bands’ indicate the number of individual protein bands excised from
various gels that were analysed using nLC-ESI MS/MS. 2* - A mixture of gel bands were
excised from samples processed using both alterations of method 2 were used for protein
identification.
Species Processing
Method Animal ID Sex
Age
Class
Cause of Death
Class
Gel
Bands
M343/13 F J Acute Trauma M396/13 F A Acute Trauma
Harbour
porpoises
M134/14 F A Acute Trauma 1 M055/14 M A Acute Trauma M307/14 M A Acute Trauma M355/14 M J Acute Trauma M061/15 F J Chronic Debilitation M020/15 F A Chronic Debilitation M072/13 M J Acute Trauma 2
M018/13 M A Chronic Debilitation M060/13 M A Acute Trauma
2* M040/14 M J Chronic Debilitation M028/14 M J Acute Trauma 8
M027/14 M A Acute Trauma M068/14 F J Chronic Debilitation 8
M147/14 F A Chronic Debilitation M343/13 F J Acute Trauma M315/13 F A Acute Trauma M373/13 F J Acute Trauma
3 M265/13 F A Chronic Debilitation M134/14 F A Acute Trauma
M307/14 M A Acute Trauma 14
M131/15 M A Acute Trauma 4
M144/15 F J Acute Trauma AC13001 F A 4
AC13002 F A
AC13005 F A
Minke AC13006 F A 3
whales 3 AC13012 F A NA 2
AC13016 F A
AC13017 F A 2
AC13025 F A
AC13026 F A
AC13027 F A

Chapter 6 : Blubber Proteome
126
4. RESULTS
4.1. Method Development and Optimisation
There was considerable variation seen in both the total protein yields, and the extraction
variability between duplicate subsamples (Fig. 6.2). Of the two precipitation methods, the
TCA-acetone precipitation method was chosen for further development. An extra butanol de-
lipidation step and pellet wash with water were trialled in an attempt to further optimise the
method in order to improve consistency. However, even with these changes, the total protein
yield was still poor, and there were no statistically significant differences between the overall
protein yield between the four precipitation methods (method 1 and the 3 variations of method
2) (ANOVA; df = 3, F = 2.33, p = 0.08) (Fig. 6.2a). The highest total protein yield, by at least
an order of magnitude, was obtained using the third extraction method with RIPA cell lysis
buffer which was significantly higher than all other extracts (ANOVA; df=4, F = 280.1, p <
0.0001) (Fig 6.2b). The extraction variability was high and was not statistically different
between methods (ANOVA; df = 4, F = 1.13, p = 0.36), but extracts processed using method 3
had a lower mean extraction variability and a smaller range across duplicate samples (Table
6.2).
Fig. 6.2. Total protein yield in individual blubber extracts processed in duplicate using
different sample processing methods 1, 2 and 3. a) Total protein concentrations measured in
extracts processed using methods 1 and the three variations of method 2. b) Total protein
concentrations measured in extracts processed using method 3. Overall, the total protein yield
was an order of magnitude higher using this method although there was still high extraction
variability. The horizontal dashed lines indicate the range of mean total protein concentrations
measured using the other processing methods.

Chapter 6 : Blubber Proteome
127
There was a wide range of inter-assay variability across all samples, particularly for methods
1 and 2, which were largely over the acceptable inter-assay % coefficient of variation threshold
of 20%, based on general protocols for immunoassay validations (Grotjan and Keel, 1996)
(Table 6.2). The extracts processed using method 1 had significantly higher inter-assay CVs
than the other methods (ANOVA; df = 4, F = 11.94, p < 0.001), while the others were not
significantly different to each other. There were also consistent trends of higher / lower protein
concentrations between assays for method 1 (Supplementary Results, Fig. 1), suggesting that
there is some change in protein resuspension or protein loss between repeated freeze-thaw
cycles of the extracts. Three of the five extraction protocols generally gave low average intra-
assay % CVs below the 10% threshold that was considered acceptable for three extracts
assayed twice on each plate (Grotjan and Keel, 1996) (Table 6.2). As the total protein standard
curves were all almost identical between different plates (Supplementary Results, Fig. 2), the
high between and within assay variation measured here for the Pierce BCA assay is likely
indicative that measurement error or artefacts due to the assay reagents and the assay process
were not the cause of the variability. Instead, resuspension of the protein in solution was likely
a problem for reliable and consistent measurement of the precipitated proteins.
Finally, visual inspection of the 1D SDS-PAGE gels showed that there was a wide range in
molecular weights of the separated protein bands, with both more numerous and more
consistent bands seen in the samples processed in RIPA cell lysis buffer (Fig. 6.3) For more
example gel images, see Supplementary Results, Figures 3 and 4. This further supports the
conclusion that method 3 is the most appropriate for replicable protein extraction from blubber
tissue.

Chapter 6 : Blubber Proteome
128
Table 6.2 – Summary of the total protein assay results for the three different extraction
methods and alterations. (CV: coefficient of variation. SD: standard deviation)
Extraction Methods
1 and 2
Extraction
Method 3
Methanol-
Chloroform
Protein
Precipitation
TCA-Acetone Protein Precipitation RIPA
Cell Lysis
Buffer
Extraction
Original:
Acetone
Wash
Alteration 1:
Butanol
De-lipidation
Alteration 2:
Water
Wash
Total
Protein
Assay
Pierce BCA
Pierce BCA
Pierce BCA
Pierce BCA
Pierce 660nm
Minimum
Protein
Yield
14.4 ug/g
3.8ug/g
7.3 ug/g
7.7ug/g
3101.8 ug/g
Maximum
Protein
Yield
361.6ug/g
918.0ug/g
158.8 ug/g
89.3ug/g
5512.7 ug/g
Extraction
CVs
(SD/mean) x
100
duplicate
protein
extracts
28.4%
(2.3 - 78.7%)
42.0%
(6.7 - 90.0%)
50.6%
(12.5 - 151.0%)
31.8%
(2.1 - 68.8%)
21.9%
(2.8 - 39.8%)
Inter-
Assay CVs
(SD/mean) x
100
different
total
protein
plates
86.5%
(47.8 - 133.1%)
42.5%
(0.5 - 141.4%)
31.6%
(4.1 - 103.9%)
23.4%
(3.31 - 69.5%)
15.8%
(1.5 - 64.9%)
Intra-
Assay CVs
(SD/mean) x
100
same total
protein
plate
0.7%
(0.1 - 1.3%)
2.0%
(1.2 - 3.3%)
28.7%
(4.7 - 100.0%)
19.3%
(2.5 - 105.6%)
4.5%
(3.6 - 5.5%)

Chapter 6 : Blubber Proteome
129
4.2. Protein Identification
Harbour porpoises: In total, 295 proteins were identified across the 36 gel bands separated
through 1D SDS-PAGE from 5 individuals. Many of the proteins, and protein fragments were
identified across multiple bands from the same gel, and therefore did not show clear clustering
around their expected molecular weight range. This was possibly due to protein degradation
and / or some proteins being more abundant than others. The identified proteins were grouped
into general subclasses firstly, based on their type, and secondly based broadly on their function
using data from UniProt (http://www.uniprot.org) and a literature search. This resulted in the
identification of proteins belonging to 5 main types: enzymes (proteins involved in the catalysis
of various processes), immune proteins (proteins involved in the regulation of immune system
function and activation as well as inflammation), carrier proteins (proteins that bind other
factors for extracellular or intracellular transport), structural proteins (proteins responsible for
the maintenance of cell shape and integrity as well as the extracellular matrix), and regulatory
proteins (any other proteins involved in the regulation of other cellular processes) were
grouped.
Proteins were then grouped into functional classes which resulted in the identification of 8 main
groups: amino acid metabolism, lipid metabolism, tissue structure, cell structure, glucose
homeostasis, biomolecule transport, immune response and inflammation and overall cell
function and metabolism. As an indicator of relative abundance, the frequency with which each
protein was identified across different gel bands and individuals was also recorded in order to
Fig. 6.3. 1D SDS-PAGE analysis of harbour porpoise blubber tissue extracts on 4-12%
Bis-Tris gels stained with Bio-Safe Coomassie brilliant blue. (a) Protein extracts labelled 1
- 4 were extracted using TCA-Acetone precipitation with an acetone wash, TCA-Acetone
precipitation with butanol de-lipidation, and TCA-Acetone precipitation with a water wash.
(b) Protein extracts labelled 1-5, extracted in RIPA cell lysis buffer, and each diluted ½ and 1/3.

Chapter 6 : Blubber Proteome
130
identify the kinds of proteins that appeared to be most abundant. Over half of all proteins
identified were only seen once across all 36 gel samples analysed, while less than 5% of the
proteins were seen more than 10 times. The top six most frequently identified proteins were
haemoglobin, immunoglobins, serum albumin, fatty acid binding protein, myoglobin and
annexins.
Proteins involved in amino acid metabolism, tissue structure, glucose homeostasis,
biomolecule transport and cell structure were the least abundant of the protein functional
groups, each making up less than 10% of all the identified proteins (Fig. 6.4). Proteins involved
in lipid metabolism made up approximately 10% of the identified proteins and these included
one of the adipokines, adiponectin, regulatory proteins including fatty acid binding proteins
and perilipin-1, as well as enzymes including 3-hydroxyacyl-CoA dehydrogenase and acetyl
CoA synthetase, for example (Fig. 6.4).
The second largest functional group was immune proteins. These were of varying sizes and
functions, and made up approximately 15% of all identified proteins (Fig. 6.4). The immune
proteins were dominated by two classes of immunoglobulin, IgA and IgG. Annexins and
cyclophilins were also present, and are involved in the regulation of the inflammatory response
(Bukrinsky, 2015; Sugimoto et al., 2016). Other proteins included transferrin, fibrinogen and
fibronectin that are involved in the acute phase response (Kilicarslan et al., 2013). Dermicidin
has antimicrobial properties (Schittek et al., 2001), and 4 complement proteins (C1, C3, C4 and
C9) were identified that act as parts of the complement system which forms part of innate
immunity (Nesargikar et al., 2012). B-cell antibody and galectins expressed by immune cells
were also identified (Fig. 6.4).
Finally, the largest functional group was proteins involved in general cell function and
metabolism, and made up approximately 45% of the proteins identified. These were proteins
involved in a range of different processes including protein degradation and modification,
biosynthesis, metabolic pathways (e.g. glycolysis), redox proteins, heat shock proteins, signal
transduction, vesicle trafficking, cell cycle regulation and protein chaperones, to name just a
few (Fig. 6.4).
Minke whales: Between the two species, a total of 409 different proteins were identified. From
the four minke whales, 258 proteins were identified across the 11 gel bands separated through
1D SDS-PAGE. These were classified into the same five protein types as the harbour porpoises,
and the same eight functional classes, with the addition of two extra classes. These were the
peripheral nervous system (peripherin), and vasodilation and circulation (e.g. heparin and
angiotensinogen). Across the two species groups, 55.8% of the proteins identified in the minke
whale samples were also seen in harbour porpoise samples, so over 40% of the proteins were
newly identified in the biopsy samples. Almost half (48.8%) of the proteins identified were
only seen once, and just less than 20% were seen more than five times across these extracts.
Similar to the harbour porpoise data, the top six most frequently identified proteins were
haemoglobin, fatty acid binding protein, apolipoprotein, immunoglobulins, serum albumin and
perilipins.

Chapter 6 : Blubber Proteome
131
Proteins involved in the peripheral nervous system, amino acid metabolism, glucose
metabolism and vasodilation and circulation were the least abundant of the protein functional
groups, each making up less than 5% of all the identified proteins (Fig. 6.5). Proteins involved
in tissue structure, biomolecule transport and lipid metabolism each made between 7 - 10% of
the data. Cell structure proteins made up a larger proportion of the minke whale data than the
harbour porpoise data, but immune response and inflammation proteins were again the second
largest class for these data, making up approximately 14% of the identified proteins (Fig. 6.5).
Only one class of immunoglobulin was identified in these samples compared to the harbour
porpoises, but 3 extra complement proteins were identified (Fig. 6.5). Finally, the cell function
and metabolism proteins were the largest protein functional group, making up over 40% of the
data, and were involved in a range of different cellular and metabolic processes (Fig. 6.5).
Thus, while a huge number of new proteins were identified, the overall patterns in terms of
what proportion of the proteins were attributed to the different functional groups were generally
the same between the two species.

Chapter 6 : Blubber Proteome
132
Fig. 6.4. Protein components identified from the harbour porpoise blubber extracts. The proportion of each functional group is indicated as well as examples of
some of the most abundant and the most well-studied proteins that were identified. The most abundant functional group was proteins involved in cell function and
metabolism followed by the immune response and inflammation.

Chapter 6 : Blubber Proteome
133
Fig. 6.5. Protein components identified from the minke whale blubber extracts. The proportion of each functional group is indicated as well as
examples of some of the most abundant and the most well-studied proteins that were identified. The most abundant functional groups were the same as
for the harbour porpoise data while two new groups were identified; the peripheral nervous system and vasodilation and circulation.

Chapter 6 : Blubber Proteome
134
5. DISCUSSION
Method Development and Optimisation
Proteins in cetacean blubber tissue were extracted, quantified and identified. With all three
extraction methods trialled here, there was variability in the total protein yields between
individuals, between duplicate subsamples of the same individual and also between assays of the
same extract. The variability may be the result of a combination of possible factors caused by the
samples themselves including, for example, high levels of individual variation between porpoises,
or fine-scale variation and patchiness of proteins within the tissue. The amount of total protein
extracted could also vary depending on the physical properties of the tissue such that the
effectiveness of the extraction may differ between samples with higher or lower lipid or collagen
content, for example.
Other sources of variation are likely introduced during the different stages of the extraction
protocol. Sources of variability in the extraction methods 1 and 2 include homogenisation,
centrifugation, pipetting, evaporation and resuspension phases, which together lead to differences
in the total amount of extracted or lost protein through the whole process. Specifically, it is likely
that resuspension of the protein in solution was a problem for reliable and consistent measurement
of the precipitated proteins using methods 1 and 2. These losses as a result of the multi-stage
processing procedures, together with variable resuspension of the protein in solution which lead
to the compounding errors associated with high inter- and intra-assay CVs, mean that these are not
reliable methods for total protein extraction.
A protein precipitation method would be favoured in order to have the possibility of re-suspending
the protein content of the blubber in a chosen buffer or solution that is compatible with subsequent
analytical techniques (total protein quantification, SDS-PAGE, ELISAs, proteome profiler arrays,
Western blots, for example). However, processing method 3, a simpler method with no
precipitation and resuspension of the protein, and few processing steps, resulted in the most
consistent results with the highest total protein yield. The final total protein yield was orders of
magnitude higher than the previous two methods likely as a result of the streamlined extraction
process that did not result in the same protein losses through the multiple-extraction steps used in
the other two methods. This processing method results in an extract that is more limited in terms
of its potential downstream applications as RIPA buffer is not compatible with a number of assays
for protein quantification. Nevertheless, it is the preferred extraction method here for these
preliminary proteomic investigations. Further work should prioritise the improvement of
extraction methods that make the final product more compatible with downstream assays for
individual protein identification and quantification.
The causes of the extraction variation using method 3 (approx. 20%) are still to be determined. It
is likely that the protein content varies at a fine scale through the blubber tissue which gives rise
to the extraction variability seen here. This natural variability is therefore a challenge to the
usefulness of this technique in determining precise quantities as oppose to gross differences. The

Chapter 6 : Blubber Proteome
135
applicability of the method will therefore be dictated by the acceptable level of precision for a
particular study. Further work to investigate the sources of this variability should be prioritised.
Similarly, further work should address the best means of standardising the amount of protein
quantified from blubber extracts, instead of using wet weight of the tissue, as this may reduce some
of the extraction variability. For example, when measuring biomarkers in urine, the osmolarity and
concentration of creatinine are accepted methods of standardization (Reid et al., 2013). In general,
variability in laboratory measurement procedures exist throughout laboratory medicine, and
advances in analytical technologies and international agreements on improved approaches to test
standardization have increased the accuracy of clinical laboratory tests over the last few decades
(Bock and Eckfeldt, 2011). Advances in measurement science, called metrology, therefore depend
on achieving international consensus on best practices (Bock and Eckfeldt, 2011), and in our field
of marine mammal physiology, the way forward now is for inter-group collaborations to establish
methods of best practice and standardisation to make these methods applicable and comparable
across the widest range of study species possible.
1D SDS-PAGE was used here to separate and visualise, for the first time, the protein components
of cetacean blubber tissue. Both the best band resolution and the highest number of bands were
seen in the RIPA buffer extracts. This confirmed that this method increases both the total amount
of protein extracted, as well as the range of proteins within the sample compared to methods 1 and
2. Linking a ‘shotgun’ proteomics approach to 1D SDS-PAGE was used here to identify proteins
and, thus, investigate both the types of proteins and the most abundant proteins present in blubber.
This work is based on the notion that known proteins from other organisms can help to identify
cetacean proteins by homology. While there may be subtle differences in both protein structure
and function, cetacean myoglobin compared to myoglobin from terrestrial species (Holm et al.,
2016), or leptin in terrestrial animals compared to in phocid seals for example (Hammond et al.,
2012), it was assumed that the proteins within the tissue could be positively identified based on
regions of sequence identity with known proteins from vertebrate species within the NCBI
database. However, due to the adaptation of marine mammals to an aquatic environment, the
potential for protein structural modification could be high for some proteins. This could therefore
lead to sources of error during protein identification, and should be considered when aiming to
identify molecules that could serve as indicators of physiological condition.
Proteins Identified
As the protein gel bands extracted from the harbour porpoise samples were all of different
molecular weights, from all sex and age classes that had suffered various causes of death, a wide
variety of proteins present in the tissue were captured. Similarly, because the minke whale biopsy
samples were taken over a 4-month period of the summer feeding season, animals were likely in
varying states of lipolysis and lipogenesis so a wide variety of proteins were captured in these
samples as well. The largest functional group for both species were proteins involved in general
cell function and metabolism. Within this group, the proteins were further classed into more
specific functional roles including proteins involved in biosynthesis, antioxidant proteins,

Chapter 6 : Blubber Proteome
136
regulators of the cell cycle and signal transduction pathway proteins, for example. The variety of
the proteins in this group with a range of different metabolic functions is in keeping with a recent
transcriptomic study of Northern elephant seal (Mirounga angustirostris) blubber tissue which
showed that the most significantly enriched pathway in the blubber transcriptome, compared to
the human proteome, was metabolism (Khudyakov et al., 2017). The identification of important
metabolic factors could therefore provide insight into localised tissue function. For example, heat
shock proteins were identified here in the blubber extracts, and changes in gene expression for the
heat shock response were detected in the transcriptome of the elephant seals (Khudyakov et al.,
2017). Heat shock proteins are key cellular defences against stress and play crucial roles in the
folding and unfolding of proteins, the transport and sorting of proteins, as well as cell-cycle control
and signalling (Li and Srivastava, 2003). In phocid seals, greater requirements for heat shock
proteins and other antioxidants have been hypothesised at certain times during the life cycle as a
result of rapid protein synthesis and high metabolic fuel availability (Bennett et al., 2014). Six
different heat shock proteins were identified between the two species groups, and the expression
of these proteins could provide insight into cellular and physiological stresses of individuals.
The second largest functional group for both species was proteins involved in the immune response
and inflammation. Some of the immune, and acute-phase response proteins that were identified
included haptoglobulin, transferrin and eight members of the complement pathway. This is in
keeping with the recognition of the extensive and direct involvement of white adipocytes in
inflammation and the acute-phase response in other mammals (Frühbeck et al., 2001). It has been
shown that adipocytes synthesise all of the proteins involved in the alternative complement
pathway, specifically, factor C3. However, further research is required to determine the primary
functions and regulation of this pathway in adipose tissue (Frühbeck et al., 2001). Other proteins
involved in immune system function were also identified including immunoglobulins (IgA and
IgG) which, together, were the second most abundant proteins in the extracts from both species.
These were likely either in the circulation or were secreted directly from B-cell infiltrates within
the blubber itself. Annexins, cyclophilins and dermicidin were among the other proteins identified
that are involved in the regulation of inflammation and the immune response. Annexin A1, for
example, is an endogenous glucocorticoid-regulated protein involved in the regulation of the
inflammatory response by reducing leukocyte infiltration and activating neutrophil apoptosis to
avoid tissue damage caused by excess neutrophils at a site of inflammation (Sugimoto et al., 2016).
Both innate and the adaptive components of the immune system were therefore present in the
tissue. Given the current understanding of the involvement of adipose tissue in immune system
function, it is possible that cetacean blubber could show a similar role, and the presence of such
proteins could provide information regarding immune system function and response in these
animals.
As expected, there were also a range of factors identified that play key roles in lipid metabolism,
and these made up the third largest functional group of identified proteins in the harbour porpoises
and the fourth largest group in the minke whales. Fatty acid binding proteins are low molecular-

Chapter 6 : Blubber Proteome
137
weight cytoplasmic proteins, and were particularly abundant here in both species. The adipose-
specific fatty acid-binding protein has been shown to be involved in intracellular trafficking and
targeting of fatty acids (Frühbeck et al., 2001), and may modulate lipolytic rate. Apolipoproteins
were particularly abundant in the minke whale samples, and are known to play important roles in
both the synthesis and catabolism of plasma lipoproteins, in lipid transport, and in the activation
of various enzymes involved in lipid and lipoprotein metabolism (Donma and Donma, 1989).
Enzymes and regulatory proteins involved in lipolysis were identified, including the hormone
adiponectin which was particularity abundant in the minke whale samples. Adiponectin is an
adipokine produced by white adipose tissue and released into the circulation, and is important for
whole body metabolic regulation by increasing adipogenesis and lipid storage in fat tissue, as well
as increasing insulin sensitivity (Fu et al., 2005). Circulating adiponectin concentrations have been
negatively correlated with total body fat stores in a number of terrestrial mammals (for a review
see Fain et al., 2004), and, in marine mammals specifically, adiponectin is thought to be important
in the development of blubber reserves in grey seal (Halichoerus grypus) pups (Bennett et al.,
2015). Concentrations of this hormone in the blubber could therefore provide information on the
physiological state of an individual in terms of current energy stores. Adiponectin signalling
pathways were also identified in the transcriptomic study of Northern elephant seals when
investigating the acute metabolic response to glucocorticoids (Khudyakov et al., 2017). Other
differential gene expression was measured that promoted lipid catabolism and oxidation at the
expense of lipid synthesis and storage (Khudyakov et al., 2017). The presence of factors involved
in various stages of lipid metabolism could be used to assess whether the individual is undergoing
a period of lipolysis or lipogenesis at the time of sampling. This is a good example of how the
integration of proteomic and transcriptomic methods could result in a powerful assessment tool.
Moving forward, the quantification of individual proteins could be coupled to the transcriptome
so that transcription and translation can be linked.
Finally, for the harbour porpoises, although every attempt was made to obtain very fresh tissue
samples, they were nevertheless collected from dead-stranded animals, so minor autolysis could
have affected these findings. This would also complicate the functional interpretation of any
proteins involved in ante- or post-mortem metabolic processes. Similarly, the remotely obtained
biopsy samples from the minke whales were stored on ice immediately after collection, but a small
amount of tissue degradation is possible as a result of the delay between sample collection and
sample freezing. Ideally, samples should be collected and snap frozen immediately using dry ice
or liquid nitrogen. However, the wide range of proteins and peptides identified here across a variety
of metabolic pathways and processes suggests that proteomics is a robust tool to investigate tissue
function using this biopsy sampling approach.
Tissue Specific and Circulatory Proteins
While a range of different molecular weight proteins were identified, there may be some size
selective loss of protein species as well as some loss of the least abundant proteins through the

Chapter 6 : Blubber Proteome
138
extraction procedure. There may also be some loss of more hydrophobic proteins that are more
difficult to solubilise. Thus, if a protein was not identified following nLC-ESI MS/MS, this does
not confirm its absence from the tissue, but this work does suggest that there are some proteins,
and protein classes, that are more abundant than others. The relative abundance of some proteins
compared to others is also likely the reason why over half of the proteins identified were only
observed once. These proteins are probably the least abundant in the tissue, and were thus only
identified once ‘by chance’ as a result of the combination of other proteins that were also within a
particular gel band. There are therefore potentially a huge number of other proteins that were
present in the samples, but were not identified. Conversely, serum albumin and haemoglobin, from
the circulation, were two of the most abundant proteins identified in both species, and likely
affected the detection of other proteins by swamping the samples. Further efforts to remove the
albumin from the extracts would likely be required to detect less abundant proteins of potential
interest. This could be achieved by fractionation of the extract for example or, the use of ‘Cibacron
Blue’, a commercially available resin to remove albumins from solution. Alternatively, antibody
columns could be used to target specific proteins. Similarly, targeted mass spectrometry could be
used to detect particular peptides from a specific protein of interest to therefore detect the presence
of proteins at lower concentrations within the samples.
Proteins identified here probably do not originate solely from the blubber tissue itself, but are a
mixture of blubber proteins together with plasma proteins. Attempts were made to limit any
external blood on the samples by using visibly ‘cleaner’ parts of the harbour porpoise tissue
samples. The presence of plasma proteins in the extracts were therefore likely largely a result of
their presence within the tissue vasculature rather than on each piece of tissue from contaminating
sources during the necropsy sampling. The vascularisation of marine mammal blubber tissue is
still not well understood, but one study comparing the microvasculature of deep diving and shallow
diving odontocetes found that blubber tissue is more highly vascularised than adipose tissue in
terrestrial mammals (McClelland et al., 2012). As such, blubber tissue sampling can provide
information on both the proteins produced and metabolised in situ as well as those in circulation.
Double sampling of freshly dead stranded animals before blood coagulation occurs would be
useful for further comparisons of proteins present in both the blood and blubber of the same
individuals. This would be an important next step to identify those proteins present in both
matrices, and those that are found more exclusively in the blubber itself. For example, the absence
of some proteins identified in the minke whale samples compared to the harbour porpoise samples
could reflect differences in the vascularisation of the outermost part of the tissue compared to the
full blubber depth.
The range of proteins identified here across both species, and the presence of a huge number of
proteins identified exclusively in the full depth harbour porpoise samples or exclusively in the
superficial minke whale samples, clearly demonstrate the heterogeneity of blubber tissue. A
comparison of the proteins present through the different blubber layers from the same individuals
would help to establish if this heterogeneity results from longitudinal differences in metabolic

Chapter 6 : Blubber Proteome
139
activity of the tissue and / or different cell types through the blubber depth. While it has been well
established that adipocytes express and secrete several endocrine hormones, many secreted
proteins within the tissue are derived from the non-adipocyte fraction (Fain et al., 2004). For
example, the innermost blubber layer has been shown to consist of a heterogeneous mix of white
adipocytes, brown adipocytes and connective tissue as well as muscle and nerve fibres (Hashimoto
et al., 2015). Therefore, as the full depth blubber layer was sampled in the harbour porpoises,
proteins detected in these samples were most likely the result of differential gene expression in
these different cell and tissue types which explains the presence of myoglobin, a muscle protein,
across all samples. Thus, as well as the origin of certain proteins in terms of either the blubber or
the circulatory system, an important next step would also be to establish the secreting cell types
within the tissue. It would be possible to determine whether gene expression and protein secretion
occurs within the mature adipocytes, or in the other cells that make up the tissue, either
histologically (through in situ hybridisation) or by separation of the adipocytes from the stromal
vascular fraction by collagenase digestion (Trayhurn and Wood, 2004).
Potential for Biomarker Development
While there were over 400 different proteins identified in the extracts from the two species, overall,
the relative abundance of the proteins across the functional groups were very similar. Moving
forward, the identification and quantification of different hormones and proteins involved in
various metabolic pathways within blubber tissue could lead to the development of potential new
protein markers of interest. Explaining and quantifying the natural variability in these protein
markers in the context of different life histories or causes of death, for example, is the next step in
developing this approach. Overall, proteomic studies also have the potential to identify key
metabolic processes and pathways and therefore assign novel functional roles to marine mammal
blubber tissue.

Chapter 7 : Quantitative Blubber Proteomics
140
CHAPTER 7: THE CHALLENGES AND
OPPORTUNITIES FOR QUANTITATIVE
PROTEOMICS TO INVESTIGATE BLUBBER
BIOMARKERS

Chapter 7 : Quantitative Blubber Proteomics
141
1. ABSTRACT
Proteins extracted from blubber tissue likely originate both from the various cell types within the
blubber itself, and from the circulation. They therefore have the potential to capture information
on the cellular and physiological stresses experienced by individuals at the time of sampling. As a
next step to further develop this analysis, more quantitative proteomic methods were trialled to
assess how the variation in protein profiles between individuals could be explained by
physiological states and other biological covariates of interest. Total protein was extracted and
then separated using 1 dimensional sodium dodecyl sulfate polyacrylamide gel electrophoresis
(1D SDS PAGE) from four sample sets. These were samples from stranded harbour porpoises
(Phocoena phocoena) (n = 32), stranded balaenopterids (n = 10), biopsy samples from minke
whales (Balaenoptera acutorostrata) (n = 10) and biopsy samples from humpback whales
(Megaptera novaeangliae) (n = 42).
Non-metric multidimensional scaling (NMDS) analysis was used to cluster individuals based on
similar protein band profiles. Despite the range of proteins previously identified within blubber
extracts, the NMDS results showed that separation and visualisation of different protein bands
using 1D SDS PAGE was not at a fine enough resolution to be able to identify patterns that
correlated with reproductive states, sex, age class, cause of death, season or area. It appears that
the time in storage, the total protein yield extracted from the tissue and sources of error associated
with running the 1D SDS PAGE affected the band profiles in some individuals. There are therefore
some sample processing and measurement errors associated with these methods that require further
investigation and quantification. However, for the largest sample set of humpback whale biopsies,
linear regression models showed that the presence and absence of some protein band groups were
associated with high or low blubber cortisol concentrations. In a semi-quantitative analysis, using
the protein identification results from the minke whale nLC-ESI-MS/MS data in Chapter 5, the
abundance of proteins involved in lipid metabolism and amino acid metabolism were higher in the
band group associated with high cortisol concentrations compared to the full dataset. While this
only provides a semi-quantitative investigation of the relationships between protein functional
group abundance and the concentrations of other endocrine markers of interest, it does show that
the application of multiple analytical methods together could lead to a better understanding of
whole tissue function. Using this approach, biomarkers, like cortisol concentrations, can be linked
to downstream changes in protein abundance.

Chapter 7 : Quantitative Blubber Proteomics
142
2. INTRODUCTION
A huge number of proteins and peptides involved in a range of different metabolic processes and
pathways were identified in cetacean blubber tissue extracts. Following this ‘shotgun’ approach as
a preliminary investigation to assess what protein classes were present in the tissue and their
relative abundance, the next step is to apply more quantitative proteomic methods to assess the
variation in protein profiles between individuals, and how this variation can be explained by life
history strategies and physiological states. This will allow the identification of potential blubber
proteins and peptides of interest for further biomarker development. The use of proteomic
biomarkers is a widely accepted approach in human medicine, and has been used to identify disease
processes ranging from Alzheimer’s to congestive heart failure (Zhang et al., 2004). These
approaches have involved protein separation, characterization and identification techniques to
create and compare protein profiles of normal and diseased body fluids including serum,
cerebrospinal fluid and urine for example (for review see Zhang et al., 2004). The applicability of
these methods for biomarker development using blubber tissue extracts here will depend on the
magnitude of the explained, observed differences between individuals, and the consistency with
which these differences can be identified. This will contribute to a better understanding of whole
blubber tissue function as more than just an energy storage depot, in keeping with the current
understanding of mammalian adipose tissue as an important endocrine organ (Kershaw and Flier,
2004).
Indicator proteins may be produced directly by the blubber itself, secreted either by the adipocytes
or the stromovascular cells, or a combination of both. Equally, indicator proteins may have
accumulated in the tissue from the circulation in a manner dependent on the individual’s metabolic
state. They therefore have the potential to capture information on a range of different metabolic
processes and provide insight into the physiological stresses experienced by individuals. Of
particular interest to assess energy stores and body condition would be the adipokines such as
adiponectin, previously detected in both harbour porpoise (Phocoena phocoena) and minke whale
(Balaenoptera acutorostrata) blubber extracts. Other markers of interest are enzymes and other
regulatory proteins involved in lipolysis and lipogenesis. In addition, the range of immune proteins
previously identified suggests that the blubber could be a valuable tissue for assessing immune
system function and inflammatory responses.
For studies of complex protein mixtures, such as those extracted from blubber tissue, strategies for
reproducible and accurate quantification are needed. 1 dimensional sodium dodecyl sulfate
polyacrylamide gel electrophoresis (1D SDS-PAGE) is a commonly used method for both
fractionating complex samples by protein size, and visualising variations in individual protein
content (Gautier et al., 2012). Using 1D SDS-PAGE to compare separated protein bands by their
presence and their intensity has been applied to a wide range of proteomic studies in both human
health sciences and other model species. For example, the biological pathways involved in human
endothelial cell response to pro-inflammatory cytokines (Gautier et al., 2012), and the proteome
of the human tear film (Green-Church et al., 2008) have been investigated using combinations of

Chapter 7 : Quantitative Blubber Proteomics
143
1D SDS-PAGE and shotgun proteomics. In other species, 1D SDS-PAGE has been used to
investigate changes in immune factors and other proteins in milk throughout lactation in seals
(Lowe et al., 2017), and to provide diagnostic and prognostic information on urinary proteins in
dogs with severe inflammatory response syndrome (Schaefer et al., 2011). These methods
therefore represent a powerful analytical tool with applications to a range of different sample types
of interest.
1D SDS-PAGE methods were applied here to separate the total protein content from blubber
sample extracts collected from both dead, stranded individuals and biopsies from live animals. The
blubber samples from dead stranded individuals consist of a small odontocete, the harbour
porpoise, and balaenopterids of a mixture of species. The biopsies from live animals consist of
samples from both minke whales and humpback whales (Megaptera novaeangliae) sampled on
their feeding grounds in the Gulf of St Lawrence, Quebec, Canada by the Mingan Island Cetacean
Study (MICS). Variations in protein band presence/absence, frequencies and relative concentration
profiles generated though 1D SDS-PAGE were assessed in the context of both qualitative variables
including species, sex, age class, reproductive status, cause of death, area and season. Quantitative
variables were also assessed including morphometric body condition indices, blubber cortisol
concentrations and total protein content extracted from the tissue. The aim was to interpret any
variations in the protein band profiles between individuals with differences in physiological state,
and thus identify particular protein bands or protein band patterns that can be further analysed for
the development of health biomarkers in these species.

Chapter 7 : Quantitative Blubber Proteomics
144
3. METHODS
3.1. Sample Collection
Stranded harbour porpoises: Full-depth skin, blubber, and underlying muscle samples were
collected from 32 dead harbour porpoises by the SMASS between 2013 and 2015 as previously
described in Chapter 5. Samples were taken from both males and females, and adults and juveniles.
The cause of death was determined following post-mortem examination, and individuals were
classes as acute or chronic cases as previously described in Chapter 1.
Stranded balaenopterids: In addition to the full depth samples from harbour porpoises, 10 full
depth blubber samples were also collected from stranded balaenopterid individuals. These were a
mixture of minke whales (sampled by the SMASS and MICS), humpback whales and a fin whale
(Balaenoptera physalus). Again, these were a mixture of males and females, and adults and
juveniles with varying causes of death.
Samples were collected and frozen in individual plastic vials at -200C prior to analysis. For the
total protein extraction, sub-samples were taken on ice while the tissue was still frozen, and care
was taken to remove all skin and muscle from the blubber. Full depth subsamples of each original
sample were used for total protein extraction in order to investigate the proteins through all layers
of the tissue. Of these 42 samples from stranded individuals, 34 were extracted in duplicate (Table
7.1) to assess the potential variability in total protein extracted from the tissue as a result of either
protein heterogeneity within the tissue, or variability as a result of the tissue handling and
processing.
Minke whales: Ten remotely obtained, shallow, biopsy samples collected from adult minke
whales by the MICS in 2013 were used for total protein extraction (see Chapter 5 for details).
These animals were sexed genetically using the skin as a source of DNA, and were all females.
Humpback whales: A total of 59 biopsies collected from humpback whales in Quebec, Canada,
and in northern Norway between 2011 and 2017 were used for total protein extraction. These
samples were all collected from simultaneously tagged and biopsied animals for a study to
compare metrics of body condition estimated from tag data and from biomarkers in blubber
biopsies. These samples were also used for cortisol and progesterone extraction (see Chapter 4 for
details). A number of the biopsied animals from 2016 and 2017 also have accompanying
photogrammetric information obtained from images captured from an unmanned aerial vehicle
(UAV). These photogrammetry data consist of a Length Standardised Surface Area Index (LSSAI)
used to capture variation in girth of individuals as a function of their total body fat stores, and
therefore an index of body condition (see Chapter 4 for details). Overall, these were from a mixture
of males and females in varying reproductive states, as well as some juvenile individuals.
All biopsy samples were stored on ice immediately after they were collected, and then stored
frozen either in aluminium foil or in glass vials at -200C until processed. Sub-samples were taken

Chapter 7 : Quantitative Blubber Proteomics
145
on ice while the tissue was still frozen, and care was taken to remove all skin from the biopsy and
to cut the sample vertically so as to retain as much of the variation though blubber depth as
possible.
Table 7.1 - Summary of the samples used for total protein extraction belonging to four
separate groups. *SMASS: Scottish Marine Animal Stranding Scheme. *MICS: Mingan Island
Cetacean Study.
Group Species Total Duplicate Extracts Source
Porpoises Harbour porpoise 32 24 SMASS*
Balaenopterids
Minke whale
7
7
SMASS /
MICS*
Humpback whale 2 2 SMASS
Fin whale 1 1 SMASS
Minke whale
Biopsies
Minke whale
10
0
MICS
Humpback
whale Biopsies
Humpback whale
59
0
Canada /
Norway
3.2. Total Protein Extraction and Quantification
Total protein was extracted from 0.1g subsamples of either the full depth samples from the stranded
animals, or the biopsy samples from live animals. The RIPA cell-lysis buffer protocol as described
in Chapter 5 was used for total protein extraction of these samples, and extracts were assayed for
total protein content using a Pierce™ 660nm Protein Assay (22662, Thermo Scientific, Rockford,
USA) (see Chapter 5 for details). On each total protein plate, 4 samples were assayed in triplicate
and an intra-assay CV of <10% was considered acceptable. Any plates with an intra-assay CV of
> 10% were discarded and all extracts assayed again. Extracts were then separated on 1D SDS-
PAGE gels the same day.
3.3. Total Protein Separation
The 1D-SDS PAGE total protein separation method, as described in Chapter 5, was used to
separate and visualise proteins of different sizes within the extracts. Each extract was diluted by ½
to avoid protein overloading and smearing on the gel in order to produce good band visualisation.
Four bovine serum albumin (BSA) standards of known concentrations were also loaded onto each
gel for relative protein concentration determination. Gels were stained and destained as previously
described in Chapter 5, and then photographed on a white background using a BioDoc-It™
Imaging System (Ultra-Violet Products Ltd, Cambridge, UK).

Chapter 7 : Quantitative Blubber Proteomics
146
3.4. 1D SDS-PAGE Band Detection, Characterisation and Processing
Band Detection and Characterisation: Gel images were imported as jpeg files into freely
available software for 1D gel electrophoresis image analysis software called ‘GelAnalyzer 2010’
(Fig. 7.1). The process of gel image analysis using the software is straightforward and covers
automatic lane and band detection, background subtraction techniques, retention factor (Rf)
calibration to correct for gel run distortions, and accurate quantity and molecular weight
calculations with four different calibration curve types to choose from. Here, a combination of
both automatic and manual band detection was used to assign band limits for the molecular weight
markers, the BSA standards and the protein bands separated in each of the sample extracts. Log-
linear models were fitted by the software to the molecular weight markers and the standards of
known concentration in order to estimate, in an automated process, both the concentrations and
the molecular weights of the bands identified in the sample extracts. Each band identified across
all individuals and all gels was therefore assigned a molecular weight and a volume
(concentration).
Fig. 7.1. ‘GelAnalyzer’ software interface for the quantitative assessment of the protein band
patterns of blubber extracts. Top left panel: Gel image with identified bands marked with points
and bordered by red horizontal lines. Top right panel: Intensity of the bands of an individual lane
representing one extract. Intensity is used to calculate the volume (concentration of proteins) of a
band. Bottom left panel: Calculated values for the bands in the lane highlighted in the trop right
including Rf values (migration distance from the sample loading well compared to the migration
distance of the dye front), calculated volume (concentration) and molecular weight (size of the
proteins in that band). Bottom right panel: Visualisation of the model calibration curves fitted to
the molecular weight markers.

Chapter 7 : Quantitative Blubber Proteomics
147
Post Image Analysis Band Processing: As all gels ran slightly differently, the same band
appeared as 17 kDa, 16 kDa or 15 kDa, on different gels for example, but this is the equivalent
band separated across individuals. For this reason, there were a huge number of bands of different
molecular weights detected in the harbour porpoise and the balaenopterid samples (Fig. 7.2a).
Even when bands were grouped into 5 kDa bins (Fig. 7.2b), there was still a large number of bands
that likely represented the same proteins but because of the slight differences in the running of
different gels, the calculated molecular weights were marginally different. To overcome this
problem, the bands were therefore separated into more manageable and meaningful units based on
the maximum number of bands seen in an individual, and the distribution of separated bands down
the gels (e.g. there are a greater number of different bands seen between 116 kDa and 55 kDa
compared to between 200 kDa and 116 kDa), whilst taking into account the fact that there was
greater separation of smaller proteins than larger ones (e.g. a greater migration distance between
bands of 5 kDa and 15 kDa than bands of 90 kDa and 100kDa in size) (Fig. 7.3). This resulted in
the separation of the bands data into 20 band groups shown in Fig. 7.3 named Band Groups 1 to
20. The smallest proteins were in Band Group 1 and the largest proteins in Band Group 20. While
Band Groups 18, 19 and 20 consisted of proteins larger than the largest molecular weight marker
at 200kDa, and the molecular weight of these bands has therefore been extrapolated and cannot be
established with any certainty, the presence of these larger protein bands were retained for analysis
as the presence and intensity of the bands was important for further interpretation rather than the
accurate molecular weight.
In order to compare between individual extracts run on different gels, the relative band frequencies
and band volumes (concentrations) were calculated for each individual:
Fig. 7.2. Histograms of all protein bands identified across the harbour porpoise samples
shown in green (n = 32) and the balaenopterid samples shown in blue (n = 10). These are
broken down into 1 kDa bins (left), and 5 kDa bins (right). A total of 439 and 97 bands were
identified across the harbour porpoise and balaenopterid individuals respectively. The largest bands
were at 366 kDa and 271 kDa for the harbour porpoise and balaenopterid individuals respectively,
while the smallest were at 9 kDa and 10 kDa for each species group.

Chapter 7 : Quantitative Blubber Proteomics
148
Relative Frequency: The number of bands within a band group (e.g. Band Group 3; the number of
bands between 16-20kDa in size detected for that individual), divided by the total number of bands
detected for that individual (e.g. 17 bands were detected for the first individual shown in Fig. 7.1).
This takes into account the fact that more bands were detected in some individuals than others.
This relative frequency for each of the 20 Band Groups was calculated across all individuals and
expressed as a proportion.
Relative Volume: The sum of the calculated volumes of the individual bands within a Band Group
(e.g. Band Group 3; sum of the volumes calculated for any bands between 16-20kDa in size for an
individual), divided by the total sum of the volumes calculated for all the bands detected for an
individual. This is to overcome the confounding factor that the extracts from different individuals
had varying total protein concentrations when loaded onto the gel.
Fig. 7.3. Annotated image of a 1D SDS-PAGE gel. The molecular weight markers are shown
in the lane on the left of the image, and the band groups of different molecular weights grouped
together for analysis, named Band Groups 1-20, shown on the far left of the figure.

Chapter 7 : Quantitative Blubber Proteomics
149
3.5. Statistical Analysis
Non-metric Multidimensional Scaling (NMDS): The objective of Non-Metric Multidimensional
Scaling (NMDS) is to group data points into clusters of similar points based on a few explanatory
variables so that they can be visualized and interpreted. Here, the aim was to investigate whether
there were clusters of individuals that grouped together based on the frequency and volumes of
different protein band groups measured in their SDS-PAGE profiles. Then, where clusters were
observed, which of the qualitative variables listed in Table 2 could explain the observed groupings.
Similar to Principal Component Analysis (PCA), the aim of NMDS is to represent the original
position of data in multidimensional space, as accurately as possible, using a reduced number of
dimensions that can be easily plotted and visualized. PCA uses Euclidean distances which are the
straight-line distances between two points in Euclidean space. However, these are sensitive to total
abundances and absences. Unlike PCA, NMDS relies on rank orders for ordination. These rank
orders are non-metric which omits some of the issues associated with using absolute distances, and
allows for a much more flexible technique that can be used on a variety of different kinds of data,
especially on data containing absences. The SDS-PAGE band groups data contained absences as
not all protein band groups were present across the individuals sampled, which makes NMDS a
suitable analytical approach as it is invariant to changes in units, it can recognize differences in
total abundances when relative abundances are the same, and it is unaffected by zero-inflated data.
NMDS is an iterative procedure which takes place over a number of steps, the first of which is to
define the original data point positions in multidimensional space. The number of reduced
dimensions are then specified, typically two, and then an initial configuration of the data in a 2-
dimentional (2D) space is constructed. The distances in this initial 2D configuration are regressed
against the measured distances in multidimensional space. The disagreement or difference
between the distances in the reduced, 2D space compared to the distances calculated in the
complete multidimensional space is called the ‘stress’. The aim is to optimise the stress, i.e. reduce
the value as much as possible, by increasing the number of dimensions (e.g. from two to three) so
that the configuration matches the data positions in the full multidimensional space as much as
possible. To run the NMDS, the function ‘metaMDS’ from the ‘vegan’ package in R (version
3.1.3) was used to investigate the band group frequency data, and then to investigate the band
group volume data for the four species groups separately; stranded harbour porpoises, stranded
balaenopterids, minke whale biopsies and humpback whale biopsies.
Firstly, the points in 2-dimensions with a maximum of 30 iterations were assessed. The ‘stress’
value was assessed for the 2D model. Generally, a stress value of < 0.05 provides an excellent
representation in reduced dimensions; between 0.05 - 0.1 is very good; 0.1 - 0.2 is good; > 0.3
provides a poor representation (Cox and Ferry, 1993). Secondly, this process was then repeated
for the points in 3-dimensions to assess if the stress value could be further reduced and the
representation of the points improved. If the stress values were reduced upon introducing a third
dimension to the model, it was concluded that it was a better fit at capturing the variation in the
data. Any clustering observed in the data by the qualitative variables listed in Table 7.2 was then

Chapter 7 : Quantitative Blubber Proteomics
150
assessed visually to determine if any of the variation in the band frequency and band volume data
can be explained using these variables of interest.
Linear Regression Models: For the harbour porpoise and humpback whale data, the two largest
datasets for analysis, linear regression models were used to assess the relationships between the
presence / absence of each band group with three dependent variables: 1) Morphometric condition
index (mass / length2 (Chapter 1) or Length Standardised Surface Area Index (LSSAI) (Chapter 4)
for the harbour porpoises and the humpback whales, respectively). 2) Blubber cortisol
concentration (Chapters 3 and 4). 3) Total protein yield. The presence / absence of the different
band groups was chosen to include in linear regression models as the explanatory variables of
interest because the relative frequency and volume data are unsuitable for this type of analysis.
This is because proportion data like these are automatically negatively correlated with each other,
they do not all have the same denominator and there are a lot of zeros in the data.
Here, a null model containing no explanatory variables for each of the three dependent variables
for the harbour porpoise and the humpback whale dataset separately was generated. A full model
was also generated that included each of the 20 band groups as a binary factor with 0 representing
band absence and 1 representing band presence. Then, the step function in the car package was
used as a forwards variable selection tool by specifying “direction = forward” whereby the
variables listed in the full model were added to the null model one at a time. At each step, each
variable that is not already in the model is tested for inclusion in the model. The most significant
of these variables are added to the model based on a reduction in AIC compared to the null model
and then subsequent models with important variables included. If the AIC is not reduced upon
addition of a new variable, the variable is discarded as it does not contribute to explaining
additional variation in the data. Forwards model selection was chosen here to better assess
inclusion of such a large number of explanatory variables (20 band groups) with a relatively small
dataset of individuals (32 harbour porpoises and 42 humpback whales). The band groups retained
as being important were used for the final model interpretation for the effect of their presence /
absence on each of the morphometric condition indices, blubber cortisol concentration and total
protein yield for both species groups.

Chapter 7 : Quantitative Blubber Proteomics
151
Table 7.2 - Variables used to explain variation in the band groups data for each species
group. Qualitative variables used to investigate variation between individuals for band group
relative frequency and relative volume data for all four species groups. Quantitative variables used
to investigate variation in band group presence / absence for the harbour porpoise and humpback
data only.
Porpoises
(n = 32)
Balaenopterids
(n = 10)
Minke whales
(n = 10)
Humpback
whales (n = 42)
Qualitative
Variables
Gel Number
Sex
Age Class
Rep. Status1*
Species
COD
Area
Season
Quantitative
Variables
Mass/Length2
Cortisol2*
LSSAI3*
Total Protein
1* Rep. status refers to reproductive status as either a mature or immature male, or an immature,
lactating, pregnant or resting female based on visual observations of females with calves and the
concentrations of progesterone measured in the biopsies of humpback whales (Chapter 4).
2* Cortisol refers to blubber cortisol concentration measured in either the outer layer of blubber in
harbour porpoise samples (Chapter 3) or the blubber biopsies collected from the humpback whales
(Chapter 4).
3*LSSAI refers to the Length Standardised Surface Area Index estimated from photogrammetry
measurements obtained from images captured by an unmanned aerial vehicle of humpback whales
(Chapter 4).

Chapter 7 : Quantitative Blubber Proteomics
152
4. RESULTS
4.1. Total Protein Yield and Extraction Variability
For the 42 samples from both the stranded harbour porpoises and balaenopterids, there was a range
in total protein yield from 166.0 ng/g to 5426.4 ng/g (Fig. 7.4), with an average of 2735.8 ±
190.9ng/g. The extraction coefficient of variation (%CV) ranged from 2.2% to 66.6% with an
average of 21.9 ± 2.7% for the 34 stranded animal samples extracted in duplicate. There was no
difference between the duplicate % extraction CVs between the harbour porpoise and the
balaenopterid samples (ANOVA; df = 1, F = 1.33, p = 0.72). A total of 69 biopsy samples were
extracted in total from both the humpback whales and the minke whales. There was a range in the
total protein yield from 64.9 ng/g to 9305.4 ng/g (Fig. 7.4) with an average of 2882.2 ± 249.9 ng/g,
similar to the stranded animal samples.
4.2. Sample Degradation through Storage
Of the 59 biopsy samples from humback whales that were used for total protein extraction and
quantification, the results from 42 of them were used for protein band group analysis. While there
were no statistical differences between the total protein yields of samples collected across the
different years (ANOVA; df = 5, F = 1.085, p = 0.38), the older samples showed an overall lower
yield (Fig. 7.5) as well as generally poorer band visualisation and separation (Fig. 7.6). The 17
Fig. 7.4. Boxplots showing the raw data (points), the median and the inter-quartile range
for the total protein content extracted from all four species groups. There were no
differences between the average protein content extracted between the four groups (ANOVA;
df = 3, F = 1.59, p = 0.21).

Chapter 7 : Quantitative Blubber Proteomics
153
samples that were excluded from the analysis were from 2011 (n = 3), 2012 (n = 8), 2013 (n = 2)
and 2014 (n = 4) as they showed a combination of lower total protein content, and poor band
separation. Thus, band group profiles in these samples likely represented the products of tissue
degradation through storage rather than differences in the protein content of the tissue between
individuals. There was no consistent pattern with all samples from one year showing poorer band
separation compared to others however, which is why some of the oldest samples were still used
for interpretation. Other factors, not accounted for here, therefore also likely affected the extent to
which the samples were affected by time in storage.
Fig. 7.5. Boxplot of total protein content measured in humpback whale biopsies collected
between 2011 and 2017. The overall increase in total protein content from the 2011 – 2017
samples could indicate some protein degradation and loss with increased time in storage.

Chapter 7 : Quantitative Blubber Proteomics
154
4.3. Non-Metric Multidimensional Scaling (NMDS)
Stranded Animals Samples: Results of the NMDS analysis for the harbour porpoise and the
balaenopterid band group datasets showed that using 3 dimensions produced better fitting (lower
stress values) models compared to using just 2 dimensional scaling. Specifically, the harbour
porpoise NMDS results data showed no clustering of individuals by sex, age class or cause of
death, but did show some clustering of individuals based on the gel number on which they were
run (Fig. 7.7). Overall, there were differences between gels 1 and 4 that showed similar band group
patterns across individuals, and gels 2, 3, 5 and 6 that shared similar band group characteristics
(Fig. 7.7). Again, there was no clustering by sex, age class or COD for the balaenopterid data.
There was limited clustering by species for the band group frequency data, whereby the minke
whales were more similar (more tightly clustered) than the fin whale and humpback whale
samples, although this was a small sample size (Fig. 7.8). As all samples were run on the same gel,
there were no differences between different gel trials to be investigated.
Fig. 7.6. 1D-SDS PAGE image of total protein extracts from humpback whale biopsies
collected in 2011, 2016 and 2017. The 2011 extract shows lower protein content and poorer
separation and visualisation of extracted proteins indicative of sample degradation. *BSA
Standards: Bovine Serum Albumin standards used for protein band volume quantification. *MW
Markers: Molecular Weight Markers used to determine the molecular size of protein bands.

Chapter 7 : Quantitative Blubber Proteomics
155
Biopsy Samples: For the dataset of 10 minke whales, season was the only qualitative covariate to
include in the analysis. For this dataset, using 3 dimensions did not reduce the NMDS stress values,
so 2 dimensional scaling was used and results are shown in Fig. 7.9. There was no apparent
clustering of these 10 individuals that consisted of ‘early’ (June and July) or ‘late’ (August and
September) feeding season samples (Fig. 7.9). 3D NMDS results showed that, similar to the
Fig. 7.7. 3D NMDS results for the harbour porpoise band group frequency (left) and volume
data (right). There is some clustering by gel number. Band groups did not cluster by any other
variable investigated.
Fig. 7.8. 3D NMDS results for the balaenopterid band group frequency (left) and volume
data (right). There is limited clustering by species. Band groups did not cluster by any other
variable investigated.

Chapter 7 : Quantitative Blubber Proteomics
156
harbour porpoise data, the clustering of band group frequencies and volumes in the humpback
whale biopsy profiles was explained most strongly by the gel number on which the sample was
separated (Fig. 7.10), and not by any of the other variables investigated. This clustering was most
apparent for the band group volumes data (Fig. 7.10), but was not as strong as seen in the harbour
porpoise data as there was still considerable overlap between extracts from individuals run on
different gels (Fig. 7.10).
Fig. 7.10. 3D NMDS results for the humpback whale biopsies band frequency (left) and
volume data (right). There was limited, clustering by gel number. Individuals did not cluster by
any other variable investigated.
Fig. 7.9. 2D NMDS results for the minke whale biopsies band group frequency (left) and
volume data (right). Neither show any clear clustering patterns.

Chapter 7 : Quantitative Blubber Proteomics
157
4.4. Linear Models
Plots of the band group frequencies and volumes with the morphometric condition indices
estimated for the harbour porpoises and the humpback whales are shown in Fig. 7.11. While there
was no obvious trend in the frequency or volume of certain band groups with increasing or
decreasing condition, there appear to be differences in the two datasets in terms of the band groups
that appeared more frequently and made up a larger proportion of the frequency and volume data
than others (Fig. 7.11). For example, the 120-160kDa band group made up a large proportion of
the data in the harbour porpoises, but not in the humpback whales (Fig. 7.11).
Harbour porpoise linear model: Forwards model selection showed that including the band group
data did not improve model fit compared to the null model to explain variation in either
mass/length2 or blubber cortisol concentration. The inclusion of the presence/absence data for 10
of the 20 band groups improved model fit for total protein yield, six of which were individually
statistically significant (p values all < 0.05), and explained almost 60% of the variation in the data
(Table 7.3). Linear model checks including residual plots and checks for outliers showed that no
model assumptions had been violated for this final model. This indicates that the total amount of
protein extracted influenced the presence of certain band groups rather than individually relevant
biological covariates.
Table 7.3 - Linear model selection results for the three dependent variables modelled against
the band group presence / absence data.
Species Dependent
Variable
Sample
Size
Model R2
Harbour
porpoises
Mass / Length2
32
Null
NA
Cortisol Concentration (ng/g) 20 Null NA
Total Protein Yield 32 B1*; B2; B3*; B6*; B8*;
B9*; B12*; B15; B18; B19
0.59
Humpback
whales
LSSAI 24 B18* 0.16
Cortisol Concentration (ng/g) 42 B4; B7*; B10*; B14* 0.62
Total Protein Yield 42 Null NA

Chapter 7 : Quantitative Blubber Proteomics
158
Fig. 7.11. Relative band frequencies and volumes plotted against the body condition index for the harbour porpoises (top panel) and
humpback whales (bottom panel). Points are coloured by individual with the size of the points representing the relative frequency and volume
for that individual. There was no clear clustering or patterns of band frequencies or volumes with animals of increasing or decreasing condition.

Chapter 7 : Quantitative Blubber Proteomics
159
Humpback whale linear model: Unlike for the harbour porpoise dataset, forwards model
selection showed that including the band group data did not improve model fit for the null model
to explain variation in total protein yield (Table 7.3). The total protein extracted therefore had a
lesser impact on the presence of the band groups in the extracts. Inclusion of the presence / absence
data for band group 18 alone improved the fit of the LSSAI model, and while it was significant (p
= 0.04), it was still a poor fit to the data with an R2 of 0.16 (Table 7.3). Model checks showed
strong clustering in the model residual plots, suggesting that other factors, not included in the
model, were strongly affecting the LSSAI data and the model was thus a poor fit to these data.
Finally, the inclusion of band groups 4, 7, 10 and 14 significantly improved the fit of the blubber
cortisol concentration model, explaining 62% of the variation in the data (Table 7.3). These
correspond to proteins of sizes between 21-25kDa, 36-40kDa, 51-55kDa and 91-105kDa for each
band group, respectively. Specifically, the presence of band groups 4, 10 and 14 were seen in
animals with lower blubber cortisol concentration, and band group 7 was seen in animals with
higher concentrations (Fig. 7.12). Linear model checks including residual plots and checks for
outliers showed that no model assumptions had been violated for this final model.
The next step was to assess what kinds of proteins were identified in these four band groups of
interest from the nLC-ESI-MS/MS protein identification data (Chapter 5). The proteins identified
in gel bands from the minke whale blubber extracts were used for comparative analyses. The
proteins identified in the gel bands that fell within these four band groups were collated, and the
functions of these identified proteins were used to generate functional profiles of each band group.
Each functional protein class was assigned a proportion based on the total frequency of different
proteins within that band group (e.g. 20% were tissue structure proteins, 5% were vasodilation and
circulation proteins, 10% were immune function and inflammation proteins etc). The proportion
of each of the ten previously described functional groups (Chapter 5) that made up the proteins
identified in the four band groups of interest was then compared to the full identified protein dataset
from the minke whale samples (Chapter 5). The relative proportion change in abundance of the
proteins within each functional group between the full dataset and each of the four band groups
was calculated (e.g. a change in the proportion of cell structure proteins from 10.6% in the full
dataset to 12% in band group 4 is an overall 13.2% increase in band group 4).
As a pleiotropic hormone, cortisol is known to increase lipolysis, mobilise amino acids, and
increase circulating concentrations of plasma proteins (Bergendahl et al., 1996; Exton et al., 1972).
Changes in the relative abundance of proteins involved in lipid metabolism and amino acid
metabolism are therefore of particular interest here in the context of differences in measured
cortisol concentrations. As band groups 4, 10 and 14 are found in animals with lower cortisol
concentrations (Fig. 7.12), we would expect either no change in the relative abundance of proteins
involved in amino acid metabolism and lipid metabolism, or lower relative abundances in these
groups compared to the full dataset. In contrast, as band group 7 is found in animals with higher
cortisol concentrations (Fig. 7.12), an increase in lipid metabolism and amino acid metabolism
related proteins would be expected.

Chapter 7 : Quantitative Blubber Proteomics
160
Changes in the relative abundance of proteins in these two functional protein groups were seen
across all four band groups of interest, ranging from a ~40% decrease to a ~100% increase (Fig.
7.13). Of particular interest, as expected, was a 37.3% decrease in lipid metabolism related proteins
in band group 4 with low cortisol concentrations (n = 50 proteins identified). A 34.7% and 99.9%
increase in amino acid metabolism related proteins and lipid metabolism related proteins
respectively in band group 7 with high cortisol concentrations (n = 42 proteins identified) (Fig.
7.13). In band groups 10 (n = 70 proteins identified) and 14 (n = 93 proteins identified) there were
smaller increases and decreases in both functional protein groups of approximately 20% (Fig.
7.13). Variation in the relative abundance of proteins in other functional groups was also seen, but
this is not explored here in relation to the cortisol data as there are likely many other factors that
affect relative abundance of these other proteins.
Fig. 7.12. Termplot for the final linear regression model for blubber cortisol
concentration and protein band group presence / absence in humpback whale biopsies:
lm(Cortisol ~ as.factor(B4) + as.factor(B7) + as.factor(B10) + as.factor(B14)). The
presence of band groups 4, 10 and 14 are seen in individuals with lower cortisol concentrations,
while band group 7 is seen in individuals with higher cortisol concentrations.

Chapter 7 : Quantitative Blubber Proteomics
161
Fig. 7.13. Percentage change in relative abundance of proteins within each functional group
compared to the full identified proteins dataset for band groups 4, 7, 10 and 14. Of particular
interest were changes in the abundance of proteins involved in amino acid metabolism and lipid
metabolism as these processes are known to be affected by circulating cortisol concentrations. The
largest differences were seen in band group 7 with in an increase in the relative abundance of both
of these functional group proteins.

Chapter 7 : Quantitative Blubber Proteomics
162
5. DISCUSSION
This work represents a first step to explain and quantify the natural variability in the protein content
of blubber tissue extracts. The variability is investigated in the context of different physiological
states and life history parameters in attempts to develop this approach for the identification of
useful protein biomarkers and to start to better understand whole tissue function and metabolism.
Sample Storage and Processing Confounding Factors
In terms of total protein extracted from the tissue samples, while the yield was typically high using
the most efficient extraction method previously identified (Chapter 5), there was still high
extraction variability measured between some of the duplicate samples. Additional sources of
measurement error therefore need to be further evaluated for more robust quantitative inferences
regarding total protein content of individual samples. Of particular interest would be attempts to
better standardise the amount of protein extracted relative to some other marker instead of by
weight of the tissue as this may reduce some of the variability. Further work to investigate the
sources of this variability should be prioritised.
Three sample processing issues have also been identified that affect the protein band group profiles
visualised on 1D SDS-PAGE gels. Firstly, time in storage seems to impact both the total amount
of protein extracted from the samples, and also the quality of the protein band profile separation
and visualisation on the gels. While the effects of freezing on blubber tissue have yet to be
investigated fully, freezing meat tissue has been shown to cause lipid oxidation by lipid free radical
generation which results in the production of toxic compounds (Morrissey et al., 1998). Oxidation
through freezing has also been shown to change proteins through the modification of amino acid
side chains, the formation of protein polymers, the reduction of solubility, an increase in carbonyl
groups, a change in amino acid composition, an increase in proteolytic susceptibility and protein
fragmentation or aggregation (Decker et al., 1993; Levine et al., 1990; Xiong, 2000). It is likely
that some or all of these processes have occurred and altered the proteins in the older biopsy
samples, which explains why the total protein yield and band profiles have been affected here.
Additional factors unaccounted for throughout this analysis, such as time between sampling and
sample freezing, any defrost-refreeze cycles and sample storage in plastic vials, glass vials or
aluminium foil, for example, likely also affect tissue quality over time. In the future, in order to
better account for these potential changes, and thus better interpret results from frozen samples,
protein oxidation can be monitored as a means of assessing protein alterations by measuring the
formation of carbonyl groups and the decrease in sulphydryl groups (Stadtman, 1990). It is
therefore recommended that for protein content investigations, biopsies should be processed as
soon as possible because prolonged storage at -200C appears to result in measurement artefacts
associated with tissue degradation.
Secondly, the presence / absence of certain band groups in the harbour porpoise dataset helped to
explain the variation in the total protein yield of different samples rather than other biologically
relevant variables. The efficiency of the extraction in terms of how much protein is successfully

Chapter 7 : Quantitative Blubber Proteomics
163
extracted from the tissue therefore appears to have strongly influenced the band group profiles for
different individuals. This suggests that this method should be further developed to improve
extraction consistency. While there were no clear trends with larger or smaller proteins being lost
when less protein was extracted, some of the least abundant or least soluble proteins may not
appear in these extracts.
There were no relationships between total protein yield and the presence / absence of different
band groups in the humpback whale dataset, however. One possible explanation is that these were
all outer blubber layer only samples, so the homogenisation and processing of the tissue was
perhaps more uniform for these samples than for the full depth harbour porpoise samples.
Additional sources of variation are potentially introduced depending on the relative proportions of
the outer, middle and inner blubber layers that are included in the subsample. To evaluate this
possibility, the difference in total protein content between blubber layers in full depth blubber
samples should be investigated to assess this as a potential source of variation. The more
vascularised inner blubber layer likely contributes more circulatory proteins to the blubber sample
extracts, and is therefore a greater source of variability compared to the outer layer alone, for
example. Another potential reason for the lack of relationship between total protein yield and the
presence / absence of different band groups in the humpback whale biopsy samples, could be that
the larger sample size of this dataset meant that the processing errors and sources of variation
became more negligible compared to the smaller harbour porpoise dataset.
Thirdly, there appears to be some measurement error associated with running the 1D SDS-PAGE
gels themselves. The harbour porpoise and the humpback whale samples were run on multiple
gels, and the NMDS results showed that there was some clustering of individuals by gel number
for both of these datasets. The humpback whale dataset showed this clustering to a far lesser extent.
This suggests that while the running of the gels was standardised as much possible, it appears that
there are sources of measurement variability inherent in this method which determine, to some
extent, the band group profiles seen across individuals. For further development of this method,
the same sample extracts should be assayed multiple times on different gels in order to identify
and quantify the error associated with different 1D SDS-PAGE trials.
Band Group Profiles and Qualitative Variables
For all four datasets, there was no clustering of individuals based on the relative frequency or
volume of their band group profiles by sex, season, cause of death, reproductive status, age class,
area or species. As well as the sample processing sources of error and confounding factors
mentioned above, another potential reason for the lack of any relationships in the band group
profiles and the qualitative variables of interest is that these data are not of fine enough resolution
to detect subtle changes in individual protein presence and abundance. The nLC-ESI MS/MS
protein identification results from the harbour porpoise and the minke whale samples showed that
each individual protein band is a mixture of proteins and peptides of the same size, not a single
protein. This is because the extracts are a complex mixture of proteins of different sizes from
different cell types. Then, for analysis purposes, the band groups are made up of a number of

Chapter 7 : Quantitative Blubber Proteomics
164
individual protein bands. This means that a band group can potentially contain a huge variety of
different proteins with different functions (Fig. 7.14). Thus, these band group pattern analyses are
a summation of many different proteins, so subtle changes in certain proteins that are affected by
the qualitative life history variables of interest are likely lost through this coarse analysis.
Fig. 7.14. 1D SDS-PAGE gel image to show the grouping of individual bands into band
groups with associated identified proteins. The band groups numbered 1 to 20 used for
NDMS analysis are shown on the left of the figure with protein identification results for band
groups 8 and 16 from the harbour porpoise dataset of identified proteins shown to the right as
examples. A total of 38 and 14 different proteins were identified in band groups 8 and 16
respectively. The contribution of different proteins that make up various functional groups are
indicated.

Chapter 7 : Quantitative Blubber Proteomics
165
Band Profiles and Quantitative Variables
The inclusion of the presence / absence data of the protein band groups did not improve model fit
for the morphometric body condition (mass/length2) or the blubber cortisol concentration models
for the harbour porpoise dataset, and thus did not contribute to explaining any of the variation in
these data. As discussed above, it appears that sources of variation in these data are largely driven
by variation in tissue processing and analysis. Similarly, the morphometric body condition index
(LSSAI) model for the humpback whales was not improved by the inclusion of band group
presence/absence data. This could be because this was a small sample size of just 24 individuals
with these matched data, so there was not a wide enough range in condition estimates between
these individuals, and / or, as previously discussed, the protein bands data is not at a fine enough
resolution to detect significant changes with overall physiological state. However, the presence /
absence data for 4 band groups significantly improved the fit of the blubber cortisol concentration
linear model. In a semi-quantitative assessment to explore which classes of proteins could
potentially explain why the inclusion of these bands groups was important, changes in the relative
abundance of different protein functional groups within these groups compared to the full dataset
of identified proteins were assessed.
Overall, cortisol is a catabolic hormone which acts to increase the availability of all fuel substrates
by mobilisation of glucose, free fatty-acids and amino acids from endogenous stores (Dinneen et
al., 1993; Djurhuus et al., 2002). Therefore, high concentrations of cortisol seen in individuals
with band group 7 in their profiles were expected to be correlated with increases in the proportion
of proteins involved in lipid metabolism and amino acid metabolism. These expected increases
were seen for the proteins identified within this band group, together with a decrease in lipid
metabolism related proteins in band group 4 which was associated with individuals with low
blubber cortisol concentrations. While this only provides a semi-quantitative investigation of the
relationships between protein functional group abundance and the concentrations of other
endocrine markers of interest, it does show that the application of multiple analytical methods
together could lead to a better understanding of whole tissue function.
Future Directions
An important next step in the identification of different proteins and / or combinations of different
proteins that can act as biomarkers of overall health and condition in cetacean blubber, is to employ
a finer scale analysis. This can be achieved by using 2 dimensional PAGE to separate the proteins
in blubber extracts. 2D-PAGE separates complex mixtures of proteins using two different
properties of the proteins. In the first dimension, proteins are separated by their charge called the
isoelectric point, and in the second dimension they are separated by their relative molecular weight
(Saraswathy and Ramalingam, 2011). 2D PAGE can thus separate several thousand individual
proteins in one gel. In addition, significant improvements have been made in 2D PAGE technology
with the development of 2D fluorescence difference gel electrophoresis, which can be used to
reduce gel-to-gel variations (Saraswathy and Ramalingam, 2011). Differentially expressed
proteins can therefore be visualised by investigating different protein spot patterns and can then

Chapter 7 : Quantitative Blubber Proteomics
166
be subsequently identified by mass spectrometric methods as with the 1D PAGE (Chapter 5). This
would allow a higher resolution analysis of individual proteins or classes of related proteins e.g.
heat shock proteins or adipokines that change in relative abundance with physiological state or life
history stage.
As well as 2D-PAGE, trialling other extraction methods that are compatible with downstream
protein quantification techniques should be prioritised. For example, the MinuteTM Total Protein
Extraction Kit (Invent Biotechnologies Inc., AT-022, Plymouth, USA) for total protein extraction
from animal cultured cells and tissues produces an extract that is directly compatible with EIA and
ELISA quantification of specific proteins. The use of this kit was assessed here for overall total
protein yield in comparison to the RIPA cell lysis and extraction buffer previously used, and was
found to extract similar amounts of protein from blubber tissue (data not shown). However, when
these extracts were used to quantify adiponectin concentrations, as one of the main adipokine
hormones identified across multiple sample extracts by nLC-ESI MS/MS (Chapter 5), the ELISA
trials did not pass quality assessment and control checks (data not shown). Further work is
therefore needed to assess the cross-reactivity of cetacean adiponectin, and other adipokines of
interest, with commercially available ELISAs, as well as the compatibility of the total protein
extracts themselves with standard quantification assays.
Finally, another avenue of current research is to adopt a transcriptomic approach to examine
changes in gene expression profiles in blubber tissue that can identify important markers and
regulators of lipid metabolism and energy homeostasis (Khudyakov et al., 2017; Martinez et al.,
2018). Specifically, using a non-targetted RNA sequencing approach to examine global gene
expression profiles means that investigations into the molecular mechanisms involved in various
physiological processes are not limited to a small set of target genes that are known to be important
in terrestrial animal models (Martinez et al., 2018). The identification of upregulated and
downregulated genes during different physiological states can then provide an additional resource
for investigating and understanding the extreme metabolic adaptations of cetaceans, and other
marine mammals, as well as markers of overall health and body condition.

Chapter 8 : General Discussion
167
CHAPTER 8: GENERAL DISCUSSION
1. Synopsis
1.1. Assessing Standard Indices of Condition
Despite its importance as a good predictor of fitness, there is currently no consensus on the ‘best’
way to estimate the overall body condition of cetaceans. Using data from stranded animals, I
investigated morphometric indices of body condition across three cetacean families. These indices
are commonly used in terrestrial ecology, and I identified the most appropriate indices as
mass/length2 and girth/length (where mass data were unavailable). Blubber thickness, the most
commonly used index in cetaceans, was a consistently poor indicator of condition across all three
families. Interestingly, beaked whales showed very little variability in their apparent energy stores.
I used these morphometric indices to assess other potential markers of condition where a ‘ground
truthing’ approach was required to evaluate novel biomarker methods.
Blubber lipid content was investigated as another commonly used condition index in cetaceans.
Again, the variation in blubber lipid content was assessed across three cetacean families. Blubber
thickness was not correlated with lipid content. This is likely because the blubber must maintain a
certain thickness to fulfil its other roles, separate from energy storage, in thermoregulation,
streamlining and buoyancy, for example. Therefore, the extent to which blubber can be reduced in
thickness is limited. Together, the results from Chapters 1 and 2 demonstrate that using blubber
thickness as a standard measure of condition should be avoided.
The lipid content analysis showed that blubber lipid content is not a suitable biomarker of body
condition in these species for two reasons. Firstly, layering through the tissue means the outer layer
accessible for biopsy sampling is not representative of the lipid available for mobilisation through
the full blubber depth. Secondly, blubber lipid content was not correlated with morphometric
indices of body condition. In keeping with the results of Chapter 1, there was little variation in
lipid content both within and between the ziphiid samples, further suggesting little variation in
energy stores. There may be trade-offs occurring between the different functions of blubber
(energy storage, maintaining hydrodynamic shape, controlling buoyancy, contributing to water
balance and preserving thermoregulatory properties) in these deep-diving species. The idea that
the main role of the blubber is to act as an energy storage depot across all cetacean species is
therefore challenged in Chapters 1 and 2. Its other roles may be of equal or even greater importance
in some species depending on their reliance on endogenous energy stores during parts of their life
cycle.
1.2. Investigating Novel Biomarkers of Condition
Cortisol is the main glucocorticoid hormone known to be important for the regulation of lipolysis
and lipogenesis in mammals. As it has been previously suggested to be involved in the control of
fasting metabolism in pinnipeds, it appeared to be a good candidate as a condition marker. Cortisol

Chapter 8 : General Discussion
168
was extracted and concentrations were measured in the blubber of stranded harbour porpoises and
balaenopterids. Blubber cortisol concentrations showed a negative relationship with morphometric
indices of body condition. It is suggested in Chapters 3 and 4, that concentrations of this hormone
in the tissue are not a marker of an acute stress response, but are an integrated marker of
physiological state. A long-term dataset of biopsy samples from female humpback whales on their
feeding grounds in the North Atlantic showed significant inter-annual variation in cortisol
concentrations.
Pregnancy rates were estimated for this population based on blubber progesterone concentrations.
There was some evidence that inter-annual variation in pregnancy rates were negatively correlated
with cortisol concentrations. Specifically, years with lower blubber cortisol concentrations
corresponded to higher overall pregnancy rates. I hypothesise that this could be as a result of
changing environmental conditions between years. The individual variability was probably a result
of the multifunctional nature of cortisol that was not explained by differences in reproductive state,
season, and a morphometric index of body condition obtained from aerial photogrammetry image
analysis. Cortisol concentrations likely provide a ‘snap shot’ of the metabolic state of the tissue at
the time of sampling.
The use of cortisol concentrations as a single marker to measure a ‘snap-shot’ in time highlights a
general question of the applicability of using a single condition index to assess and compare
animals across a range of life history stages or even different populations and ecotypes. Limiting
the use of certain measures to compare within age classes, life-history stages or different
environments may be more informative. In terms of life-history stage variability, using a single
index with the same numerical value to compare the overall body condition of an individual at the
end of a breeding season, to another individual the end of a feeding season, is meaningless unless
the context in which the animal is sampled is considered. Specifically, animals should have
accumulated significant energy reserves by the end of the feeding season, so two animals sampled
at these different life-history stages with the same condition index value, does not mean that they
are equally healthy. In terms of population-level variability, humpback whales tagged with suction
cup tags in the Gulf of St Lawrence had higher overall body density values (indicative of lower
total body fat stores), suggesting that they were in poorer body condition, compared to whales
instrumented with the same tags in Northern Norway (Aoki, pers. comm.). However, differences
in the water salinity, and therefore the density of these two aquatic environments, could have led
the whales in these separate populations to adapt to an ‘optimum’ body density, close to neutral
buoyancy, in order for locomotion, and therefore foraging, to be as efficient as possible in each
environment. Thus, the use of a single body condition index, with a ‘one size fits all’ approach,
does not apply in many cases as there are a number of other factors to consider when interpreting
these estimates. For these reasons, there should be a movement towards multiple measures that,
when integrated together, can provide composite indicators of body condition and overall health
in order to add more detailed and robust information to condition index estimates.
Chapter 8 : General Discussion
169
Multiple other blubber biomarkers of interest that, together, reflect overall health and condition
were investigated. The proteome of cetacean blubber tissue was explored for the first time. In
Chapters 5 and 6, I developed a method for total protein extraction and applied it to samples from
stranded animals and biopsies from live animals. Over 400 different proteins were identified and
classed into ten functional groups based on their involvement in different physiological processes
in terrestrial species. The most abundant proteins were involved in cell function and metabolism,
immune response and inflammation, and lipid metabolism. The identified proteins are thought to
have been secreted from the various cell types within the tissue, and to have accumulated from the
circulation. These proteins capture the range of cellular and physiological processes experienced
by individuals at the time of sampling. Protein band profiles generated through 1D SDS-PAGE
across individuals of different ages, sexes, reproductive states, cause of death classes,
morphometric body condition and species were compared. Analysis did not reveal any protein
bands, or patterns of protein bands that explained the individual variation in protein profiles.
There was some evidence that the presence and absence of a number of protein bands were
correlated with blubber cortisol concentrations in biopsy samples from humpback whales. These
bands showed relative increases and decreases in lipid metabolism and amino acid metabolism
compared to the full dataset of identified proteins. Using multiple analytical approaches, endocrine
markers, like cortisol concentrations, can potentially be linked to downstream changes in protein
abundance. A finer scale approach, using 2D PAGE for example, is necessary to identify individual
proteins or classes of proteins that vary in relative abundance as a function of physiological state.
The importance of furthering this proteomic approach is two-fold: Firstly, it could improve our
understanding of tissue function, and its involvement in animal physiology by assigning novel
roles to marine mammal blubber similar to those identified in the adipose tissue of other mammals.
These include the regulation of appetite and energy balance, immune system and inflammatory
responses and nutrient transport for example. Secondly, it could lead to the development of a suite
of biomarkers that can be used as tools to better assess the health of live individuals though remote
blubber biopsy sampling.
2. The Value of Strandings Scheme Data
One common theme through this work is that these method development and validation approaches
would not have been possible without the samples and data provided by the Scottish Marine
Animal Strandings Scheme. Trends in marine mammal stranding rates can provide useful
information on life history parameters, seasonal and spatial species distribution, species
abundance, human-induced mortality rates and disease (Gulland and Hall, 2007; Prado et al.,
2016). Analysis of these spatial and temporal trends have been used with the aim of developing
cost-effective ways of monitoring at-sea cetacean populations in order to provide indicators of
conservation status, and thus focus conservation efforts to drive policy (McFee et al., 2006; Siebert
et al., 2006).
As well as demographic data, necropsy data from stranded animals have been used to assess diet
(Gannon et al., 1997; Santos et al., 2004), and contaminant concentrations in top marine predators

Chapter 8 : General Discussion
170
(Jepson et al., 2016; Law et al., 2012). The increased risk of mortality from infectious disease
associated with high contaminant burdens has also been estimated from stranded animals (Hall et
al., 2006). Strandings scheme data are vital for investigations of unusual mortality events and mass
strandings. For example, examinations of carcasses and tissue analyses have linked unusual
mortality events to harmful algal blooms (Fire et al., 2011; Lefebvre et al., 1999; Scholin et al.,
2000), and the Deepwater Horizon oil spill (Venn-Watson et al., 2015; Williams et al., 2011).
Studies of the gas bubble-associated lesions found in mass-stranded beaked whales following
naval exercises have provided a possible explanation of the relationship between anthropogenic,
acoustic (sonar) activities and the stranding of these deep diving animals (Fernández et al., 2005;
Jepson et al., 2005). Finally, a collaborative effort and coordination of standings scheme resources
across five countries allowed an international and comprehensive investigation into the largest
sperm whale (Physeter microcephalus) mortality event ever recorded in the North Sea in 2016
(Ijsseldijk et al., 2018).
Strandings networks can therefore provide a unique opportunity for data collection on the biology
of different species. Here, blubber tissue samples and accompanying metadata collected by the
SMASS were invaluable for new biomarker method development and validation. The value of
these data were three-fold. Firstly, using samples from stranded animals allowed the collection of
tissue samples large enough for multiple and repeated processing and extraction methods. This
overcomes the small sample mass constraints typical of biopsy samples from live animals.
Importantly, different measures can then be compared for the same individuals. Secondly, samples
from stranded animals allowed sampling of the full blubber depth in order to put the results of
shallow depth, remotely obtained biopsy samples from live animals into context. Variation in
biomarkers of interest through the full blubber depth also provides broader insights into blubber
function and how this differs between species, as seen with variations in lipid content in Chapter
2. Thirdly, the metadata associated with each of the blubber samples are not available for free-
ranging cetaceans. Information in terms of sex, age-class, pathological processes, cause of death
and importantly, morphometric measurements allowed the variation in biomarker results to be put
into life-history context.
These approaches highlight the importance of strandings scheme datasets and sample collection
protocols in terms of the information that can be gathered from these efforts. Here, there were
likely sources of variability in the way in which the morphometric measurements were taken. This
could affect the accuracy of the long-term dataset. Personnel changes for example, or the
difficulties of necropsies being performed under different conditions at the stranding site or in a
laboratory, can introduce sources of measurement error. Sources of variation and measurement
errors will also vary for animals of different sizes. Balaenopterids and beaked whales for example,
are more logistically challenging to handle compared to the smaller porpoises and the delphinids.
As a result, these errors were likely then propagated through downstream analyses. Even though
the morphometric measurements and sampling protocols were standardised, it is not possible to
retrospectively calculate the error associated with the morphometric measurements used here for

Chapter 8 : General Discussion
171
body condition indices calculations. These errors could have masked some relationships between
the morphometric measures and other covariates of interest. Large sample sizes would help to
ensure that while there will always be some measurement error, analyses are as robust as possible.
There may be some biases associated with sampling in terms of how representative dead stranded
animals are of the population as a whole, and therefore how these results can be accurately
extrapolated. In addition, using carcasses for sampling means that there is no control over which
individuals are available for incorporation into any given study. For example, the samples from
stranded balaenopterids in Chapter 2 and 3 were largely from juveniles which meant that robust
analyses of differences between age classes was not possible. Of course, the issues associated with
the representativeness of stranded animals, and the choice of which individuals to target for any
particular study can be overcome by lethal sampling. While lethal sampling can provide huge
amounts of physiological and ecological information about different species and different
populations (Enoksen et al., 2016; Haug et al., 2017; Solvang et al., 2017), there are obviously
ethical considerations and implications of these approaches that are not in keeping with the
research objectives and ethos of many institutes and research programmes. So, even with these
caveats, standings schemes can provide suiTablesamples and accompanying data for the
investigation and validation of novel health markers. These investigations illustrate the need for
their continuation into the future.
3. Improving our Understanding of Cetacean Physiology
The search for body condition biomarkers in cetacean blubber has led to an increased appreciation
of the complexity and pleiotropic nature of blubber tissue, and by extension, further insight into
the extreme physiological adaptations of these animals. Blubber is unique to marine mammals,
and appreciating how its functions may contribute to physiological homeostasis can give us
insights into the development and maintenance of the life-cycles and adaptations of marine
mammals to their environment.
The notion that the blubber’s primary function across all species is to act as an energy storage
depot is too simplistic. Results from Chapters 1 and 2 demonstrate that the relationship between
blubber thickness, blubber lipid content and overall body condition is not straightforward across
different species. The importance of the blubber in terms of providing readily available energy
reserves will likely be balanced with its roles in maintaining other optimal characteristics of the
animals that allow them to occupy a particular ecological niche. The range of physiological
demands on species, as a result of their ecology, will therefore affect the extent to which some
functions are more important than others, and by extension, the extent to which the blubber is able
to change in thickness and lipid content and still retain its structural integrity. A theoretical
representation of this idea is shown in Fig. 8.1.
It appears that beaked whales are a great example of these trade-offs. The lack of variability in
morphometric body condition indices or blubber lipid content shown in Chapters 1 and 2 suggests
that these species may be adapted to live within very narrow physiological constraints, perhaps

Chapter 8 : General Discussion
172
driven by their extreme diving behaviour. Clues for why this may be the case come from previously
published evidence of high wax ester content of the blubber. Other functional roles of the tissue
in thermoregulation and buoyancy control that allow them to make continuous, prolonged, deep
foraging dives (Tyack et al., 2006), unique to only a small number of cetacean species that share
these blubber characteristics (Koopman, 2007), appear to be more important than energy storage.
In contrast, baleen whales are able to take advantage of spatially and temporally separated breeding
and feeding habitats through extreme fasting endurance. These species are therefore uniquely
adapted to survive prolonged fasting periods where they rely heavily on energy reserves in the
blubber.
Other, ‘intermediate’ species between these two extremes include some of the delphinidae family
for example, and a number of pressures likely affect the blubber composition of the animals in this
broad group. For example, hydrodynamic drivers that are responsible for high intensity or ‘sprint’
prey capture behaviours in some species (Aguilar Soto et al. 2008), will affect overall body shape
through the deposition and mobilisation of the blubber to achieve optimum swimming efficiency
(Koopman, 2007). Equally, some species will experience huge seasonal variation in ambient water
temperatures which will dictate the extent to which the blubber layer is increased or reduced, and
its conductance continually altered in line with the animals’ thermoregulatory capacities and/or
requirements (Fougeres et al., 2008; Noren et al., 2009; Koopman, 2007). There are likely very
complex relationships between body size, thermal habitat, diving behaviour, lipid stratification,
blubber thickness, reliance on endogenous energy reserves and overall metabolism that affect the
structural and chemical composition of the tissue.
Marine mammal species that have highly energetically costly life history strategies, including long
distance migrations (Burton and Koch, 1999; Lockyer, 1981), prolonged breeding seasons (Boness
et al., 2002), and an annual moult in many pinniped species (McConkey et al., 2002; Thompson
and Rothery, 1987; Worthy et al., 1992), undergo extreme physiological changes. However, an
understanding of the regulatory pathways and how the blubber plays a role in allowing animals to
readily meet these extreme, cyclical demands on their energy stores is limited. The functional
adaptations governing these highly energetically costly life-history strategies warrant further
investigation. With the results from Chapters 5 and 6 that identified, for the first time, a large
number of proteins involved in various metabolic pathways in blubber tissue, I suggest that it may
be involved in the regulation of a number of paracrine and endocrine metabolic processes, similar
to the roles of white adipose tissue in terrestrial mammals (Ahima and Flier, 2000; Kershaw and
Flier, 2004).

Chapter 8 : General Discussion
173
It is still not known whether marine mammal blubber produces and secretes hormones in the same
way, and to the same extent as other mammalian adipose tissues. If it does, its importance in energy
regulation is not only through the storage of dietary fats, but also through the secretion of
hormones, such as cortisol and adiponectin, that are involved in the control of lipid metabolism,
fasting energetics and the regulation of physiological processes that take place during periods of
high energy demand. Recent evidence suggests that there is metabolism of corticosteroids in the
blubber with the interconversion of cortisol and cortisone (Galligan et al., 2018). Cetacean blubber
is therefore likely a site of active steroid metabolism. The localised production of hormones
involved in lipid metabolism may help to explain how cetaceans have evolved an enhanced
capacity for inhibiting unrestricted lipolysis and are able to finely control the lipid content of the
tissue (Wang et al., 2015).
It is likely that there are a wide range of cellular and tissue-specific processes occurring constantly,
and simultaneously in the blubber, and this work has only begun to scratch the surface as to the
complexity of the tissue. As the blubber makes up such a large proportion of the total body mass
in cetaceans, and other marine mammals, it is possible that the other roles of adipose tissue in the
regulation of appetite and energy balance, the immune response, inflammation and the acute-phase
response, blood pressure, nutrient transport and haemostasis (Trayhurn and Wood, 2004),
contribute greatly to the overall metabolism of these animals. In fact, if blubber does act as an
endocrine and paracrine organ, its ability to contribute to whole body homeostasis during different
parts of the life cycle could help to explain some of the extreme life-history strategies characteristic
of some species. For example, finely controlled metabolism of available lipid stores could
contribute to the extreme, long-term fasting endurance of baleen whales (Chivers, 2009).
Fig. 8.1. Theoretical schematic demonstrating the relative importance of different blubber
functions across three cetacean families with respect to the extent to which the tissue can
vary in total lipid content. It is hypothesised that ziphiids prioritise the preservation of a constant
blubber structure and lipid content to maintain the hydrodynamic, insulative and buoyant
properties of the tissue. Balaenopterids however, show huge amounts of variability in blubber
lipid content both within and between individuals, likely because they rely on blubber lipid stores
during prolonged fasting periods of their life-cycles. Artwork by Chris Huh.

Chapter 8 : General Discussion
174
Endocrine signalling from the tissue could contribute to the mechanisms that signal the end of
fasting and the initiation of feeding at the end of the extremely intense lactation periods of many
female phocid seals (Schulz and Bowen, 2004). Finally, and very speculatively, combinations of
the ability of the tissue to regulate vasoconstriction and vasodilation, together with the immune
response and localised coordination of inflammatory and cellular defences, could help to explain
how marine mammals are able to sustain severe injuries, often of anthropogenic origin, and survive
(Barcenas-De la Cruz et al., 2017; Neilson et al., 2009).
These are speculative links between whole animal physiology and blubber tissue function, so
further investigations of how the blubber contributes to different homeostatic processes are
required. A major step forward in efforts to better understand blubber function is the recent use of
blubber explants to investigate its metabolism in grey seals (Halichoerus grypus) (Bennett et al.,
2017). Adipose explants are small pieces of tissue taken from live animals. Cells within the
tissue are kept alive in a culture medium in order to maintain structure. Cells are therefore able
to better retain their original metabolic characteristics compared to individual cells cultured in
isolation. Experimental manipulations of these explants can be used to investigate adipose
regulation in wildlife species when opportunities for whole organism experimental work are
limited, as is the case for marine mammals (Bennett et al., 2017). Short term explant culture
may therefore be a viable method to complement whole animal studies to improve our
understanding of the molecular and cellular physiology of adipose tissue in general (Bennett et
al., 2017). Future work should build on developing these novel experimental approaches to
explore the pleiotropic nature of the blubber, and how it contributes to the extreme diving,
fasting and breeding physiology of many marine mammal species.
4. Sentinels of Ecosystem Health
Widespread environmental changes have been documented as a result of climate change. Polar and
sub-polar regions are particularly vulnerable environments, and the most accelerated changes have
been documented in these areas (Moritz et al., 2002; Wassmann et al., 2011). Continued
monitoring of environmental conditions in these environments is therefore of particular
importance, but the remoteness of these habitats makes regular surveys and data collection
logistically challenging. Thus, instead of attempting to estimate prey species biomass for example,
or measure complex changes in environmental conditions through limited and costly surveys of
these high latitude areas, a robust and cost-effective alternative is to focus on the integrated
response that changes in prey availability elicit in dependent predator species, such as marine
mammals. Estimating and monitoring the nutritive condition and reproductive success of these
animals can therefore provide vital information on the ecosystem productivity and environmental
quality (Bengtson Nash et al., 2018). In order for this to be effective, however, markers of
individual health, reproductive status and body condition need to be identified and applied
appropriately across populations. Continued efforts to develop heath and condition markers that
can be used for large-scale analysis are therefore very important. Time-series data, like the

Chapter 8 : General Discussion
175
longitudinal sampling of humpback whales in the Gulf of St Lawrence presented in Chapter 4, will
also be invaluable for identifying changes to, or disruption of marine ecosystem processes.
As well as using marine mammal health as an indicator of ecosystem productivity, an increasing
number of studies have demonstrated the value of using marine mammal tissues to investigate the
occurrence and concentrations of contaminants in the marine environment (Hoekstra et al., 2003).
Despite regulations limiting the extent to which many harmful contaminants are released into
freshwater and marine ecosystems, because of their longevity, many contaminants, including
persistent organic pollutants for example, are still present at high concentrations in the marine
environment (Tanabe et al., 1994). The impact of historic and current exposure on marine top
predators is still largely unknown (Jepson et al., 2016). Measuring the contaminant burdens in the
blubber of these species is therefore important in terms of assessing the potential risks to individual
health associated with high contaminant burdens (Kannan et al., 2000) that could have population
level impacts. It is also important in terms of long-term monitoring of the prevalence and
persistence of contaminants in the ecosystem. The development of biomarkers that can be used to
monitor the potential health effects of these contaminants will also be of particular interest as they
have been linked to population declines in some species (Jepson et al., 2016).
5. Future Directions
Marine mammals face a wide range of potential anthropogenic stressors including, but not limited
to, chemical and acoustic pollution, habitat loss, reduced prey availability and bycatch (Fair and
Becker, 2000). There is therefore an urgent need to identify new approaches to improve our ability
to estimate the potential cumulative effects of such anthropogenic stressors on marine mammal
populations. Population Consequences of Multiple Stressors (PCoMS) models aim to link
exposure to different stressors to behavioural changes (foraging, mating, vocalising etc.) which
lead to physiological changes that can then affect overall health (energy stores, immune status,
parasite load etc.) (Tyack et al., 2017). Changes in the health of individuals will ultimately lead to
changes in vital rates of the population (survival, fecundity, age at first reproduction) (Tyack et
al., 2017). These processes are all linked, and realistic predictions of the consequences of the
cumulative effects of multiple stressors at a population level relies on our ability to accurately
measure each of them. Currently, there is a gap in our knowledge of how to best measure health
parameters in free-ranging marine mammals, particularly cetaceans. The development of
biomarkers, not just of body condition, but also of contaminant exposure, immune response and
disease processes would help to start to close this gap.
Recent advances in molecular sequencing as well as biochemical detection techniques offer the
potential for the identification of suitable biomarkers of health and body condition using ‘omics’
approaches. Specifically, the detection of mRNA (transcriptomics) to investigate gene expression,
proteins (proteomics) to investigate cellular and tissue processes, and metabolites (metabolomics)
to investigate whole organism homeostasis (Horgan and Kenny, 2011), will likely prove to be
particularly powerful tools. Ultimately, interdisciplinary approaches and collaborations that
combine expertise across the fields of marine mammal science will provide the most innovative

Chapter 8 : General Discussion
176
opportunities for method development and optimisation. For example, the use of aerial
photogrammetry techniques (Christiansen et al., 2018) combined with endocrine profiling (Pallin
et al., 2018b), biomarker identification, and body composition analyses through tagging (Narazaki
et al., 2018) could provide valuable physiological and ecological insight.
In keeping with the importance of inter-disciplinary approaches, an important next step to better
predict the cumulative effects of multiple stressors, including the effects of climate change, is to
combine long-term oceanographic, environmental data with markers of marine mammal health
and condition. As top marine predators, and therefore sentinel species of ecosystem health, this
work is important for the assessment of population resilience to environmental change. There is a
timely and emerging need for such interdisciplinary studies to look at the ‘bigger picture’ as we
aim to understand the cumulative effects of stressors on marine mammals, and what this could
mean in terms of ecosystem health both now and in the future. From a conservation perspective,
knowledge of wildlife population health and ecology is fundamental for formulating conservation
policy, however, there is little information on how the health of populations of species living in
particularly vulnerable environments. Research efforts should be focused in these areas.

References
177
REFERENCES
Ackman, R.G., Eaton, C.A., Jangaard, P.M., 1965. Lipids of the fin whale (Balaenoptera physalus)
from North Atlantic waters: Fatty acid composition of whole blubber and blubber sections.
Canadian Journal of Biochemistry 43, 1513-1520.
Ackman, R.G., Hingley, J.H., Eaton, C.A., Logan, V.H., Odense, P.H., 1975a. Layering and tissue
composition in the blubber of the northwest Atlantic sei whale (Balaenoptera borealis).
Canadian Journal of Zoology 53, 1340-1344.
Ackman, R.G., Hingley, J.H., Eaton, C.A., Sipos, J.C., Mitchell, E.D., 1975b. Blubber fat
deposition in mysticeti whales. Canadian Journal of Zoology 53, 1332-1339.
Adachi, T., Maresh, J.L., Robinson, P.W., Peterson, S.H., Costa, D.P., Naito, Y., Watanabe, Y.Y.,
Takahashi, A., 2014. The foraging benefits of being fat in a highly migratory marine
mammal. Proceedings of the Royal Society B: Biological Sciences 281.
Aguilar, A., Borrell, A., 1990. Patterns of Lipid Content and Stratification in the Blubber of Fin
Whales (Balaenoptera physalus). Journal of Mammalogy 71, 544-554.
Aguilar, A., Borrell, A., Gomez-Campos, E., 2007. The reliability of blubber thickness as a
measure of body condition in large whales. . 59th Annual Meeting of the Scientific
Committee of the Interactional Whaling Commission (SC/59/017)
Aguilar Soto, N., Johnson, M. P., Madsen, P. T., Diaz, F., Dominguez, I., Brito, A., Tyack, P.
2008. Cheetahs of the deep sea: deep foraging sprints in short‐finned pilot whales off
Tenerife (Canary Islands). Journal of Animal Ecology. 77, 936-947.
Ahima, R.S., 2006. Adipose Tissue as an Endocrine Organ. Obesity 14, 242S-249S.
Ahima, R.S., Flier, J.S., 2000. Adipose Tissue as an Endocrine Organ. Trends in Endocrinology
& Metabolism 11, 327-332.
Albrecht, G.H., Gelvin, B.R., Hartman, S.E., 1993. Ratios as a size adjustment in morphometrics.
American Journal of Physical Anthropology 91, 441-468.
Andreasson, U., Perret-Liaudet, A., van Waalwijk van Doorn, L.J.C., Blennow, K., Chiasserini,
D., Engelborghs, S., Fladby, T., Genc, S., Kruse, N., Kuiperij, H.B., Kulic, L., Lewczuk,
P., Mollenhauer, B., Mroczko, B., Parnetti, L., Vanmechelen, E., Verbeek, M.M., Winblad,
B., Zetterberg, H., Koel-Simmelink, M., Teunissen, C.E., 2015. A Practical Guide to
Immunoassay Method Validation. Frontiers in Neurology 6, 179.
Arlt, W., Stewart, P.M., 2005. Adrenal Corticosteroid Biosynthesis, Metabolism, and Action.
Endocrinology and Metabolism Clinics 34, 293-313.
Atkinson, A., Colburn, W.A., DeGruttola, V.G., DeMets, D.L., Downing, G.J., Hoth, D.F., Oates,
J.A., Peck, C.C., Schooley, R.T., Spilker, B.A., 2001. Biomarkers and surrogate endpoints:
preferred definitions and conceptual framework. . Clinical pharmacology and therapeutics.
69, 89-95.
Atkinson, S., Arnould, J.P.Y., Mashburn, K.L., 2011. Plasma cortisol and thyroid hormone
concentrations in pre-weaning Australian fur seal pups. General and Comparative
Endocrinology 172, 277-281.
Atkinson, S., Combelles, C., Vincent, D., Nachtigall, P., Pawloski, J., Breese, M., 1999.
Monitoring of progesterone in captive female false killer whales, Pseudorca crassidens.
Gen. Comp. Endocrinol. 115, 323–332.
Ayres, K.L., Booth, R.K., Hempelmann, J.A., Koski, K.L., Emmons, C.K., Baird, R.W., Balcomb-
Bartok, K., Hanson, M.B., Ford, M.J., Wasser, S.K., 2012. Distinguishing the Impacts of

References
178
Inadequate Prey and Vessel Traffic on an Endangered Killer Whale (Orcinus orca)
Population. PLOS ONE 7, e36842.
Bagge, L.E., Koopman, H.N., Rommel, S.A., McLellan, W.A., Pabst, D.A., 2012. Lipid class and
depth-specific thermal properties in the blubber of the short-finned pilot whale and the
pygmy sperm whale. The Journal of Experimental Biology 215, 4330-4339.
Banner, K.M., Higgs, M.D., 2017. Considerations for assessing model averaging of regression
coefficients. Ecological Applications 27, 78-93.
Barbieri, M.M., McLellan, W.A., Wells, R.S., Blum, J.E., Hofmann, S., Gannon, J., Pabst, D.A.,
2010. Using infrared thermography to assess seasonal trends in dorsal fin surface
temperatures of free-swimming bottlenose dolphins (Tursiops truncatus) in Sarasota Bay,
Florida. Marine Mammal Science 26, 53-66.
Barcenas-De la Cruz, D., DeRango, G., Johnson, S., Simeone, C., 2017. Evidence of
anthropogenic trauma in marine mammals stranded along the central California coast,
2003–2015.
Barrell, G.K., Montgomery, G.W., 1989. Absence of circadian patterns of secretion of melatonin
or cortisol in Weddell seals under continuous natural daylight. Journal of Endocrinology
122, 445-449.
Barrett-Lennard, L.G., Smith, T.G., Ellis, G.M., 1996. A cetacean biopsy system using lightweight
pneumatic darts, and its effect on the behavior of killer whales. Marine Mammal Science
12, 14-27.
Beaulieu-McCoy, N.E., Sherman, K.K., Trego, M.L., Crocker, D.E., Kellar, N.M., 2017. Initial
validation of blubber cortisol and progesterone as indicators of stress response and maturity
in an otariid; the California sea lion (Zalophus californianus). General and Comparative
Endocrinology 252, 1-11.
Bechshøft, T.Ø., Rigét, F.F., Sonne, C., Letcher, R.J., Muir, D.C.G., Novak, M.A., Henchey, E.,
Meyer, J.S., Eulaers, I., Jaspers, V.L.B., Eens, M., Covaci, A., Dietz, R., 2012. Measuring
environmental stress in East Greenland polar bears, 1892–1927 and 1988–2009: What does
hair cortisol tell us? Environment International 45, 15-21.
Bechshøft, T.Ø., Wright, A.J., Weisser, J.J., Teilmann, J., Dietz, R., Hansen, M., Björklund, E.,
Styrishave, B., 2015. Developing a new research tool for use in free-ranging cetaceans:
recovering cortisol from harbour porpoise skin. Conservation Physiology 3.
Beck, G.G., Smith, T.G., Hammill, M.O., 1993. Evaluation of Body Condition in the Northwest
Atlantic Harp Seal (Phoca groenlandica). Canadian Journal of Fisheries and Aquatic
Sciences 50, 1372-1381.
Bélanger, C., Luu-The, V., Dupont, P., Tchernof, A., 2002. Adipose Tissue Intracrinology:
Potential Importance of Local Androgen/Estrogen Metabolism in the Regulation of
Adiposity. Horm Metab Res 34, 737-745.
Bengtson Nash, S.M., Castrillon, J., Eisenmann, P., Fry, B., Shuker, J.D., Cropp, R.A., Dawson,
A., Bignert, A., Bohlin-Nizzetto, P., Waugh, C.A., Polkinghorne, B.J., Dalle Luche, G.,
McLagan, D., 2018. Signals from the south; humpback whales carry messages of Antarctic
sea-ice ecosystem variability. Global Change Biology 24, 1500-1510.
Bennett, K.A., Hughes, J., Stamatas, S., Brand, S., Foster, N.L., Moss, S.E.W., Pomeroy, P.P.,
2015. Adiponectin and Insulin in Gray Seals during Suckling and Fasting: Relationship
with Nutritional State and Body Mass during Nursing in Mothers and Pups. Physiological
and Biochemical Zoology 88, 295-310.

References
179
Bennett, K.A., MacMillan, I.S., Hammill, M., Currie, S., 2014. HSP70 Abundance and
Antioxidant Capacity in Feeding and Fasting Gray Seal Pups: Suckling Is Associated with
Higher Levels of Key Cellular Defenses. Physiological and Biochemical Zoology 87, 663-
676.
Bennett, K.A., Robinson, K.J., Moss, S.E.W., Millward, S., Hall, A.J., 2017. Using blubber
explants to investigate adipose function in grey seals: glycolytic, lipolytic and gene
expression responses to glucose and hydrocortisone. Scientific Reports 7, 7731.
Bergendahl, M., Vance, M.L., Iranmanesh, A., Thorner, M.O., Veldhuis, J.D., 1996. Fasting as a
metabolic stress paradigm selectively amplifies cortisol secretory burst mass and delays
the time of maximal nyctohemeral cortisol concentration in healthy men. J. Clin.
Endocrinol. Metab. 81, 692-699.
Bergfelt, D.R., Steinetz, B.G., Lasano, S., West, K.L., Campbell, M., Adams, G.P., 2011. Relaxin
and progesterone during pregnancy and the post-partum period in association with live and
stillborn calves in bottlenose dolphins (Tursiops truncatus). General and Comparative
Endocrinology 170, 650-656.
Best, P.B., Rüther, H., 1992. Aerial photogrammetry of southern right whales, Eubalaena australis.
Journal of Zoology 228, 595-614.
Bêty, J., Gauthier, G., Giroux, J., 2003. Body condition, migration, and timing of reproduction in
snow geese: a test of the condition-dependent model of optimal clutch size. Am. Nat. 162,
110-121.
Bigg, M.A., Wolman, A.A., 1975. Live-Capture Killer Whale (Orcinus orca) Fishery, British
Columbia and Washington, 1962–73. Journal of the Fisheries Research Board of Canada
32, 1213-1221.
Bloch, D., Desportes, G., Zachariassen, M., Christensen, I., 1996. The northern bottlenose whale
in the Faroe Islands, 1584-1993. Journal of Zoology 239, 123-140.
Bock, J.L., Eckfeldt, J.H., 2011. Advances in standardization of laboratory measurement
procedures: implications for measuring biomarkers of folate and vitamin B-12 status in
NHANES. The American Journal of Clinical Nutrition 94, 332S-336S.
Bolker, B.M., Brooks, M.E., Clark, C.J., Geange, S.W., Poulsen, J.R., Stevens, M.H.H., White, J.-
S.S., 2008. Generalized linear mixed models: a practical guide for ecology and evolution.
Trends in Ecology & Evolution 24, 127-135.
Boness, D.J., Calpham, P.J., Mesnick, S.L., 2002. Life History and Reproductive Strategies In:
Hoelzel, A.R. (Ed.) Marine Mammal Biology: An Evolutionary Approach. Blackwell
Science Ltd., Oxford.
Bonier, F., Martin, P.R., Moore, I.T., Wingfield, J.C., 2009. Do baseline glucocorticoids predict
fitness? Trends in Ecology & Evolution 24, 634-642.
Bourbonnais, M.L., Nelson, T.A., Cattet, M.R.L., Darimont, C.T., Stenhouse, G.B., Janz, D.M.,
2014. Environmental factors and habitat use influence body condition of individuals in a
species at risk, the grizzly bear. Conservation Physiology 2, cou043.
Bräger, S., Chong, A.K., 1999. An Application of Close Range Photogrammetry In Dolphin
Studies. The Photogrammetric Record 16, 503-517.
Breuner, C., Orchinik, M., 2002. Plasma binding proteins as mediators of corticosteroid action in
vertebrates. Journal of Endocrinology 175, 99-112.
Bukrinsky, M., 2015. Extracellular cyclophilins in health and disease. Biochimica et Biophysica
Acta (BBA) - General Subjects 1850, 2087-2095.

References
180
Burton, R.K., Koch, P.L., 1999. Isotopic tracking of foraging and long-distance migration in
northeastern Pacific pinnipeds. Oecologia 119, 578-585.
Caon, G., Fialho, C.B., Danilewicz, D., 2007. Body Fat Condition in Franciscanas (Pontoporia
blainvillei) in Rio Grande do Sul, Southern Brazil. Journal of Mammalogy 88, 1335-1341.
Castellini, M.A., Rea, L.D., 1992. The biochemistry of natural fasting and its limits. Experientia
48, 575-582.
Champagne, C.D., Houser, D.S., Costa, D.P., Crocker, D.E., 2012. The Effects of Handling and
Anesthetic Agents on the Stress Response and Carbohydrate Metabolism in Northern
Elephant Seals. PLos ONE 7.
Champagne, C.D., Houser, D.S., Crocker, D.E., 2006. Glucose metabolism during lactation in a
fasting animal, the northern elephant seal. American Journal of Physiology - Regulatory,
Integrative and Comparative Physiology 291, R1129-R1137.
Champagne, C.D., Kellar, N.M., Crocker, D.E., Wasser, S.K., Booth, R.K., Trego, M.L., Houser,
D.S., 2017. Blubber cortisol qualitatively reflects circulating cortisol concentrations in
bottlenose dolphins. Marine Mammal Science 33, 134-153.
Champagne, C.D., Kellar, N.M., Trego, M.L., Delehanty, B., Boonstra, R., Wasser, S.K., Booth,
R.K., Crocker, D.E., Houser, D.S., 2018. Comprehensive endocrine response to acute stress
in the bottlenose dolphin from serum, blubber, and feces. General and Comparative
Endocrinology 266, 178-193.
Chittleborough, R., 1965. Dynamics of two populations of the humpback whale, Megaptera
novaeangliae. Mar. Freshw. Res. 16, 33–128.
Chivers, S.J., 2009. Cetacean Life History, In: Perrin, W.F., Würsig, B., Thewissen, J.G.M. (Eds.)
Encyclopedia of Marine Mammals (Second Edition). Academic Press, London, pp. 215-
220.
Christiansen, F., Dujon, A.M., Sprogis, K.R., Arnould, J.P.Y., Bejder, L., 2016. Noninvasive
unmanned aerial vehicle provides estimates of the energetic cost of reproduction in
humpback whales. Ecosphere 7, e01468.
Christiansen, F., Víkingsson, G.A., Rasmussen, M.H., Lusseau, D., 2013. Minke whales maximise
energy storage on their feeding grounds. The Journal of Experimental Biology 216, 427-
436.
Christiansen, F., Vivier, F., Charlton, C., Ward, R., Amerson, A., Burnell, S., Bejder, L., 2018.
Maternal body size and condition determine calf growth rates in southern right whales.
Marine Ecology Progress Series 592, 267-281.
Cilia, M., Fish, T., Yang, X., McLaughlin, M., Thannhauser, T.W., Gray, S., 2009. A Comparison
of Protein Extraction Methods Suitable for Gel-Based Proteomic Studies of Aphid
Proteins. Journal of Biomolecular Techniques : JBT 20, 201-215.
Clapham, P.J., 1996. The social and reproductive biology of Humpback Whales: an ecological
perspective. Mammal Review 26, 27-49.
Clark, C.T., Fleming, A.H., Calambokidis, J., Kellar, N.M., Allen, C.D., Catelani, K.N., Robbins,
M., Beaulieu, N.E., Steel, D., Harvey, J.T., 2016. Heavy with child? Pregnancy status and
stable isotope ratios as determined from biopsies of humpback whales. Conservation
Physiology 4, cow050.
Coleman, R.A., Lee, D.P., 2004. Enzymes of triacylglycerol synthesis and their regulation.
Progress in Lipid Research 43, 134-176.
Conaway, C.H., Baskett, T.S., Toll, J.E., 1960. Embryo resorption in the swamp rabbit. Journal
Wildlife Management 24, 197–202.

References
181
Cox, T. F., Ferry, G. 1993. Discriminant analysis using non-metric multidimensional scaling.
Pattern Recognition. 26: 145-153.
Cubbage, J.C., Calambokidis, J., 1987. Size-class segregation of bowhead whales discerned
through aerial stereophotogrammetry. Marine Mammal Science 3, 179-185.
Decker, E.A., Xiong, Y.L., Calvert, J.T., Crum, A.D., Blanchard, S.P., 1993. Chemical, physical,
and functional properties of oxidized turkey white muscle myofibrillar proteins. Journal of
Agricultural and Food Chemistry 41, 186-189.
Delgiudice, G.D., Moen, R.A., Singer, F.J., Riggs, M.R., 2001. Winter Nutritional Restriction and
Simulated Body Condition of Yellowstone Elk and Bison before and after the Fires of
1988. Wildlife Monographs, 1-60.
Deslypere, J.P., Verdonck, L., Vermeulen, A., 1985. Fat Tissue: A Steroid Reservoir and Site of
Steroid Metabolism. The Journal of Clinical Endocrinology & Metabolism 61, 564-570.
Dinneen, S., Alzaid, A., Miles, J., Rizza, R., 1993. Metabolic effects of the nocturnal rise in cortisol
on carbohydrate metabolism in normal humans. Journal of Clinical Investigation 92, 2283-
2290.
Divertie, G.D., Jensen, M.D., Miles, J.M., 1991. Stimulation of Lipolysis in Humans by
Physiological Hypercortisolemia. Diabetes 40, 1228-1232.
Dizon, A., Allen, A., Kellar, N., Southern, S., 2002. Stress in spotted dolphins (Stenella attenuata)
associated with purse-seine tuna fishing in the Eastern Tropical Pacific. . Administrative
Report LJ-02-26 to the Southwest Fisheries Science Center, National Oceanographic and
Atmospheric Administration, La Jolla, CA, USA.
Djurhuus, C.B., Gravholt, C.H., Nielsen, S., Mengel, A., Christiansen, J.S., Schmitz, O.E., Møller,
N., 2002. Effects of cortisol on lipolysis and regional interstitial glycerol levels in humans.
American Journal of Physiology-Endocrinology and Metabolism 283, E172-E177.
Djurhuus, C.B., Gravholt, C.H., Nielsen, S., Pedersen, S.B., Møller, N., Schmitz, O., 2004.
Additive effects of cortisol and growth hormone on regional and systemic lipolysis in
humans. American Journal of Physiology - Endocrinology and Metabolism 286, E488-
E494.
Doniol-Valcroze, T., Berteaux, D., Larouche, P., Sears, R., 2007. Influence of thermal fronts on
habitat selection by four rorqual whale species in the Gulf of St. Lawrence. Marine Ecology
Progress Series 355, 207–216.
Donma, M.M., Donma, O., 1989. Apolipoproteins: Biochemistry, methods and clinical
significance. Biochemical Education 17, 63-68.
Dunkin, R.C., McLellan, W.A., Blum, J.E., Pabst, D.A., 2005. The ontogenetic changes in the
thermal properties of blubber from Atlantic bottlenose dolphin <em>Tursiops
truncatus</em>. Journal of Experimental Biology 208, 1469-1480.
Durban, J.W., Fearnbach, H., Barrett-Lennard, L.G., Perryman, W.L., Leroi, D.J., 2015.
Photogrammetry of killer whales using a small hexacopter launched at sea. Journal of
Unmanned Vehicle Systems 3, 131-135.
Durban, J.W., Moore, M.J., Chiang, G., Hickmott, L.S., Bocconcelli, A., Howes, G., Bahamonde,
P.A., Perryman, W.L., LeRoi, D.J., 2016. Photogrammetry of blue whales with an
unmanned hexacopter. Marine Mammal Science 32, 1510-1515.
Durban, J.W., Parsons, K.M., 2006. Laser-metric of free-ranging killer whales. Marine Mammal
Science 22, 735-743.

References
182
Ellis, B.C., Gattoni-Celli, S., Mancia, A., Kindy, M.S., 2009. The vitamin D3 transcriptomic
response in skin cells derived from the Atlantic bottlenose dolphin. Developmental &
Comparative Immunology 33, 901-912.
Endo, Y., Kamei, K., Inoue-Murayama, M., 2018. Genetic Signatures of Lipid Metabolism
Evolution in Cetacea. bioRxiv.
Engelhard, G., Brasseur, S., Hall, A., Burton, H., Reijnders, P., 2002. Adrenocortical
responsiveness in southern elephant seal mothers and pups during lactation and the effect
of scientific handling. J Comp Physiol B 172, 315-328.
Enoksen, S., Haug, T., Lindstrøm, U., Nilssen, K.T., 2016. Recent summer diet of hooded
Cystophora cristata and harp Pagophilus groenlandicus seals in the drift ice of the
Greenland Sea. Polar Biol 40, 931–937.
Evans, K., Hindell, M.A., Thiele, D., 2003. Body fat and condition in sperm whales, Physeter
macrocephalus, from southern Australian waters. Comparative Biochemistry and
Physiology Part A: Molecular & Integrative Physiology 134, 847-862.
Exton, J.H., Friedmann, N., Wong, E.H.-A., Brineaux, J.P., Corbin, J.D., Park, C.R., 1972.
Interaction of Glucocorticoids with Glucagon and Epinephrine in the Control of
Gluconeogenesis and Glycogenolysis in Liver and of Lipolysis in Adipose Tissue. Journal
of Biological Chemistry 247, 3579-3588.
Fain, J.N., Madan, A.K., Hiler, M.L., Cheema, P., Bahouth, S.W., 2004. Comparison of the
Release of Adipokines by Adipose Tissue, Adipose Tissue Matrix, and Adipocytes from
Visceral and Subcutaneous Abdominal Adipose Tissues of Obese Humans. Endocrinology
145, 2273-2282.
Fair, P.A., Becker, P.R., 2000. Review of Stress in Marine Mammals. Journal of Aquatic
Ecosystem Stress and Recovery 7, 335-354.
Fair, P.A., Schaefer, A.M., Houser, D.S., Bossart, G.D., Romano, T.A., Champagne, C.D., Stott,
J.L., Rice, C.D., White, N., Reif, J.S., 2017. The environment as a driver of immune and
endocrine responses in dolphins (Tursiops truncatus). PLOS ONE 12, e0176202.
Fearnbach, H., Durban, J.W., Ellifrit, D.K., Balcomnb, K.C., 2018. Using aerial photogrammetry
to detect changes in body condition of endangered southern resident killer whales.
Endangered Species Research 35, 175-180.
Fernández, A., Edwards, J.F., Rodríguez, F., de los Monteros, A.E., Herráez, P., Castro, P., Jaber,
J.R., Martín, V., Arbelo, M., 2005. “Gas and Fat Embolic Syndrome” Involving a Mass
Stranding of Beaked Whales (Family Ziphiidae) Exposed to Anthropogenic Sonar Signals.
Veterinary Pathology 42, 446-457.
Fire, S.E., Wang, Z., Byrd, M., Whitehead, H.R., Paternoster, J., Morton, S.L., 2011. Co-
occurrence of multiple classes of harmful algal toxins in bottlenose dolphins (Tursiops
truncatus) stranding during an unusual mortality event in Texas, USA. Harmful Algae 10,
330-336.
Folch, J., Lees, M., Stanley, G.H.S., 1957. A simple method for the isolation and purification of
total lipides from animal tissues. J. Biol. Chem. 226, 497-509.
Forsyth, D.M., Duncan, R.P., Tustin, K.G., Gaillard, J.M., 2005. A substantial energetic cost to
male reproduction in a sexually dimorphic ungulate. Ecology 86, 2154-2163.
Fossi, M.C., Urban, J., Casini, S., Maltese, S., Spinsanti, G., Panti, C., Porcelloni, S., Panigada, S.,
Lauriano, G., Niño-Torres, C., Rojas-Bracho, L., Jimenez, B., Muñoz-Arnanz, J., Marsili,
L., 2010. A multi-trial diagnostic tool in fin whale (Balaenoptera physalus) skin biopsies

References
183
of the Pelagos Sanctuary (Mediterranean Sea) and the Gulf of California (Mexico). Marine
Environmental Research 69, S17-S20.
Fougeres, E., McLellan, W. A., WEstgate, A. J., Wells, R., Blum, J. E., Pabst, D. A. 2008. Seasonal
patterns of heat loss in wild bottlenose dolphins (Tursiops truncatus). Journal of
Comparative Physiology B 178(4):529-43.
Frayn, K.N., Karpe, F., Fielding, B.A., Macdonald, I.A., Coppack, S.W., 2003. Integrative
physiology of human adipose tissue. International Journal of Obesity & Related Metabolic
Disorders 27, 875.
Freckleton, R.P., 2002. On the misuse of residuals in ecology: regression of residuals vs. multiple
regression. Journal of Animal Ecology 71, 542-545.
Friedlaender, A.S., Johnston, D.W., Tyson, R.B., Kaltenberg, A., Goldbogen, J.A., Stimpert, A.K.,
Curtice, C., Hazen, E.L., Halpin, P.N., Read, A.J., Nowacek, D.P., 2016. Multiple-stage
decisions in a marine central-place forager. Royal Society Open Science 3, 160043.
Friedman, D.B., Hoving, S., Westermeier, R., 2009. Chapter 30 Isoelectric Focusing and Two-
Dimensional Gel Electrophoresis, In: Richard, R.B., Murray, P.D. (Eds.) Methods in
Enzymology. Academic Press, pp. 515-540.
Frühbeck, G., Gómez-Ambrosi, J., Muruzábal, F.J., Burrell, M.A., 2001. The adipocyte: a model
for integration of endocrine and metabolic signaling in energy metabolism regulation.
American Journal of Physiology - Endocrinology And Metabolism 280, E827-E847.
Fu, Y., Luo, N., Klein, R.L., Garvey, W.T., 2005. Adiponectin promotes adipocyte differentiation,
insulin sensitivity, and lipid accumulation. Journal of Lipid Research 46, 1369-1379.
Galligan, T.M., Schwacke, L.H., McFee, W.E., Boggs, A.S., 2018. Evidence for cortisol–cortisone
metabolism by marine mammal blubber. Marine Biology 165.
Gannon, D.P., Ready, A.J., Craddock, J.E., Mead, J.G., 1997. Stomach contents of long-finned
pilot whales (Globicephala melas) stranded on the U.S. Mid-Atlantic coast, Vol 13, 405-
418 pp.
Garcia-Berthou, E., 2001. On the Misuse of Residuals in Ecology: Testing Regression Residuals
vs. the Analysis of Covariance. Journal of Animal Ecology 70, 708-711.
Gardiner, K.J., Hall, A.J., 1997. Diel and annual variation in plasma cortisol concentrations among
wild and captive harbor seals (Phoca vitulina). Canadian Journal of Zoology 75, 1773-
1780.
Gautier, V., Mouton-Barbosa, E., Bouyssie, D., Delcourt, N., Beau, M., Girard, J.-P.P., Cayrol, C.,
Burlet-Schiltz, O., Monsarrat, B., Gonzalez de Peredo, A., 2012. Label-free quantification
and shotgun analysis of complex proteomes by 1D SDS-PAGE/nanoLC-MS: evaluation
for the large-scale analysis of inflammatory human endothelial cells. Molecular &
Cellular Proteomics.
Gavrilchuck, K., Lesage, V., Ramp, C., Sears, R., Bérubé, M., Bearhop, S., Beauplet, G., 2014.
Trophic niche partitioning among sympatric baleen whale species following the collapse
of groundfish stocks in the Northwest Atlantic. Marine Ecology Progress Series 497, 285–
301.
Gimeno, R.E., Klaman, L.D., 2005. Adipose tissue as an active endocrine organ: recent advances.
Current Opinion in Pharmacology 5, 122-128.
Gomez-Cabrero, D., Abugessaisa, I., Maier, D., Teschendorff, A., Merkenschlager, M., Gisel, A.,
Ballestar, E., Bongcam-Rudloff, E., Conesa, A., Tegnér, J., 2014. Data integration in the
era of omics: current and future challenges. BMC Systems Biology 8, I1.

References
184
Gómez-Campos, E., Borrell, A., Aguilar, A., 2011. Assessment of nutritional condition indices
across reproductive states in the striped dolphin (Stenella coeruleoalba). Journal of
Experimental Marine Biology and Ecology 405, 18-24.
Gómez-Campos, E., Borrell, A., Correas, J., Aguilar, A., 2015. Topographical variat ion in lipid
content and morphological structure of the blubber in the striped dolphin. Scientia Marina
79, 189 - 197.
Green-Church, K.B., Nichols, K.K., Kleinholz, N.M., Zhang, L., Nichols, J.J., 2008. Investigation
of the human tear film proteome using multiple proteomic approaches. Molecular Vision
14, 456-470.
Green, A.J., 2001. Mass/Length Residuals: Measures of Body Condition or Generators of Spurious
Results? Ecology 82, 1473-1483.
Grotjan, H.E., Keel, B.A. 1996. Data Interpretation and Quality Control. In Immunoassay,
Diamandis, E.P., Christopoulos, T.K., eds. (New York, NY, Academic Press), pp. 51-95.
Guinet , C., Servera , N., Mangin , S., Georges , J.-Y., Lacroix, A., 2004. Change in plasma cortisol
and metabolites during the attendance period ashore in fasting lactating subantarctic fur
seals. Comparative Biochemistry and Physiology Part A 137, 523–531.
Gulland, F.M.D., Hall, A.J., 2007. Is Marine Mammal Health Deteriorating? Trends in the Global
Reporting of Marine Mammal Disease. EcoHealth 4, 135–150.
Hall, A.J., Hugunin, K., Deaville, R., Law, R.J., Allchin, C.R., Jepson, P.D., 2006. The Risk of
Infection from Polychlorinated Biphenyl Exposure in the Harbor Porpoise (Phocoena
phocoena): A Case–Control Approach. Environ. Health Perspect. 114, 704-711.
Hall, A.J., McConnell, B.J., Barker, R.J., 2001. Factors affecting first-year survival in grey seals
and their implications for life history strategy. Journal of Animal Ecology 70, 138-149.
Hammond, J.A., Hauton, C., Bennett, K.A., Hall, A.J., 2012. Phocid Seal Leptin: Tertiary
Structure and Hydrophobic Receptor Binding Site Preservation during Distinct Leptin
Gene Evolution. PLOS ONE 7, e35395.
Harcourt, R., Turner, E., Hall, A., Waas, J., Hindell, M., 2010. Effects of capture stress on free-
ranging, reproductively active male Weddell seals. Journal of Comparative Physiology A
196, 147-154.
Hart, L.B., Wells, R.S., Schwacke, L.H., 2013. Reference ranges for body condition in wild
bottlenose dolphins Tursiops truncatus. Aquatic Biology 18, 63-68.
Harwood, L.A., Smith, T.G., Melling, H., 2000. Variation in Reproduction and Body Condition of
the Ringed Seal (Phoca hispida) in Western Prince Albert Sound, NT, Canada, as Assessed
through a Harvest-Based Sampling Program. Arctic 53, 422-431.
Hashimoto, O., Ohtsuki, H., Kakizaki, T., Amou, K., Sato, R., Doi, S., Kobayashi, S., Matsuda,
A., Sugiyama, M., Funaba, M., Matsuishi, T., Terasawa, F., Shindo, J., Endo, H., 2015.
Brown Adipose Tissue in Cetacean Blubber. PLOS ONE 10, e0116734.
Haug, T., Falk-Petersen, S., Greenacre, M., Hop, H., Lindstrøm, U., Meier, S., Nilssen, K.T.,
Wold, A., 2017. Trophic level and fatty acids in harp seals compared with common minke
whales in the Barents Sea. Marine Biology Research 13, 919-932.
Hauksson, E., Vikingsson, G.A., Halldorsson, S.D., Olafsdottir, D., Sigurjónsson, J., 2011.
Preliminary report on biological parameters for NA minke whales in Icelandic waters.
Report of the International Whaling Commission 63, 1-45.
Hayes, J.P., Shonkwiler, J.S., 2001. Morphometric indicators of body condition: worthwhile or
wishful thinking?, In: Speakman, J.R. (Ed.) Body Composition Analysis of Animals. A

References
185
Handbook of Non-Destructive Methods. Cambridge University Press Cambridge, pp. 8-
38.
Heide-Jørgensen, M.P., L Leidre, K., Hansen, R., M Burt, L., Simon, M., Borchers, D., Hansen,
B.J., Harding, K., Rasmussen, M., Dietz, R., Teilmann, J., 2012. Rate of increase and
current abundance of humpback whales in West Greenland, Vol 12, 1-14 pp.
Heithaus, M.R., Frid, A., Wirsing, A.J., Dill, L.M., Fourqurean, J.W., Burkholder, D., Thomson,
J., Bejder, L., 2007. State-dependent risk-taking by green sea turtles mediates top-down
effects of tiger shark intimidation in a marine ecosystem. Journal of Animal Ecology 76,
837–844.
Heyning, J.E., 2002. Cuvier's Beaked Whale, In: Jefferson, T.A. (Ed.) Encyclopedia of Marine
Mammals. Academic Press, pp. 305-207.
Hoekstra, P.F., O'Hara, T.M., Fisk, A.T., Borga, K., Solomon, K.R., Muir, D.C.G., 2003. Trophic
transfer of persistent orgranochlorine contaminants (OCs) within an Arctic marine food
web from the southern Beaufort-Chukchi Seas. Environmental Pollution 124, 509-522.
Holm, J., Dasmeh, P., Kepp, K.P., 2016. Tracking evolution of myoglobin stability in cetaceans
using experimentally calibrated computational methods that account for generic protein
relaxation. Biochimica et Biophysica Acta (BBA) - Proteins and Proteomics 1864, 825-
834.
Hooker, S.K., Baird, R.W., 1999. Observations of Sowerby's Beaked Whales, Mesoplodon bidens,
in the Gully, Nova Scotia. Canadian Field Naturalist 113, 273-277.
Hooker, S.K., Iverson, S.J., Ostrom, P., Smith, S.C., 2001. Diet of northern bottlenose whales
inferred from fatty-acid and stable-isotope analyses of biopsy samples. Canadian Journal
of Zoology 79, 1442-1454.
Horgan, R.P., Kenny, L.C., 2011. ‘Omic’ technologies: genomics, transcriptomics, proteomics and
metabolomics. The Obstetrician & Gynaecologist 13, 189-195.
Huck, W.U., Lisk, R.D., Miller, K.S., Bethel, A., 1988. Progesterone levels and socially-induced
implantation failure and fetal resorption in golden hamsters (Mesocricetus auratus).
Physiol Behav 44, 321–326.
Hughes, K.A., Reynolds, R.M., Andrew, R., Critchley, H.O.D., Walker, B.R., 2010.
Glucocorticoids Turn Over Slowly in Human Adipose Tissue in Vivo. The Journal of
Clinical Endocrinology & Metabolism 95, 4696-4702.
Hunt, K.E., Moore, M.J., Rolland, R.M., Kellar, N.M., Hall, A.J., Kershaw, J.L., Raverty, S.A.,
Davis, C.E., Yeates, L.C., Fauquier, D.A., Rowles, T.K., Kraus, S.D., 2013. Overcoming
the challenges of studying conservation physiology in large whales: a review of available
methods. Conservation Physiology 1.
Hunt, K.E., Rolland, R.M., Kraus, S.D., 2014. Detection of steroid and thyroid hormones via
immunoassay of North Atlantic right whale (Eubalaena glacialis) respiratory vapor. Marine
Mammal Science 30, 796-809.
Hunt, K.E., Rolland, R.M., Kraus, S.D., Wasser, S.K., 2006. Analysis of fecal glucocorticoids in
the North Atlantic right whale (Eubalaena glacialis). General and Comparative
Endocrinology 148, 260-272.
Hutchings, J.A., Myers, R.A., 1995. The biological collapse of Atlantic cod off Newfoundland and
Labrador: an exploration of historical changes in exploitation, harvesting technology, and
management., In: Arnason, R., Felt, L. (Eds.) The North Atlantic fisheries: successes,
failures and challenges. The Institute of Island Studies, University of Prince Edward Island,
Charlottetown, p. 38−93.

References
186
Ijsseldijk, L.L., van Neer, A., Deaville, R., Begeman, L., van de Bildt, M., van den Brand, J.M.A.,
Brownlow, A., Czeck, R., Dabin, W., ten Doeschate, M., Herder, V., Herr, H., Ijzer, J.,
Jauniaux, T., Jensen, L.F., Jepson, P.D., Jo, W.K., Lakemeyer, J., Lehnert, K., Leopold,
M.F., Osterhaus, A., Perkins, M.W., Piatkowski, U., Prenger-Berninghoff, E., Pund, R.,
Wohlsein, P., Gröne, A., Siebert, U., 2018. Beached bachelors: An extensive study on the
largest recorded sperm whale Physeter macrocephalus mortality event in the North Sea.
PLOS ONE 13, e0201221.
Iverson, S.J., 2009. Blubber, In: Perrin, W.F., Würsig, B., Thewissen, J.G.M. (Eds.) Encyclopedia
of Marine Mammal (Second Edition). Academic Press.
Jepson, P.D., Deaville, R., Barber, J.L., Aguilar, À., Borrell, A., Murphy, S., Barry, J., Brownlow,
A., Barnett, J., Berrow, S., Cunningham, A.A., Davison, N.J., ten Doeschate, M., Esteban,
R., Ferreira, M., Foote, A.D., Genov, T., Giménez, J., Loveridge, J., Llavona, Á., Martin,
V., Maxwell, D.L., Papachlimitzou, A., Penrose, R., Perkins, M.W., Smith, B., de
Stephanis, R., Tregenza, N., Verborgh, P., Fernandez, A., Law, R.J., 2016. PCB pollution
continues to impact populations of orcas and other dolphins in European waters. Scientific
Reports 6, 18573.
Jepson, P.D., Deaville, R., Patterson, I.A.P., Pocknell, A.M., Ross, H.M., Baker, J.R., Howie, F.E.,
Reid, R.J., Colloff, A., Cunningham, A.A., 2005. Acute and Chronic Gas Bubble Lesions
in Cetaceans Stranded in the United Kingdom. Veterinary Pathology 42, 291-305.
Jiang, X., Ye, M., Jiang, X., Liu, G., Feng, S., Cui, L., Zou, H., 2007. Method Development of
Efficient Protein Extraction in Bone Tissue for Proteome Analysis. Journal of Proteome
Research 6, 2287-2294.
Jonscher, K., 2005. Validating sequence assignments for peptide fragmentation patterns: A primer
in MS/MS sequence identification. Proteome Software, Inc.
Kannan, K., Blankenship, A.L., Jones, P.D., Giesy, J.P., 2000. Toxicity Reference Values for the
Toxic Effects of Polychlorinated Biphenyls to Aquatic Mammals. Human and Ecological
Risk Assessment: An International Journal 6, 181-201.
Katona, S.K., Whitehead, H., 1981. Identifying humpback whales using their natural markings.
Polar Rec. 20, 439–444.
Kellar, N.M., Catelani, K.N., Robbins, M.N., Trego, M.L., Allen, C.D., Danil, K., Chivers, S.J.,
2015. Blubber Cortisol: A Potential Tool for Assessing Stress Response in Free-Ranging
Dolphins without Effects due to Sampling. PLoS ONE 10, e0115257.
Kellar, N.M., Keliher, J., Trego, M.L., Catelani, K.N., Hanns, C., George, J.C., Rosa, C., 2013.
Variation of bowhead whale progesterone concentrations across demographic groups and
sample matrices. Endangered Species Research 22, 61-72.
Kellar, N.M., Trego, M.L., Marks, C.I., Chivers, S.J., Danil, K., Archer, F.I., 2009. Blubber
testosterone: A potential marker of male reproductive status in short-beaked common
dolphins. Marine Mammal Science 25, 507-522.
Kellar, N.M., Trego, M.L., Marks, C.I., Dizon, A.E., 2006. Determining pregnancy from blubber
in three species of delphinids. Marine Mammal Science 22, 1-16.
Kershaw, E.E., Flier, J.S., 2004. Adipose Tissue as an Endocrine Organ. Journal of Clinical
Endocrinology & Metabolism 89, 2548-2556.
Kershaw, J.L., Hall, A.J., 2016. Seasonal variation in harbour seal (Phoca vitulina) blubber cortisol
- A novel indicator of physiological state? Scientific Reports 6, 21889.
Khudyakov, J.I., Champagne, C.D., Meneghetti, L.M., Crocker, D.E., 2017. Blubber
transcriptome response to acute stress axis activation involves transient changes in

References
187
adipogenesis and lipolysis in a fasting-adapted marine mammal. Scientific Reports 7,
42110.
Kilicarslan, A., Uysal, A., Roach, E.C., 2013. Acute Phase Reactants. Acta Medica 2, 2-7.
Konishi, K., 2006. Characteristics of blubber distribution and body condition indicators for
Antarctic minke whales (Balaenoptera bonaerensis). Mammal Study 31, 15-22.
Koopman, H.N., 1998. Topographical distribution of the blubber of harbour porpoises. Journal of
Mammalogy 79, 260-270.
Koopman, H.N., 2007. Phylogenetic, ecological, and ontogenetic factors influencing the
biochemical structure of the blubber of odontocetes. Marine Biology 151, 277-291.
Koopman, H.N., Iverson, S.J., Gaskin, D.E., 1996. Stratification and age-related differences in
blubber fatty acids of the male harbour porpoise (Phocoena phocoena). J Comp Physiol B
165, 628-639.
Koopman, H.N., Pabst, D.A., McLellan, W.A., Dillaman, R.M., Read, A.J., 2002. Changes in
blubber distribution and morphology associated with starvation in the harbour porpoise
(Phocoena phocoena): Evidence for regional differences in blubber structure and function.
. Physiological and Biochemical Zoology 75, 498-512.
Koopman, H.N., Westgate, A.J., 2012. Solubility of nitrogen in marine mammal blubber depends
on its lipid composition. The Journal of Experimental Biology.
Krahn, M.M., Hanson, M.B., Baird, R.W., Boyer, R.H., Burrows, D.G., Emmons, C.K., Ford,
J.K.B., Jones, L.L., Noren, D.P., Ross, P.S., Schorr, G.S., Collier, T.K., 2007. Persistent
organic pollutants and stable isotopes in biopsy samples (2004/2006) from Southern
Resident killer whales. Marine Pollution Bulletin 54, 1903-1911.
Krahn, M.M., Herman, D.P., Ylitalo, G.M., Sloan, C.A., Burrows, D.G., Hobbs, R.C., Mahoney,
B.A., Yanagida, G.K., Calambokidis, J., Moore, C.J., 2004. Stratification of lipids, fatty
acids and organochlorine contaminants in blubber of white whales and killer whales. J.
Cetacean Res. Manage. 6, 175-189.
Kuiken, T., Bennett, P.M., Allchin, C.R., Kirkwood, J.K., Baker, J.R., Lockyer, C.H., Walton,
M.J., Sheldrick, M.C., 1994. PCBs, cause of death and body condition in harbour porpoises
(Phocoena phocoena) from British waters. Aquatic Toxicology 28, 13-28.
Kuiken, T., Hartmann, M.G., 1991. Dissection techniques and tissue sampling. Proceedings of the
first European Cetacean Society workshop on cetacean pathology. Leiden, The
Netherlands. European Cetacean Society Newsletter No. 17 - Special issue., 39.
Lane, J.E., Boutin, S., Speakman, J.R., Humphries, M.M., 2010. Energetic costs of male
reproduction in a scramble competition mating system. . Journal of Animal Ecology 79,
27-34.
Larsen, F., 1998. Development of a biopsy system primarily for use on large cetaceans. Report
SC/50/0 15 to the International Whaling Commission Scientific Committee 7.
Law, R.J., Barry, J., Barber, J.L., Bersuder, P., Deaville, R., Reid, R.J., Brownlow, A., Penrose,
R., Barnett, J., Loveridge, J., Smith, B., Jepson, P.D., 2012. Contaminants in cetaceans
from UK waters: Status as assessed within the Cetacean Strandings Investigation
Programme from 1990 to 2008. Marine Pollution Bulletin 64, 1485-1494.
Leaper, R., Cooke, J., Trathan, P., Reid, K., Rowntree, V., Payne, R., 2006. Global climate drives
southern right whale (Eubalaena australis) population dynamics. Biol. Lett. 289–292.
Lee, M.-J., Pramyothin, P., Karastergiou, K., Fried, S.K., 2014. Deconstructing the roles of
glucocorticoids in adipose tissue biology and the development of central obesity.
Biochimica et Biophysica Acta (BBA) - Molecular Basis of Disease 1842, 473-481.

References
188
Lefebvre, K., L. Powell, C., Busman, M., J. Doucette, G., Moeller, P., B. Silver, J., Miller, P., P.
Hughes, M., Singaram, S., Silver, M., Tjeerdema, R., 1999. Detection of domoic acid in
northern anchovies and California sea lions associated with an unusual mortality event,
Vol 7, 85-92 pp.
Levine, R.L., Garland, D., Oliver, C.N., Amici, A., Climent, I., Lenz, A.-G., Ahn, B.-W., Shaltiel,
S., Stadtman, E.R., 1990. Determination of carbonyl content in oxidatively modified
proteins, In: Methods in Enzymology. Academic Press, pp. 464-478.
Levine, T.R., Hullett, C.R., 2002. Eta Squared, Partial Eta Squared, and Misreporting of Effect
Size in Communication Research. Human Communication Research 28, 612-625.
Li, Z., Srivastava, P., 2003. Heat-Shock Proteins. Current Protocols in Immunology 58, A.1T.1-
A.1T.6.
Liberzon, I., Krstov, M., Young, E.A., 1997. Stress-restress: Effects on ACTH and fast feedback.
Psychoneuroendocrinology 22, 443-453.
Litchfield, C., Greenberg, A.J., Caldwell, D.K., Caldwell, M.C., Sipos, J.C., Ackman, R.G., 1975.
Comparative lipid patterns in acoustical and nonacoustical fatty tissues of dolphins,
porpoises and toothed whales. Comparative Biochemistry and Physiology Part B:
Comparative Biochemistry 50, 591-597.
Litchfield, C., Greenberg, A.J., Mead, J.G., 1976. The distinctive character of Ziphiidae head and
blubber fats. Cetology 23, 1-10.
Lockyer, C., 1981. The Migration of Whales, In: Aidley, D.J. (Ed.) Animal Migration. Cambridge
University Press, Cambridge.
Lockyer, C., 1984. Review of Baleen Whale (Mysticeti) Reproduction and Implications for
Management, Vol 6, 27-50 pp.
Lockyer, C., 1986. Body Fat Condition in Northeast Atlantic Fin Whales, Balaenoptera physalus,
and Its Relationship with Reproduction and Food Resource. Canadian Journal of Fisheries
and Aquatic Sciences 43, 142-147.
Lockyer, C., 1987. The relationship between body fat, food resource and reproductive energy costs
in North Atlantic fin whales (Balaenoptera physalus). Symp Zool Soc Lond 57, 343−361.
Lockyer, C., 1995. Investigations of aspects of the life history of the harbour porpoise, Phocoena
phocoena, in British waters. Rep. Int. Whal. Commn., 189-198.
Lockyer, C., 2007. All creatures great and smaller: a study in cetacean life history energetics.
Journal of the Marine Biological Association of the United Kingdom 87, 1035-1045.
Lockyer, C., Smellie, C.G., 1985. Assessment of reproductive status of female fin and sei whales
taken off Iceland from a histological examination of the uterine mucosa. Reports of the
International Whaling Commission 35, 343-348.
Lockyer, C., Waters, T., 2006. Weights and anatomical measurements of northeastern Atlantic fin
(Balaenoptera physalus) and sei (B. borealis) whales, Vol 2, 169-185 pp.
Lockyer, C.H., McConnell, L.C., Waters, T.D., 1984. The biochemical composition of fin whale
blubber. Canadian Journal of Zoology 62, 2553-2562.
Lockyer, C.H., McConnell, L.C., Waters, T.D., 1985. Body condition in terms of anatomical and
biochemical assessment of body fat in North Atlantic fin and sei whales. Canadian Journal
of Zoology 63, 2328-2338.
Lonati, G.L., Westgate, A.J., Pabst, D.A., Koopman, H.N., 2015. Nitrogen solubility in odontocete
blubber and mandibular fats in relation to lipid composition. The Journal of Experimental
Biology 218, 2620-2630.

References
189
Lowe, A.D., Bawazeer, S., Watson, D.G., McGill, S., Burchmore, R.J.S., Pomeroy, P.P., Kennedy,
M.W., 2017. Rapid changes in Atlantic grey seal milk from birth to weaning – immune
factors and indicators of metabolic strain. Scientific Reports 7, 16093.
Macbeth, B.J., Cattet, M.R.L., Obbard, M.E., Middel, K., Janz, D.M., 2012. Evaluation of hair
cortisol concentration as a biomarker of long-term stress in free-ranging polar bears.
Wildlife Society Bulletin 36, 747-758.
MacLeod, C.D., 2009. Global climate change, range changes and potential implications for the
conservation of marine cetaceans: a review and synthesis. Endanger. Spec. Res. 7, 125–
136.
MacLeod, C.D., 2018. Beaked Whales, Overview, In: Wursig, B., Thewissen, J.G.M., Kovacs, K.
(Eds.) Encyclopedia of Marine Mammals, 3rd Edition. Academic Press.
MacLeod, C.D., D'Amico, A., 2006. A review of knowledge about behaviour and ecology of
beaked whales in relation to assessing and mitigtaing potential impacts from anthropogenic
noise. . Journal of Cetacean Research and Management 7, 211-222.
Mansour, A.H., McKay, D., Lien, J., Orr, J.C., Banoub, J.H., Oien, N., Stenson, G., 2002.
Determination of pregnancy status from blubber samples in minke whales (Balaenoptera
acutorostrata). Marine Mammal Science 18, 112-120.
Martinez, B., Khudyakov, J.I., Rutherford, K., Crocker, D.E., Gemmell, N., Ortiz, R.M., 2018.
Adipose transcriptome analysis provides novel insights into molecular regulation of
prolonged fasting in northern elephant seal pups. Physiological Genomics 50, 495-503.
Masuzaki, H., Paterson, J., Shinyama, H., Morton, N.M., Mullins, J.J., Seckl, J.R., Flier, J.S., 2001.
A Transgenic Model of Visceral Obesity and the Metabolic Syndrome. Science 294, 2166-
2170.
McClelland, S.J., Gay, M., Pabst, D.A., Dillaman, R., Westgate, A.J., Koopman, H.N., 2012.
Microvascular patterns in the blubber of shallow and deep diving odontocetes. Journal of
Morphology 273, 932-942.
McConkey, S., Lalas, C., Dawson, S., 2002. Moult and changes in body shape and pelage in
known‐age male New Zealand sea lions (Phocarctos hookeri). New Zealand Journal of
Zoology 29, 53-61.
McEwen, B.S., Sakai, R.R., Spencer, R.L., 1993. Adrenal steroid effects on the brain: Versatile
hormones with good and bad effects., In: Schulkin, J. (Ed.) Hormonally induced changes
in mind and brain. Academic Press., San Diego, CA, US., pp. 157-189.
McFee, W., Hopkins-Murphy, S.R., Schwacke, L., 2006. Trends in bottlenose dolphin (Tursiops
truncatus) strandings in South Carolina, USA, 1997-2003: Implications for the Southern
North Carolina and South Carolina Management Units, Vol 8, 195-201 pp.
McKinney, M.A., Atwood, T., Dietz, R., Sonne, C., Iverson, S.J., Peacock, E., 2014. Validation
of adipose lipid content as a body condition index for polar bears. Ecology and Evolution
4, 516-527.
McLellan, W.A., Koopman , H.N., Rommel, S.A., Read, A.J., Potter, C.W., Nicolas, J.R., 2002.
Ontogenetic allometry and body composition of the harbor porpoises (Phocoena
phocoena) from the western north Atlantic. Journal of Zoology 257, 457–471.
McMahon, M., Gerich, J., Rizza, R., 1988. Effects of glucocorticoids on carbohydrate metabolism.
Diabetes/Metabolism Reviews 4, 17-30.
Mead, J.G., 1989. Beaked whales of the genus Mesoplodon., In: Ridgway, S.H., Harrison, R.
(Eds.) Handbook of Marine Mammals: River Dolphins and Toothes Whales. Academic
Press, San Diego, pp. 349-430.

References
190
Meseguer, A., Puche, C., Cabero, A., 2002. Sex Steroid Biosynthesis in White Adipose Tissue.
Horm Metab Res 34, 731-736.
Metcalfe, C.D., Koenig, B., Metcalfe, T., Paterson, G., Sears, R., 2004. Intra- and inter-species
differences in persistent organic contaminants in the blubber of blue whales and humpback
whales from the Gulf of St. Lawrence, Canada. Marine Environmental Research 57, 245-
260.
Miller, C.A., Best, P.B., Perryman, W.L., Baumgartner, M.F., Moore, M.J., 2012a. Body shape
changes associated with reproductive status, nutritive condition and growth in right whales
Eubalaena glacialis and E. australis. Marine Ecology Progress Series 459, 135-156.
Miller, P.J.O., Biuw, M., Watanabe, Y.Y., Thompson, D., Fedak, M.A., 2012b. Sink fast and swim
harder! Round-trip cost-of-transport for buoyant divers. The Journal of Experimental
Biology 215, 3622-3630.
Miller, P.J.O., Johnson, M.P., Tyack, P.L., Terray, E.A., 2004. Swimming gaits, passive drag and
buoyancy of diving sperm whales <em>Physeter macrocephalus</em>. Journal of
Experimental Biology 207, 1953-1967.
Miller, P.J.O., Narazaki, T., Isojunno, S., Aoki, K., Smout, S.C., Sato, K., 2016. Body density and
diving gas volume of the northern bottlenose whale (<em>Hyperoodon ampullatus</em>).
The Journal of Experimental Biology 219, 2458-2468.
Møller, A.P., Christe, P., Erritzøe, J., Mavarez, J., 1998. Condition, Disease and Immune Defence.
Oikos 83, 301-306.
Montie, E.W., Garvin, S.R., Fair, P.A., Bossart, G.D., Mitchum, G.B., McFee, W.E., Speakman,
T., Starczak, V.R., Hahn, M.E., 2008. Blubber morphology in wild bottlenose dolphins
(Tursiops truncatus) from the Southeastern United States: Influence of geographic location,
age class, and reproductive state. Journal of Morphology 269, 496-511.
Moore, M.J., Miller, C.A., Morss, M.S., Arthur, R., Lange, W.A., Prada, K.G., Marx, M.K., Frey,
E.A., 2001. Ultrasonic measurement of blubber thickness in right whales. Journal of
Cetacean Research and Management Special Issue 2.
Morin, P.A., Scott Baker, C., Brewer, R.S., Burdin, A.M., Dalebout, M.L., Dines, J.P., Fedutin, I.,
Filatova, O., Hoyt, E., Jung, J.-L., Lauf, M., Potter, C.W., Richard, G., Ridgway, M.,
Robertson, K.M., Wade, P.R., 2017. Genetic structure of the beaked whale genus Berardius
in the North Pacific, with genetic evidence for a new species. Marine Mammal Science 33,
96-111.
Moritz, R.E., Bitz, C.M., Steig, E.J., 2002. Dynamics of Recent Climate Change in the Arctic.
Science 297, 1497.
Morrissey, P.A., Sheehy, P.J.A., Galvin, K., Kerry, J.P., Buckley, D.J., 1998. Lipid stability in
meat and meat products. Meat Science 49, S73-S86.
Munck, A., Guyre, P.M., Holbrook, N.J., 1984. Physiological Functions of Glucocorticoids in
Stress and Their Relation to Pharmacological Actions*. Endocrine Reviews 5, 25-44.
Myers, R.A., Barrowman, N.J., Hoenig, J.M., Qu, Z., 1996. The collapse of cod in Eastern Canada:
the evidence from tagging data. ICES J Mar Sci 53, 629−640.
Narazaki, T., Isojunno, S., Nowacek, D.P., Swift, R., Friedlaender, A.S., Ramp, C., Smout, S.,
Aoki, K., Deecke, V.B., Sato, K., Miller, P.J.O., 2018. Body density of humpback whales
(Megaptera novaengliae) in feeding aggregations estimated from hydrodynamic gliding
performance. PLOS ONE 13, e0200287.

References
191
Natarajan, S., Xu, C., Caperna, T.J., Garrett, W.M., 2005. Comparison of protein solubilization
methods suitable for proteomic analysis of soybean seed proteins. Analytical Biochemistry
342, 214-220.
Negrão, A.B., Deuster, P.A., Gold, P.W., Singh, A., Chrousos, G.P., 2000. Individual reactivity
and physiology of the stress response. Biomedicine & Pharmacotherapy 54, 122-128.
Neilson, J.L., Straley, J.M., Gabriele, C.M., Hills, S., 2009. Non-lethal entanglement of humpback
whales (Megaptera novaeangliae) in fishing gear in northern Southeast Alaska. Journal of
Biogeography 36, 452-464.
Neimanis, A.S., Read, A.J., Foster, R.A., Gaskin, D.E., 2000. Seasonal regression in testicular size
and histology in harbour porpoises (Phocoena phocoena) from the Bay of Fundy and Gulf
of Maine. Journal of Zoology 250, 221–229.
Nesargikar, P.N., Spiller, B., Chavez, R., 2012. The complement system: history, pathways,
cascade and inhibitors. European Journal of Microbiology & Immunology 2, 103-111.
Nevenzel, J.C., 1970. Occurrence, function and biosynthesis of wax esters in marine organisms.
Lipids 5, 308-319.
Newton, C.J., Samuel, D.L., James, V.H.T., 1986. Aromatase activity and concentrations of
cortisol, progesterone and testosterone in breast and abdominal adipose tissue. J. Steroid
Biochem. 24, 1033-1039.
Nordøy, E.S., 1995. Do minke whales (Balaenoptera acutorostrata) digest wax esters. Br J Nutr
74, 717–722.
Noren, P.D., Williams, M.T., Berry, P., Butler, E., 2009. Thermoregulation during swimming and
diving in bottlenose dolphins, Tursiops truncatus. J Comp Physiol B 169, 93-99.
Ólafsdóttir, D., Víkingsson, G.A., Halldórsson, S.D., Sigurjónsson, J., 2002. Growth and
reproduction in harbour porpoises (Phocoena phocoena) in Icelandic waters. NAMMCO
Scientific Publications 5, 195-210.
Olsen, E., Grahl-Nielsen, O., 2003. Blubber fatty acids of minke whales: stratification, population
identification and relation to diet. Marine Biology 142, 13-24.
Ortiz, R.M., Houser, D.S., Wade, C.E., Ortiz, C.L., 2003. Hormonal changes associated with the
transition between nursing and natural fasting in northern elephant seals (Mirounga
angustirostris). General and Comparative Endocrinology 130, 78-83.
Ortiz, R.M., Wade, C.E., Ortiz, C.L., 2001. Effects of prolonged fasting on plasma cortisol and
TH in postweaned northern elephant seal pups. American Journal of Physiology -
Regulatory, Integrative and Comparative Physiology 280, R790-R795.
Ortiz, R.M., Worthy, G.A.J., 2000. Effects of capture on adrenal steroid and vasopressin
concentrations in free-ranging bottlenose dolphins. Comparative Biochemistry and
Physiology Part A 125, 317–324
Packard, G.C., Boardman, T.J., 1999. The use of percentages and size-specific indices to normalize
physiological data for variation in body size: wasted time, wasted effort? Comparative
Biochemistry and Physiology Part A: Molecular & Integrative Physiology 122, 37-44.
Pallin, L., Robbins, J., Kellar, N., Bérubé, M., Friedlaender, A., 2018a. Validation of a blubber-
based endocrine pregnancy test for humpback whales. Conservation Physiology 6, coy031-
coy031.
Pallin, L.J., Baker, C.S., Steel, D., Kellar, N.M., Robbins, J., Johnston, D.W., Nowacek, D.P.,
Read, A.J., Friedlaender, A.S., 2018b. High pregnancy rates in humpback whales
(Megaptera novaeangliae) around the Western Antarctic Peninsula, evidence of a rapidly
growing population. Royal Society Open Science 5.

References
192
Palsbøll, P.J., Allen, J., Bérube´, M., Clapham, P.J., Feddersen, T.P., Hammond, P.S., Hudson,
R.R., Jørgensen, H., Katona, S., Larsen, A.H., Larsen, F., Lien, J., Mattila, D.K.,
Sigurjónsson, J., Sears, R., Smith, T., Sponer, R., Stevick, P., Øien, N., 1997. Genetic
tagging of humpback whales. Nature 388, 767.
Palsbøll, P.J., Vader, A., Bakke, I., El-Gewely, M.R., 1992. Determination of gender in cetaceans
by the polymerase chain reaction. Canadian Journal of Zoology 70, 2166-2170.
Panchout, F., Letendre, J., Bultelle, F., Denier, X., Rocher, B., Chan, P., Vaudry, D., Durand, F.,
2013. Comparison of Protein-Extraction Methods for Gills of the Shore Crab, Carcinus
maenas (L.), and Application to 2DE. Journal of Biomolecular Techniques : JBT 24, 218-
223.
Parker, K.L., Barboza, P.S., Gillingham, M.P., 2009. Nutrition integrates environmental responses
of ungulates. Functional Ecology 23, 57-69.
Paterson, W., Sparling, C.E., Thompson, D., Pomeroy, P.P., Currie, J.I., McCafferty, D.J., 2012.
Seals like it hot: Changes in surface temperature of harbour seals (Phocina vitulina) from
late pregnancy to moult. Journal of Thermal Biology 37, 454-461.
Patterson, I.A.P., Reid, R.J., Wilson, B., Grellier, K., Ross, H.M., Thompson, P.M., 1998.
Evidence for infanticide in bottlenose dolphins: an explanation for violent interactions with
harbour porpoises?, Vol 265, 1167-1170 pp.
Peckett, A.J., Wright, D.C., Riddell, M.C., 2011. The effects of glucocorticoids on adipose tissue
lipid metabolism. Metabolism: clinical and experimental 60, 1500-1510.
Pedernera-Romano, C., Valdez, R.A., Singh, S., Chiappa, X., Romano, M.C., Galindo, F., 2006.
Salivary cortisol in captive dolphins (Tursiops truncatus): a non-invasive technique.
Animal Welfare 15, 359-362.
Peig, J., Green, A.J., 2009. New perspectives for estimating body condition from mass/length data:
the scaled mass index as an alternative method. Oikos 118, 1891-2009.
Peig, J., Green, A.J., 2010. The paradigm of body condition: a critical reappraisal of current
methods based on mass and length. Functional Ecology 24, 1323-1332.
Perez, S., Garcia-Lopez, A., De Stephanis, R., Gimenez, J., Garcia-Tiscar, S., Verborgh, P.,
Mancera, J.M., Martinez-Rodriguez, G., 2011. Use of blubber levels of progesterone to
determine pregnancy in free-ranging live cetaceans. Marine Biology 158, 1677-1680.
Perryman, W.L., Lynn, M.S., 2002. Evaluation of nutritive condition and reproductive status of
migrating gray whales (Eschrichtius robustus) based on analysis of photogrammetric data.
Journal of Cetacean Research and Management 4, 155-164.
Pineda, M.H., 2003. Female Reproductive System : Ovarian Hormones. McDonald's Veterinary
Endocrinology and Reproduction.
Pitcher, K.W., Calkins, D.G., Pendleton, G.W., 1998. Reproductive performance of female Steller
sea lions: an energetics-based reproductive strategy? Canadian Journal of Zoology 76,
2075-2083.
Pitt, J.A., Larivière, S., Messier, F., 2006. Condition Indices and Bioelectrical Impedance Analysis
to Predict Body Condition of Small Carnivores. Journal of Mammalogy 87, 717-722.
Place, A.R., 1992. Comparative aspects of lipid digestion and absorption: physiological correlates
of wax ester digestion. Am J Physiol 263.
Pomeroy, P.P., Fedak, M.A., Rothery, P., Anderson, S., 1999. Consequences of maternal size for
reproductive expenditure and pupping success of grey seals at North Rona, Scotland.
Journal of Animal Ecology 68, 235-253.

References
193
Pond, C.M., 1978. Morphological Aspects and the Ecological and Mechanical Consequences of
Fat Deposition in Wild Vertebrates. Annual Review of Ecology and Systematics 9, 519-
570.
Pond, C.M., 1998. The fats of life. Cambridge University Press, Cambridge.
Prado, J.H.F., Mattos, P.H., Silva, K.G., Secchi, E.R., 2016. Long-Term Seasonal and Interannual
Patterns of Marine Mammal Strandings in Subtropical Western South Atlantic. PLOS ONE
11, e0146339.
Ramp, C., Berube, M., Palsboll, P., Hagen, W., Sears, R., 2010a. Sex-specific survival in the
humpback whale Megaptera novaeangliae in the Gulf of St. Lawrence, Canada. Marine
Ecology Progress Series 400, 267-276.
Ramp, C., Delarue, J., Palsbøll, P.J., Sears, R., Hammond, P.S., 2015. Adapting to a Warmer
Ocean—Seasonal Shift of Baleen Whale Movements over Three Decades. PLOS ONE 10,
e0121374.
Ramp, C., Hagen, W., Palsboll, P., Bérubé, M., Sears, R., 2010b. Age-related multi-year
associations in female humpback whales (Megaptera novaeangliae). Behavioral Ecology
and Sociobiology. 64, 1563-1576.
Read, A.J., 1990. Estimation of body condition in harbour porpoises, Phocoena phocoena.
Canadian Journal of Zoology 68, 1962-1966.
Rechsteiner, E.U., Rosen, D.A.S., Trites, A.W., 2013. Energy requirements of Pacific white-sided
dolphins (Lagenorhynchus obliquidens) as predicted by a bioenergetic model. Journal of
Mammalogy 94, 820-832.
Reid, C.N., Stevenson, M., Abogunrin, F., Ruddock, M.W., Emmert-Streib, F., Lamont, J.V.,
Williamson, K.E., 2013. Standardization of Diagnostic Biomarker Concentrations in
Urine: The Hematuria Caveat. PLOS ONE 7, e53354.
Ridgway, S.H., Howard, R., 1979. Dolphin lung collapse and intramuscular circulation during free
diving: evidence from nitrogen washout. Science 206, 1182-1183.
Robbins, J., 2007. Structure and dynamics of the Gulf of Maine humpback whale population.
Doctoral Dissertation, University of St. Andrews, UK.
Robeck, T.R., O’Brien, J.K., 2018. Reproductive Physiology, In: Thewissen, J.G.M., Kovacs,
K.M. (Eds.) Encyclopedia of Marine Mammals. Academic Press, London, UK, pp. 807–
811.
Robeck, T.R., Steinman, K.J., Greenwell, M., Ramirez, K., Van Bonn, W., Yoshioka, M.,
Katsumata, E., Dalton, L., Osborn, S., O'Brien, J.K., 2009. Seasonality, estrous cycle
characterization, estrus synchronization, semen cryopreservation, and artificial
insemination in the Pacific white-sided dolphin (Lagenorhynchus obliquidens).
Reproduction 138, 391–405.
Robeck, T.R., Steinman, K.J., O’Brien, J.K., 2016. Characterization and longitudinal monitoring
of serum progestagens and estrogens during normal pregnancy in the killer whale (Orcinus
orca). General and Comparative Endocrinology 236, 83-97.
Rolland, R.M., Parks, S.E., Hunt, K.E., Castellote, M., Corkeron, P.J., Nowacek, D.P., Wasser,
S.K., Kraus, S.D., 2012. Evidence that ship noise increases stress in right whales.
Proceedings of the Royal Society B: Biological Sciences 279, 2363-2368.
Rosen, D.A.S., Trites, A.W., 2013. Resting Metabolic Rate of a Mature Male Beluga Whale
(Delphinapterus leucas). Aquatic Mammals 39, 85-88.

References
194
Ruchonnet, D., Boutoute, M., Guinet, C., Mayzaud, P., 2006. Fatty acid composition of
Mediterranean fin whale Balaenoptera physalus blubber with respect to body heterogeneity
and trophic interaction. Marine Ecology Progress Series 311, 165-174.
Ryan, C., McHugh, B., O'Connor, I., Berrow, S., 2012. Lipid content of blubber biopsies is not
representative of blubber in situ for fin whales (Balaenoptera physalus). Marine Mammal
Science 00, 1-6.
Ryg, M., Lydersen, C., Knutsen, L.Ø., Bjørge, A., Smith, T.G., Øritsland, N.A., 1993. Scaling of
insulation in seals and whales. Journal of Zoology 230, 193–206.
Sajic, T., Hopfgartner, G., Szanto, I., Varesio, E., 2011. Comparison of three detergent-free protein
extraction protocols for white adipose tissue. Analytical Biochemistry 415, 215-217.
Samra, J.S., Clark, M.L., Humphreys, S.M., MacDonald, I.A., Bannister, P.A., Frayn, K.N., 1998.
Effects of Physiological Hypercortisolemia on the Regulation of Lipolysis in Subcutaneous
Adipose Tissue. The Journal of Clinical Endocrinology & Metabolism 83, 626-631.
Samuel, A.M., Worthy, G.A.J., 2004. Variability in fatty acid composition of bottlenose dolphin
(Tursiops truncatus) blubber as a function of body site, season, and reproductive state.
Canadian Journal of Zoology 82, 1933-1942.
Santos, M.B., Pierce, G.J., Learmonth, J.A., Reid, R.J., Ross, H.M., Patterson, I.A.P., Reid, D.G.,
Beare, D., 2004. Variability in the diet of harbour porpoises (Phocoena phocoena) in
Scottish waters 1992-2003. Marine Mammal Science 20, 1-27.
Sapolsky, R.M., 1987. Stress, social status, and reproductive physiology in free‐living baboons.
Sapolsky, R.M., Romero, L.M., Munck, A.U., 2000. How Do Glucocorticoids Influence Stress
Responses? Integrating Permissive, Suppressive, Stimulatory, and Preparative Actions.
Endocrine Reviews 21, 55-89.
Saraswathy, N., Ramalingam, P., 2011. 11 - Two-dimensional gel electrophoresis of proteins, In:
Saraswathy, N., Ramalingam, P. (Eds.) Concepts and Techniques in Genomics and
Proteomics. Woodhead Publishing, pp. 159-170.
Sargent, J.R., 1978. Marine wax esters. Science Progress (1933- ) 65, 437-458.
Sargent, J.R., Gatten, R.R., McIntosh, R., 1977. Wax esters in the marine environment — their
occurrence, formation, transformation and ultimate fates. Marine Chemistry 5, 573-584.
Sato, K., Aoki, K., Watanabe, Y.Y., Miller, P.J.O., 2013. Neutral buoyancy is optimal to minimize
the cost of transport in horizontally swimming seals. Scientific Reports 3, 2205.
Schaefer, H., Kohn, B., Schweigert, F.J., Raila, J., 2011. Quantitative and Qualitative Urine Protein
Excretion in Dogs with Severe Inflammatory Response Syndrome. Journal of Veterinary
Internal Medicine 25, 1292-1297.
Schittek, B., Hipfel, R., Sauer, B., Bauer, J., Kalbacher, H., Stevanovic, S., Schirle, M., Schroeder,
K., Blin, N., Meier, F., Rassner, G., Garbe, C., 2001. Dermcidin: a novel human antibiotic
peptide secreted by sweat glands. Nat Immunol 2, 1133-1137.
Scholin, C.A., Gulland, F., Doucette, G.J., Benson, S., Busman, M., Chavez, F.P., Cordaro, J.,
DeLong, R., De Vogelaere, A., Harvey, J., Haulena, M., Lefebvre, K., Lipscomb, T.,
Loscutoff, S., Lowenstine, L.J., Marin Iii, R., Miller, P.E., McLellan, W.A., Moeller,
P.D.R., Powell, C.L., Rowles, T., Silvagni, P., Silver, M., Spraker, T., Trainer, V., Van
Dolah, F.M., 2000. Mortality of sea lions along the central California coast linked to a toxic
diatom bloom. Nature 403, 80.
Schulte-Hostedde, A.I., Zinner, B., Millar, J.S., Hickling, G.J., 2005. Restitution of mass-seize
residuals: validating body condition indices. Ecology 86, 155-163.

References
195
Schulz, T.M., Bowen, W.D., 2004. Pinniped lactation strategies: evaluation of data on maternal
and offspring life history traits. Marine Mammal Science 20, 86-114.
Schwacke, L.H., Smith, C.R., Townsend, F.I., Wells, R.S., Hart, L.B., Balmer, B.C., Collier, T.K.,
De Guise, S., Fry, M.M., Guillette, L.J., Lamb, S.V., Lane, S.M., McFee, W.E., Place, N.J.,
Tumlin, M.C., Ylitalo, G.M., Zolman, E.S., Rowles, T.K., 2014. Health of Common
Bottlenose Dolphins (Tursiops truncatus) in Barataria Bay, Louisiana, Following the
Deepwater Horizon Oil Spill. Environmental Science & Technology 48, 93-103.
Seckl, J.R., Walker, B.R., 2001. Minireview: 11β-Hydroxysteroid Dehydrogenase Type 1— A
Tissue-Specific Amplifier of Glucocorticoid Action. Endocrinology 142, 1371-1376.
Seyboth, E., Groch, K.R., Dalla Rosa, L., Reid, K., Flores, P.A.C., Secchi, E.R., 2016. Southern
Right Whale (Eubalaena australis) Reproductive Success is Influenced by Krill
(Euphausia superba) Density and Climate. Scientific Reports 6, 28205.
Sheoran, I.S., Ross, A.R.S., Olson, D.J.H., Sawhney, V.K., 2009. Compatibility of plant protein
extraction methods with mass spectrometry for proteome analysis. Plant Science 176, 99-
104.
Shevchenko, A., Wilm, M., Vorm, O., Mann, M., 1996. Mass Spectrometric Sequencing of
Proteins from Silver-Stained Polyacrylamide Gels. Analytical Chemistry 68, 850-858.
Shier, P.D., Schemmel, R., 1975. Effects of Diet, Age, Strain and Anatomical Site on Fat Depot
Triglyceride and Fatty Acid Content in Rats. Proceedings of the Society for Experimental
Biology and Medicine 149, 864-870.
Siebert, U., Gilles, A., Lucke, K., Ludwig, M., Benke, H., Kock, K.-H., Scheidat, M., 2006. A
decade of harbour porpoise occurrence in German waters—Analyses of aerial surveys,
incidental sightings and strandings. Journal of Sea Research 56, 65-80.
Singleton, E.M., McLellan, W.A., Koopman, H.N., Pokorny, A., Scharf, F.S., Pabst, A.D., 2017.
Lipid composition and thermal properties of the blubber of Gervais’ beaked whale
(Mesoplodon europaeus) across ontogeny. Marine Mammal Science 33, 695-705.
Smith, H.R., Worthy, G.A.J., 2006. Stratification and intra- and inter-specific differences in fatty
acid composition of common dolphin (Delphinus sp.) blubber: Implications for dietary
analysis. Comparative Biochemistry and Physiology Part B: Biochemistry and Molecular
Biology 143, 486-499.
Solvang, H.K., Yanagihara, H., Øien, N., Haug, T., 2017. Temporal and geographical variation in
body condition of common minke whales (Balaenoptera acutorostrata acutorostrata) in the
Northeast Atlantic. Polar Biol 40, 667–683.
Southern, S., Allen, A., Kellar, N., 2002. Molecular signature of physiological stress in dolphins
based on protein expression profiling of skin. . Administrative Report LJ-02-27 to the
Southwest Fisheries Science Center, US National Marine Fisheries Service, La Jolla, CA,
USA.
Spitz, S.S., Herman, L.M., Pack, A.A., 2000. Measuring sizes of humpback whales (Megaptera
novaeangliae) by underwater videogrammetry. Marine Mammal Science 16, 664-676.
St. Aubin, D.J., Forney, K.A., Chivers, S.J., Scott, M.D., Danil, K., Romano, T.A., Wells, R.S.,
Gulland, F.M.D., 2013. Hematological, serum, and plasma chemical constituents in
pantropical spotted dolphins (Stenella attenuata) following chase, encirclement, and
tagging. Marine Mammal Science 29, 14-35.
St. Aubin, D.J., Ridgway, S.H., Wells, R.S., 1996. Dolphin thyroid and adrenal hormones:
circulating levels in wild and semidomesticated Tursiops truncatus, and influence of sex,
age and season. Marine Mammal Science 12, 1-13.

References
196
Stadtman, E.R., 1990. Metal ion-catalyzed oxidation of proteins: Biochemical mechanism and
biological consequences. Free Radical Biology and Medicine 9, 315-325.
Steffen, P., Kwiatkowski, M., Robertson, W.D., Zarrine-Afsar, A., Deterra, D., Richter, V.,
Schlüter, H., 2016. Protein species as diagnostic markers. Journal of Proteomics 134, 5-18.
Stegall, V.S., McLellan, W.A., Dillaman, R.M., Read, A.J., Pabst, D.A., 1999. Epaxial muscle
morphology of robust vs. emaciated harbor porpoises. American Zoologist 39, 84.
Steiger, G.H., Calambokidis, J., 2000. Reproductive rates of humpback whales off California.
Marine Mammal Science 16, 220-239.
Stimson, R.H., Andersson, J., Andrew, R., Redhead, D.N., Karpe, F., Hayes, P.C., Olsson, T.,
Walker, B.R., 2009. Cortisol Release From Adipose Tissue by 11β-Hydroxysteroid
Dehydrogenase Type 1 in Humans. Diabetes. 58, 46-53.
Stirling, I., Thiemann, G.W., Richardson, E., 2008. Quantitative Support for a Subjective Fatness
Index for Immobilized Polar Bears. The Journal of Wildlife Management 72, 568-574.
Strack, A.M., Sebastien, R.J., Schwartz, M.W., Dallman, M.F., 1995. Glucocorticoids and insulin:
reciprocal signals for energy balance. American Journal of Physiology 268, 142-149.
Stulnig, T.M., Waldhäusl, W., 2004. 11β-Hydroxysteroid dehydrogenase Type 1 in obesity and
Type 2 diabetes. Diabetologia 47, 1-11.
Sugimoto, M.A., #xe9, Vago, J.P., Teixeira, M.M., Sousa, L., #xe2, Pires, n., 2016. Annexin A1
and the Resolution of Inflammation: Modulation of Neutrophil Recruitment, Apoptosis,
and Clearance. Journal of Immunology Research 2016, 13.
Swaim, Z.T., Westgate, A.J., Koopman, H.N., Rolland, R.M., Kraus, S.D., 2009. Metabolism of
ingested lipids by North Atlantic right whales. Endangered Species Research 6, 259-271.
Tanabe, S., Iwata, H., Tatsukawa, R., 1994. Global contamination by persistent organochlorines
and their ecotoxicological impact on marine mammals. Science of The Total Environment
154, 163-177.
Thompson, L.A., Spoon, T.R., Goertz, C.E.C., Hobbs, R.C., Romano, T.A., 2014. Blow Collection
as a Non-Invasive Method for Measuring Cortisol in the Beluga (<italic>Delphinapterus
leucas</italic>). PLoS ONE 9, e114062.
Thompson, P., Rothery, P., 1987. Age and sex differences in the timing of moult in the common
seal, Phoca vitulina. Journal of Zoology 212, 597-603.
Thomson, C.A., Geraci, J.R., 1986. Cortisol, Aldosterone, and Leucocytes in the Stress Response
of Bottlenose Dolphins, Tursiops truncatus. Canadian Journal of Fisheries and Aquatic
Sciences 43, 1010-1016.
Tornero, V., Borrell, A., Forcada, J., Pubill, E., Aguilar, A., 2004. Retinoid and lipid patterns in
the blubber of common dolphins (Delphinus delphis): implications for monitoring vitamin
A status. Comparative Biochemistry and Physiology Part B: Biochemistry and Molecular
Biology 137, 391-400.
Trana, M.R., Roth, J.D., Tomy, G.T., Anderson, W.G., Ferguson, S.H., 2015. Influence of sample
degradation and tissue depth on blubber cortisol in beluga whales. Journal of Experimental
Marine Biology and Ecology 462, 8-13.
Trana, M.R., Roth, J.D., Tomy, G.T., Anderson, W.G., Ferguson, S.H., 2016. Increased blubber
cortisol in ice-entrapped beluga whales (Delphinapterus leucas). Polar Biol 39, 1563-1569.
Trayhurn, P., Wood, I.S., 2004. Adipokines: inflammation and the pleiotropic role of white adipose
tissue. British Journal of Nutrition 92, 347-355.

References
197
Trego, M.L., Kellar, N.M., Danil, K., 2013. Validation of Blubber Progesterone Concentrations
for Pregnancy Determination in Three Dolphin Species and a Porpoise. PLoS ONE 8,
e69709.
Tyack, P.L., Bailey, H., Crocker, D.E., Estes, J.E., Francis, C.D., Harwood, J., Schwacke, L.H.,
Thomas, L., Wartzok, D., 2017. Approaches to Understanding the Cumulative Effects of
Stressors on Marine Mammals. The National Academies of Sciences, Engineering and
Medicine.
Tyack, P.L., Johnson, M., Aguilar de Soto, N., Sturlese, A., Madsen, P.T., 2006. Extreme diving
of beaked whales. Journal of Experimental Biology 209, 4238-4253.
Varanasi, U., Malins, D.C., 1971. Unique lipids of the porpoise (Tursiops gilli): Differences in
triacyl glycerols and wax esters of acoustic (mandibular canal and melon) and blubber
tissues. Biochimica et Biophysica Acta (BBA) - Lipids and Lipid Metabolism 231, 415-
418.
Venn-Watson, S., Colegrove, K.M., Litz, J., Kinsel, M., Terio, K., Saliki, J., Fire, S., Carmichael,
R., Chevis, C., Hatchett, W., Pitchford, J., Tumlin, M., Field, C., Smith, S., Ewing, R.,
Fauquier, D., Lovewell, G., Whitehead, H., Rotstein, D., McFee, W., Fougeres, E., Rowles,
T., 2015. Adrenal Gland and Lung Lesions in Gulf of Mexico Common Bottlenose
Dolphins (Tursiops truncatus) Found Dead following the Deepwater Horizon Oil Spill.
PLOS ONE 10, e0126538.
Verrier, D., Groscolas, R., Guinet, C., Arnould, J.P.Y., 2011. Development of fasting abilities in
subantarctic fur seal pups: balancing the demands of growth under extreme nutritional
restrictions. Functional Ecology 25, 704-717.
Víkingsson, G., Sigurjónsson, J., Gunnlaugsson, T., 1988. On the Relationship Between Weight,
Length and Girth Dimensions in Fin and Sei Whales Caught off Iceland, Vol 38, 323-326
pp.
Víkingsson, G.A., 1995. Body condition of fin whales during summer off Iceland, In: Arnoldus
Schytte Blix, L.W., Øyvind, U. (Eds.) Developments in Marine Biology. Elsevier Science,
pp. 361-369.
Vikingsson, G.A., Heide-Jørgensen, M.P., 2005. A Note on the Movements of Minke Whales
Tracked by Satellite in Icelandic Waters in 2001-2004. The Scientific Committee of the
International Whaling Commission. SC/57/O9.
Wang, Z., Chen, Z., Xu, S., Ren, W., Zhou, K., Yang, G., 2015. ‘Obesity’ is healthy for cetaceans?
Evidence from pervasive positive selection in genes related to triacylglycerol metabolism.
Scientific Reports 5, 14187.
Ward, E.J., Holmes, E.E., Balcomb, K.C., 2009. Quantifying the effects of prey abundance on
killer whale reproduction. Journal of Applied Ecology 46, 632-640.
Wassmann, P., Duarte, C.M., Agusti, S., Sejr, M.K., 2011. Footprints of climate change in the
Arctic marine ecosystem. Global Change Biology 17, 1235-1249.
Waugh, C.A., Huston, W.M., Noad, M.J., Bengtson Nash, S., 2011. Cytochrome P450 isozyme
protein verified in the skin of southern hemisphere humpback whales (Megaptera
novaeangliae): Implications for biochemical biomarker assessment. Marine Pollution
Bulletin 62, 758-761.
Waugh, C.A., Nichols, P.D., Noad, M.C., Bengtson Nash, S., 2012. Lipid and fatty acid profiles
of migrating Southern Hemisphere humpback whales Megaptera novaeangliae. Marine
Ecology Progress Series 471, 271-281.

References
198
Wedekin, L.L., Engel, M.H., Andriolo, A., Prado, P.I., Zerbini, A.N., Marcondes, M.M.C., Kinas,
P.G., Simões-Lopes, P.C., 2017. Running fast in the slow lane: rapid population growth of
humpback whales after exploitation. Marine Ecology Progress Series 575, 195-206.
Wessel, D., Flügge, U.I., 1984. A method for the quantitative recovery of protein in dilute solution
in the presence of detergents and lipids. Analytical Biochemistry 138, 141-143.
Whitehead, H.A.L., Gowans, S., Faucher, A., McCarrey, S.W., 1997. Population analysis of
Northern Bottlenose whales in the Gully, Nova Scotia. Marine Mammal Science 13, 173-
185.
Williams, R., Gero, S., Bejder, L., Calambokidis, J., Kraus, S.D., Lusseau, D., Read, A.J., Robbins,
J., 2011. Underestimating the damage: interpreting cetacean carcass recoveries in the
context of the Deepwater Horizon/BP incident. Conservation Letters 4, 228-233.
Williams, R., Vikingsson, G.A., Gislason, A., Lockyer, C., New, L., Thomas, L., Hammond, P.S.,
2013. Evidence for density-dependent changes in body condition and pregnancy rate of
North Atlantic fin whales over four decades of varying environmental conditions. ICES
Journal of Marine Science: Journal du Conseil 70, 1273-1280.
Williams, T.M., Blackwell, S.B., Richter, B., Sinding, M.-H.S., Heide-Jørgensen, M.P., 2017.
Paradoxical escape responses by narwhals (<em>Monodon monoceros</em>). Science
358, 1328-1331.
Williams, T.M., Fuiman, L.A., Kendall, T., Berry, P., Richter, B., Noren, S.R., Thometz, N.,
Shattock, M.J., Farrell, E., Stamper, A.M., Davis, R.W., 2015. Exercise at depth alters
bradycardia and incidence of cardiac anomalies in deep-diving marine mammals. Nature
Communications 6, 6055.
Worthy, G.A.J., Morris, P.A., Costa, D.P., Boeuf, B.J.L., 1992. Moult energetics of the northern
elephant seal (Mirounga angustirostris). Journal of Zoology 227, 257-265.
Worthy, G.A.J., Worthy, T.A.M., Yochem, P.K., Dold, C., 2013. Basal metabolism of an adult
male killer whale (Orcinus orca). Marine Mammal Science, n/a-n/a.
Wu, X., Xiong, E., Wang, W., Scali, M., Cresti, M., 2014. Universal sample preparation method
integrating trichloroacetic acid/acetone precipitation with phenol extraction for crop
proteomic analysis. Nat. Protocols 9, 362-374.
Xiong, Y.L., 2000. Protein oxidation and implications for muscle foods quality., In: Decker, E.A.,
Faustman, C., Lopez-Bote , C.J. (Eds.) Antioxidants in muscle foods. Wiley, New York,
pp. 85-111.
Young, R.A., 1976. Fat, Energy and Mammalian Survival. Amer. Zool. 16, 699-710.
Zhang, R., Barker, L., Pinchev, D., Marshall, J., Rasamoelisolo, M., Smith, C., Kupchak, P.,
Kireeva, I., Ingratta, L., Jackowski, G., 2004. Mining biomarkers in human sera using
proteomic tools. PROTEOMICS 4, 244-256.
Zhao, Z., Xu, Y., 2010. An extremely simple method for extraction of lysophospholipids and
phospholipids from blood samples. Journal of Lipid Research 51, 652-659.
Zimmer, W.M.X., Tyack, P.L., 2007. Repetitive shallow dives pose decompression risk in deep-
diving beaked whales. Marine Mammal Science 23, 888-925.
Zuur, A.F., Ieno, E.N., Elphick, C.S., 2010. A protocol for data exploration to avoid common
statistical problems. Methods in Ecology and Evolution 1, 3-14.

Supplementary Material
199
SUPPLEMENTARY MATERIAL
Supplementary Fig. 2. Total protein
standard curves across the different
Pierce™ BCA Protein Assays
(23225, Thermo Scientific, Rockford,
USA) used for total protein
quantification in the extracts
processed using methods 1 and 2.
Standard curves were almost identical
between assays, so measurement
error as a result of the assay procedure
or the reagents are unlikely to be the
cause of the measurement variability
in the sample extracts.
Supplementary Fig. 1. Variation in total protein concentration measurements in the
TCA:Acetone (left) and the Methanol:Chloroform extracts (right) between consecutive
Pierce™ BCA Protein Assays (23225, Thermo Scientific, Rockford, USA). There was no
obvious trend in change in total protein content between consecutive assays for the
TCA:Acetone extracts, but the Methanol:Chloroform extracts showed a consistent increase or
decrease between assays suggesting that protein resuspension in solution was a problem for
these extracts.

Supplementary Material
200
Supplementary Fig. 3. Example images of 1D SDS-PAGE analysis of harbour porpoise
blubber tissue extracts processed using Methods 1 and 2 on 4-12% Bis-Tris gels stained with
Bio-Safe Coomassie brilliant blue. Extracts show few protein bands only across the larger
size range. There is high background and some protein smearing. In addition, there is poor
reproducibility of bands across extracts and across gels.
Supplementary Fig. 4. Example images of 1D SDS-PAGE analysis of harbour porpoise
blubber tissue extracts processed using Method 3 on 4-12% Bis-Tris gels stained with Bio-
Safe Coomassie brilliant blue. Extracts show both more, and more consistent bands across
the full size range down the gels.