not for profit salary survey report 2015...not for profit salary survey report 2015 small to medium...
TRANSCRIPT

NOT FOR PROFIT
Salary Survey Report 2015 SMALL TO MEDIUM ARTS ORGANISATIONS THEATRE NETWORK (VIC) NOVEMBER 2015

THEATRE NETWORK (VIC) – SALARY SURVEY REPORT SMALL TO MEDIUM ARTS ORGANISATIONS
2
TABLE OF CONTENTS
Executive Summary .............................................................................................................. 3
INTRODUCTION .................................................................................................................... 5
Background ........................................................................................................................... 5
Methodology .......................................................................................................................... 5
PART 1 SURVEY RESPONDENT STATISTICS ........................................................................ 6
By State ................................................................................................................................ 6
By Type ................................................................................................................................. 7
PART 2 STAFF RESOURCING ............................................................................................... 8
Average Size ......................................................................................................................... 8
Number of Staff ..................................................................................................................... 8
Full-time and Part-time ......................................................................................................... 8
Distribution of Staff ............................................................................................................... 9
Distribution of Positions ........................................................................................................ 9
PART 3 AVERAGE SALARY COMPARISIONS ....................................................................... 10
Snapshot ............................................................................................................................. 10
Comparison to 2013, 2011 and 2009 .................................................................................. 10
Average Salary Comparison – Artistic Director/General Manager ........................................ 11
Average Salary Comparison by Turnover ............................................................................. 12
Average Salary Comparison by Organisational Type ............................................................ 13
PART 4 SALARY BANDS BY POSITION ............................................................................... 14
Artistic Director .................................................................................................................. 15
Producer ............................................................................................................................. 15
Associate Director ............................................................................................................... 16
Venue Manager/Production Manager .................................................................................. 17
Marketing Manager/Development Manager ......................................................................... 18
PART 5 NON-SALARY REMUNERATION BENEFITS ............................................................ 19
PART 6 PROFESSIONAL DEVELOPMENT BUDGETS ........................................................... 20
Snapshot ............................................................................................................................. 20
PART 7 SALARY INCREASES .............................................................................................. 21
Increases Implemented in 2015 .......................................................................................... 21
Increases Planned for 2014 and Two-year Comparison ....................................................... 22
PART 8 TENURE ................................................................................................................ 23
PART 9 OVERALL COMMENTS ............................................................................................ 24
Survey - Position Descriptions ............................................................................................ 24
FURTHER DISCUSSION ....................................................................................................... 26
Salary Benchmarking .......................................................................................................... 26
Benefits – Salary Sacrifice .................................................................................................. 27
Benefits – Employee Superannuation Contributions ............................................................ 27
Professional Development ................................................................................................... 28
Further Research and Recommendations ............................................................................ 28

THEATRE NETWORK (VIC) – SALARY SURVEY REPORT SMALL TO MEDIUM ARTS ORGANISATIONS
3
EXECUTIVE SUMMARY The Theatre Network (Vic) 2015 Salary Survey Report for Not for Profit Small to Medium Arts Organisations analyses results from an online survey distributed to the sector that garnered 80 valid responses. The survey established organisational size and turnover and included questions about salaries, benefits, professional development budgets and tenure. It is the fourth survey conducted by Theatre Network (Vic). This report compares results with previous surveys, conducted in 2009 (50 responses), 2011 (92 responses) and 2013 (96 responses). The survey was open to all not for profit arts organisations with a turnover of less than $4 million across Australia. In line with previous TNV surveys, there is a bias towards theatre and Victoria due to the remit of TNV, but it has continued to improve this year, with a more even distribution across the state and territories and with a higher representation of other artforms. In response to feedback from 2013, this year the positions of Finance Manager & Producer have been added. These positions received many responses and will remain in the survey for comparison in 2017 and beyond. Average salaries have increased since the 2009 survey across all positions; and have increased above CPI for all positions except Production/Venue Manager roles since 2013. The average salary for a General Manager/Executive Producer is $76,752 compared to $71,950 in 2013 (7% increase) and for Artistic Directors it is $75,479 compared to $70,418 in 2013 (7% increase). These gains are lower than the increases for both roles between 2011 and 2013. While these increases are encouraging, comparing these salaries to the Not for Profit sector as a whole, they remain well below averages. The lowest salaries have also increased since 2013 across all positions, although these salaries are still extremely low: $50,000 for an Artistic Director, $49,000 for a General Manager and $36,248 for an Administrator. It was also noted that extra hours on these salaries is the norm. Compared to 2013 when Youth Arts was the lowest paid category across the sector, there was notable improvement in salaries for GM/EP (30%) and AD (32%). In terms of salary increases, 59% of organisations increased the salary of at least one position in 2015 (comparable to 61% in 2013) and 45% of organisations had budgeted for increases in 2016. 24% neither implemented an increase in 2015 nor planned an increase in 2016, with funding uncertainty the major factor cited. Notable in the comments relating to planned increases in 2016 were frequent concerns over funding uncertainty. Many respondents said funds recently removed from the Australia Council and budget changes directly influenced their 2016 salary budgets, staff numbers and increases. A marked increase (36%, up from 23%) have ruled out any increases and 9% will wait for funding certainty before committing. Of those planning an increase, almost half will fall below CPI.

THEATRE NETWORK (VIC) – SALARY SURVEY REPORT SMALL TO MEDIUM ARTS ORGANISATIONS
4
In line with previous surveys, creative compensation for low remuneration is crucial for retaining staff; including workplace flexibility and extended leave, or leave for creative personnel (not just Artistic Directors) to pursue other projects. Average Professional development budgets are low in the small to medium sector, and often non-existent. However, of those with professional development budgets, there is an extremely wide range – with budgets per position ranging from $100 to $8,000. The introduction of data analysis on tenure (how long staff stay in a position) revealed Artistic Directors have the longest average tenure at 6 years, with responses ranging from 1 month to over 40 years! Job security in the sector is particularly fragile, with many respondents noting that funding uncertainty has resulted in shorter contracts being offered for 2016 and beyond. The report continues with some discussion, including aspirational targets for salaries, based on basic benchmarking, and concludes with recommendations for future research – either for TNV to undertake, or for other organisations to take on. Respondents noted the importance of TNV’s Salary Survey being conducted on a regular basis for benchmarking purposes. A number of organisations noted that their Boards were undertaking wage reviews to improve salaries in response to the Survey. We look forward to your feedback.

THEATRE NETWORK (VIC) – SALARY SURVEY REPORT SMALL TO MEDIUM ARTS ORGANISATIONS
5
INTRODUCTION Background
TNV’s 2015 Salary Survey is the fourth Survey TNV has produced. The first, in 2009, arose from the Victorian AD/GM network suggesting that TNV update informal data the network had collected in 2006. The 2011 Survey saw the number of respondents increase from 50 to 92, with a comparable response rate of 96 in 2013. We had hoped in 2015 to make increases on this number, but the response rate was ultimately lower (perhaps attributable to it being conducted amidst destabilising funding announcements when staff resources are stretched) and 80 valid responses were analysed. The Survey is used for salary level setting, for new positions or at performance review time – by boards and staff alike. We also know that people have used it to demonstrate the continued poor levels of remuneration in the arts industry and as evidence of the limited capacity to retain staff with low remuneration and poor conditions. We plan to continue to undertake this survey biennially, and we welcome input, ideas and feedback. Once again we thank the people who filled in the survey for their time and valuable contribution.
Methodology
TNV’s Salary Survey uses the SELECT account version of Survey Monkey to undertake this survey. A total of 80 organisations responded to the survey during the period August 31st to October 10th, 2015.
As in previous years some respondents made mistakes with format eg: leaving off 000 (eg: 60 rather than 60000), and some respondents included the pro-rata rate rather than the FTE rate. Where it was clear that this was the case, we contacted the organisation and rectified the surveys. There may be some undetected errors remaining.
ABOUT THEATRE NETWORK VICTORIA Theatre Network (Vic) is the leading national industry development organisation for contemporary performing arts: strengthening artists and arts organisations; influencing cultural policy; facilitating critical debate; and advocating for a more robust, interconnected and innovative sector. We produce industry events including the biennial Australian Theatre Forum, the annual Victorian Theatre Forum, and many professional development and networking events; we produce a monthly e-news and a comprehensive website with resources; we join other industry partners to advocate for increased value and recognition of the arts; and we undertake basic industry research to help build evidence for the sector.

THEATRE NETWORK (VIC) – SALARY SURVEY REPORT SMALL TO MEDIUM ARTS ORGANISATIONS
6
PART 1. SURVEY RESPONDENT STATISTICS There were 80 responses to the survey, a decrease from 96 in 2013. We had hoped to increase on the number of responses from 2013, however, as noted in the comments from participants, recent changes in federal funding allocations and significant uncertainty within the sector have contributed to lower participation rates this year. By Turnover
By State
0%
10%
20%
30%
40%
50%
60%
VIC NSW WA SA QLD TAS NT ACT
Location
Gross Turnover No.
Respondents %
Respondents Under $249,000 6 7.5% $250,000 - $749,000 34 42.5% $750,000 - $1,249,000 19 23.75% $1,250,000 - $2,499,000 16 20% $2,500,000 - $4,000,000 5 6.25% 80 100.0%
The majority of respondents (42.5%) fall between $250K and $749K, followed by almost a quarter (23.75%) between $750K to $1.25m and 20% between $1.25 and $2.5m.
National representation has remained at similar levels to 2013. Most respondents were from Victoria in 2013 (43%), and again in 2015 (50%).

THEATRE NETWORK (VIC) – SALARY SURVEY REPORT SMALL TO MEDIUM ARTS ORGANISATIONS
7
By Type
*NAVA conducted a comprehensive survey of artist fees in 2009, and the results can be found at: https://visualarts.net.au/media/uploads/files/Chapter_6_Fees_Wages.pdf
0%
5%
10%
15%
20%
25%
30%
35%
40%
Thea
tre
Mul
ti A
rts
Dan
ce
Oth
er P
erf A
rts
Lite
ratu
re/W
ritin
g
Ser
vice
Org
Yout
h A
rts
Fest
ival
Com
mun
ity A
rts
Mus
ic
Visu
al A
rts
Type of Organisation The majority of respondents are theatre organisations - TNV’s primary membership. There was slight decrease from Multi-art organisations from 20% in 2013 to 15%. Other artform representation had minimal (<5%) shift. We were not successful in attracting any responses from the visual arts sector*.

THEATRE NETWORK (VIC) – SALARY SURVEY REPORT SMALL TO MEDIUM ARTS ORGANISATIONS
8
PART 2. STAFF RESOURCING The small to medium sector is resourced by a high proportion of part-time and casual staff. Surveyed organisations employ a total of 578 staff working a full-time equivalent (FTE) load of 407 – equating to an average FTE load per person of just over 0.7 or 3.5 days/week, up from an average of 0.6 or 3 days per week in 2013. While part time staff still make up a large proportion of the sector, there was a shift away from this in 2015, with the number of part time staff halved from 2013, meaning a lower overall number of staff are now working more hours. Average Size
Average number of
staff FTE Equivalent 2015 7.2 5.1 2013 8.2 5.4 2011 6.6 3.8 2009 6.1 4.3
Number of Staff
Highest Lowest Average Total Staff 28 1 7.2 F/T Staff 14 0 3.2 P/T Staff 19 0 4.0 FTE 18 1 5.1
Full-time and Part-time
% of Orgs Full-time staff only 8.8% Part-time staff only 13.8% F/T, P/T combination 77.4%
Organisations with a high number of staff are venues, festivals or companies with a large number of contract artists/performers.
The average number of staff per organisation is 7.2 people with a FTE load of 5.1. This is a decrease on 2013 of 1 staff member per organisation, with a 0.3 decrease in FTE.
Organisations employing exclusively full-time staff are still a rarity in the small to medium sector, but have increased from 4.8% of organisations surveyed in 2013 to 8.8%. The majority employ both full-time and part-time employees. Of the 13.8% of organisations employing only part-time staff, all have a turnover of less than $750,000.

THEATRE NETWORK (VIC) – SALARY SURVEY REPORT SMALL TO MEDIUM ARTS ORGANISATIONS
9
Distribution of Staff
Total No. Staff
No. Orgs (with that
staff) 1 2 2 6 3 15 4 9 5 9 6 4 7 7 8 5 9 6
10 3 11 3 15 1 16 2 17 2 18 1 19 2 20 1 23 1 28 1
Distribution of Positions
No. orgs with that
staff member As a %
of total orgs GM/Exec Producer 71 89%
Artistic Director 58 72% Producer 36 45%
Assoc Director 15 19% Finance Manager 31 39%
Administrator 45 56% Venue/Prod Mger 33 41% Mkting/Dev Mger 49 61%
Other 28 35%
In line with previous surveys, the role of GM/Executive Producer is the most common position: 89% of organisations. The next most common is an Artistic Director (72%) followed by Marketing (61%) and Administrator (56%) roles. Two new positions of Finance Manager & Producer have been added this year. Respondents have previously noted the need for more flexibility in entering in these positions.
The organisation with the highest number of FTE staff has a turnover of $1.25m-$2.5m, 20 staff in total, 14 F/T; FTE of 18. The organisation with the lowest number of FTE staff has a turnover of less than $250K and 1 staff member with a FTE of 1.
Some respondents noted the need for further flexibility in position titles, particularly Multi Arts venues. For example: the closest position to a Curator role in the survey is Artistic Director. Also noted were cross-overs in staff duties in smaller organisations, including an Artistic Director who also covered Venue Management and Executive Producer duties.

THEATRE NETWORK (VIC) – SALARY SURVEY REPORT SMALL TO MEDIUM ARTS ORGANISATIONS
10
PART 3. AVERAGE SALARY COMPARISIONS The average salary for a General Manager/Executive Producer in the small to medium sector is $76,752, representing an increase of just under 7% on the 2013 average salary; for Artistic Directors $75,479, an increase just over 7%. Overall, average salaries have continued to increase since 2009; but compared to salaries for both the arts sector and Not for Profit sector as a whole, the small to medium sector lags behind. Snapshot
Average Lowest salary
Highest salary
Most common
range % orgs
in range GM/Exec Producer $76,752 $49,000 $120,000 $75-80K 31%
Artistic Director $75,479 $50,000 $118,000 $75-$80K 34% Producer $60,989 $44,000 $80,000 $55-$60K 36% Assoc Dir $63,461 $52,571 $85,000 $55-$60K 47%
Finance Manager $64,902 $40,000 $117,000 $60-65K 32% Admin $52,875 $36,248 $76,000 $45-$50K 44%
Venue/Prod Mger $58,907 $30,000 $84,500 $55-$60K 36% Mkting/Dev Mger $61,238 $45,500 $86,000 $50-$55K 45%
Other $58,997 $41,700 $81,151 $55-60K 32% Comparison to 2013, 2011 and 2009
2009 Average
% 2011
Average
% 2013
Average
% 2015
Average
% Chg CPI
Chg Chg Chg 2009 2009
-2015
-2015
GM/Exec Producer $60,547 7% $64,934 11% $71,950 7% $76,752 25% 14%
Artistic Director $57,297 8% $62,088 13% $70,418 7% $75,479 28% 14%
Producer N/A N/A N/A N/A N/A N/A $60,989 N/A 14% Assoc Dir $52,393 -1% $51,715 11% $57,169 11% $63,461 21% 14% Finance Manager N/A N/A N/A N/A N/A N/A $64,902 N/A 14%
Admin $43,971 9% $47,746 7% $50,964 4% $52,875 20% 14% Venue/Prod Mger $48,422 9% $52,854 10% $58,183 1% $58,907 20% 14%
Mkting/Dev Mger $48,030 5% $50,666 14% $57,781 6% $61,238 25% 14%
Average salaries have increased across all positions, also increasing above CPI for all positions when compared to 2009. The highest % change occurred for Associate Director roles in 2015, an increase of 11% on 2013, with the lowest for Production/Venue Manager roles at 1%.

THEATRE NETWORK (VIC) – SALARY SURVEY REPORT SMALL TO MEDIUM ARTS ORGANISATIONS
11
Average Salary Comparison – Artistic Director/General Manager
0 2 4 6 8
10 12 14 16
Abo
ve $
120K
$1
15-1
19K
$1
10-1
14K
$1
05-1
09K
$1
00-1
04K
$9
5-99
K
$90-
94K
$8
5-89
K
$80-
84K
$7
5-79
K
$70-
74K
$6
5-69
K
$60-
64K
$5
5-59
K
$50-
54K
$4
5-49
K
Bel
ow $
45K
GM/EP
AD
As averages, General Manager and Artistic Director salaries are comparable. However, within an organisation there can be a disparity of up to $35,000 between the two positions; presumably depending on who holds the position of CEO, tenure in the position and the nature of the organisation.

THEATRE NETWORK (VIC) – SALARY SURVEY REPORT SMALL TO MEDIUM ARTS ORGANISATIONS
12
Average Salary Comparison by Turnover
Up to $249K
$250-$749K
$750K-$1.24M
$1.25-$2.4M
$2.5-$4.0M
No. Orgs 6 34 19 16 5 FTE Staff Average 2.2 2.8 5.1 13 10.9 Salary Averages: GM/Exec Producer $69,000 $69,785 $74,329 $87,813 $99,067 Artistic Director $67,467 $69,193 $74,231 $90,217 $72,075 Producer $61,767 $60,294 $54,544 $64,973 $65,000 Assoc Dir N/A $65,837 $62,838 $61,875 $65,000 Finance Manager $63,700 $65,402 $59,471 $68,875 $67,931 Admin $50,000 $51,264 $50,386 $53,894 $63,135 Venue/Prod Mger N/A $57,667 $53,233 $64,557 $60,817 Mkting/Dev Mger $50,000 $58,895 $59,056 $63,960 $70,224 Other $60,000 $56,827 $62,107 $61,331 $49,130
* Figures in shaded grey boxes have a sample size of less than 3 and are therefore not statistically reliable.
Average salaries for GM/EP trend upwards as turnover increases, improving by 44% across the spectrum. Marketing salaries increase by 40%, and Admin salaries by 26%.
The average salary for Artistic Directors trends upwards by 34% between orgs with turnovers from Under $249K to $1.25-2.4M, after which the sample is unreliable.

THEATRE NETWORK (VIC) – SALARY SURVEY REPORT SMALL TO MEDIUM ARTS ORGANISATIONS
13
Average Salary Comparison by Organisational Type
Theatre Multi Arts Dance Other Service
Org Perf Arts No. Orgs 28 12 9 6 6 GM/Exec Producer $75,444 $80,304 $82,599 $66,000 $87,012 Artistic Director $74,650 $66,331 $79,699 $68,500 $75,633 Producer $58,940 $67,614 $66,938 $59,000 $54,496 Assoc Dir $58,900 $56,286 $70,425 $58,500 $66,692 Finance Manager $64,612 $73,685 $59,813 $62,347 $56,212 Admin $52,612 $61,482 $51,400 $47,475 $54,053 Venue/Prod Mger $58,691 $65,361 $63,250 $56,500 N/A Mkting/Dev Mger $58,754 $60,969 $67,729 $50,750 $68,325 Other $65,481 $55,231 $55,167 $60,000 $51,319
* Figures in shaded grey boxes have a sample size of less than 3 and are therefore not statistically reliable.
Youth Arts Festival Lit/Writing Music Community Arts
No. Orgs 5 3 6 2 3 GM/Exec Producer $74,000 $67,188 $73,700 $84,000 $71,650 Artistic Director $73,333 $78,125 $81,250 $60,000 $94,988 Producer $80,000 $65,000 $54,000 N/A $63,478 Assoc Dir N/A N/A $76,000 N/A $85,000 Finance Manager $57,500 N/A $62,400 N/A $73,965 Admin $50,000 $62,000 $47,350 $40,000 $53,517 Venue/Prod Mger $60,000 $30,000 $51,933 $72,400 $55,000 Mkting/Dev Mger $58,250 $71,667 $61,667 N/A $56,000 Other $55,000 N/A $75,000 $55,000 $61,000
* Figures in shaded grey boxes have a sample size of less than 3 and are therefore not statistically reliable.
The highest average salaries for General Manager/ Executive Producers occur in Service Organisations. Due to reduced sample size it is difficult to reliably say which organisational type pays the highest salaries across all positions this year.
The lowest salaries for Artistic Directors are in Multi Arts and Other Performing Arts; and the highest in Community Arts. Compared to 2013 there was notable improvement in Youth Arts salaries for GM/EP (30%) and AD (32%).

THEATRE NETWORK (VIC) – SALARY SURVEY REPORT SMALL TO MEDIUM ARTS ORGANISATIONS
14
PART 4. SALARY BANDS BY POSITION There is a high level of variation between the highest and lowest salaries in the small to medium sector. The difference between the highest and lowest General Manager/Executive Producer salaries is $71,000. Administrator salaries demonstrated the smallest variance in wages, with almost three quarters falling under $55,000, and a difference between the highest and lowest wages of $39,000. General Manager/Executive Producer
0% 2% 4% 6% 8%
10% 12% 14% 16% 18% 20% 22%
Abo
ve $
120K
$1
15-$
119K
$1
10-$
114K
$1
05-$
109K
$1
00-$
104K
$9
5-$9
9K
$90-
$94K
$8
5-$8
9K
$80-
$84K
$7
5-$7
9K
$70-
$74K
$6
5-$6
9K
$60-
$64K
$5
5-$5
9K
$50-
$54K
$4
5-$4
9K
Bel
ow $
45K
In total, there were six instances of salaries above $100K, all with turnovers of $1.25-$4M. 48% of GM/EP salaries are between $65-$85K. The lowest salary is between $45-$49K for an organisation with a turnover of $250-$750K.

THEATRE NETWORK (VIC) – SALARY SURVEY REPORT SMALL TO MEDIUM ARTS ORGANISATIONS
15
Artistic Director
Producer
0% 2% 4% 6% 8%
10% 12% 14% 16% 18% 20% 22% 24% 26% 28%
Abo
ve $
120K
$1
15-$
119K
$1
10-$
114K
$1
05-$
109K
$1
00-$
104K
$9
5-$9
9K
$90-
$94K
$8
5-$8
9K
$80-
$84K
$7
5-$7
9K
$70-
$74K
$6
5-$6
9K
$60-
$64K
$5
5-$5
9K
$50-
$54K
$4
5-$4
9K
Bel
ow $
45K
0% 2% 4% 6% 8%
10% 12% 14% 16% 18% 20% 22% 24%
Abo
ve $
120K
$1
15-$
119K
$1
10-$
114K
$1
05-$
109K
$1
00-$
104K
$9
5-$9
9K
$90-
$94K
$8
5-$8
9K
$80-
$84K
$7
5-$7
9K
$70-
$74K
$6
5-$6
9K
$60-
$64K
$5
5-$5
9K
$50-
$54K
$4
5-$4
9K
Bel
ow $
45K
There are four instances of salaries between $100-$120K. 76% of AD salaries are between $60-$85K. There are no instances of ADs drawing a salary of less than $50K, compared to three instances under $45K in 2013.
41% of Producer salaries fall between $55-$65K. There were no salaries over $85,000 paid to Producers, with the highest salaries paid by Multi Arts, Dance and Youth Arts organisations.

THEATRE NETWORK (VIC) – SALARY SURVEY REPORT SMALL TO MEDIUM ARTS ORGANISATIONS
16
Associate Director
Finance Manager
0% 2% 4% 6% 8%
10% 12% 14% 16% 18% 20% 22% 24% 26% 28%
Abo
ve $
120K
$1
15-$
119K
$1
10-$
114K
$1
05-$
109K
$1
00-$
104K
$9
5-$9
9K
$90-
$94K
$8
5-$8
9K
$80-
$84K
$7
5-$7
9K
$70-
$74K
$6
5-$6
9K
$60-
$64K
$5
5-$5
9K
$50-
$54K
$4
5-$4
9K
Bel
ow $
45K
0% 2% 4% 6% 8%
10% 12% 14% 16% 18% 20%
Abo
ve $
120K
$1
15-$
119K
$1
10-$
114K
$1
05-$
109K
$1
00-$
104K
$9
5-$9
9K
$90-
$94K
$8
5-$8
9K
$80-
$84K
$7
5-$7
9K
$70-
$74K
$6
5-$6
9K
$60-
$64K
$5
5-$5
9K
$50-
$54K
$4
5-$4
9K
Bel
ow $
45K
Nearly half (47%) of Associate Directors are on salaries between $60-$70K; 33% between $50-$60K. The highest salary is paid by a Community Arts organisation.
There is only one instance of a salary over $115K, paid by a Multi Arts organisation, and one instance below $45K. The majority (54%) of Finance Managers earn between $55-$70K.

THEATRE NETWORK (VIC) – SALARY SURVEY REPORT SMALL TO MEDIUM ARTS ORGANISATIONS
17
Administrator
Venue Manager/Production Manager
0%
5%
10%
15%
20%
25%
30%
35%
40%
Abo
ve $
120K
$1
15-$
119K
$1
10-$
114K
$1
05-$
109K
$1
00-$
104K
$9
5-$9
9K
$90-
$94K
$8
5-$8
9K
$80-
$84K
$7
5-$7
9K
$70-
$74K
$6
5-$6
9K
$60-
$64K
$5
5-$5
9K
$50-
$54K
$4
5-$4
9K
Bel
ow $
45K
0% 2% 4% 6% 8%
10% 12% 14% 16% 18% 20% 22% 24% 26%
Abo
ve $
120K
$1
15-$
119K
$1
10-$
114K
$1
05-$
109K
$1
00-$
104K
$9
5-$9
9K
$90-
$94K
$8
5-$8
9K
$80-
$84K
$7
5-$7
9K
$70-
$74K
$6
5-$6
9K
$60-
$64K
$5
5-$5
9K
$50-
$54K
$4
5-$4
9K
Bel
ow $
45K
Three quarters of all Administrators (74%) are on salaries of less than $55K. Venues pay salaries at the higher end of the scale. There are no instances of salaries above $80K, and only four above $70K.
The most common band for this position is $55-$59K, closely followed by $60-$64K. The highest salaries are in venue-based organisations and music.

THEATRE NETWORK (VIC) – SALARY SURVEY REPORT SMALL TO MEDIUM ARTS ORGANISATIONS
18
Marketing Manager/Development Manager
0%
5%
10%
15%
20%
25%
30%
35%
Abo
ve $
120K
$1
15-$
119K
$1
10-$
114K
$1
05-$
109K
$1
00-$
104K
$9
5-$9
9K
$90-
$94K
$8
5-$8
9K
$80-
$84K
$7
5-$7
9K
$70-
$74K
$6
5-$6
9K
$60-
$64K
$5
5-$5
9K
$50-
$54K
$4
5-$4
9K
Bel
ow $
45K
The most common band is $50-$54K, replicating 2013 results, with the top salary in the $85-$89K bracket. Festivals, venues and dance pay the highest salaries.

THEATRE NETWORK (VIC) – SALARY SURVEY REPORT SMALL TO MEDIUM ARTS ORGANISATIONS
19
PART 5. NON-SALARY REMUNERATION BENEFITS Non-salary remuneration benefits in the small to medium sector are not the norm; with 65% of support staff in receipt of no benefits at all, mirroring results from 2013. In recognition of low salaries, high workloads and funding pressure, extra leave is becoming more prevalent. The most common benefits across all positions are a phone allowance, laptop and extra leave. Salary packaging is offered by an increasing number of organisations and returns some of the highest benefits. Benefits in the ‘Other’ category included unpaid creative leave, travel reimbursements, travel insurance, flexibility, and car parking. One organisation offered a work from home allowance.
Compared to 2013, the average value of benefits has increased for higher paid roles such as General Manager/Executive Producer and Artistic Director, while lower paid roles including Production/Venue Manager and Administration have dropped by a third.
Average Lowest Highest Largest benefit Other large benefits
GM/Exec Producer $2,273 $0 $30,000 Company Car Ext leave, salary pkging Artistic Director $1,975 $0 $24,050 Salary Pkging Extra leave, laptop Producer $950 $0 $15,899 Salary Pkging Phone, extra leave Assoc Dir $840 $0 $15,899 Salary Pkging Laptop Finance Manager $638 $0 $15,899 Salary Pkging Work fr home allow Admin $1,228 $0 $17,050 Extra leave Salary packaging Venue/Prod Mger $1,491 $0 $18,050 Salary Pkging Phone, extra leave Mkting/Dev Mger $1,301 $0 $19,550 Extra leave Salary pkging, phone
0% 10% 20% 30% 40% 50% 60% 70% 80% 90%
Company Car
Salary pkging
Extra leave Extra super
Phone allowance
Laptop Other None
GM/EP Artistic Dir Producer Associate Dir
Finance Mgr Administrator Venue/Prod Mgr Marketing/Dev

THEATRE NETWORK (VIC) – SALARY SURVEY REPORT SMALL TO MEDIUM ARTS ORGANISATIONS
20
PART 6. PROFESSIONAL DEVELOPMENT BUDGETS
Professional development budgets, on average, are low in the small to medium sector, and often non-existent. However, of those with professional development budgets, there is an extremely wide range – with budgets per position ranging from $100 to $8,000. Snapshot
2015 Average Lowest Highest 2013
Average 2011 2009
Average Average GM/Exec Producer $1,367 $250 $5,000 $1,359 $1,567 $1,656 Artistic Director $1,732 $395 $8,000 $1,752 $1,314 $1,534 Producer $619 $250 $2,500 N/A N/A N/A Assoc Dir $832 $250 $3,800 $596 $1,340 $958 Finance Manager $336 $100 $1,000 N/A N/A N/A Admin $586 $200 $2,000 $582 $733 $704 Venue/Prod Mger $621 $250 $2,500 $770 $740 $587 Mkting/Dev Mger $776 $250 $3,000 $562 $804 $837 Organisational Total $5,308 $500 $16,150 $4,897 $3,392
The average total PD budget per organisation has risen moderately since 2009, increasing this year from $4,897 to $5,308, an 8% increase. Average budgets per position saw significant increases on 2013 for Associate Director roles (40%) and Marketing/Development roles (38%), and comparable averages to 2013 across other roles. The highest PD budget per position has decreased since 2013 for almost all positions, most notably in General Manager/Executive Producer and Artistic Director positions where 50% drops were recorded. Venue/ Production Managers are the exception, with a 25% increase on 2013 highest range budgets. It should be noted that international and domestic travel are often classified as professional development in the sector. This may account for some of the high budgets.

THEATRE NETWORK (VIC) – SALARY SURVEY REPORT SMALL TO MEDIUM ARTS ORGANISATIONS
21
PART 7. SALARY INCREASES In terms of salary increases, 59% of organisations increased the salary of at least one position in 2015 (comparable to 61% in 2013) and 45% of organisations had budgeted for increases in 2016. Only 24% neither implemented an increase in 2015 nor planned an increase in 2016, with funding uncertainty the major factor cited. Increases Implemented in 2015
2015 INCREASES Average
increase Lowest
increase Highest GM/Exec Producer 4.3% -2% 25% Artistic Director 4.2% 2% 10% Producer 5.2% 1% 20% Assoc Dir 6.4% 2% 36% Finance Manager 3.4% 2% 10% Admin 4.2% 2% 17% Venue/Prod Mger 3.7% 2% 13% Mkting/Dev Mger 3.2% 2% 10% *The Average excludes organisations that have not implemented an increase in the last 12 months.

THEATRE NETWORK (VIC) – SALARY SURVEY REPORT SMALL TO MEDIUM ARTS ORGANISATIONS
22
Increases Planned for 2016
Two-year Comparison
2016 INCREASES % Orgs CPI
increase
Above CPI
increase Yes - planning increase in 2016 45% 18% 32% No - not planning increase in 2016 36% Dependent on funding/income 9% No answer 10% 100%
2015/2016 COMPARISON Yes No Maybe 2015 - implemented increase 59% 41% -
2016 - planning increase 45% 36% 9% 2015 & 2016 increase both years 40% - -
2015 or 2016 no increase - 24% -
In 2016 less organisations (45% down from 53%) are increasing at least one salary; 9% are uncommitted and 36% are not planning any increases. Just over 30% of those who are increasing salaries are doing so above CPI, with 50% planning to increase below CPI. *CPI and above CPI increase percentages exclude orgs not planning any increases.
Comparing 2015 and 2016, 40% are increasing salaries in both years; 24% have not made increases in either year due to funding, a rise on 15% in 2013.

THEATRE NETWORK (VIC) – SALARY SURVEY REPORT SMALL TO MEDIUM ARTS ORGANISATIONS
23
PART 8. TENURE The length of continuous employment in a role ranges widely from position to position, and within roles. Artistic Directors have the longest average tenure at 6 years, with responses ranging from 1 month to over 40 years. Job security in the sector is particularly fragile, with many respondents noting funding uncertainty has resulted in shorter contracts being offered for 2016 and beyond.
10
20
30
40
50
60
70
80
Months
Average Tenure by Position The average tenure for Artistic Directors is 72 months, and for General Manager/Executive Producers 33 months. Venue/Prod Manager tenure averages 3.5 years. Other positions fall broadly around the 2 to 3 year mark. 2015 marks TNV’s first year of measuring tenure in positions, so no comparison to 2013 is available.

THEATRE NETWORK (VIC) – SALARY SURVEY REPORT SMALL TO MEDIUM ARTS ORGANISATIONS
24
PART 9. OVERALL RESPONDENT COMMENTS Remuneration – Benefits include salary sacrificing under the benefits permitted through the PBI status of
the company. – When it comes to attending conferences or professional development opportunities, staff
often pay with their own money. We have received no pay increase in 4 years. – We work with a flat hierarchy - as a value of the organisation, all main staff are on the
same pay rate. – We have budgeted $2000 this year for professional development (but extra for travel and
accommodation) but there is some cross over between going to events to sell work and professional development so it works out more.
– I have not recorded our pool of Teaching Artist contractors. The overall spend on Teaching artists is approximately $80,000.
Funding – The cancellation of the Australia Council's December 2015 general funding round means
securing financial support for projects is even more tenuous than usual. This affects the funding of staff as well.
– As you would expect changes to federal Government funding are expected to impact wages. The most likely option is that no wage increases will be able to be given in 2016, it is feared some positions will need to be cut from 2016.
– These circumstances will change quite dramatically with the changes in federal funding.
– Core staffing has significantly reduced since the last survey due to several streams of revenue being placed under greater pressure and subsequently becoming less reliable.
– We've been able to employ an additional staff member because of success with Creative Partnerships Australia Plus 1 funding. There isn't sufficient funding to support three FTE in the long-term.
– Roles that have recently been filled are now only offered 12 month contracts due to funding uncertainties.
– Funding uncertainties will mean very different answers to all the above in 2016 and 2017.
Survey - Position Descriptions – Our main wages go towards our performers, these questions don't capture that
data. – We have other key contractor positions that are not identified as staff - two artistic
support positions, finance assistant - reviewing however whether these need to be adjusted from contractor to employees.
– We also employ approximately 15 + casual Front Of House and Technical crew.

THEATRE NETWORK (VIC) – SALARY SURVEY REPORT SMALL TO MEDIUM ARTS ORGANISATIONS
25
Survey – Other – Thanks for inviting us to participate, and for devising questions we can answer. So many
of these surveys are too onerous to complete. – The professional development category doesn't fit into the template provided here!
Doesn't allow for new staff. Also doesn't count hours / work time given for prof devt but there may not be an additional cost to the organisation.
– An excellent survey that provides really useful data. Thank you.

THEATRE NETWORK (VIC) – SALARY SURVEY REPORT SMALL TO MEDIUM ARTS ORGANISATIONS
26
FURTHER DISCUSSION Salary Benchmarking
Listed below are positions from the Arts and Not For Profit sectors that provide a snapshot of salaries for comparative purposes. General Manager - Supported Living, Sylvanvale Salary: $136,000-$159,000 http://www.probonoaustralia.com.au/jobs/2015/11/general-manager-supported-living Philanthropy Associate, Melbourne Recital Centre Salary: $73,600 http://www.probonoaustralia.com.au/jobs/2015/10/philanthropy-associate Development Manager, QPAC Salary: $94,926 http://www.qpac.com.au/careers/jobs/information/?n=39638 Finance Manager, NFP Sector Salary: $105,000-$106,000 http://www.seek.com.au/job/29812677?pos=1&type=standout&engineConfig=control&tier=no_tier&whereid=3000 Head of Marketing, NFP Sector Salary: $130,000 http://www.seek.com.au/job/29817052?pos=2&type=standout&engineConfig=control&tier=no_tier&whereid=3000 Programming Assistant, Sydney Opera House Salary: $50,000-$60,000 https://jobsnsw.taleo.net/careersection/operahouse/jobdetail.ftl
THEATRE NETWORK (VIC) – SALARY SURVEY REPORT SMALL TO MEDIUM ARTS ORGANISATIONS
27
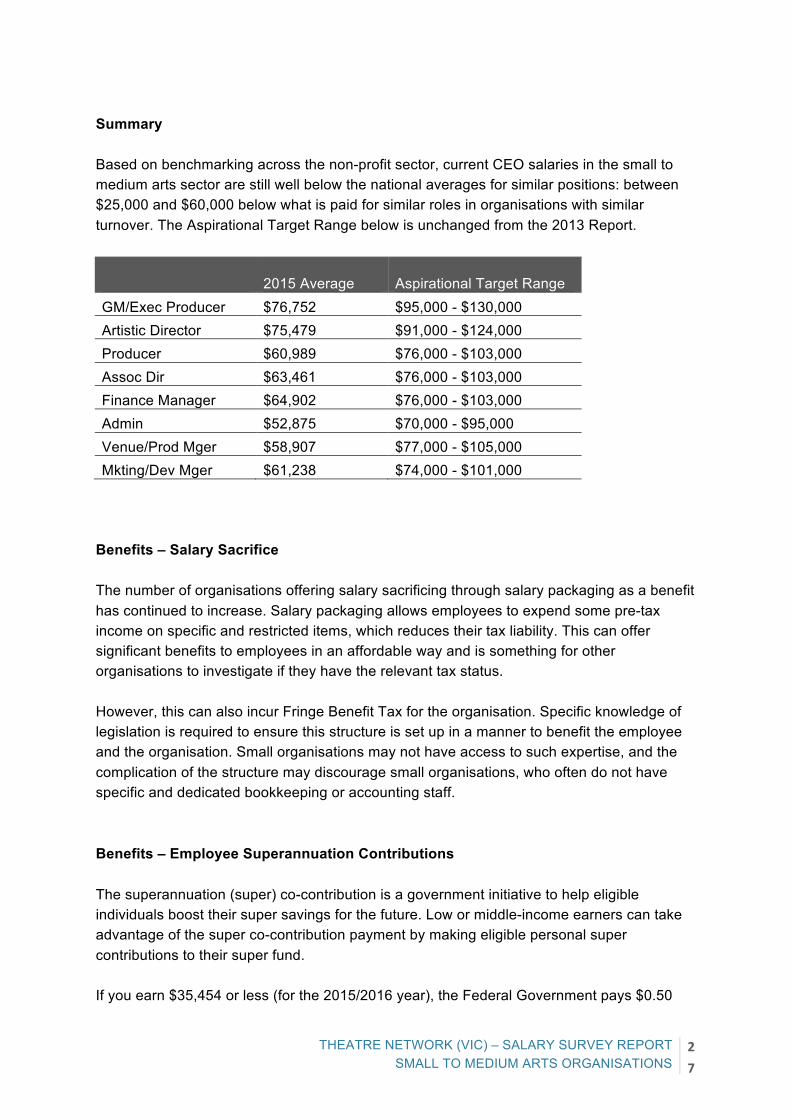
Summary Based on benchmarking across the non-profit sector, current CEO salaries in the small to medium arts sector are still well below the national averages for similar positions: between $25,000 and $60,000 below what is paid for similar roles in organisations with similar turnover. The Aspirational Target Range below is unchanged from the 2013 Report.
2015 Average Aspirational Target Range GM/Exec Producer $76,752 $95,000 - $130,000 Artistic Director $75,479 $91,000 - $124,000 Producer $60,989 $76,000 - $103,000 Assoc Dir $63,461 $76,000 - $103,000 Finance Manager $64,902 $76,000 - $103,000 Admin $52,875 $70,000 - $95,000 Venue/Prod Mger $58,907 $77,000 - $105,000 Mkting/Dev Mger $61,238 $74,000 - $101,000 Benefits – Salary Sacrifice The number of organisations offering salary sacrificing through salary packaging as a benefit has continued to increase. Salary packaging allows employees to expend some pre-tax income on specific and restricted items, which reduces their tax liability. This can offer significant benefits to employees in an affordable way and is something for other organisations to investigate if they have the relevant tax status. However, this can also incur Fringe Benefit Tax for the organisation. Specific knowledge of legislation is required to ensure this structure is set up in a manner to benefit the employee and the organisation. Small organisations may not have access to such expertise, and the complication of the structure may discourage small organisations, who often do not have specific and dedicated bookkeeping or accounting staff. Benefits – Employee Superannuation Contributions The superannuation (super) co-contribution is a government initiative to help eligible individuals boost their super savings for the future. Low or middle-income earners can take advantage of the super co-contribution payment by making eligible personal super contributions to their super fund. If you earn $35,454 or less (for the 2015/2016 year), the Federal Government pays $0.50
THEATRE NETWORK (VIC) – SALARY SURVEY REPORT SMALL TO MEDIUM ARTS ORGANISATIONS
28
(50 cents) for every dollar you contribute to your super fund in after-tax dollars, up to a maximum of $500 a year. If you earn more than $34,454, your co-contribution entitlement reduces by 3.33 cents for every dollar you earn over $34,454, until it cuts out at $50,454 (for the 2015/2016 year). Staff members could look into this on their own and make the necessary co-payments without organisational approval. For more information go to: http://www.superguide.com.au/how-super-works/cashing-in-on-the-co-contribution-rules Professional Development Professional development budgets have increased as a whole by 8%, and largely remained steady across other positions. As expenses for professional development courses have increased, and travel included in these budgets also rises in cost, the same budget allocation buys significantly less. Accessible, affordable and appropriate professional development opportunities need to be researched, developed and promoted to organisations in the small to medium sector. Further Research and Recommendations – Continue research on tenure of core staff commenced in 2015, as uncertainty of future
work is a core issue in the performing arts industry.
– Develop fact sheets on salary packaging that are relevant for arts organisations.
– Create a bank of financial advisors pro-bono to assist organisations to set up salary packaging.
– Research and disseminate information on affordable professional development opportunities.

THEATRE NETWORK (VIC) – SALARY SURVEY REPORT SMALL TO MEDIUM ARTS ORGANISATIONS
29
THEATRE NETWORK (VIC) SALARY SURVEY 2015 PREPARED BY KATHERINE FYFFE AND NICOLE BEYER Contact us: tnv.net.au (03) 8640 6014 222 Bank Street, South Melbourne 3205