northwestern university 2013 financial report · the 2013 financial report reflects the...
TRANSCRIPT

a
V
Northwestern University 2013 Financial report

b
Report of the Senior Vice President for Business and Finance 1
Investment Report 2
Report of Independent Auditors 7
Consolidated Statements of Financial Position 9
Consolidated Statements of Activities 10
Consolidated Statements of Cash Flows 11
Notes to the Consolidated Financial Statements 12
Administration and Trustees 33

1
To the Board of Trustees of Northwestern University:
With nationally ranked academic programs, Northwestern University attracts a highly qualified and diverse
student body. The 2013 Financial Report reflects the University’s success in carrying out its mission of
providing the highest-quality education for these students, developing innovative programs in research,
and sustaining an academic community that embraces these enterprises.
Solid research funding, gifts, and endowment earnings—in addition to tuition—continue to provide
balanced sources of revenues. A robust year in the investment markets is reflected in the statement of
financial position. The investment vehicle for the University’s endowment, the Long-Term Balanced Pool,
had a net total return of 11.6 percent, contributing to the 9.7 percent increase in investments. Significant
progress was made on the capital plan with the Southeast Campus Development Project construction,
which increased the investment in land, buildings, and equipment. Total assets grew to $10.9 billion, an
increase of more than $1 billion from the previous year. Total liabilities remained stable, while net assets
increased to nearly $9.2 billion.
The University accelerated expected income from the drug Lyrica® by monetizing most of its remaining
royalty interest and realized $290 million in additional royalty revenue. This one-time revenue was the
primary factor in operating revenue increasing 21 percent over the prior year, to a total of $2.3 billion.
Operating expenses increased 6 percent, to $1.9 billion. The resulting excess of operating revenue over
expenses was $407 million, compared with $117 million in 2012. As before, the Lyrica proceeds were
invested in the Long-Term Balanced Pool as quasi-endowments to primarily support financial aid, startup
needs for new faculty, research initiatives, and construction.
While Northwestern is not immune from the challenges currently facing higher education in general,
and private research institutions in particular, the accompanying financial statements show that it is well
positioned to respond to them while advancing the important goals and objectives of its strategic plan.
Eugene S. Sunshine
Senior Vice President for Business and Finance
Report of the Senior Vice President for Business and Finance

2
Investment Report
During the past fiscal year the US Federal Reserve’s monetary policy continued to dominate global finan-cial market news. Investors’ concerns that the US central bank might reduce large-scale asset purchasing drove Treasury bond yields dramatically higher, and US government bonds had negative single-digit returns for fiscal year 2013. Global equities and equity-oriented asset classes, however, produced double-digit returns. As a result, the University’s diversified portfolio gained 11.6 percent for fiscal year 2013. The Long-Term Balanced Pool rose by $664 million, to $7.85 billion. On August 31, 2013, the University’s investment assets (including cash and intra-University investments) totaled $8.14 billion, an increase of $721 million over August 31, 2012.
The University’s Total Investment PoolsThe University maintains three primary investment pools: The Long-Term Balanced Pool, Treasury funds, and separately invested assets. Each investment category has a specific set of objectives. The Long-Term Balanced Pool, used for endowed and quasi-endowed purposes, is managed with the objective
of long-term total return. It is a “unitized fund” using mutual fund accounting principles. Because of its size and long-term orientation, performance data and investment strategy information in the discussion that follows relate to the Long-Term Balanced Pool. Treasury funds are money market funds used for cash reserves and to preserve principal and maintain liquidity; intermediate-term bond investments; and working capital funds held by the University, which are generated through the temporary differences between operating receipts and disbursements. These funds are not unitized. The income from investing them is used for general operating purposes. Working capital investments are held in a variety of money market instruments or, if not needed within 90 days, are invested in the Long-Term Balanced Pool. Separately invested funds are donated funds, includ-ing restricted investments and some life-income plans. These assets may not be merged with other assets for consolidated management. The table below illustrates the net asset values and unitized information for the University’s investment pools for the past five years.
History of the Merged Pools as of August 31, 2013
2009 2010 2011 2012 2013
Long-Term Balanced Pool
Net asset value (in thousands of dollars) $5,639,701 $6,015,844 $7,012,867 $7,186,794 $7,850,651
Number of units (in thousands) 32,524 33,301 34,144 35,155 36,390
Net asset value per unit $173.40 $180.65 $205.39 $204.43 $215.74
Payout amount per unit
Current earned income ($0.50) ($0.71) ($0.75) ($0.75) $0.11
Previously reinvested realized gains withdrawn $9.04 $9.25 $9.03 $9.07 $8.63
Total payout per unit $8.54 $8.54 $8.28 $8.32 $8.74
Summary of net asset values (in thousands of dollars)Treasury pool funds $73,001 $117,334 $148,378 $146,675 $157,003
Separately invested funds 129,037 103,462 85,741 89,328 136,625
Total net asset value (in thousands of dollars) $5,841,739 $6,236,640 $7,246,986 $7,422,797 $8,144,279
3
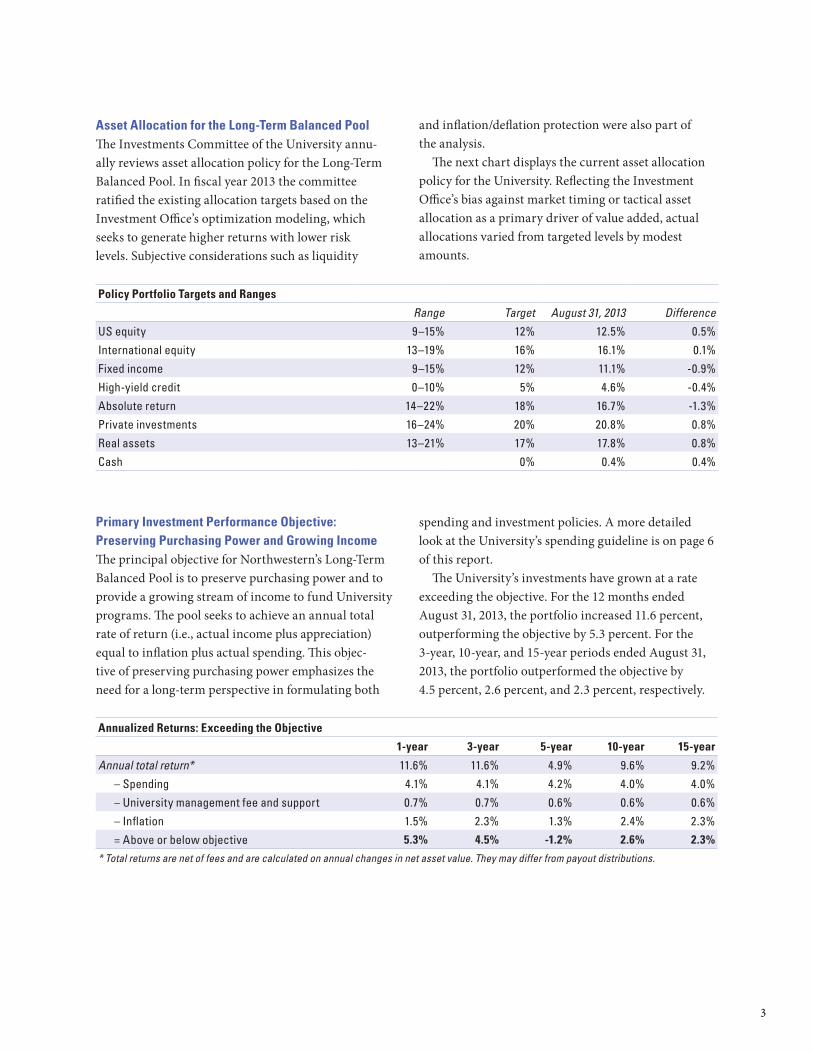
Asset Allocation for the Long-Term Balanced PoolThe Investments Committee of the University annu-ally reviews asset allocation policy for the Long-Term Balanced Pool. In fiscal year 2013 the committee ratified the existing allocation targets based on the Investment Office’s optimization modeling, which seeks to generate higher returns with lower risk levels. Subjective considerations such as liquidity
and inflation/deflation protection were also part of the analysis. The next chart displays the current asset allocation policy for the University. Reflecting the Investment Office’s bias against market timing or tactical asset allocation as a primary driver of value added, actual allocations varied from targeted levels by modest amounts.
Policy Portfolio Targets and Ranges
Range Target August 31, 2013 Difference
US equity 9–15% 12% 12.5% 0.5%
International equity 13–19% 16% 16.1% 0.1%
Fixed income 9–15% 12% 11.1% -0.9%
High-yield credit 0–10% 5% 4.6% -0.4%
Absolute return 14–22% 18% 16.7% -1.3%
Private investments 16–24% 20% 20.8% 0.8%
Real assets 13–21% 17% 17.8% 0.8%
Cash 0% 0.4% 0.4%
Primary Investment Performance Objective: Preserving Purchasing Power and Growing IncomeThe principal objective for Northwestern’s Long-Term Balanced Pool is to preserve purchasing power and to provide a growing stream of income to fund University programs. The pool seeks to achieve an annual total rate of return (i.e., actual income plus appreciation) equal to inflation plus actual spending. This objec-tive of preserving purchasing power emphasizes the need for a long-term perspective in formulating both
spending and investment policies. A more detailed look at the University’s spending guideline is on page 6 of this report. The University’s investments have grown at a rate exceeding the objective. For the 12 months ended August 31, 2013, the portfolio increased 11.6 per cent, outperforming the objective by 5.3 percent. For the 3-year, 10-year, and 15-year periods ended August 31, 2013, the portfolio outperformed the objective by 4.5 percent, 2.6 percent, and 2.3 percent, respectively.
Annualized Returns: Exceeding the Objective
1-year 3-year 5-year 10-year 15-year
Annual total return* 11.6% 11.6% 4.9% 9.6% 9.2%
– Spending 4.1% 4.1% 4.2% 4.0% 4.0%
– University management fee and support 0.7% 0.7% 0.6% 0.6% 0.6%
– Inflation 1.5% 2.3% 1.3% 2.4% 2.3%
= Above or below objective 5.3% 4.5% -1.2% 2.6% 2.3%
* Total returns are net of fees and are calculated on annual changes in net asset value. They may differ from payout distributions.

4
Secondary Investment Performance Objective: Benchmark ComparisonsThe pool’s 11.6 percent return for the 12-month period outperformed the 9.1 percent return of its composite benchmark (a blend of the benchmark returns for each asset class weighted by the policy allocation targets). Outperformance was the result of five of the seven portfolios exceeding their benchmarks. The US equity portfolio in particular outperformed on a relative basis (24 percent versus 20.3 percent) and also was the best performer on an absolute basis. High-yield credit was the best performer on a relative basis (20.3 percent versus 7.6 percent), but its outperformance was counterbalanced by the underperformance of fixed income (-3.2 percent versus -2.9 percent). International equity, absolute return, and real assets outperformed
their benchmarks by 6 percent, 3.9 percent, and 1.8 percent, respectively, while private investments underperformed by 1.6 percent. The first chart that follows shows returns and benchmarks for all asset classes for the fiscal year. The second chart shows that the Long-Term Balanced Pool outperformed its composite benchmark (11.6 percent versus 10.3 percent) for the three-year period ended August 31, 2013. Four of the seven port- folios exceeded their benchmarks over three years, but US equity, private investments, and real assets underperformed. Five of the asset classes were double-digit performers, reflecting the recovery from the 2008–09 financial crisis. A more detailed explanation of activity and performance follows the three-year performance chart.
Long-Term Balanced Pool: Fiscal 2013 Net Performance Relative to Benchmarks (in percentages)
n Northwestern n Benchmark
US equity International equity
Fixed income High-yield credit
Absolute return
Private investments
Real assets Totals
Long-Term Balanced Pool: Three-Year Net Performance Relative to Benchmarks (in percentages)
n Northwestern n Benchmark
US equity International equity
Fixed income High-yield credit
Absolute return
Private investments
Real assets Totals
18.7 18.9
11.3
6.23.8
1.9
14.3
9.6 8.75.8
13.0 12.113.3
11.6 10.3
14.3
24.0
20.3
17.3
11.3
-3.2 -2.9
20.3
7.610.3
6.4
10.812.4
8.97.1
11.69.1
5
Marketable Securities CategoriesUS equity was the top-performing asset class in abso-lute terms during the fiscal year, gaining 24 percent. The portfolio also outperformed the 20.3 percent gain of its benchmark (Russell 3000), primarily due to strong management. The portfolio has slightly under-performed its benchmark over 3 years by .2 percent (18.7 percent versus 18.9 percent) but has outperformed in 8 of the last 12 fiscal years. On an absolute basis, US equity was the best-performing asset class over the 3-year period, during which the US stock market significantly outperformed all other asset classes. One of the best-performing asset classes in relative terms, the international equity portfolio outperformed its benchmark (67 percent, MSCI EAFE Index; 33 percent, MSCI EM Index) by 6 percent as it gained 17.3 per cent for the fiscal year. This portfolio was the best-performing asset class on a relative basis for the past three years, returning 11.3 percent, compared with its benchmark’s return of 6.2 percent. This portfolio was helped by a heavier weight to smaller-cap foreign stocks and by outstanding management. It has out-performed in 10 of the last 12 fiscal years. Only the fixed income portfolio declined in value during the fiscal year, as yields on US Treasuries rose significantly. It underperformed on an absolute and relative basis, returning -3.2 percent, versus -2.9 per-cent for its benchmark (Barclays Government Index). The Investment Office helped returns by underweight-ing the portfolio and maintaining a shorter duration. For the last three years fixed income outperformed on a relative basis, returning 3.8 percent versus 1.9 percent for its benchmark. It has outperformed in 8 out of the last 12 fiscal years due to superior active management and exposure to global and inflation-protected bonds.
High-Yield Credit CategoryThe high-yield credit portfolio includes investments in distressed debt and other credit instruments with fixed income characteristics but more specific risk tied to the securities and their underlying cash flows. The portfolio was the top-performing asset class on a relative basis during the fiscal year, increasing 20.3 percent, compared with 7.6 percent for its bench-mark (Merrill Lynch High-Yield Master II Index). On an absolute basis it was the second-best performer, returning 14.3 percent (versus 9.6 percent for its
benchmark) for the three-year period. The portfolio has a conservative concentration of safer bank loans, which significantly outperformed the more risky high-yield bonds in the benchmark index. Cash flows were very strong for the current fiscal year, as distressed managers continued to return capital. The portfolio was cash-flow positive (total distributions less new investments or capital calls), with distributions of $137.1 million and capital calls of $25.5 million, for a net cash flow of $111.6 million.
Absolute Return CategoryMade up of 26 different hedge funds, this portfolio aims to provide equity-like returns with low correl- ation to the equity markets. For the year it gained 10.3 percent, surpassing the 6.4 percent return of its benchmark (80 percent Treasury bills plus 400 basis points; 20 percent MSCI All-Country World Index). The portfolio’s three-year return of 8.7 per-cent exceeded its benchmark’s return of 5.8 percent. Northwestern’s absolute return portfolio is weighted toward long-short equity managers (40 percent), but the University has been reducing this exposure by increas-ing the allocation in other hedge-fund strategies. The remaining hedge funds (60 percent) are less equity-market sensitive and represent diversifying strategies, and the University intends to increase exposure to such funds in fiscal year 2014.
Private Investments CategoryThe private investments portfolio includes invest-ments in global buyout, growth equity, and venture capital funds. This portfolio had a double-digit return of 10.8 percent for the fiscal year; however, on a rela-tive basis, it underperformed the 12.4 percent return of its benchmark (Cambridge Associates Private Investments). For the three-year period, it was a strong peformer, gaining 13 percent due to increased profitability at underlying portfolio companies and merger and acquisition activity. In addition, the initial public offering environment significantly improved worldwide. Cash flows were strong for the second consecu-tive fiscal year. The portfolio continued to experi-ence an increase in trade sales, recapitalizations, and public offerings, resulting in more distributions from the portfolio companies. For fiscal year 2013

6
private investment distributions were $350.8 million and capital calls $176.6 million, for a net cash flow of $174.2 million. The University’s manager relationships and reputation in the marketplace remain strong.
Real Assets CategoryThe real assets portfolio includes the University’s investments in energy, timber, real estate, and public investments in commodity funds. This port-folio outperformed its benchmark (a mix of energy, real estate, and commodities) return on a relative basis in fiscal year 2013, gaining 8.9 percent (versus 7.1 percent). It was a strong performer for the three-year period, gaining 12.1 percent. Distribution activity significantly increased in particular, as there contin-ued to be substantially higher realizations in private-partnership real estate and energy investments. With distributions of $295.6 million and capital calls of $220.6 million, the net cash flow was $75 million for fiscal year 2013.
Long-Term Balanced Pool Spending GuidelineTo sustain the Long-Term Balanced Pool’s long-term earning ability and provide adequate resources to the University, the Board of Trustees in fiscal year 2006 ratified a revised spending guideline that blends two elements:• Market element adjusts annual endowment spend-
ing to the long-term sustainable target spending of 4.35 percent of the average actual market value of the endowment for the 12 months ended October 31 of the prior fiscal year. This component of the spending rate receives a 30 percent weighting in the spending rate calculation.
• Spending element increases the previous year’s spending rate by actual inflation plus budget growth (1.5 percent). This element of the spending rate receives a weight of 70 percent.
The spending rate for fiscal year 2013 was 4.1 per-cent. The amount per unit for fiscal year 2014, calcu-lated using the guideline above, is $8.93.
Payout Determined by Spending Guideline2009 2010 2011 2012 2013
Spending per unit $8.54 $8.54 $8.28 $8.32 $8.74
Net asset value per unit $173.40 $180.65 $205.39 $204.43 $215.74
Annual spending rate* 4.24% 4.71% 4.20% 3.98% 4.08%
Total (in millions) $272.95 $281.91 $279.61 $288.30 $313.17
Growth in total spending 16.90% 3.28% -0.81% 3.11% 8.62% * Annual spending rate is calculated as spending per unit divided by the two-year average net asset value per unit
after distribution of the annual contribution to the budget.
The Long-Term Balanced Pool: In ConclusionNorthwestern’s portfolio delivered strong performance for the fiscal year and is poised to continue to grow and support the University’s needs. Its success is based on the diversification of the Long-Term Balanced Pool and the skill of outstanding money managers worldwide in meeting investment objectives over long time horizons. Northwestern’s leadership continues to maintain a long-term investment focus and remains confident in the portfolio’s prospects.
William H. McLeanVice President and Chief Investment Officer

7
Report of Independent Auditors
To the Board of Trustees of Northwestern University:
We have audited the accompanying consolidated financial statements of Northwestern University (the
“University”), which comprise the consolidated statement of financial position as of August 31, 2013, and
the related consolidated statements of activities, and of cash flows for the year then ended.
Management’s Responsibility for the Consolidated Financial Statements
Management is responsible for the preparation and fair presentation of the consolidated financial statements
in accordance with accounting principles generally accepted in the United States of America; this includes the
design, implementation and maintenance of internal control relevant to the preparation and fair presentation
of consolidated financial statements that are free from material misstatement, whether due to fraud or error.
Auditor’s Responsibility
Our responsibility is to express an opinion on the consolidated financial statements based on our audit.
We conducted our audit in accordance with auditing standards generally accepted in the United States of
America. Those standards require that we plan and perform the audit to obtain reasonable assurance about
whether the consolidated financial statements are free from material misstatement.
An audit involves performing procedures to obtain audit evidence about the amounts and disclosures in the
consolidated financial statements. The procedures selected depend on our judgment, including the assess-
ment of the risks of material misstatement of the consolidated financial statements, whether due to fraud or
error. In making those risk assessments, we consider internal control relevant to the University’s preparation
and fair presentation of the consolidated financial statements in order to design audit procedures that are
appropriate in the circumstances, but not for the purpose of expressing an opinion on the effectiveness of
the University’s internal control. Accordingly, we express no such opinion. An audit also includes evaluating
the appropriateness of accounting policies used and the reasonableness of significant accounting estimates
made by management, as well as evaluating the overall presentation of the consolidated financial statements.
We believe that the audit evidence we have obtained is sufficient and appropriate to provide a basis for our
audit opinion.
8
Opinion
In our opinion, the consolidated financial statements referred to above present fairly, in all material respects,
the financial position of Northwestern University at August 31, 2013, and the changes in its net assets and its
cash flows for the year then ended in accordance with accounting principles generally accepted in the United
States of America.
Other Matter
We have previously audited Northwestern University’s August 31, 2012 financial statements, and we
expressed an unmodified audit opinion on those audited financial statements in our report dated January 9,
2013. In our opinion, the summarized comparative information presented herein as of and for the year ended
August 31, 2012 is consistent, in all material respects, with the audited financial statements from which it has
been derived.
Chicago, Illinois
January 13, 2014
9
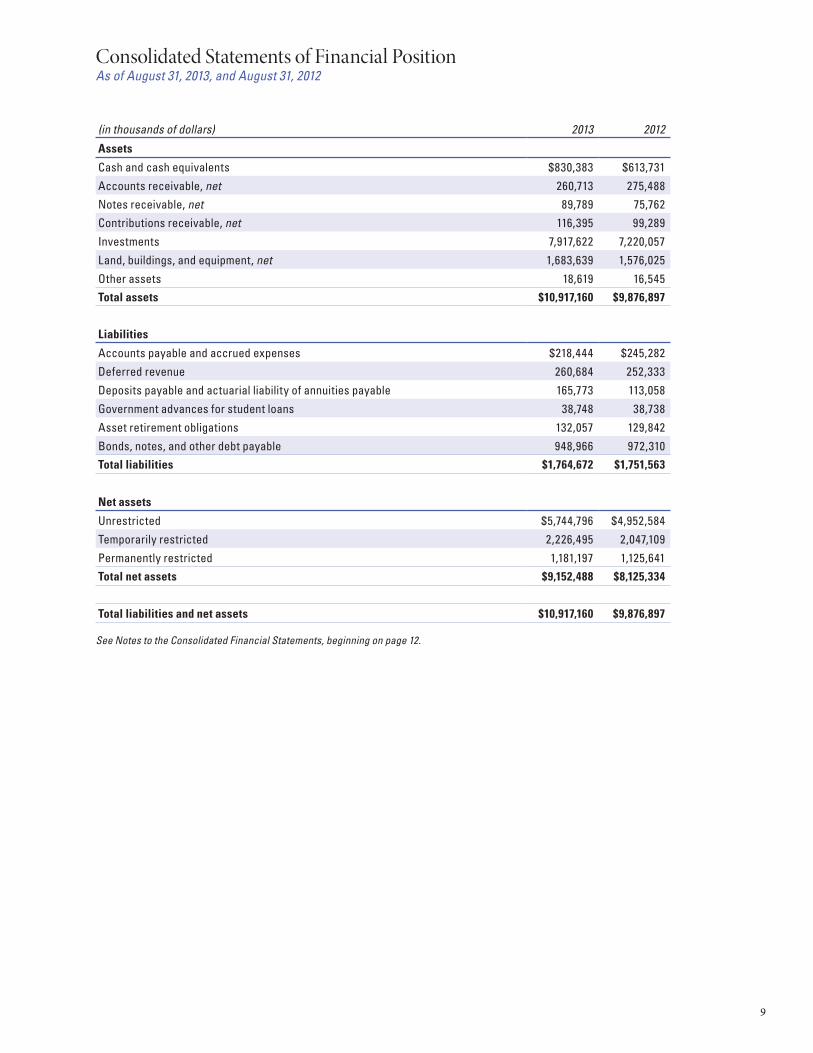
Consolidated Statements of Financial PositionAs of August 31, 2013, and August 31, 2012
(in thousands of dollars) 2013 2012
Assets
Cash and cash equivalents $830,383 $613,731
Accounts receivable, net 260,713 275,488
Notes receivable, net 89,789 75,762
Contributions receivable, net 116,395 99,289
Investments 7,917,622 7,220,057
Land, buildings, and equipment, net 1,683,639 1,576,025
Other assets 18,619 16,545
Total assets $10,917,160 $9,876,897
Liabilities
Accounts payable and accrued expenses $218,444 $245,282
Deferred revenue 260,684 252,333
Deposits payable and actuarial liability of annuities payable 165,773 113,058
Government advances for student loans 38,748 38,738
Asset retirement obligations 132,057 129,842
Bonds, notes, and other debt payable 948,966 972,310
Total liabilities $1,764,672 $1,751,563
Net assets
Unrestricted $5,744,796 $4,952,584
Temporarily restricted 2,226,495 2,047,109
Permanently restricted 1,181,197 1,125,641
Total net assets $9,152,488 $8,125,334
Total liabilities and net assets $10,917,160 $9,876,897
See Notes to the Consolidated Financial Statements, beginning on page 12.

10
Consolidated Statements of ActivitiesFor the fiscal year ended August 31, 2013, and summarized financial information for the fiscal year ended August 31, 2012
Operating expenses
Salaries, wages, and benefits 1,051,137 1,051,137 994,409
Services, supplies, travel, and other 507,842 507,842 468,130
Depreciation and ARO accretion 110,389 110,389 111,474
Operations of plant, rent, and equipment 88,617 88,617 82,434
Utilities and communications 56,611 56,611 58,151
Trademark and royalty fees 45,629 45,629 42,130
Interest on indebtedness 39,076 39,076 34,723
Total operating expenses 1,899,301 — — 1,899,301 1,791,451
Excess (deficit) of operating revenues over expenses 477,784 (70,388) — 407,396 116,937
Nonoperating revenues and expenses
Private gifts and grants for buildings and equipment 5,592 3,187 8,779 16,644
Restricted private gifts 85,133 $50,919 136,052 134,894
Net gain (loss) on annuity obligations 1,907 4,637 6,544 (1,510)
Investment returns, reduced by operating distribution 269,290 159,547 428,837 46,937
Change in value of derivative instruments 40,334 40,334 (20,045)
Other nonoperating expenses (788) (788) —
Excess of nonoperating revenues over expenses 314,428 249,774 55,556 619,758 176,920
Change in net assets 792,212 179,386 55,556 1,027,154 293,857
Beginning net assets 4,952,584 2,047,109 1,125,641 8,125,334 7,831,477
Ending net assets $5,744,796 $2,226,495 $1,181,197 $9,152,488 $8,125,334
See Notes to the Consolidated Financial Statements, beginning on page 12.
(in thousands of dollars) 2013 2012
Operating revenues UnrestrictedTemporarily
restrictedPermanently
restricted Total Total
Tuition and fees $840,247 $840,247 $799,143
(less scholarships and fellowships) (295,942) (295,942) (270,215)
Net tuition and fees 544,305 544,305 528,928
Auxiliary services 76,980 76,980 76,507
Grants and contracts 542,847 542,847 535,049
Private gifts 175,882 175,882 108,178
Investment return designated for operations 264,988 $124,999 389,987 351,365
Sales and services 138,145 138,145 149,303
Professional fees 26,638 26,638 32,354
Royalties and trademarks 411,389 411,389 122,488
Other income 524 524 4,216
Total operating revenues 2,181,698 124,999 — 2,306,697 1,908,388
Net assets released from restrictions 195,387 (195,387) — —
Total operating revenues and other additions (reductions) 2,377,085 (70,388) — 2,306,697 1,908,388

11
Consolidated Statements of Cash FlowsFor the fiscal years ended August 31, 2013, and August 31, 2012
(in thousands of dollars) 2013 2012
Cash flows from operating activities
Change in net assets $1,027,154 $293,857
Adjustments to reconcile change in net assets to net cash provided by (used in) operating activitiesDepreciation 107,327 105,582Accretion for asset retirement obligations 6,189 5,892Asset retirement obligations reduction (3,974) —Net losses on retirements and sales of buildings and equipment 2,834 359Net amortization of discounts (and accretion) of premiums on bonds payable (79) (79)Allowance for student loans receivable 545 (152)Net realized and unrealized gains on investments (736,666) (357,095)Contributed securities 26,747 22,097Change in value of derivative instruments (40,334) 20,045Private gifts and grants for buildings and equipment (8,779) (16,644)
Changes in assets and liabilitiesAccounts receivable 15,040 51,781Contributions receivable (17,106) (37,948)Other assets (2,072) 376Accounts payable and accrued expenses 4,293 5,244Deferred revenue 8,351 (56,691)Government advances for student loans 10 (230)
Net cash provided by operating activities 389,480 36,394
Increase in cash and cash equivalents 216,652 273,107
Cash and cash equivalents at beginning of year 613,731 340,624Cash and cash equivalents at end of year $830,383 $613,731
Supplemental disclosure of cash flow information
Accrued liabilities for construction in progress $18,134 $8,960Capitalized interest 6,983 5,536Cash paid for interest 39,201 32,595
Cash flows from (used in) financing activities
Net proceeds from issuance of bonds payable — 200,000Principal payments on notes, bonds, and other debt payable (23,265) (3,070)Proceeds from private gifts and grants for buildings and equipment 8,779 16,644Increase in deposits payable and annuities payable 52,713 35,171Net cash provided by financing activities 38,227 248,745
Cash flows from (used in) investing activities
Purchases of investments (1,991,556) (1,275,520)Proceeds from sales of investments 2,011,645 1,437,077Acquisitions of land, buildings, and equipment (208,650) (148,164)Proceeds from sale of buildings or equipment 78 240Student loans disbursed (22,130) (18,023)Principal collected on student loans 7,558 916Other (8,000) (8,558)Net cash used in investing activities (211,055) (12,032)
See Notes to the Consolidated Financial Statements, beginning on page 12.
12
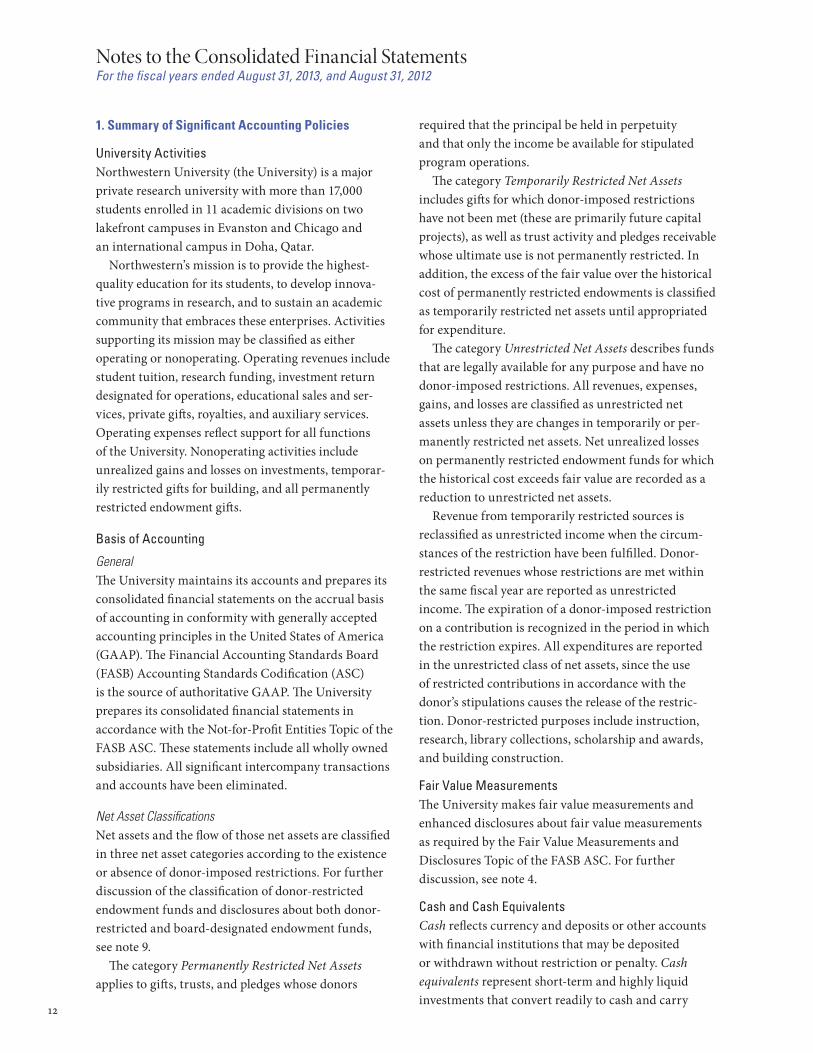
1. Summary of Significant Accounting Policies
University ActivitiesNorthwestern University (the University) is a major private research university with more than 17,000 students enrolled in 11 academic divisions on two lakefront campuses in Evanston and Chicago and an international campus in Doha, Qatar. Northwestern’s mission is to provide the highest-quality education for its students, to develop innova-tive programs in research, and to sustain an academic community that embraces these enterprises. Activities supporting its mission may be classified as either operating or nonoperating. Operating revenues include student tuition, research funding, investment return designated for operations, educational sales and ser-vices, private gifts, royalties, and auxiliary services. Operating expenses reflect support for all functions of the University. Nonoperating activities include unrealized gains and losses on investments, temporar-ily restricted gifts for building, and all permanently restricted endowment gifts.
Basis of Accounting
GeneralThe University maintains its accounts and prepares its consolidated financial statements on the accrual basis of account ing in conformity with generally accepted accounting principles in the United States of America (GAAP). The Financial Accounting Standards Board (FASB) Accounting Standards Codification (ASC) is the source of author itative GAAP. The University prepares its consolidated financial statements in accordance with the Not-for-Profit Entities Topic of the FASB ASC. These statements include all wholly owned subsidiaries. All significant intercompany trans actions and accounts have been eliminated.
Net Asset ClassificationsNet assets and the flow of those net assets are classified in three net asset categories according to the existence or absence of donor-imposed restrictions. For further discussion of the classification of donor-restricted endowment funds and disclosures about both donor-restricted and board-designated endowment funds, see note 9. The category Permanently Restricted Net Assets applies to gifts, trusts, and pledges whose donors
required that the principal be held in perpetuity and that only the income be available for stipulated program operations. The category Temporarily Restricted Net Assets includes gifts for which donor-imposed restrictions have not been met (these are primarily future capital projects), as well as trust activity and pledges receivable whose ultimate use is not permanently restricted. In addition, the excess of the fair value over the historical cost of permanently restricted endowments is classified as temporarily restricted net assets until appropriated for expenditure. The category Unrestricted Net Assets describes funds that are legally available for any purpose and have no donor-imposed restrictions. All revenues, expenses, gains, and losses are classified as unrestricted net assets unless they are changes in temporarily or per-manently restricted net assets. Net unrealized losses on permanently restricted endowment funds for which the historical cost exceeds fair value are recorded as a reduction to unrestricted net assets. Revenue from temporarily restricted sources is reclassified as unrestricted income when the circum-stances of the restriction have been fulfilled. Donor-restricted revenues whose restrictions are met within the same fiscal year are reported as unrestricted income. The expiration of a donor-imposed restriction on a contribution is recognized in the period in which the restriction expires. All expenditures are reported in the unrestricted class of net assets, since the use of restricted contributions in accordance with the donor’s stipulations causes the release of the restric-tion. Donor-restricted purposes include instruction, research, library collections, scholarship and awards, and building construction.
Fair Value MeasurementsThe University makes fair value measurements and enhanced disclosures about fair value measurements as required by the Fair Value Measurements and Disclosures Topic of the FASB ASC. For further discussion, see note 4.
Cash and Cash EquivalentsCash reflects currency and deposits or other accounts with financial institutions that may be deposited or withdrawn without restriction or penalty. Cash equivalents represent short-term and highly liquid investments that convert readily to cash and carry
Notes to the Consolidated Financial StatementsFor the fiscal years ended August 31, 2013, and August 31, 2012

13
little risk of change in value at maturity due to interest-rate changes; maturities of the investments are three months or less at the date of purchase.
ContributionsContributions received, including unconditional prom-ises to give (pledges), are recognized by the University as revenues at their fair values. Private gifts, includ-ing unconditional promises to give, are recognized as revenues in the period received. Conditional promises to give are not included in revenue until the conditions are substantially met.
InvestmentsInvestments in securities and financial instruments are recorded at fair value. The University values its invest-ments using a hierarchy of valuation inputs based on the extent to which the inputs are observable in the marketplace. Observable inputs reflect market data obtained from sources independent of the reporting entity; unobservable inputs reflect the entity’s own assumptions about how market participants would value an asset or a liability based on the best informa-tion available. Valuation techniques used to measure fair value must maximize the use of observable inputs and minimize the use of unobservable inputs. The fair value hierarchy is based on three levels of inputs, of which the first two are considered observable and the last unobservable, that may be used to measure fair value. The following describes this hierarchy and the primary valuation methodologies used by the University for financial instruments measured at fair value on a recurring basis:
Level 1: Quoted prices in active markets for identi-cal assets or liabilities. Market-price data are generally obtained from relevant exchanges or dealer markets. Level 2: Inputs other than Level 1 that are observ-able either directly or indirectly, such as quoted prices in markets that are not active, or other inputs that are observable or can be corroborated by observable market data for substantially all of the same term of the assets or liabilities. Inputs are obtained from various sources, including market participants, dealers, and brokers. Level 3: Unobservable inputs that are supported by little or no market activity and are significant to the fair value of the assets or liabilities.
A financial instrument’s categorization within the valuation hierarchy is based on the lowest level of input significant to the fair value measurement. The categori-zation of an investment is based on its pricing transpar-ency and liquidity and does not necessarily correspond to the University’s perceived risk of that investment. Equity securities with readily determinable fair values and debt securities are valued at the last sale price (if quotations are readily available) or at the closing bid price in the principal market in which such securities are normally traded (if no sale price is avail-able). The fair values for these securities are classified as Level 1 because the securities have observable market inputs. Certain fixed income securities are valued based on dealer-supplied valuations; since these securi-ties have significant other observable inputs, they are classified as Level 2. The estimated fair values of equity securities that do not have readily determined fair values, and of other investments, are based on estimates provided by external investment managers. The guidance permits an entity, as a practical expedient, to measure the fair value of such investments based on the net asset value (NAV) per share. These estimates are exam-ined through a valuation review process performed by management. These investments are generally less liquid than other investments. The fair values for these securities are classified as Level 3, reflecting significant unobservable inputs that are supported by little or no market inputs. The fair values of investments based on NAV are categorized as Level 2 if the investments are redeemable at the reporting date or within the near term, defined by the University as within 90 days of the reporting date. Investments in certain real assets and other invest-ments are recorded at acquisition or contruction cost, or at fair value as of donation date if received as a con-tribution. The University performs a periodic assess-ment of these assets for impairment by comparing the future cash flows expected from the asset to the carry-ing value of the asset. An impairment loss is recognized for the difference between estimated fair value and car-rying value. In management’s opinion, no impairment of investments held at cost existed as of August 31, 2013. For further discussion of such investments, see note 4. The methods described above may produce a fair value that may not be indicative of net realizable value or of future fair values. Furthermore, while

14
the University believes its valuation methods are appropriate and consistent with those of other market participants, the use of different methodologies or assumptions to determine the fair value of certain financial instruments could result in a different esti-mate of fair value at the reporting date. Investment income is recorded on the accrual basis, and purchases and sales of investment securities are reflected on a trade-date basis.
Derivative Financial InstrumentsThe University uses various financial instruments to obtain equity market exposure (e.g., equity price risk) of an underlying investment strategy; if applicable, these have a reference index (e.g., S&P 500) that is the same, or highly correlated with, the reference index of the investment strategy. Such instruments are not designated as hedges for accounting purposes and are recorded at fair value. The University enters into swap agreements to hedge future interest-rate movements. It may also add various interest-rate options to hedge the overall portfolio and use an interest-rate swap agreement to hedge variable interest-rate exposure. Interest-rate swaps are valued using observable inputs, such as quotations received from the counterparty, dealers, or brokers, whenever they are available and considered reliable. If and when models are used, the value of the interest-rate swap depends on the contractual terms of and specific risks inherent in the instrument, as well as the availability and reliability of observable inputs. Such inputs include market prices for reference securities, yield curves, credit curves, measures of volatility, prepayment rates, and correlations of such inputs. The interest-rate swaps classified within Level 3 have unobservable inputs with little or no market activity. For further discussion, see notes 4 and 8.
Fair Values of Financial Instruments Other Than InvestmentsThe fair values of financial instruments other than investments are based on a variety of factors. In some cases, fair values represent quoted market prices for identical or comparable instruments. In other cases, fair values have been estimated based on assumptions about the amount and timing of estimated future cash flows and assumed discount rates reflecting varying degrees of risk. Accordingly, the fair values may not
represent actual values that could have been realized at year-end or that will be realized in the future.
Accounts and Notes ReceivableAccounts receivable are recorded at net realizable value. Those generally expected to be collected within one year are carried without an allowance. The allowance for student accounts receivable is based on an analysis of outstanding account balances and is calculated using percentages based on historical collection data applied to the outstanding accounts receivable balances. Accounts receivable deemed to be uncollectible are expensed at that time. Notes receivable are recorded at net realizable value and are predominantly student loans with varying maturities. Notes receivable deemed to be uncollectible are expensed at that time. Management assesses the adequacy of the allow-ance for credit losses on a regular basis by performing ongoing analysis of the student loan portfolio. Factors considered are differing economic risks associated with each loan category, the financial condition of specific borrowers, the economic environment in which the borrowers operate, the level of delinquent loans, and other significant influences. Loans disbursed under federally guaranteed student loan programs have special provisions. Based on this evaluation and management judgment, an uncollectible percentage is calculated and applied to each category of student loan balances outstanding. Management considers the allowance for student loan portfolio credit losses to be prudent and reasonable.
Contributions ReceivableContributions receivable arising from unconditional promises to give are carried net of an allowance for uncollectible pledges. Additionally, uncon ditional promises are presented at estimated fair value con sidering duration and collection risk. There were no significant conditional promises to give as of August 31, 2013, and August 31, 2012.
Land, Buildings, and EquipmentThe value of land, buildings, and equipment is recorded at cost or, if received as gifts, at fair value at the date of the gift. Significant renewals and replacements are capitalized. The cost of repairs and maintenance is expensed as incurred. Purchases of library books and works of art are also expensed.

15
Depreciation is calculated using the straight-line method over the useful lives of the equipment, which are estimated to be 3 to 20 years; of the buildings and land improvements, which are estimated to be up to 40 years; and of the leasehold improvements, which are estimated to be the shorter of the useful life or the lease term. The useful life of land is deemed indefinite and not depreciable. The University reviews long-lived assets for impair-ment by comparing the future cash flows expected from the asset to the carrying value of the asset. If the carrying value of an asset exceeds the sum of estimated undiscounted future cash flows, an impairment loss is recognized for the difference between estimated fair value and carrying value. In management’s opinion, no impairment existed as of August 31, 2013.
Charitable Remainder TrustsCharitable remainder trusts are classified as perma-nently restricted net assets if, upon termination of the trust, the donor permanently restricts the remain-ing trust assets. If the remainder is not permanently restricted by the donor, the charitable remainder trust assets are recorded as temporarily restricted net assets.
Annuities PayableAnnuities payable consist of annuity payments currently due and the actuarial amount of annuities payable. The actuarial amount of annuities payable is the present value of the aggregate liability for annuity payments over the expected lives of the beneficiaries.
Self-Insurance ReservesThe University maintains a self-insurance program for general liability, professional liability, and certain employee and student insurance coverages. This pro-gram is supplemented with commercial excess insur-ance above the University’s self-insurance retention. The reserves for self-insurance and postretirement medical and life insurance benefits are based on actu-arial studies and management estimates. See note 12 for additional discussion.
Asset Retirement ObligationsThe University records all known asset retirement obligations (ARO) for which the fair value of the liability can be reasonably estimated, including certain obligations relating to regulatory remediation. Asset retirement obligations covered include those for which
an entity has a legal obligation to perform an asset retirement activity; however, the timing and/or method of settling the obligation are conditional on a future event that may or may not be within the control of the entity. The reserves for asset retirement obligations are based on analyses of University assets, review of appli-cable regulatory and other guidance, and management estimates.
Revenue RecognitionRevenues from tuition and fees are reported in the fiscal year in which they are earned, including pro-rata adjustments for educational programs crossing over fis-cal years. Fiscal year 2014 fall-quarter tuition and fees, billed but not collected in fiscal year 2013, are reported as deferred revenue in fiscal year 2013. Similarly, fiscal year 2013 fall-quarter tuition and fees, billed but not collected in fiscal year 2012, are reported as deferred revenue in fiscal year 2012. Revenues from auxiliary services, such as residence and food services, represent fees for goods and ser-vices furnished to University students, faculty, and staff; these revenues are recognized in the fiscal year in which the goods and services are provided. Grants and contracts revenue is recognized as expenses are incurred on a project. Professional fees arise from faculty and department services provided to external institutions such as hospitals. Sales and services rev-enues represent fees for services and goods provided to external parties in the course of educational activities and also include revenues from the provision of physi-cal plant services and goods to external institutions contiguous to the University campuses. Trademark and royalty revenues arise from licensing of innovative technologies, copyrights, and other intellectual prop-erty; these revenues are recognized in the fiscal year in which they are earned. Other income includes revenues not otherwise categorized that are also recognized in the fiscal year in which they are earned.
Federal Grants and Contracts RevenueThe University receives funding or reimbursement from federal agencies. In addition, indirect cost recovery on federal grants and contracts is based on an institutional rate negotiated with its cognizant federal agency, the United States Department of Health and Human Services.

16
Income TaxesThe Internal Revenue Service has determined that the University is exempt from income taxes under Section 501(c)(3) of the US Internal Revenue Code, except with regard to unrelated business income, which is taxed at corporate income tax rates. The University files federal and various state and local tax returns. The statute of limitations on the University’s federal tax returns remains open for fiscal years 2010 through 2013. The University makes an assessment of individual tax positions and follows a process for recognition and measurement of uncertain tax positions. Tax positions are evaluated on whether they meet the “more likely than not” standard for sustainability on examination by tax authorities.
Uses of Estimates in the Preparation of Financial StatementsThe preparation of financial statements in conformity with GAAP requires management to make estimates and assumptions that affect the reported amounts of assets and liabilities; the disclosure of contingent assets and liabilities at the date of the consolidated financial statements; and the reported amounts of revenues and expenses during the relevant period. Actual results could differ from those estimates. The University believes that the methods and assumptions used in computing these reserves and liabilities are appropriate.
Recent Accounting PronouncementsAccounting Standard Update (ASU) 2011–04 was issued May 12, 2011, and amends the Fair Value Measurement Topic to clarify and define common principles and requirements for measuring fair value
and for disclosing information about fair value measurements. The University implemented these new disclosures in fiscal 2013.
Summarized Comparative InformationThe financial statements include certain prior-year summarized comparative information in total but not by net asset class. Such information does not include sufficient detail to constitute a presentation in confor-mity with GAAP. Accordingly, such information should be read in conjunction with the University’s financial statements for the year ended August 31, 2012, from which the summarized information was derived.
Revision and Reclassifications In 2013, the University began separately reporting unrealized gains and losses on derivative instruments within nonoperating revenues and expenses on the consolidated statements of activities and as an operat-ing activity on the consolidated statements of cash flows. The University revised the 2012 consolidated statements of activities and the consolidated statements of cash flows to correctly report net unrealized losses on certain derivative instruments totaling $20 million as a separate line item within nonoperating revenues and expenses on the consolidated statement of activi-ities and as cash flow from operating activity on the consolidated statements of cash flows. The University believes the prior year consolidated financial state-ments were not materially misstated. Certain fiscal year 2012 amounts have been reclassi-fied in the operating expenses by natural classification on the consolidated statements of activity. Functional expenses are disclosed in note 14.
2. Accounts Receivable and Notes ReceivableAccounts receivable are summarized on the consolidated statements of financial position as follows:
(in thousands of dollars) August 31, 2013 August 31, 2012
Research and other sponsored programs support $65,467 $71,272
Student receivables 86,421 87,333
Royalty receivables 41,208 50,339
Other receivables 68,194 67,069Accounts receivable subtotal 261,290 276,013
Less allowances for student uncollectible amounts (577) (525)
Total accounts receivable $260,713 $275,488
17
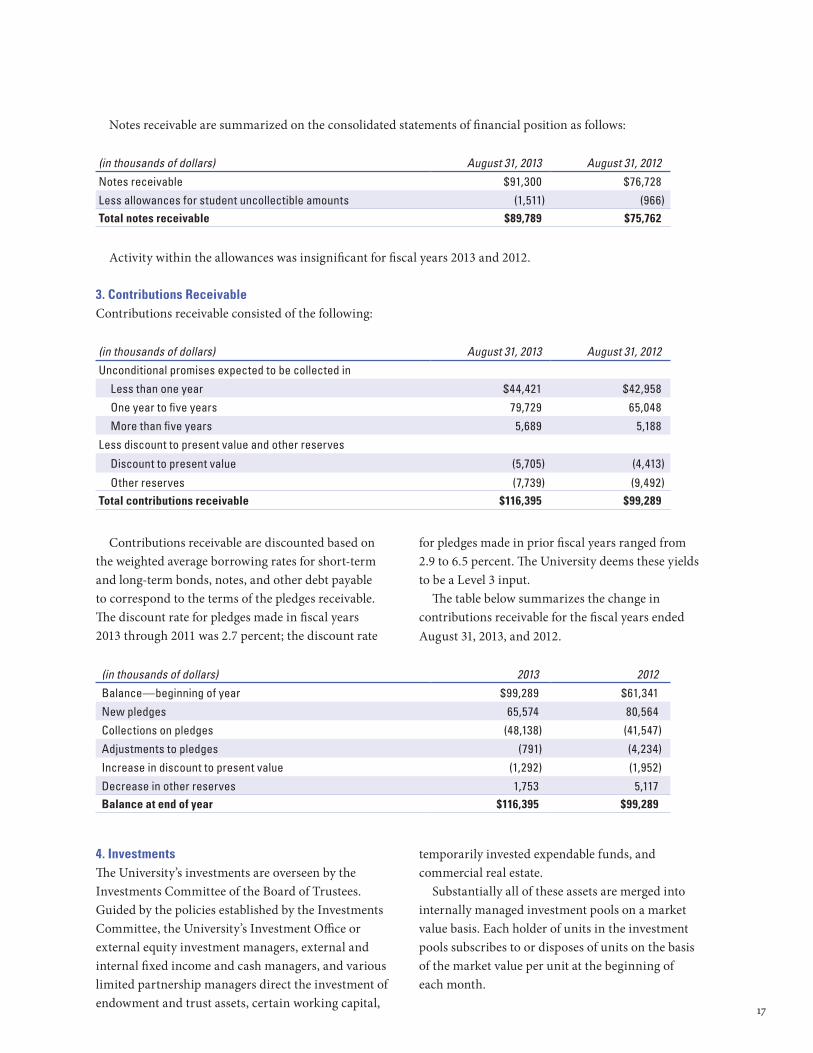
Notes receivable are summarized on the consolidated statements of financial position as follows:
(in thousands of dollars) August 31, 2013 August 31, 2012
Notes receivable $91,300 $76,728
Less allowances for student uncollectible amounts (1,511) (966)Total notes receivable $89,789 $75,762
Activity within the allowances was insignificant for fiscal years 2013 and 2012.
3. Contributions ReceivableContributions receivable consisted of the following:
(in thousands of dollars) August 31, 2013 August 31, 2012
Unconditional promises expected to be collected in
Less than one year $44,421 $42,958
One year to five years 79,729 65,048
More than five years 5,689 5,188
Less discount to present value and other reserves
Discount to present value (5,705) (4,413)
Other reserves (7,739) (9,492)Total contributions receivable $116,395 $99,289
Contributions receivable are discounted based on the weighted average borrowing rates for short-term and long-term bonds, notes, and other debt payable to correspond to the terms of the pledges receivable. The discount rate for pledges made in fiscal years 2013 through 2011 was 2.7 percent; the discount rate
for pledges made in prior fiscal years ranged from 2.9 to 6.5 percent. The University deems these yields to be a Level 3 input. The table below summarizes the change in contributions receivable for the fiscal years ended August 31, 2013, and 2012.
(in thousands of dollars) 2013 2012
Balance—beginning of year $99,289 $61,341
New pledges 65,574 80,564
Collections on pledges (48,138) (41,547)
Adjustments to pledges (791) (4,234)
Increase in discount to present value (1,292) (1,952)
Decrease in other reserves 1,753 5,117Balance at end of year $116,395 $99,289
4. InvestmentsThe University’s investments are overseen by the Investments Committee of the Board of Trustees. Guided by the policies established by the Investments Committee, the University’s Investment Office or external equity investment managers, external and internal fixed income and cash managers, and various limited partnership managers direct the investment of endowment and trust assets, certain working capital,
temporarily invested expendable funds, and commercial real estate. Substantially all of these assets are merged into internally managed investment pools on a market value basis. Each holder of units in the investment pools subscribes to or disposes of units on the basis of the market value per unit at the beginning of each month.

18
Investment Fair ValueThe following charts show the estimated fair value of investments and derivatives and also investments held at cost, grouped by the valuation hierarchy as defined in note 1, for the fiscal years ended August 31, 2013, and 2012:
(in thousands of dollars) August 31, 2013 Quoted prices in active markets (Level 1)
Significant other observable inputs (Level 2)
Significant unobservable inputs (Level 3)
Total fair value
US equity securities $408,307 $125,431 $463,352 $997,090
International equity 314,919 342,573 478,435 1,135,927
Fixed income — 828,375 74,771 903,146
High-yield credit — — 368,211 368,211
Absolute return — 305,220 1,019,935 1,325,155
Private investments 176 — 1,719,232 1,719,408
Real assets — 68,132 1,339,894 1,408,026
Other investments — 3,464 19,363 22,827
Subtotal investment assets at fair value 723,402 1,673,195 5,483,193 7,879,790
Investments held at cost — — 35,531 35,531
Interest-rate derivatives — — 2,301 2,301
Subtotal investments 723,402 1,673,195 5,521,025 7,917,622
Interest-rate swaps — — (30,769) (30,769)
Total $723,402 $1,673,195 $5,490,256 $7,886,853
(in thousands of dollars) August 31, 2012 Quoted prices in active markets (Level 1)
Significant other observable inputs (Level 2)
Significant unobservable inputs (Level 3)
Total fair value
US equity securities $266,249 $182,818 $391,725 $840,792
International equity 289,446 277,381 325,420 892,247
Fixed income 6,211 707,195 139,524 852,930
High-yield credit — — 417,340 417,340
Absolute return — 256,067 870,174 1,126,241
Private investments 229 — 1,666,530 1,666,759
Real assets 80,969 3,130 1,281,220 1,365,319
Other investments 10,210 2,685 18,458 31,353Subtotal investment assets at fair value 653,314 1,429,276 5,110,391 7,192,981
Investments held at cost — — 36,602 36,602
Interest-rate derivatives — — (9,526) (9,526)
Subtotal investments 653,314 1,429,276 5,137,467 7,220,057
Interest-rate swaps — — (71,103) (71,103)
Total $653,314 $1,429,276 $5,066,364 $7,148,954
Investments included in Level 3 consist primarily of the University’s ownership in alternative investments (principally limited partnership interests in hedge, private equity, real estate, and other similar funds). As a practical expedient, when quoted market prices are not available, the estimated fair values of these
investments are generally based on reported partners’ capital or NAV provided by the associated external investment managers. Since a range of possible values exists for these partnership investments, the estimated values may be materially different from the values that would have been used had a ready market for these

19
partnerships existed. The University exercises diligence in assessing the policies, procedures, and controls of external investment managers; management’s assess-ment includes a valuation review process of the most recent available audited and unaudited financial state-ments and discussions with the majority of external investment managers about the aggregate carrying value of the respective investments at August 31, 2013. The assessment may result in adjustment to the exter-nal managers’ valuations of the securities’ fair value. Management reviewed the valuation policies for all partnerships in which the University is invested and deemed that its policies are appropriate and that the carrying amount of these assets represents a reasonable estimate of fair value. A small number of investments
within certain partnerships may have holdings at a carrying value of cost. In the absence of another basis, management has determined this method to be appro-priate for these specific investments and representative of an approximation of the fair value. For fiscal years ended August 31, 2013, and 2012, investments held at cost included in Level 3 are real estate totaling $19.4 million, property co-ownerships totaling $13.7 million and $14.7 million, and mort-gages and other investments totaling $2.4 million and $2.5 million, respectively. The following tables summarize changes in the investments and derivatives classified by the University in Level 3 of the fair value hierarchy for the fiscal years ended August 31, 2013, and 2012:
(in thousands of dollars) August 31, 2012 August 31, 2013
Fair value PurchasesSales and
settlements
Unrealized gains
(losses)
Realized gains
(losses)
Transfers into and
out of Level 3 Reclassifications Fair value
US equity securities $391,725 50,000 (64,972) 84,638 1,961 $463,352
International equity 325,420 52,168 (31,074) 58,217 12,714 516 60,474 478,435
Fixed income 139,524 (4,287) (60,466) 74,771
High-yield credit 417,340 23,900 (92,337) 19,308 368,211
Absolute return 870,174 167,025 (72,036) 37,469 17,303 1,019,935Private investments 1,666,530 200,813 (220,681) 38,777 33,801 (8) 1,719,232Real assets 1,281,220 209,825 (198,103) 46,649 303 1,339,894
Other investments 18,458 695 (56) 266 19,363Total investments 5,110,391 704,426 (679,259) 281,037 66,082 516 — 5,483,193
Investments held at cost 36,602 268 (1,339) 35,531
Interest-rate derivatives (9,526) 11,827 2,301
Interest-rate swaps (71,103) 40,334 (30,769)
Total $5,066,364 704,694 (680,598) 333,198 66,082 516 — $5,490,256
20
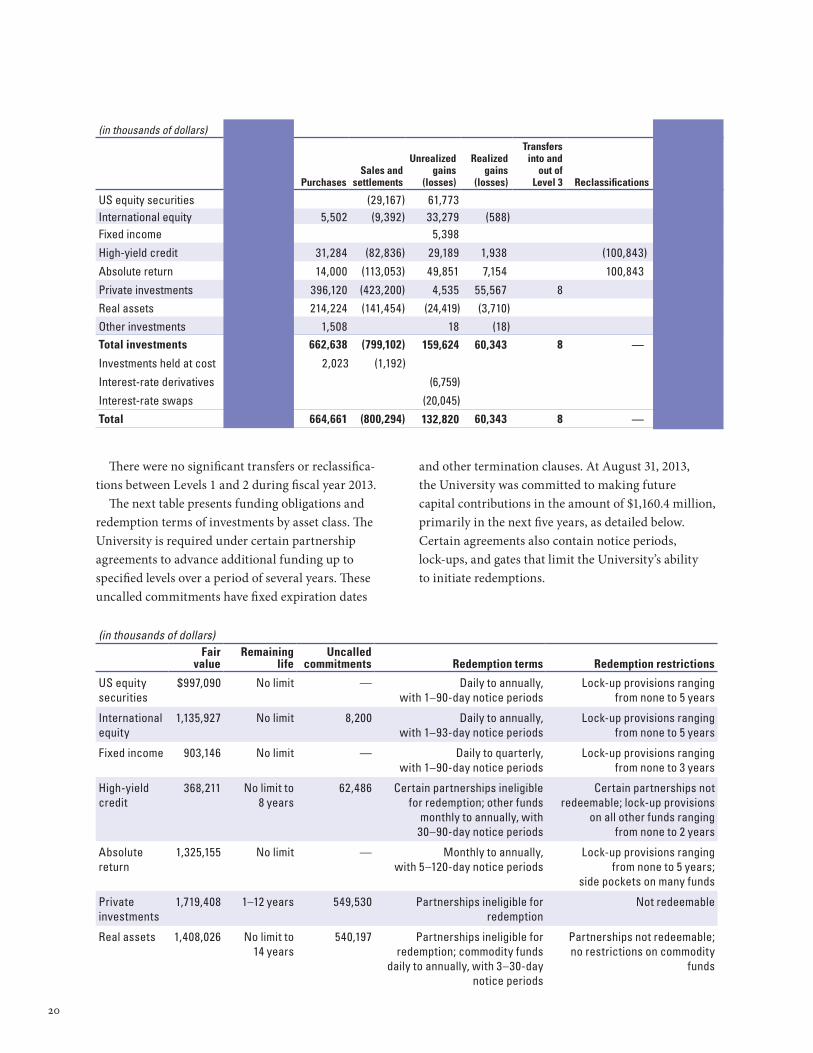
(in thousands of dollars) August 31, 2011 August 31, 2012
Fair value PurchasesSales and
settlements
Unrealized gains
(losses)
Realized gains
(losses)
Transfers into and
out of Level 3 Reclassifications Fair value
US equity securities $359,119 (29,167) 61,773 $391,725International equity 296,619 5,502 (9,392) 33,279 (588) 325,420Fixed income 134,126 5,398 139,524
High-yield credit 538,608 31,284 (82,836) 29,189 1,938 (100,843) 417,340
Absolute return 811,379 14,000 (113,053) 49,851 7,154 100,843 870,174
Private investments 1,633,500 396,120 (423,200) 4,535 55,567 8 1,666,530
Real assets 1,236,579 214,224 (141,454) (24,419) (3,710) 1,281,220
Other investments 16,950 1,508 18 (18) 18,458Total investments 5,026,880 662,638 (799,102) 159,624 60,343 8 — 5,110,391
Investments held at cost 35,771 2,023 (1,192) 36,602
Interest-rate derivatives (2,767) (6,759) (9,526)
Interest-rate swaps (51,058) (20,045) (71,103)
Total $5,008,826 664,661 (800,294) 132,820 60,343 8 — $5,066,364
There were no significant transfers or reclassifica-tions between Levels 1 and 2 during fiscal year 2013. The next table presents funding obligations and redemption terms of investments by asset class. The University is required under certain partnership agreements to advance additional funding up to specified levels over a period of several years. These uncalled commitments have fixed expiration dates
and other termination clauses. At August 31, 2013, the University was committed to making future capital contributions in the amount of $1,160.4 million, primarily in the next five years, as detailed below. Certain agreements also contain notice periods, lock-ups, and gates that limit the University’s ability to initiate redemptions.
(in thousands of dollars)Fair
value Remaining
life Uncalled commitments Redemption terms Redemption restrictions
US equity securities
$997,090 No limit — Daily to annually, with 1–90-day notice periods
Lock-up provisions ranging from none to 5 years
International equity
1,135,927 No limit 8,200 Daily to annually, with 1–93-day notice periods
Lock-up provisions ranging from none to 5 years
Fixed income 903,146 No limit — Daily to quarterly, with 1–90-day notice periods
Lock-up provisions ranging from none to 3 years
High-yield credit
368,211 No limit to 8 years
62,486 Certain partnerships ineligible for redemption; other funds
monthly to annually, with 30–90-day notice periods
Certain partnerships not redeemable; lock-up provisions
on all other funds ranging from none to 2 years
Absolute return
1,325,155 No limit — Monthly to annually, with 5–120-day notice periods
Lock-up provisions ranging from none to 5 years;
side pockets on many funds
Private investments
1,719,408 1–12 years 549,530 Partnerships ineligible for redemption
Not redeemable
Real assets 1,408,026 No limit to 14 years
540,197 Partnerships ineligible for redemption; commodity funds
daily to annually, with 3–30-day notice periods
Partnerships not redeemable; no restrictions on commodity
funds
21
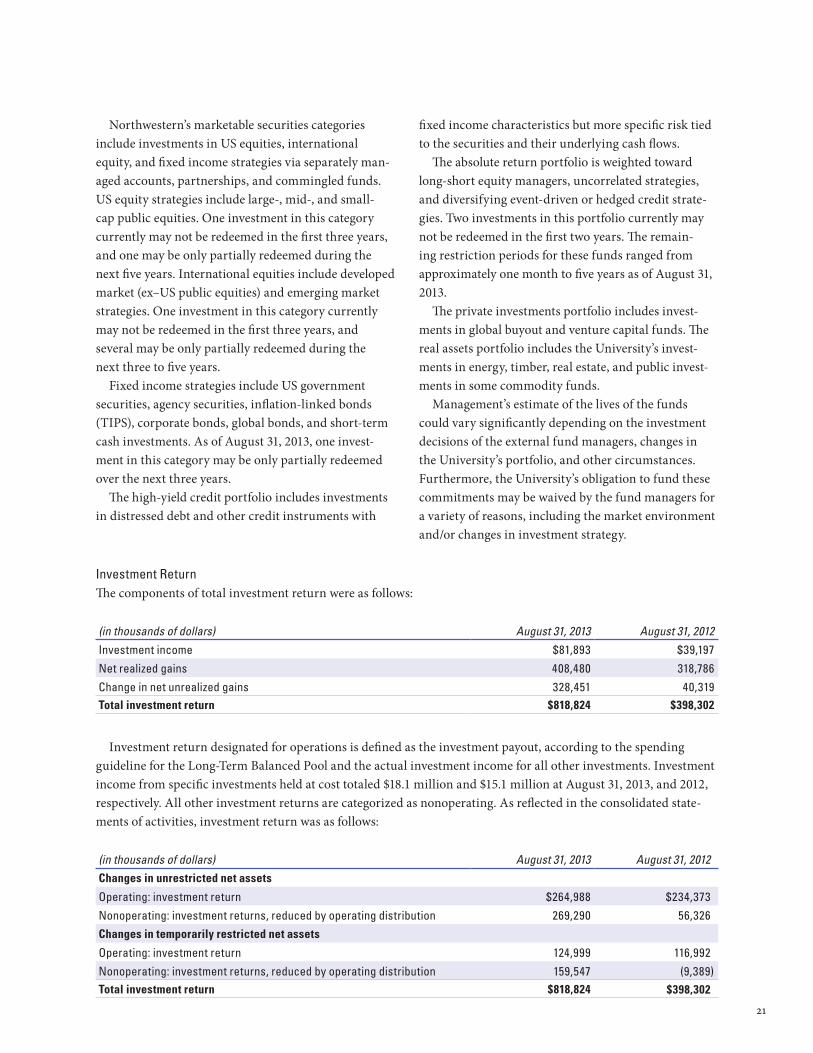
Northwestern’s marketable securities categories include investments in US equities, international equity, and fixed income strategies via separately man-aged accounts, partnerships, and commingled funds. US equity strategies include large-, mid-, and small-cap public equities. One investment in this category currently may not be redeemed in the first three years, and one may be only partially redeemed during the next five years. International equities include developed market (ex–US public equities) and emerging market strategies. One investment in this category currently may not be redeemed in the first three years, and several may be only partially redeemed during the next three to five years. Fixed income strategies include US government securities, agency securities, inflation-linked bonds (TIPS), corporate bonds, global bonds, and short-term cash investments. As of August 31, 2013, one invest-ment in this category may be only partially redeemed over the next three years. The high-yield credit portfolio includes investments in distressed debt and other credit instruments with
fixed income characteristics but more specific risk tied to the securities and their underlying cash flows. The absolute return portfolio is weighted toward long-short equity managers, uncorrelated strategies, and diversifying event-driven or hedged credit strate-gies. Two investments in this portfolio currently may not be redeemed in the first two years. The remain-ing restriction periods for these funds ranged from approximately one month to five years as of August 31, 2013. The private investments portfolio includes invest-ments in global buyout and venture capital funds. The real assets port folio includes the University’s invest-ments in energy, timber, real estate, and public invest-ments in some commodity funds. Management’s estimate of the lives of the funds could vary significantly depending on the investment decisions of the external fund managers, changes in the University’s portfolio, and other circumstances. Furthermore, the University’s obligation to fund these commitments may be waived by the fund managers for a variety of reasons, including the market environment and/or changes in investment strategy.
Investment ReturnThe components of total investment return were as follows:
(in thousands of dollars) August 31, 2013 August 31, 2012
Investment income $81,893 $39,197
Net realized gains 408,480 318,786
Change in net unrealized gains 328,451 40,319Total investment return $818,824 $398,302
Investment return designated for operations is defined as the investment payout, according to the spending guideline for the Long-Term Balanced Pool and the actual investment income for all other investments. Investment income from specific investments held at cost totaled $18.1 million and $15.1 million at August 31, 2013, and 2012, respectively. All other investment returns are categorized as non operating. As reflected in the consolidated state-ments of activities, investment return was as follows:
(in thousands of dollars) August 31, 2013 August 31, 2012
Changes in unrestricted net assets
Operating: investment return $264,988 $234,373
Nonoperating: investment returns, reduced by operating distribution 269,290 56,326
Changes in temporarily restricted net assets
Operating: investment return 124,999 116,992
Nonoperating: investment returns, reduced by operating distribution 159,547 (9,389)Total investment return $818,824 $398,302
22
Certain expenses paid directly by the University for investment management and custody services totaled $39 million and $41 million as of August 31, 2013, and 2012, respectively, and have been netted against invest-ment earnings.
Derivative Financial InstrumentsThe University has entered into hedging transactions via various interest-rate swaps and options and has maintained those positions since fiscal year 2010. The fair value of derivatives was $2.3 million as of August 31, 2013, and was in a liability position of $9.5 million as of August 31, 2012. These swaps and options had a notional value of $400 million at August 31, 2013, and 2012. These instruments are held in the fixed income asset class in the summary of changes in investments within Level 3. Credit exposure represents the University’s poten-tial loss if all the counterparties fail to perform under the terms of the contracts, and if all collateral, if any, becomes worthless. This exposure is measured by the fair value of the cash collateral held at the counter-parties at the reporting date. The University man-ages its exposure to credit risk by using highly rated counterparties, establishing risk-control limits, and
obtaining collateral where appropriate. As a result, the University has limited credit risk. The University has entered into margin collateral agreements with major investment banks that impose a $1 million threshold on both parties. As of August 31, 2013, the University held collateral of $2.9 million from one counterparty. To date, the University has not incurred any losses on derivative financial instruments due to counterparty nonperformance. The University has hired an external manager to use derivative financial instruments to obtain market exposure in equity and fixed income indices on excess cash balances. As of August 31, 2013, and 2012, the outstanding notional value of these derivatives was $162 million and $108 million, respectively. They had realized gains for fiscal year 2013 of $21.9 million and for fiscal year 2012 of $1.7 million. The University regularly reviews the use of derivative financial instruments by each of the managers of alter-native investment funds in which it participates. While these outside managers generally use such instruments for hedging purposes, derivative financial instruments are employed for trading purposes by numerous inde-pendent asset managers of the University.
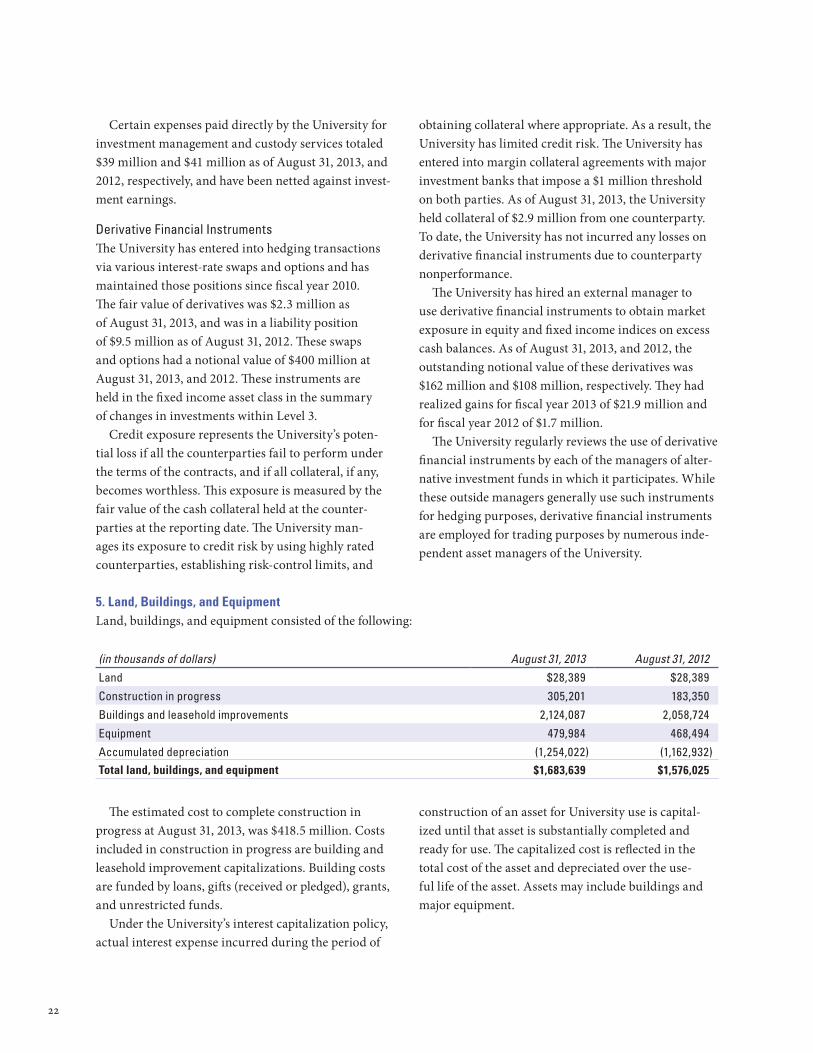
5. Land, Buildings, and EquipmentLand, buildings, and equipment consisted of the following:
(in thousands of dollars) August 31, 2013 August 31, 2012
Land $28,389 $28,389
Construction in progress 305,201 183,350
Buildings and leasehold improvements 2,124,087 2,058,724
Equipment 479,984 468,494
Accumulated depreciation (1,254,022) (1,162,932)Total land, buildings, and equipment $1,683,639 $1,576,025
The estimated cost to complete construction in progress at August 31, 2013, was $418.5 million. Costs included in construction in progress are building and leasehold improvement capitalizations. Building costs are funded by loans, gifts (received or pledged), grants, and unrestricted funds. Under the University’s interest capitalization policy, actual interest expense incurred during the period of
construction of an asset for University use is capital-ized until that asset is substantially completed and ready for use. The capitalized cost is reflected in the total cost of the asset and depreciated over the use-ful life of the asset. Assets may include buildings and major equipment.
23
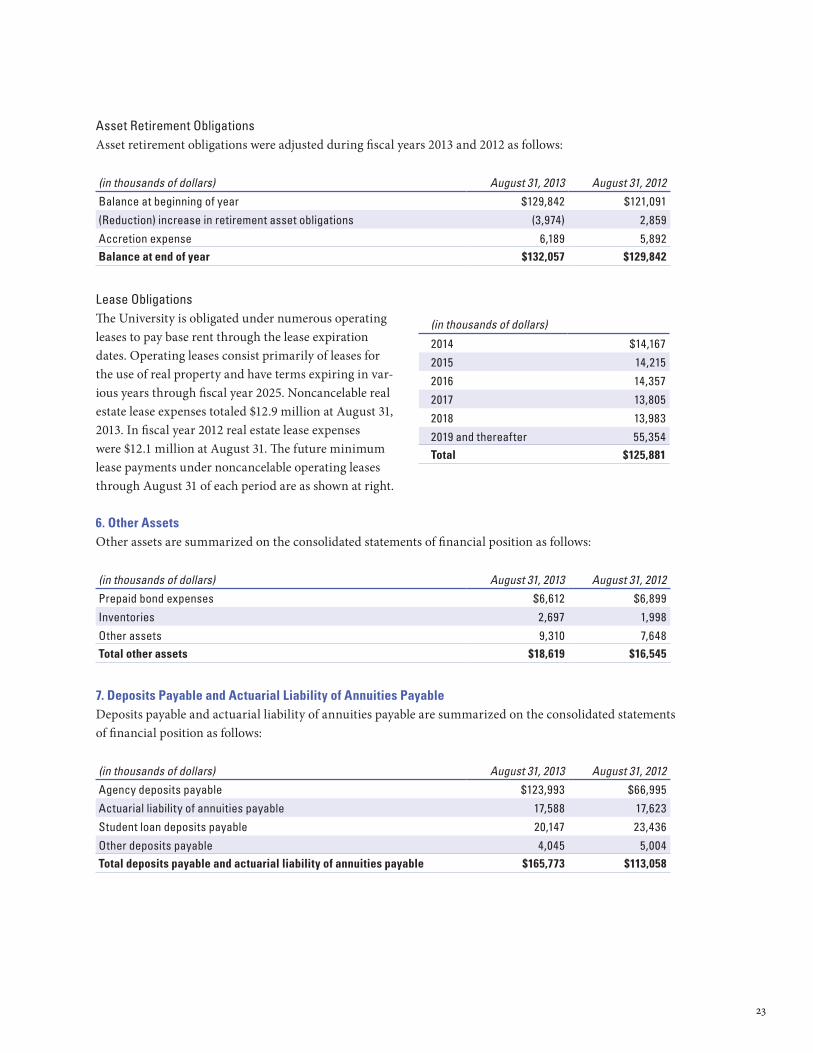
Asset Retirement ObligationsAsset retirement obligations were adjusted during fiscal years 2013 and 2012 as follows:
(in thousands of dollars) August 31, 2013 August 31, 2012
Balance at beginning of year $129,842 $121,091
(Reduction) increase in retirement asset obligations (3,974) 2,859
Accretion expense 6,189 5,892Balance at end of year $132,057 $129,842
Lease ObligationsThe University is obligated under numerous operating leases to pay base rent through the lease expiration dates. Operating leases consist primarily of leases for the use of real property and have terms expiring in var-ious years through fiscal year 2025. Noncancelable real estate lease expenses totaled $12.9 million at August 31, 2013. In fiscal year 2012 real estate lease expenses were $12.1 million at August 31. The future minimum lease payments under noncancelable operating leases through August 31 of each period are as shown at right.
(in thousands of dollars)
2014 $14,167
2015 14,215
2016 14,357
2017 13,805
2018 13,983
2019 and thereafter 55,354Total $125,881
6. Other AssetsOther assets are summarized on the consolidated statements of financial position as follows:
(in thousands of dollars) August 31, 2013 August 31, 2012
Prepaid bond expenses $6,612 $6,899
Inventories 2,697 1,998
Other assets 9,310 7,648Total other assets $18,619 $16,545
7. Deposits Payable and Actuarial Liability of Annuities PayableDeposits payable and actuarial liability of annuities payable are summarized on the consolidated statements of financial position as follows:
(in thousands of dollars) August 31, 2013 August 31, 2012
Agency deposits payable $123,993 $66,995
Actuarial liability of annuities payable 17,588 17,623
Student loan deposits payable 20,147 23,436
Other deposits payable 4,045 5,004Total deposits payable and actuarial liability of annuities payable $165,773 $113,058
24
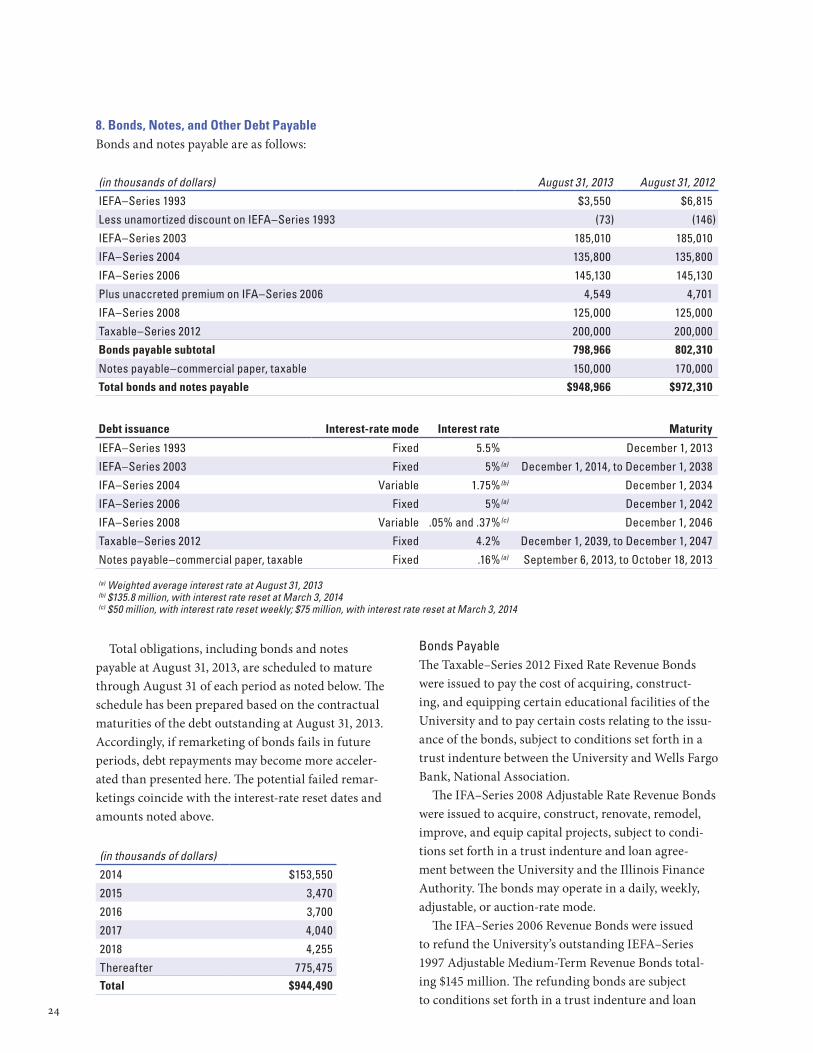
8. Bonds, Notes, and Other Debt PayableBonds and notes payable are as follows:
(in thousands of dollars) August 31, 2013 August 31, 2012
IEFA–Series 1993 $3,550 $6,815
Less unamortized discount on IEFA–Series 1993 (73) (146)
IEFA–Series 2003 185,010 185,010
IFA–Series 2004 135,800 135,800
IFA–Series 2006 145,130 145,130
Plus unaccreted premium on IFA–Series 2006 4,549 4,701
IFA–Series 2008 125,000 125,000
Taxable–Series 2012 200,000 200,000
Bonds payable subtotal 798,966 802,310
Notes payable–commercial paper, taxable 150,000 170,000
Total bonds and notes payable $948,966 $972,310
Debt issuance Interest-rate mode Interest rate Maturity
IEFA–Series 1993 Fixed 5.5% December 1, 2013
IEFA–Series 2003 Fixed 5% (a) December 1, 2014, to December 1, 2038
IFA–Series 2004 Variable 1.75% (b) December 1, 2034
IFA–Series 2006 Fixed 5% (a) December 1, 2042
IFA–Series 2008 Variable .05% and .37% (c) December 1, 2046
Taxable–Series 2012 Fixed 4.2% December 1, 2039, to December 1, 2047
Notes payable–commercial paper, taxable Fixed .16% (a) September 6, 2013, to October 18, 2013
(a) Weighted average interest rate at August 31, 2013 (b) $135.8 million, with interest rate reset at March 3, 2014 (c) $50 million, with interest rate reset weekly; $75 million, with interest rate reset at March 3, 2014
Total obligations, including bonds and notes payable at August 31, 2013, are scheduled to mature through August 31 of each period as noted below. The schedule has been prepared based on the contractual maturities of the debt outstanding at August 31, 2013. Accordingly, if remarketing of bonds fails in future periods, debt repayments may become more acceler-ated than presented here. The potential failed remar-ketings coincide with the interest-rate reset dates and amounts noted above.
(in thousands of dollars)
2014 $153,550
2015 3,470
2016 3,700
2017 4,040
2018 4,255
Thereafter 775,475Total $944,490
Bonds PayableThe Taxable–Series 2012 Fixed Rate Revenue Bonds were issued to pay the cost of acquiring, construct-ing, and equipping certain educational facilities of the University and to pay certain costs relating to the issu-ance of the bonds, subject to conditions set forth in a trust indenture between the University and Wells Fargo Bank, National Association. The IFA–Series 2008 Adjustable Rate Revenue Bonds were issued to acquire, construct, renovate, remodel, improve, and equip capital projects, subject to condi-tions set forth in a trust indenture and loan agree-ment between the University and the Illinois Finance Authority. The bonds may operate in a daily, weekly, adjustable, or auction-rate mode. The IFA–Series 2006 Revenue Bonds were issued to refund the University’s outstanding IEFA–Series 1997 Adjustable Medium-Term Revenue Bonds total-ing $145 million. The refunding bonds are subject to conditions set forth in a trust indenture and loan
25
agreement between the University and the Illinois Finance Authority. The IFA–Series 2004 Adjustable Rate Revenue Bonds were issued to acquire, construct, renovate, remodel, improve, and equip capital projects on both the Evanston and the Chicago campuses, subject to conditions set forth in a trust indenture and loan agreement between the University and the Illinois Finance Authority. The bonds may operate in a daily, weekly, adjustable, or auction-rate mode. The IEFA–Series 2003 Fixed Rate Revenue Bonds were issued to acquire, construct, or renovate certain University facilities and to refund $35 million of the University’s outstanding IEFA–Series 1993 bonds, subject to conditions set forth in a trust indenture and loan agreement between the University and the Illinois Educational Facilities Authority. The IEFA–Series 1993 Revenue Refunding Bonds operate in a fixed mode until maturity, currently bear-ing interest at a fixed rate of 5.5 percent. Proceeds of the refunding bonds were invested in United States government securities with a cost of $75.4 million and placed in escrow to satisfy scheduled payments of $66.4 million of the IEFA–Series 1985 bonds and related interest until maturity. Based on Level 2 observable inputs, at August 31, 2013, the fair value of the University’s fixed-rate debt of $541.6 million exceeded the carrying value of $533.7 million by $7.9 million. At August 31, 2012, the fair value of the University’s fixed-rate debt of $582.7 million exceeded the carrying value of $537 million by $45.7 million.
Derivative Financial InstrumentsThe University has entered into interest-rate swap agreements to hedge variable-rate exposure related to its variable-rate debt. The agreements effectively fix the interest rates at a range of 4.2 to 4.38 percent. The notional value is $262.1 million through August 29, 2014, and reduces to $125 million effective August 30, 2014, through expiration on December 1, 2046. The University recognized a net unrealized gain on the swap investment totaling $40.3 million for the fiscal year ended August 31, 2013, and a net unrealized loss of $20 million for the fiscal year ended August 31, 2012. The fair values of the swap position were in liability positions of $30.8 million and $71.1 million as of August 31, 2013, and 2012, respectively, and are included
in accounts payable and accrued expenses on the consolidated statements of financial position.
Notes PayableThe University places commercial paper under a $300 million Taxable Commercial Paper Note.
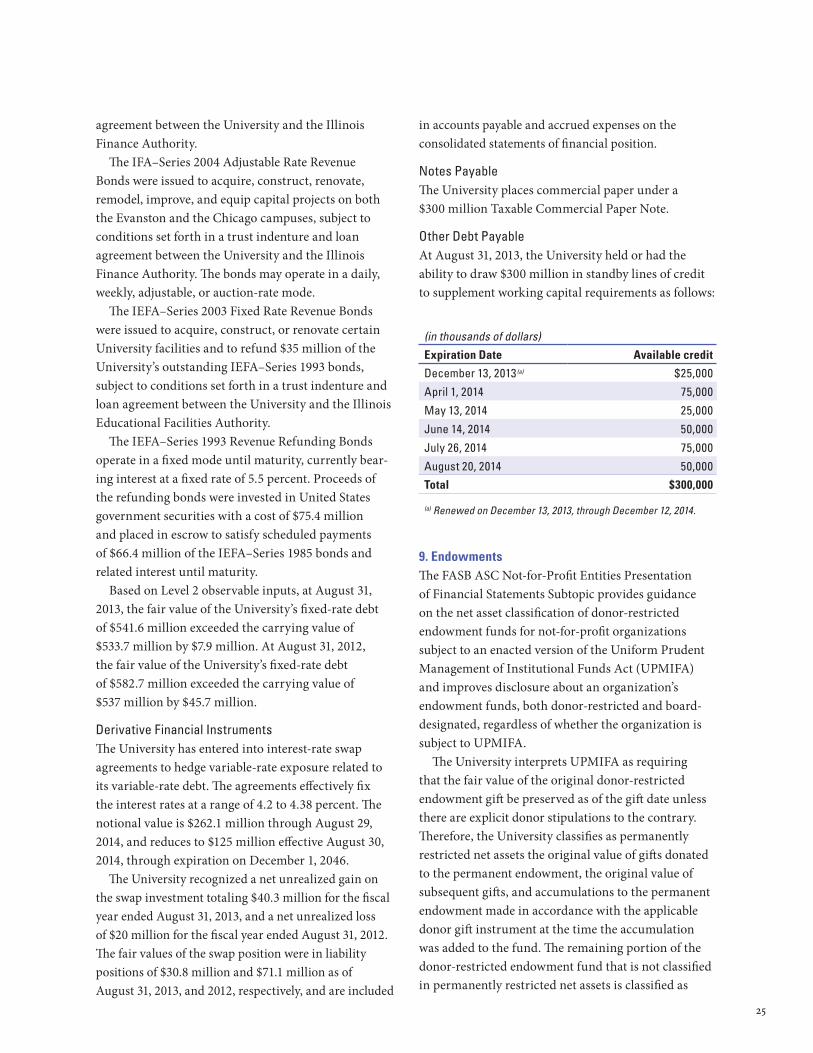
Other Debt PayableAt August 31, 2013, the University held or had the ability to draw $300 million in standby lines of credit to supplement working capital requirements as follows:
(in thousands of dollars)
Expiration Date Available credit
December 13, 2013 (a) $25,000
April 1, 2014 75,000
May 13, 2014 25,000
June 14, 2014 50,000
July 26, 2014 75,000
August 20, 2014 50,000
Total $300,000
(a) Renewed on December 13, 2013, through December 12, 2014.
9. Endowments The FASB ASC Not-for-Profit Entities Presentation of Financial Statements Subtopic provides guidance on the net asset classification of donor-restricted endowment funds for not-for-profit organizations subject to an enacted version of the Uniform Prudent Management of Institutional Funds Act (UPMIFA) and improves disclosure about an organization’s endowment funds, both donor-restricted and board-designated, regardless of whether the organization is subject to UPMIFA. The University interprets UPMIFA as requiring that the fair value of the original donor-restricted endowment gift be preserved as of the gift date unless there are explicit donor stipulations to the contrary. Therefore, the University classifies as permanently restricted net assets the original value of gifts donated to the permanent endowment, the original value of subsequent gifts, and accumulations to the permanent endowment made in accordance with the applicable donor gift instrument at the time the accumulation was added to the fund. The remaining portion of the donor-restricted endowment fund that is not classified in permanently restricted net assets is classified as
26
temporarily restricted net assets until it is appropriated for University expenditure in a manner consistent with UPMIFA’s standard of prudence. In accordance with UPMIFA, the University considers the following factors in determining to appropriate or accumulate donor-restricted endowment funds:
• The duration and preservation of the endowment fund
• The purposes of the institution and of the endowment fund
• General economic conditions
• The possible effects of inflation or deflation
• The expected total return from income and appreciation of investments
• Other resources of the institution
• The institutional investment policy
The University’s endowment consists of about 2,200 individual donor-restricted endowment funds and about 900 funds it designates to function as endow-ments. The net assets associated with endowment funds, including funds designated by the University to function as endowments, are classified and reported based on whether there are donor-imposed restrictions. Institution-designated endowment funds include quasi-endowments established by specific Board of Trustees approval as well as endowments created by manage-ment under general guidelines and policies approved by the Board of Trustees.
The following tables present the endowment net asset composition by type of fund at fair value for the years ended August 31, 2013, and 2012:
(in thousands of dollars) August 31, 2013Endowment net asset composition by type of fund Unrestricted
Temporarily restricted
Permanently restricted Total
Donor-restricted endowment funds ($2,013) $2,026,346 $1,108,485 $3,132,818Institution-designated endowment funds 3,150,312 3,150,312
Total endowment funds $3,148,299 $2,026,346 $1,108,485 $6,283,130
(in thousands of dollars) August 31, 2012Endowment net asset composition by type of fund
Unrestricted
Temporarily restricted
Permanently restricted Total
Donor-restricted endowment funds ($4,527) $1,870,885 $1,055,210 $2,921,568Institution-designated endowment funds 2,652,751 2,652,751
Total endowment funds $2,648,224 $1,870,885 $1,055,210 $5,574,319
Investment and Spending PoliciesThe University’s endowment is primarily invested in the Long-Term Balanced Pool, which is managed with the objective of long-term total return. The Investments Committee of the Board of Trustees annually reviews asset allocation policy for the pool. The principal objective for the Long-Term Balanced Pool is to preserve purchasing power and to provide a growing stream of income to fund University programs. On average, the pool seeks to achieve an annual total rate of return (i.e., actual income plus appreciation) equal to inflation plus actual spending. This objective of preserving purchasing power emphasizes the need for a long-term perspective in formulating both spending and investment policies.
The Board of Trustees has adopted a guideline for the annual spending rate from the University’s Long-Term Balanced Pool. The calculation blends market and spending elements for the total annual spending rate. The market element is an amount equal to 4.35 percent of the market value of a unit in the pool, averaged for the 12 months ended October 31 of the prior fiscal year. It is weighted at 30 percent in determining the total. The spending element is an amount equal to the current fiscal year’s spending amount increased by 1.5 percent plus the actual rate of inflation. It is weighted at 70 percent in determining the total.

27
If investment income received is not sufficient to support the total-return objective, the balance is provided from realized and unrealized gains. If the income received is in excess of the objective, the
balance is reinvested in the Long-Term Balanced Pool on behalf of the unit holders. The University’s policy is to allocate the current income of all other investment pools.
Changes In Endowment Net AssetsThe following tables represent the changes in endowment net assets for the years ended August 31, 2013, and 2012:
(in thousands of dollars) August 31, 2013
Unrestricted Temporarily restricted
Permanently restricted Total
Endowment net assets, beginning of year $2,648,224 $1,870,885 $1,055,210 $5,574,319
Investment loss (23,632) (21,859) (45,491)
Net appreciation (realized and unrealized) 335,161 305,179 640,340
Total investment return 311,529 283,320 — 594,849
Contributions 1,372 40,724 42,096
Appropriation of endowment assets for expenditure (114,714) (124,977) — (239,691)
Other changes
Transfers to create institutional funds 336,566 — — 336,566 Transfers of institutional funds per donor
requirement (83) 15,218 15,135
Spending of institution-designated endowment fund
(40,144) — — (40,144)
Other reclassifications 6,838 (4,171) (2,667) —
Endowment net assets, end of year $3,148,299 $2,026,346 $1,108,485 $6,283,130
(in thousands of dollars) August 31, 2012
Unrestricted Temporarily restricted
Permanently restricted Total
Endowment net assets, beginning of year $2,606,810 $1,884,520 $983,605 $5,474,935
Investment loss (8,057) (8,533) (16,590)
Net appreciation (realized and unrealized) 106,994 113,858 220,852
Total investment return 98,937 105,325 — 204,262
Contributions 260 46,487 46,747
Appropriation of endowment assets for expenditure (105,833) (117,159) — (222,992)
Other changes
Transfers to create institutional funds 147,087 — — 147,087 Transfers of institutional funds per donor
requirement 76 16,625 16,701
Spending of institution-designated endowment fund
(92,421) — — (92,421)
Other reclassifications (6,356) (2,137) 8,493 —Endowment net assets, end of year $2,648,224 $1,870,885 $1,055,210 $5,574,319
Underwater Endowment FundsThe University monitors endowment funds to identify those for which historical cost was more than fair value. As of August 31, 2013, and 2012, the historical cost of such accounts was approximately
$35 million and $74 million, and the market value totaled $33 million and $69 million, respectively. Associated unrealized losses are recorded in the unrestricted net assets classification; subsequent gains increase unrestricted net assets.
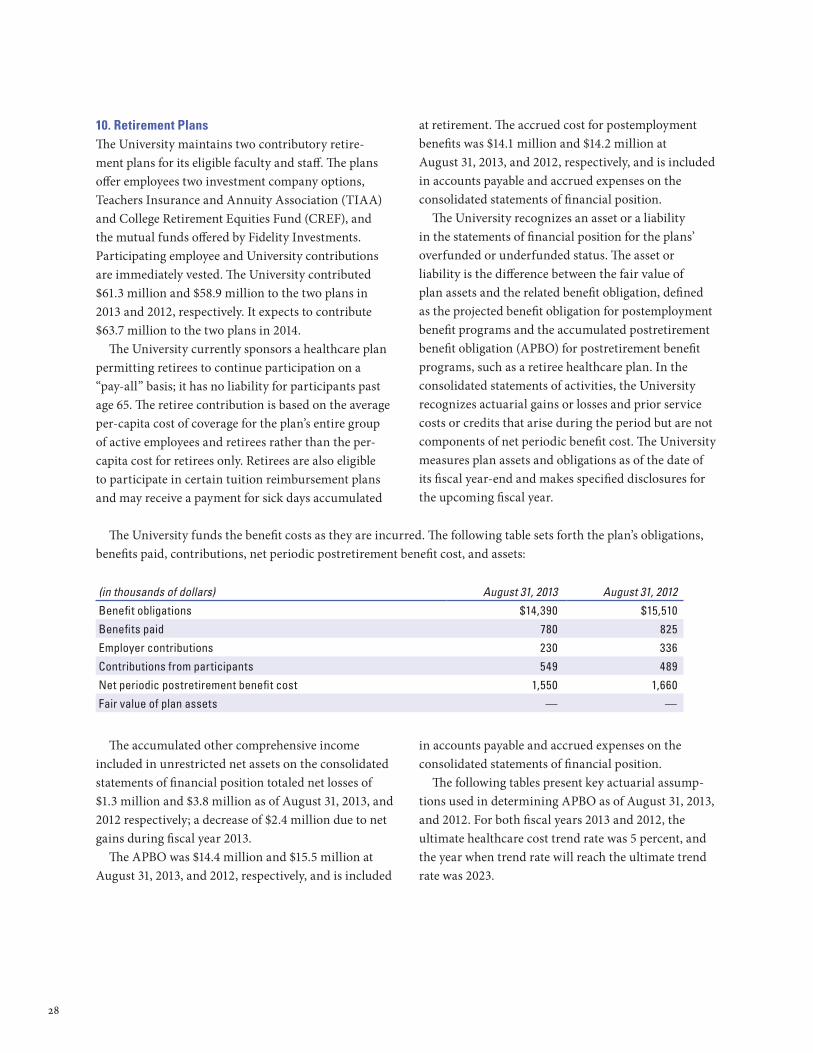
28
10. Retirement PlansThe University maintains two contributory retire-ment plans for its eligible faculty and staff. The plans offer employees two investment company options, Teachers Insurance and Annuity Association (TIAA) and College Retirement Equities Fund (CREF), and the mutual funds offered by Fidelity Investments. Participating employee and University contributions are immediately vested. The University contributed $61.3 million and $58.9 million to the two plans in 2013 and 2012, respectively. It expects to contribute $63.7 million to the two plans in 2014. The University currently sponsors a healthcare plan permitting retirees to continue participation on a “pay-all” basis; it has no liability for participants past age 65. The retiree contribution is based on the average per-capita cost of coverage for the plan’s entire group of active employees and retirees rather than the per-capita cost for retirees only. Retirees are also eligible to participate in certain tuition reimbursement plans and may receive a payment for sick days accumulated
at retirement. The accrued cost for post employment benefits was $14.1 million and $14.2 million at August 31, 2013, and 2012, respectively, and is included in accounts payable and accrued expenses on the consolidated statements of financial position. The University recognizes an asset or a liability in the statements of financial position for the plans’ overfunded or underfunded status. The asset or liability is the difference between the fair value of plan assets and the related benefit obligation, defined as the projected benefit obligation for postemployment benefit programs and the accumulated postretirement benefit obligation (APBO) for post retirement benefit programs, such as a retiree healthcare plan. In the consolidated statements of activities, the University recognizes actuarial gains or losses and prior service costs or credits that arise during the period but are not components of net periodic benefit cost. The University measures plan assets and obligations as of the date of its fiscal year-end and makes specified disclosures for the upcoming fiscal year.
The University funds the benefit costs as they are incurred. The following table sets forth the plan’s obligations, benefits paid, contributions, net periodic postretirement benefit cost, and assets:
(in thousands of dollars) August 31, 2013 August 31, 2012
Benefit obligations $14,390 $15,510
Benefits paid 780 825
Employer contributions 230 336
Contributions from participants 549 489
Net periodic postretirement benefit cost 1,550 1,660
Fair value of plan assets — —
The accumulated other comprehensive income included in unrestricted net assets on the consolidated statements of financial position totaled net losses of $1.3 million and $3.8 million as of August 31, 2013, and 2012 respectively; a decrease of $2.4 million due to net gains during fiscal year 2013. The APBO was $14.4 million and $15.5 million at August 31, 2013, and 2012, respectively, and is included
in accounts payable and accrued expenses on the consolidated statements of financial position. The following tables present key actuarial assump-tions used in determining APBO as of August 31, 2013, and 2012. For both fiscal years 2013 and 2012, the ultimate healthcare cost trend rate was 5 percent, and the year when trend rate will reach the ultimate trend rate was 2023.

29
Additional assumptions used to determine benefit obligations were as follows:
August 31, 2013 August 31, 2012
Settlement (discount) rate 4.3% 3.2%
Weighted average rate of increase in future compensation levels 3% 3%
Healthcare cost trend rate 7.5% 7.75%
Next, the assumptions used to determine net periodic benefit cost:
August 31, 2013 August 31, 2012
Discount rate 3.2% 4.5%
Weighted average rate of increase in future compensation levels 3% 4%
Healthcare cost trend rate 7.75% 8%
A one-percentage-point change in assumed healthcare cost trend rates would have had these effects in fiscal year 2013:
(in thousands of dollars) 1% point decrease 1% point increase
(Decrease) increase in total of service and interest cost ($107) $124
(Decrease) increase in postretirement benefit obligation (698) 782
Estimated future benefit payments reflecting antici-pated service, as appropriate, are expected to be paid as shown below.
(in thousands of dollars)
2014 $588
2015 573
2016 691
2017 775
2018 888
2019–2023 5,992Total $9,507
The University offers a deferred compensation plan under Internal Revenue Code 457(b) to a select group of management and highly compensated employees. There is no University contribution related to this deferred compensation plan. The University has recorded both an asset and a liability related to the deferred compensation plan that totaled $43 million and $35.3 million in fiscal years 2013 and 2012, respec-tively; these are included in investments and deposits payable and actuarial liability of annuities payable on the consolidated statements of financial position.
11. Related PartiesMembers of the University’s Board of Trustees, senior management, and faculty may on occasion be associ-ated either directly or indirectly with entities doing business with the University. The University bylaws and conflict of interest policies establish guidelines for disclosure and regulation of such activities as circumstances warrant. When such associations exist, measures are taken, in the best interests of the University, to mitigate any actual or perceived conflict. Transactions with related parties may include invest-ment management, common membership in invest-ment partnerships or other investment vehicles, and the purchase of goods or services. Northwestern Medical Faculty Foundation (NMFF), a related party, is a multispecialty physician organiza-tion committed to providing clinical care to patients and to supporting the research and academic endeav-ors of Northwestern’s Feinberg School of Medicine (Feinberg). An independent not-for-profit organiza-tion, NMFF is governed by a board of directors. NMFF physicians are full-time faculty members or researchers at Feinberg. Accounts receivable from NMFF arise out of operational activities. Such receivables totaled
30
$10.1 million and $9.7 million as of August 31, 2013, and 2012, respectively, and are included in accounts receivable on the consolidated statements of financial position. In addition, under the terms of an agreement with the University, NMFF contributes a percentage of its revenue to a research and education fund, medi-cal education programs, basic and applied biomedical research facilities and programs, and research and educational support services. NMFF also contributes funds to Feinberg’s teaching and research activities on a discretionary basis. These contributions totaled $60.8 million in fiscal year 2013 and $47.1 million in fiscal year 2012 and are included in private gifts on the consolidated statements of activities.
12. Self-Insurance Reserves and Other ContingenciesReserves for losses under the University’s self-insurance program, aggregating $10.3 million and $11.6 million at August 31, 2013, and 2012, respectively, include reserves for probable known losses and for losses incurred but not yet reported. A portion of the reserves pertaining to professional, general, and auto-mobile liability has been determined on a discounted present-value basis. The discount rate was 7.5 percent in fiscal years 2013 and 2012. Self-insurance reserves are based on estimates of historical loss experience, and while management believes that the reserves are adequate, the ultimate liabilities may be more or less than the amounts provided. These reserves are included in accounts payable and accrued expenses on the consolidated statements of financial position. Under an agreement between the University and NMFF, a proportionate share of primary medical professional liability costs that arise out of events prior to November 1, 2004, is borne by NMFF. As of November 1, 2004, NMFF obtained excess medi-cal liability coverage through another institution for all events after October 1, 2002, and reported after November 1, 2004. The University has contracted to service student loans sold to a lending agency prior to fiscal year 2009; these totaled $64.6 million and $84.4 million at August 31, 2013, and 2012, respectively. Service rev-enues are the excess of the actual interest collected above the agreed-upon warehouse fees on the serviced loans. The University manages the program to break
even and generates no servicing assets or liabilities through these activities. The University guarantees these loans against default up to 10 percent of the original domestic loan portfolio and 30 percent of the original inter national amounts. The maximum future total payments were $7.1 million as of August 31, 2013. At August 31, 2013, and 2012, $204,000 and $256,000, respectively, were reserved in anticipation of future defaults. Notes receivable on the consolidated state-ments of financial position are shown net of these reserves in fiscal years 2013 and 2012. In August 2009, the University, as originating lender, began participation in a student loan securitization program. It sold student loans to a school trust total-ing $65 million in 2009, $19.8 million in 2010, and $22.5 million in 2012; the University issued University guaranteed notes, which were purchased by a funding trust that procures financing to support the lending program. The programs are managed to break even and generate no servicing assets or liabilities. Guaranteed notes under these programs totaled $63.6 million and $77.2 million as of August 31, 2013, and 2012, respec-tively. These loans are included in notes receivable and deposits payable on the consolidated statements of financial position. Reserves in anticipation of securi-tized student loan future defaults totaled $178,000 and $216,000 at August 31, 2013, and 2012, respectively. Notes receivable on the consolidated statements of financial position are shown net of these reserves in fiscal years 2013 and 2012. From time to time, various claims and suits gener-ally incidental to the conduct of normal business are pending or may arise against the University. It is the opinion of management of the University, after taking into account insurance coverage, that any losses from the resolution of pending litigation should not have a material effect on the University’s financial position or results of operations. All funds expended in connection with government grants and contracts are subject to audit by govern-ment agencies. While any ultimate liability from audits of government grants and contracts by government agencies cannot be determined at present, management believes that it should not have a material effect on the University’s financial position or results of operations.
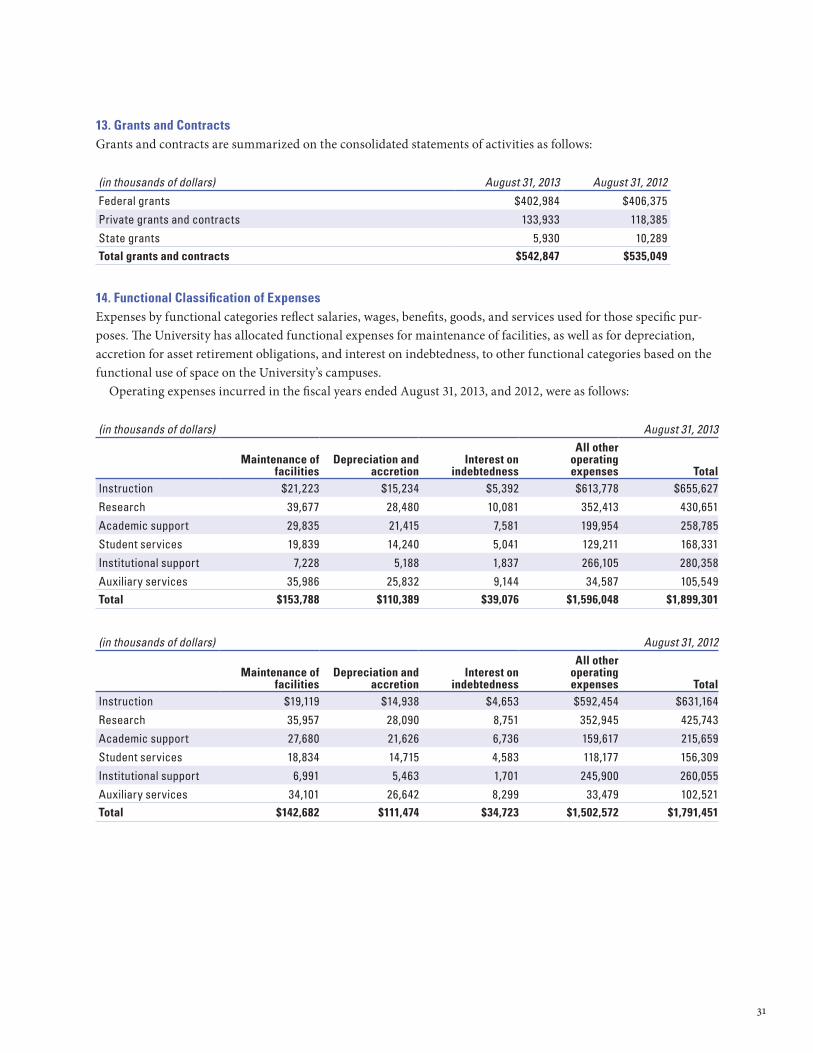
31
13. Grants and ContractsGrants and contracts are summarized on the consolidated statements of activities as follows:
(in thousands of dollars) August 31, 2013 August 31, 2012
Federal grants $402,984 $406,375
Private grants and contracts 133,933 118,385
State grants 5,930 10,289Total grants and contracts $542,847 $535,049
14. Functional Classification of ExpensesExpenses by functional categories reflect salaries, wages, benefits, goods, and services used for those specific pur-poses. The University has allocated functional expenses for maintenance of facilities, as well as for depreciation, accretion for asset retirement obligations, and interest on indebtedness, to other functional categories based on the functional use of space on the University’s campuses. Operating expenses incurred in the fiscal years ended August 31, 2013, and 2012, were as follows:
(in thousands of dollars) August 31, 2013
Maintenance of facilities
Depreciation and accretion
Interest on indebtedness
All other operating expenses Total
Instruction $21,223 $15,234 $5,392 $613,778 $655,627
Research 39,677 28,480 10,081 352,413 430,651
Academic support 29,835 21,415 7,581 199,954 258,785
Student services 19,839 14,240 5,041 129,211 168,331
Institutional support 7,228 5,188 1,837 266,105 280,358
Auxiliary services 35,986 25,832 9,144 34,587 105,549Total $153,788 $110,389 $39,076 $1,596,048 $1,899,301
(in thousands of dollars) August 31, 2012
Maintenance of facilities
Depreciation and accretion
Interest on indebtedness
All other operating expenses Total
Instruction $19,119 $14,938 $4,653 $592,454 $631,164
Research 35,957 28,090 8,751 352,945 425,743
Academic support 27,680 21,626 6,736 159,617 215,659
Student services 18,834 14,715 4,583 118,177 156,309
Institutional support 6,991 5,463 1,701 245,900 260,055
Auxiliary services 34,101 26,642 8,299 33,479 102,521Total $142,682 $111,474 $34,723 $1,502,572 $1,791,451
32
15. Subsequent EventsThe University has evaluated subsequent events in accordance with the FASB ASC Subsequent Event Topic through January 13, 2014, the date when the consoli-dated financial statements were issued. The following events were identified: Related party NMFF entered into an agreement with and became a wholly owned subsidiary of Northwestern Memorial Healthcare Corporation (NMHC) as of September 1, 2013. NMFF retains its corporate form as a not-for-profit organization, and its primary mission remains the same. Under terms of agreements between the University, NMFF, and NMHC, the University will continue to receive con-tributions to support the Feinberg School’s research and education programs. Through January 10, 2014, one-time transfers totaling $170.1 million have been made from NMFF to the University as a part of the agreement. On October 10, 2013, the University executed amendments to three of its interest-rate swap agree-ments with a total notional value of $125 million, shortening their maturity date from December 1, 2046, to August 31, 2023. The University received payments totaling $590,000 in two of the amendments; under the third amendment, the remaining fixed-payment portion of the swap was reduced from 4.325 percent to 4.123 percent. On October 21, 2013, the University issued $586 million in taxable bonds with an average inter-est rate of 4.63 percent. Proceeds of this issuance were used to refinance the University’s Illinois Educational Facilities Authority–Series 2003 fixed-rate bonds, totaling $185 million on December 1, 2013, with the remainder being used to finance future capital construction. On October 31, 2013, the University purchased a $61 million portfolio of private education loans from a lending agency; these loans had been purchased by the lending agency from the University before 2009 and will continue to be serviced by the University.

Administration and Trustees
Northwestern University is an equal opportunity, affirmative action educator and employer. © 2014 Northwestern University. All rights reserved. Produced by University Relations. 1-14/700/AE-VL/1620-1
Morton Schapiro, PhD President
Daniel I. Linzer, PhD Provost
Eugene S. Sunshine, MPA Senior Vice President for Business and Finance
Mary L. Baglivo, MS Vice President for Global Marketing and Chief Marketing Officer
Thomas G. Cline, JD Vice President and General Counsel
Alan K. Cubbage, JD Vice President for University Relations
Marilyn McCoy, MPP Vice President for Administration and Planning
William H. McLean, MBA Vice President and Chief Investment Officer
Robert McQuinn, MBA Vice President for University Development and Alumni Relations
Eric G. Neilson, MD Vice President for Medical Affairs
James J. Phillips, PhD Vice President for Athletics and Recreation
Sean Reynolds, MA Vice President for Information Technology and Chief Information Officer
Patricia Telles-Irvin, EdD Vice President for Student Affairs
Joseph T. Walsh Jr., PhD Vice President for Research
Financial Operations Staff
Pamela S. Beemer Associate Vice President for Human Resources
James M. Hurley Associate Vice President for Budget Planning, Analysis, and Allocation
Betty L. McPhilimy Associate Vice President for Audit and Advisory Services
Ronald Nayler Associate Vice President for Facilities Management
Ingrid S. Stafford Associate Vice President for Financial Operations and Treasurer
Brian S. Peters Assistant Vice President of University Services
Karl E. Turro Controller
Michael S. Daniels Senior Associate Controller and Executive Director of Research Financial Operations
Nancy L. Pinchar Associate Controller and Director of Accounting Services
2013–14 Board of Trustees
Mark A. Angelson Peter J. Barris Deborah H. Brady Christine E. BrennanSteven A. CahillaneJohn A. Canning Jr. Christopher B. Combe Catherine M. Coughlin A. Steven Crown Richard H. Dean Deborah L. DeHaas James A. DeNaut Charles W. Douglas John M. Eggemeyer Michael W. Ferro Jr. D. Cameron Findlay Dennis J. FitzSimons T. Bondurant French Christopher B. Galvin J. Douglas Gray Philip L. Harris Dean M. Harrison
(ex officio) Jay C. Hoag Jane S. Hoffman Daniel S. Jones (ex officio) David G. Kabiller Nancy Trienens Kaehler Adam R. Karr Ellen Philips Katz Melih Z. Keyman Harreld N. Kirkpatrick IIILester B. Knight Bhadrashyam H. Kothari Timothy K. Krauskopf Bill Lambert Lawrence F. Levy Edward M. Liddy J. Landis Martin W. James McNerney Jr. Kathryn K. Mlsna
(ex officio)Wendy M. Nelson Robin Chemers Neustein Phebe N. NovakovicWilliam A. Osborn (chair) Jane DiRenzo Pigott Brian S. Posner J. B. Pritzker M. Jude Reyes Virginia M. Rometty Patrick G. Ryan Jr.
David A. Sachs Michael J. Sacks Paul Sagan William E. Sagan Muneer A. SatterD. Gideon Searle Andrew E. Senyei, MDMorton Schapiro
(ex officio) Michael S. ShannonBenjamin W. Slivka Mary Lou Song Timothy P. Sullivan Charles A. Tribbett III Jeffrey W. Ubben Julia A. UihleinFrederick H. Waddell Sona Wang David B. Weinberg Miles D. White Emory Williams IIIStephen R. WilsonW. Rockwell Wirtz
Life Trustees
William F. AldingerLee Phillip BellPatricia Buehler
BlankenshipJudith S. BlockNeil G. Bluhm Duane L. BurnhamNicholas D. Chabraja Dennis H. Chookaszian Donald C. ClarkGeorge A. CohonFranklin A. ColePhilip M. ConditStanton R. CookJohn W. CroghanLester CrownBonnie S. DanielsRaymond F. FarleyW. James FarrellWilliam E. Fay Jr.Barbara GainesJames L. Garard Jr.Lavern N. GaynorEric J. GleacherHerbert W. GullquistJ. Ira HarrisThomas Z. Hayward Jr.George E. JohnsonJames R. Kackley
Jerome P. KenneyJames L. KetelsenWilliam S. KirschMartin J. KoldykeHarry M. Kraemer Jr. Duane R. KullbergAlan M. LeventhalJohn Jeffry LouisFrank W. LuerssenAnn Lurie Robert A. LurieMartha Grimes MabieJohn W. MadiganGarry K. MarshallR. Eden Martin Arthur C. MartinezJames R. McManusNewton N. MinowLee M. Mitchell Leo F. MullinJames J. O’ConnorDale Park Jr.Harry J. PearceJerry K. PearlmanDonald S. PerkinsJerry M. ReinsdorfDon H. ReubenJohn M. RichmanJohn W. RowePatrick G. Ryan Robert P. Saltzman James P. SchadtCharles E. SchroederArthur R. Seder Jr.Gordon I. SegalLouis A. Simpson Harold B. SmithWilliam D. SmithburgJudith A. SprieserEdward F. SwiftThomas C. TheobaldRichard L. ThomasHoward J. TrienensBetty A. Van GorkomJohn R. WalterLawrence A. WeinbachJudd A. WeinbergWilliam J. WhiteStephen M. WolfBlaine J. Yarrington
