northeast natural gas region · northeast natural gas region ... texas eastern m3, transco zone 6...
TRANSCRIPT
Federal Energy Regulatory Commission • Market Oversight @ FERC.gov
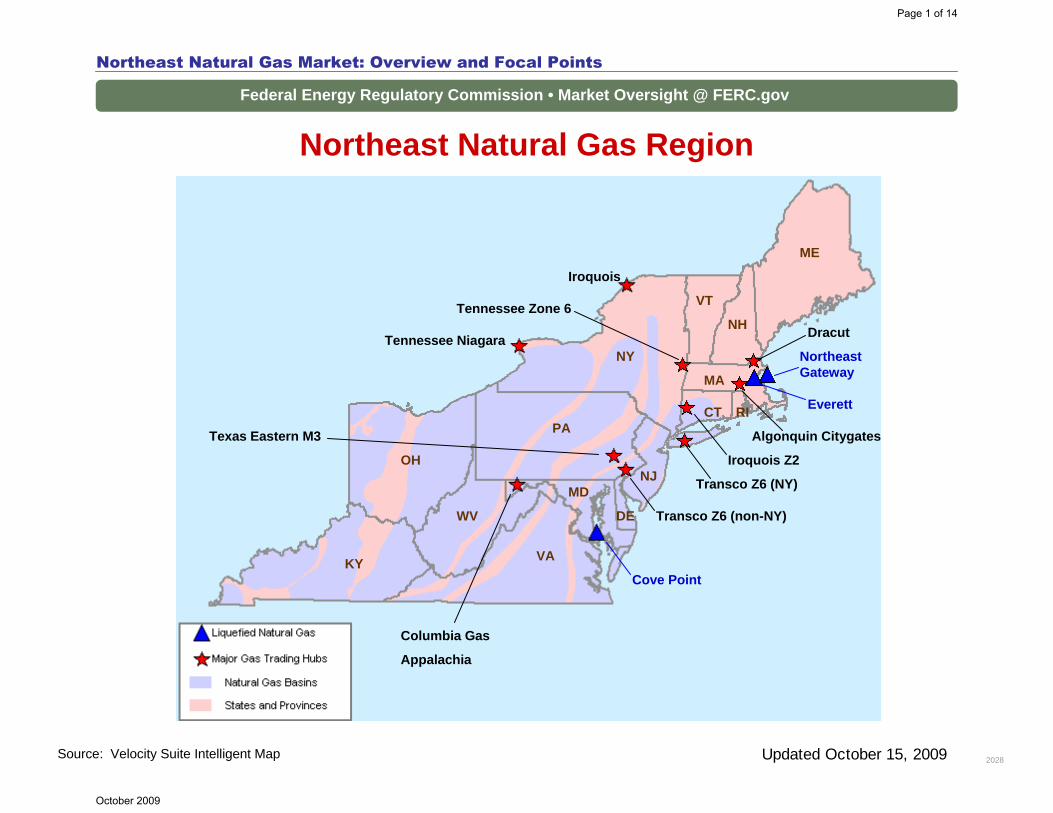
Northeast Natural Gas Region
Northeast Natural Gas Market: Overview and Focal Points
Source: Velocity Suite Intelligent Map Updated October 15, 2009 2028
NY
NH
ME
VT
MA
RICT
DE
NJMD
PA
KY
OH
VA
WV
Dracut
Iroquois Z2
Iroquois
Northeast Gateway
Tennessee Zone 6
Algonquin CitygatesTexas Eastern M3
Transco Z6 (non-NY)
Columbia Gas
Appalachia
Tennessee Niagara
Transco Z6 (NY)
Everett
Cove Point
Page 1 of 14
October 2009

Federal Energy Regulatory Commission • Market Oversight @ FERC.gov
Northeast Natural Gas Market: Overview and Focal Points
2028
Overview:
Market DescriptionNatural gas use is increasingly important to the Northeast. Though traditionally the Northeast has been a winter peaking region, increased reliance on natural-gas fired generation has evened out annual gas use. Increased dual requirements for natural gas as a space heat fuel and utilization of gas-fired plants has imposed greater challenges on the Northeast, compared to other regions, in aligning commercial and operating conditions between the gas and power industries. The Northeast has little indigenous production (mainly in the Appalachian basin) and none in New England although this trend could begin to change with the successful exploitation of the Marcellus Shale play located in the heart of Appalachia.
Beginning in 2009 the Rockies Express Pipeline began service to the Northeast opening up less expensive Rockies gas to the market. To take advantage of the additional supply pipeline operators added over 3 Billion Cubic Feet per day of additional capacity to the market between 2008 and quarter one 2009, the most in over a decade. Despite increased gas use for power generation, pipeline utilization remains highly seasonal; major regional pipelines often operate at high load factors during the winter resulting in basis differentials to upstream liquid trading points that may greatly exceed firm transportation tariff levels. Rockies and Marcellus Shale supply to the Northeast will becomeincreasingly competitive with traditional supply from the Gulf. The influx of natural gas supply could help moderate the severe basis spikes that traditionally occur during winter peak demand days. The Northeast relies upon conventional and LNG storage to meet peak-day gas needs. LNG plays a critical role in the overall supply mix and at times accounts for up to 30 percent of peak-day gas needs in New England. Market participants in the Northeast can draw upon the nation’s most extensive portfolio of dual, gas-oil fired power plants to flexibly respond to market price and load changes.
GeographyStates covered: Connecticut, Delaware Maine, Maryland, Massachusetts, New Hampshire, New Jersey, New York, Pennsylvania, Rhode Island, West Virginia, and Vermont.
Updated September 30, 2009
Page 2 of 14
October 2009

Federal Energy Regulatory Commission • Market Oversight @ FERC.gov
Northeast Natural Gas Market: Overview and Focal Points
2028
Major Trading HubsAlgonquin Citygates, Columbia Gas Appalachia, Dominion South Point, Dracut, Iroquois Zone 2, Niagara, Texas Eastern M3, Transco Zone 6 NY, and, Transco Zone 6 Non-NY.
Pipeline Flows
Average Daily Southern Zones Deliveries to the Northeast2005: 6.9 Bcf/d2006: 6.6 Bcf/d2007: 7.3 Bcf/d2008: 7.7 Bcf/d2009: 8.2 Bcf/d (Jan-June)
Major Pipelines: Transco, Tennessee, Texas Eastern and Columbia carry a significant amount of gas from the Gulf coast to the Northeast.
Average Daily Mid-Continent Deliveries to the Northeast2005: 1.6 Bcf/d2006: 1.6 Bcf/d2007: 1.5 Bcf/d2008: 1.5 Bcf/d2009: 1.3 Bcf/d (Jan-June)
Major Pipelines: Columbia, Texas Eastern and Dominion move gas from the Midwest to the Northeast
Updated September 30, 2009
Page 3 of 14
October 2009
Federal Energy Regulatory Commission • Market Oversight @ FERC.gov
Northeast Natural Gas Market: Overview and Focal Points
2028
Imports and Exports
Average Daily Imports from Canada into the Northeast2005: 2.8 Bcf/d2006: 2.7 Bcf/d2007: 2.7 Bcf/d2008: 2.5 Bcf/d2009: 2.0 Bcf/d (Jan-June)
Major Importers Maritimes and Northeast pipeline, Tennessee Gas Pipeline and Iroquois Gas Transmission System flow the majority of the gas from Canada to the Northeast. In 2009 the Brunswick Pipeline began service delivering LNG from the Canaport LNG terminal into New England. Together, they represent the following percentages of pipeline gas imports:
2005: 83%2006: 85%2007: 88%2008: 89%2009: 84% (Jan-June)
Updated September 30, 2009
Page 4 of 14
October 2009

Federal Energy Regulatory Commission • Market Oversight @ FERC.gov
Northeast Natural Gas Market: Overview and Focal Points
2028Updated September 30, 2009
Average Daily LNG Send out: 2005: 0.3 Bcf/d2006: 0.3 Bcf/d2007: 0.5 Bcf/d2008: 0.2 Bcf/d2009: 0.3 Bcf/d (Jan-June)
Note: Represents daily receipts from Everett to Tennessee and Algonquin. 2009 numbers also represent the addition of Northeast Gateway Terminal deliveries to Algonquin. Excludes volumes delivered via truck, consumed at Mystic or other distribution.
Contact InformationFor specific issues regarding the Northeast Natural Gas Region please contact the following Analysts:
Ryan Jett – [email protected]
Page 5 of 14
October 2009

Federal Energy Regulatory Commission • Market Oversight @ FERC.gov
Annual Average Spot Hub Prices
Northeast Natural Gas Market: Yearly Hub Prices
2026Source: Derived from Platts data. Updated January 23, 2009
Annual Average Day Ahead Prices ($/MMBtu)2004 2005 2006 2007 2008 5-Year Avg
Algonquin Citygates $6.86 $9.75 $7.40 $8.18 $10.06 $8.45Transco Z6 NY $6.82 $10.03 $7.37 $8.46 $10.13 $8.56Transco Z6 non-NY $6.55 $9.63 $7.30 $7.77 $9.85 $8.22Columbia-Appalachia $6.14 $9.18 $6.97 $7.20 $9.18 $7.73Niagara $6.20 $8.88 $6.96 $7.32 $9.25 $7.72
Page 6 of 14
October 2009

Federal Energy Regulatory Commission • Market Oversight @ FERC.gov
Northeastern Spot Prices and Basis
Source: Derived from Platts data.
Northeast Natural Gas Market: Spot Prices and Basis
2030Updated October 7, 2009
-$5
$0
$5
$10
$15
$20
$25
$30
$35
$40
Nov-
07De
c-07
Jan-
08Fe
b-08
Mar
-08
Apr-0
8M
ay-0
8Ju
n-08
Jul-0
8Au
g-08
Sep-
08O
ct-08
Nov-
08De
c-08
Jan-
09Fe
b-09
Mar
-09
Apr-0
9M
ay-0
9Ju
n-09
Jul-0
9Au
g-09
Sep-
09
-$20
$0
$20
$40
$60
$80
$100
$120
$140
$160
ALGONQUIN CITYGATESTRANSCO ZONE 6 NON-NYCOLUMBIA GAS APPALACHIATRANSCO ZONE 6 NY
30 Day Rolling Average
$0
$5
$10
$15
$20
$25
2003 2004 2005 2006 2007 2008 2009
Spot
Basis
Spo
t Pric
es ($
/MM
Btu
)
Bas
is P
rices
($/M
MB
tu)
Page 7 of 14
October 2009

Federal Energy Regulatory Commission • Market Oversight @ FERC.gov
Northeastern Monthly Average Basis Value to Henry Hub
Source: Derived from Platts data.
Northeast Natural Gas Market: Average Basis to Henry Hub
2031
$0
$1
$2
$3
$4
$5
$6
Nov-07
Dec-07
Jan-0
8Feb
-08Mar-
08Apr-
08May
-08Ju
n-08
Jul-0
8Aug
-08Sep
-08Oct-
08Nov
-08Dec
-08Ja
n-09
Feb-09
Mar-09
Apr-09
May-09
Jun-0
9Ju
l-09
Aug-09
Sep-09
ALGONQUIN CITYGATESCOLUMBIA GAS APPALACHIADAWN ONTARIODRACUTTRANSCO ZONE 6 NON-NY
Pric
e D
iffer
ence
($/
MM
Btu)
Updated October 7, 2009
Page 8 of 14
October 2009
Federal Energy Regulatory Commission • Market Oversight @ FERC.gov
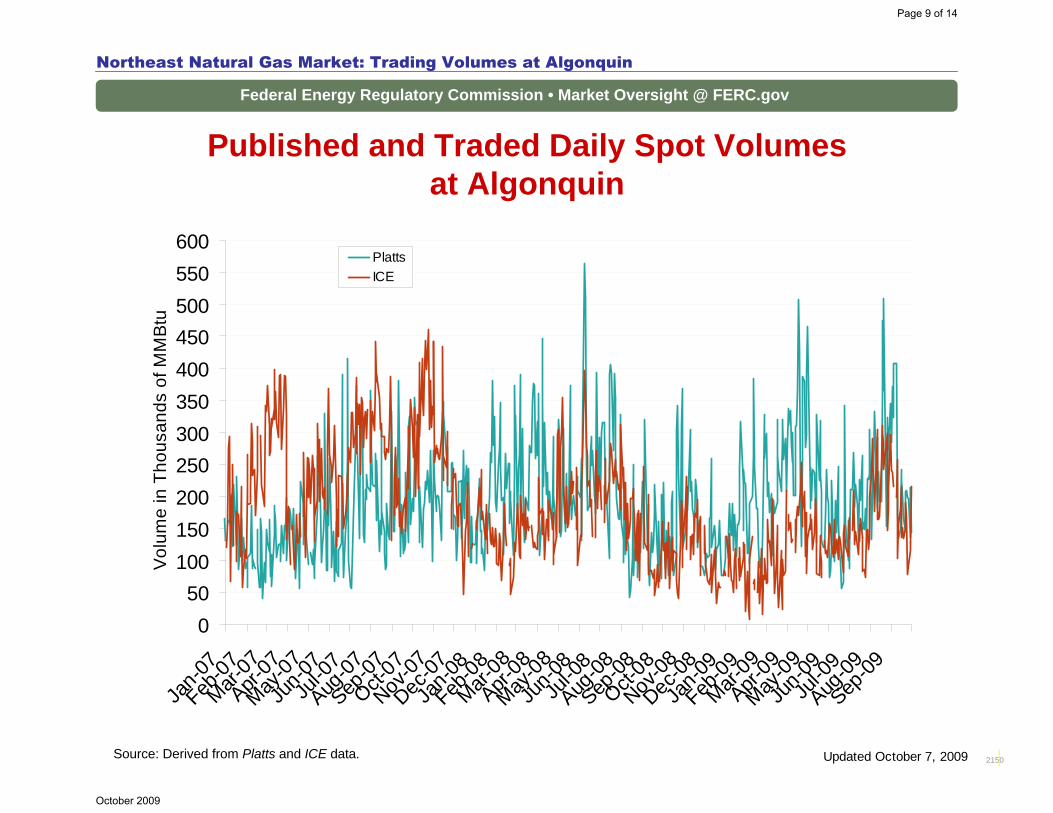
Published and Traded Daily Spot Volumesat Algonquin
Source: Derived from Platts and ICE data.
Northeast Natural Gas Market: Trading Volumes at Algonquin
2150
050
100150200250300350400450500550600
Jan-0
7Feb
-07Mar-
07Apr-
07May
-07Ju
n-07
Jul-0
7Aug
-07Sep
-07Oct-
07Nov
-07Dec
-07Ja
n-08
Feb-08
Mar-08
Apr-08
May-08
Jun-0
8Ju
l-08
Aug-08
Sep-08
Oct-08
Nov-08
Dec-08
Jan-0
9Feb
-09Mar-
09Apr-
09May
-09Ju
n-09
Jul-0
9Aug
-09Sep
-09
PlattsICE
Vol
ume
in T
hous
ands
of M
MBt
u
Updated October 7, 2009
Page 9 of 14
October 2009

Federal Energy Regulatory Commission • Market Oversight @ FERC.gov
Published and Traded Daily Spot Volumesat Transco Zone 6
Source: Derived from Platts and ICE data.
Northeast Natural Gas Market: Trading Volumes at Transco Zone 6
2150
0
200
400
600
800
1,000
1,200
Jan-0
7Mar-
07May
-07Ju
l-07
Sep-07
Nov-07
Jan-0
8Mar-
08May
-08Ju
l-08
Sep-08
Nov-08
Jan-0
9Mar-
09May
-09Ju
l-09
Sep-09
Platts
ICE
Vol
ume
in T
hous
ands
of M
MB
tu
Updated October 7, 2009
Page 10 of 14
October 2009

Federal Energy Regulatory Commission • Market Oversight @ FERC.gov
Maritimes Pipeline Flows
Northeast Natural Gas Market : Maritimes Pipeline Flows
22054Source: Derived from Bentek data. Updated October 9, 2009
050
100150200250300350400450500550600650700750800850900
5/15
/09
5/29
/09
6/12
/09
6/26
/09
7/10
/09
7/24
/09
8/7/
098/
21/0
99/
4/09
9/18
/09
10/2
/09
MM
cfd
Nova Scotia DemandM&N Power Plant Deliveries
050
100150200250300350400450500550600650700750800850900
5/15
/09
5/29
/09
6/12
/09
6/26
/09
7/10
/09
7/24
/09
8/7/
098/
21/0
99/
4/09
9/18
/09
10/2
/09
Supply from Canaport
Supply from Sable Island
Page 11 of 14
October 2009
Federal Energy Regulatory Commission • Market Oversight @ FERC.gov
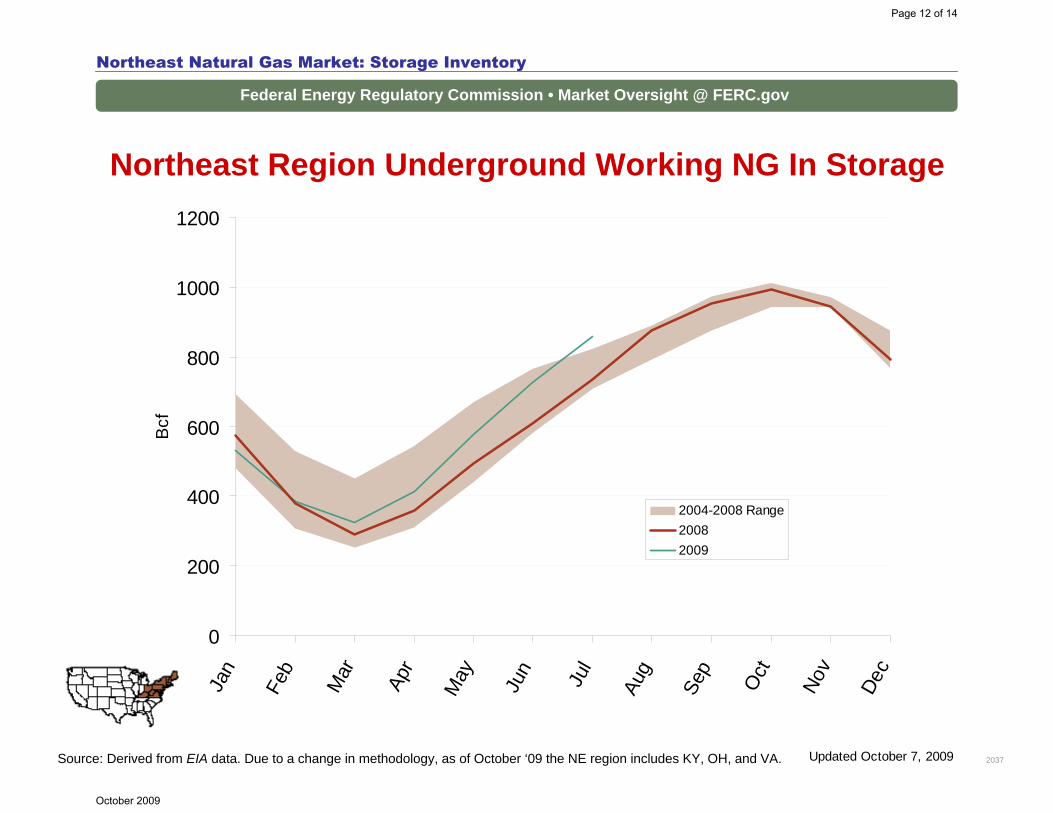
Northeast Region Underground Working NG In Storage
Source: Derived from EIA data. Due to a change in methodology, as of October ‘09 the NE region includes KY, OH, and VA.
Northeast Natural Gas Market: Storage Inventory
2037Updated October 7, 2009
0
200
400
600
800
1000
1200Ja
n
Feb
Mar Apr
May Jun Jul
Aug
Sep
Oct
Nov
Dec
Bcf
2004-2008 Range20082009
Page 12 of 14
October 2009
Federal Energy Regulatory Commission • Market Oversight @ FERC.gov
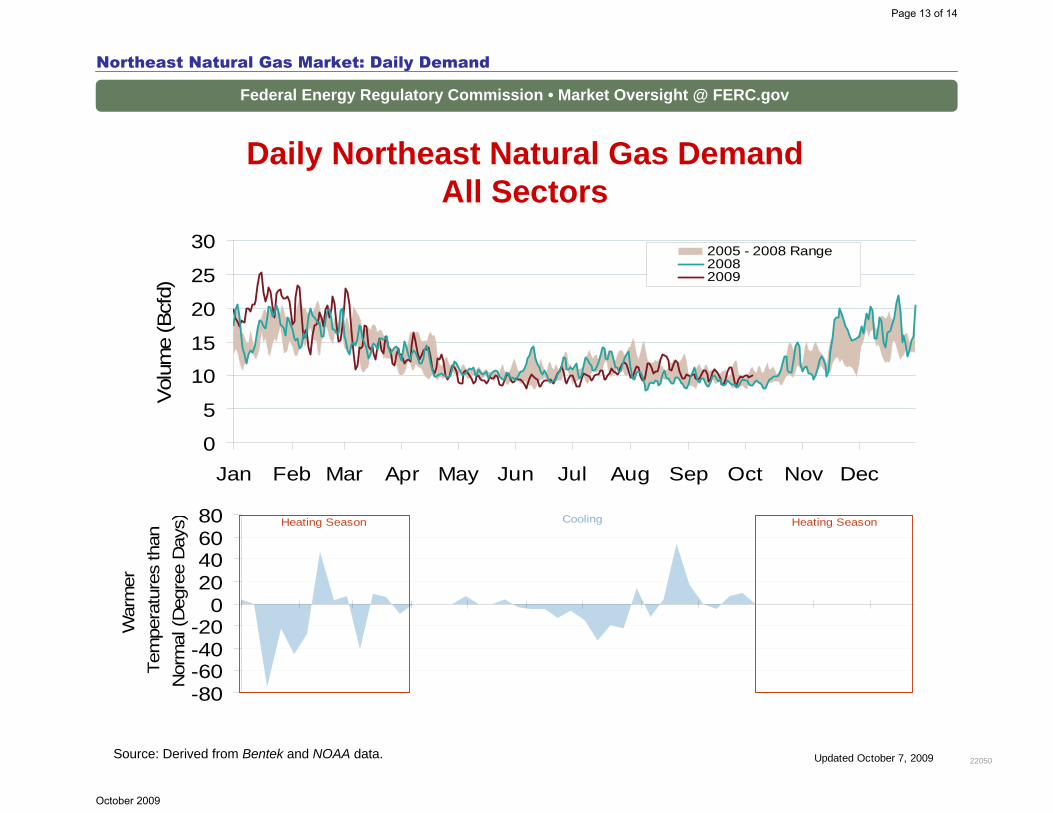
Daily Northeast Natural Gas DemandAll Sectors
Source: Derived from Bentek and NOAA data.
Northeast Natural Gas Market: Daily Demand
22050Updated October 7, 2009
0
5
10
15
20
25
30
Jan Feb Mar Apr May Jun Jul Aug Sep Oct Nov Dec
Vol
ume
(Bcf
d)
2005 - 2008 Range20082009
-80-60-40-20
020406080
War
mer
Tem
pera
ture
s th
anN
orm
al (D
egre
e D
ays ) Heating SeasonCooling Heating Season
Page 13 of 14
October 2009

Federal Energy Regulatory Commission • Market Oversight @ FERC.gov
Natural Gas Infrastructure Additions
Northeast Natural Gas Market : Northeast Infrastructure Additions
22051Source: Derived from Bentek data. Updated October 15, 2009
1 32
4
56
78
9
PipeLNG
Rockies Gas
Gulf S
upply
LNG
LNG
PROJECT IN SERVICE
MAX CAPACITY
1) REX (Clarington) Nov-09 1.800 Bcfd2) DTI Hub Dec-09 0.200 Bcfd3) TETCO Northern Bridge Nov-09 0.150 Bcfd4) VNG Hampton Roads Dec-09 0.100 Bcfd5) Transco Sentinel Phase II Nov-09 0.102 Bcfd6) Iroquois 09/09 Phase III Nov-09 0.025 Bcfd7) AGT J-2 Loop Sep-09 0.140 Bcfd8) Neptune Offshore LNG Sep-09 0.400 Bcfd9) Canaport LNG Jun-09 1.000 Bcfd
Page 14 of 14
October 2009