northeast dairy farm summary2015 | northeast dairy farm summary iv index of figures profile of the...
TRANSCRIPT

NORTHEAST DAIRY FARM SUMMARY
2015REPORT PREPARED BY:


2015Northeast
Dairy FarmSUMMARY
Prepared by:Chris Laughton, Editor
Farm Credit East
May 2016
This report is a collaboration of Farm Credit East and Yankee Farm Credit.

ACKNOWLEDGMENTSNo research project of the scope of the Northeast Dairy Farm Summary (DFS) would be possible without the collaboration and hard work of many individuals. The editor would like to thank those who preceded him in writing the DFS over the past 30-plus years. Thanks, as well, to Farm Credit Financial Partners, Inc. for creation of the benchmark application and their assistance in compiling data.
In addition, credit is due to all Farm Credit East and Yankee Farm Credit staff, who reconciled reams of farm financial data from hundreds of farms and entered the information into the system. Special thank you to: Mike Farmer, Kathryn Hall, Clarissa Kniskern, Shelia Manning, Colleen Maryhugh, Emily Robertson and Bill Zweigbaum. Every year, their hard work provides the raw material for creating the DFS.
And, most importantly, the entire Farm Credit team extends our sincere thanks to the hardworking Northeast dairy farmers who entrusted their farm data to this project. We hope the end product is helpful in your continual pursuit of improved farm management. You inspire us all with the valuable work that you do.
Copyright 2016by
Farm Credit East, ACA
All rights reserved. No part of this material may be reproduced
by any means either in print or electronically, without permission.

NORTHE AST DA IRY FAR M SU MMARY | 2015
i
HIGHLIGHTS OF THE 2015 NORTHEAST DAIRY FARM SUMMARY
› 487 dairy farms participated in the 2015 Northeast Dairy Farm Summary.
› Profitability declined by 99 percent in 2015 from the prior year. Net household earnings fell to an average of $14 per cow in 20151, down from $1,169 per cow in 2014. When non-farm income is subtracted, farms lost an average of $30 per cow. Farm milk price declined by $7.34 per hundredweight (cwt.) to $18.24.
› Many costs declined in 2015, but not enough to counter falling milk prices. Total expenses per cwt. decreased $2.37 per cwt. to $22.13 in 20152.
› Net cost of production3 (NCOP) also declined to $18.36 per cwt., $2.60 below 2014.
› Some specific operating cost categories which decreased in 2015 are:
• Feed expense decreased from $1,897 per cow in 2014 to $1,733 in 2015, due to falling grain and oilseed prices.
• Labor, a dairy farm’s second largest expense, was 2.1 percent lower per cwt. due to productivity gains.
• Fuel expenses declined by 36 percent.
› Productivity increased. Per cow production rose by 2.5 percent. Milk sold per worker increased 2.9 percent.
› Cash flow was insufficient to meet all financial commitments (e.g., operating expenses, debt repayment, family living and income taxes), resulting in an average cash margin per farm of -$7,314.
› Percent net worth fell to 72 percent. Debt-per-cow increased from $3,354 per cow to $3,681.
PROFILE OF THE AVERAGE NORTHEAST DAIRY FARM
2014 2015
Number of Cows 348 374
Milk Sold per Cow 23,759 lbs. 24,366 lbs.
Milk Sold per Worker 1,102,149 lbs. 1,134,300 lbs.
Milk Price per Cwt. $25.58 $18.24
NCOP per Cwt. $20.84 $18.36
Net Worth 75% 72%
Net Household Income per Cow $1,169 $14
Return on Assets 10.0% 0.8%
1After family living and nonfarm income, on an accrual basis.2Including family living.3Total farm expense, plus family living, less non-milk income. For more information, see page 7.


NORTHE AST DA IRY FAR M SU MMARY | 2015
iii
TABLE OF CONTENTSHighlights of the 2015 Northeast Dairy Farm Summary . . . . . . . . . . . . . . . . . . . . . . . . . . . . . . . . . . . . . . . . . . . . . . . . . . i
Introduction . . . . . . . . . . . . . . . . . . . . . . . . . . . . . . . . . . . . . . . . . . . . . . . . . . . . . . . . . . . . . . . . . . . . . . . . . . . . . . . . . . 1
Changes to the Dairy Farm Summary . . . . . . . . . . . . . . . . . . . . . . . . . . . . . . . . . . . . . . . . . . . . . . . . . . . . . . . . . . . . . . . 2
Analysis of 2015
A Challenging Year . . . . . . . . . . . . . . . . . . . . . . . . . . . . . . . . . . . . . . . . . . . . . . . . . . . . . . . . . . . . . . . . . . . . . 4
Milk Price Declines . . . . . . . . . . . . . . . . . . . . . . . . . . . . . . . . . . . . . . . . . . . . . . . . . . . . . . . . . . . . . . . . . . . . . 5
Cost of Production Declines due to Belt-Tightening . . . . . . . . . . . . . . . . . . . . . . . . . . . . . . . . . . . . . . . . . . . . 7
Herd Size Changes . . . . . . . . . . . . . . . . . . . . . . . . . . . . . . . . . . . . . . . . . . . . . . . . . . . . . . . . . . . . . . . . . . . . . 10
Cash Flow Weakens . . . . . . . . . . . . . . . . . . . . . . . . . . . . . . . . . . . . . . . . . . . . . . . . . . . . . . . . . . . . . . . . . . . . 13
Capital Debt Exceeds Debt Capacity . . . . . . . . . . . . . . . . . . . . . . . . . . . . . . . . . . . . . . . . . . . . . . . . . . . . . . . 14
Producers Trim Capital Purchases . . . . . . . . . . . . . . . . . . . . . . . . . . . . . . . . . . . . . . . . . . . . . . . . . . . . . . . . . 16
Balance Sheets Weaken . . . . . . . . . . . . . . . . . . . . . . . . . . . . . . . . . . . . . . . . . . . . . . . . . . . . . . . . . . . . . . . . . 17
Net Margin Differences Remain Significant in 2015 . . . . . . . . . . . . . . . . . . . . . . . . . . . . . . . . . . . . . . . . . . . 19
Management Style and Dairy Profits . . . . . . . . . . . . . . . . . . . . . . . . . . . . . . . . . . . . . . . . . . . . . . . . . . . . . . . 21
Do Larger Farms Have the Edge on Profitability? . . . . . . . . . . . . . . . . . . . . . . . . . . . . . . . . . . . . . . . . . . . . . . 23
Conclusion . . . . . . . . . . . . . . . . . . . . . . . . . . . . . . . . . . . . . . . . . . . . . . . . . . . . . . . . . . . . . . . . . . . . . . . . . . 24
Financial Records . . . . . . . . . . . . . . . . . . . . . . . . . . . . . . . . . . . . . . . . . . . . . . . . . . . . . . . . . . . . . . . . . . . . . . . . . . . . . 25
Comparison between Years 2011-2015
Table A-1. Earnings Worksheet . . . . . . . . . . . . . . . . . . . . . . . . . . . . . . . . . . . . . . . . . . . . . . . . . . . . 26
Table A-2. Earnings Worksheet per Cwt. . . . . . . . . . . . . . . . . . . . . . . . . . . . . . . . . . . . . . . . . . . . . . 27
Table A-3. Balance Sheet Summary – Year-End . . . . . . . . . . . . . . . . . . . . . . . . . . . . . . . . . . . . . . . . 28
Table A-4. Evaluation Factors . . . . . . . . . . . . . . . . . . . . . . . . . . . . . . . . . . . . . . . . . . . . . . . . . . . . . 29
Table A-5. Trend Analysis . . . . . . . . . . . . . . . . . . . . . . . . . . . . . . . . . . . . . . . . . . . . . . . . . . . . . . . . 30
2015 Data by Herd Size
Table B-1. Earnings Worksheet . . . . . . . . . . . . . . . . . . . . . . . . . . . . . . . . . . . . . . . . . . . . . . . . . . . . 31
Table B-2. Balance Sheet Summary . . . . . . . . . . . . . . . . . . . . . . . . . . . . . . . . . . . . . . . . . . . . . . . . . 32
Table B-3. Evaluation Factors . . . . . . . . . . . . . . . . . . . . . . . . . . . . . . . . . . . . . . . . . . . . . . . . . . . . . 33
2015 Data by Profit Groups
Table C-1. Earnings Worksheet . . . . . . . . . . . . . . . . . . . . . . . . . . . . . . . . . . . . . . . . . . . . . . . . . . . . 34
Table C-2. Balance Sheet Summary . . . . . . . . . . . . . . . . . . . . . . . . . . . . . . . . . . . . . . . . . . . . . . . . . 35
Table C-3. Evaluation Factors . . . . . . . . . . . . . . . . . . . . . . . . . . . . . . . . . . . . . . . . . . . . . . . . . . . . . 36
Table C-4. Cost of Producing Milk By Profit Groups . . . . . . . . . . . . . . . . . . . . . . . . . . . . . . . . . . . 37
Table C-5. Cash Margins By Profit Groups . . . . . . . . . . . . . . . . . . . . . . . . . . . . . . . . . . . . . . . . . . . 37
Table C-6. Reserve Debt Capacity by Profit Groups . . . . . . . . . . . . . . . . . . . . . . . . . . . . . . . . . . . . 37
2015 Data by Regions
Table D-1. Earnings Worksheet . . . . . . . . . . . . . . . . . . . . . . . . . . . . . . . . . . . . . . . . . . . . . . . . . . . . 38
Table D-2. Balance Sheet Summary . . . . . . . . . . . . . . . . . . . . . . . . . . . . . . . . . . . . . . . . . . . . . . . . . 39
Table D-3. Evaluation Factors . . . . . . . . . . . . . . . . . . . . . . . . . . . . . . . . . . . . . . . . . . . . . . . . . . . . . 40
Glossary . . . . . . . . . . . . . . . . . . . . . . . . . . . . . . . . . . . . . . . . . . . . . . . . . . . . . . . . . . . . . . . . . . . . . . . . . . . . . . . . . . . . 41

2015 | NORTHE AST DA IRY FAR M SU MMARY
iv
INDEX OF FIGURESProfile of the Average Northeast Dairy Farm . . . . . . . . . . . . . . . . . . . . . . . . . . . . . . . . . . . . . . . . . . . . . . . . . . . . i
Figure 1: Dairy Farm Profitability . . . . . . . . . . . . . . . . . . . . . . . . . . . . . . . . . . . . . . . . . . . . . . . . . . . . . . . . . . . 3
Figure 2: Net Household Earnings per Cow (1979-2015) . . . . . . . . . . . . . . . . . . . . . . . . . . . . . . . . . . . . . . . . . 3
Figure 2A: Comparison of Multiyear Averages . . . . . . . . . . . . . . . . . . . . . . . . . . . . . . . . . . . . . . . . . . . . . . . . . . 5
Figure 3A: Farm Milk Prices per Cwt. (Actual vs. 5-Year Average) . . . . . . . . . . . . . . . . . . . . . . . . . . . . . . . . . . . 6
Figure 3B: Farm Milk Prices per Cwt. (Actual vs. Real Dollars) . . . . . . . . . . . . . . . . . . . . . . . . . . . . . . . . . . . . . 6
Figure 4A: Cost of Producing Milk - Accrual Basis . . . . . . . . . . . . . . . . . . . . . . . . . . . . . . . . . . . . . . . . . . . . . . 7
Figure 4B: Specific Cost Categories . . . . . . . . . . . . . . . . . . . . . . . . . . . . . . . . . . . . . . . . . . . . . . . . . . . . . . . . . . 8
Figure 4C: NCOP by Region . . . . . . . . . . . . . . . . . . . . . . . . . . . . . . . . . . . . . . . . . . . . . . . . . . . . . . . . . . . . . . 9
Figure 4D: NCOP by Herd Size . . . . . . . . . . . . . . . . . . . . . . . . . . . . . . . . . . . . . . . . . . . . . . . . . . . . . . . . . . . 10
Figure 5A: Farm Size and Milk Production . . . . . . . . . . . . . . . . . . . . . . . . . . . . . . . . . . . . . . . . . . . . . . . . . . . 11
Figure 5B: Labor Productivity Influences Profits . . . . . . . . . . . . . . . . . . . . . . . . . . . . . . . . . . . . . . . . . . . . . . . 11
Figure 6: Capital Efficiency . . . . . . . . . . . . . . . . . . . . . . . . . . . . . . . . . . . . . . . . . . . . . . . . . . . . . . . . . . . . . . . 12
Figure 7: Cash Flow Analysis per Cwt. . . . . . . . . . . . . . . . . . . . . . . . . . . . . . . . . . . . . . . . . . . . . . . . . . . . . . . . 13
Figure 8: Debt Capacity . . . . . . . . . . . . . . . . . . . . . . . . . . . . . . . . . . . . . . . . . . . . . . . . . . . . . . . . . . . . . . . . . . 14
Figure 9: Capital Purchases . . . . . . . . . . . . . . . . . . . . . . . . . . . . . . . . . . . . . . . . . . . . . . . . . . . . . . . . . . . . . . . 16
Figure 10: Cash Sources and Use Statement . . . . . . . . . . . . . . . . . . . . . . . . . . . . . . . . . . . . . . . . . . . . . . . . . . . 17
Figure 11: Change in Financial Position . . . . . . . . . . . . . . . . . . . . . . . . . . . . . . . . . . . . . . . . . . . . . . . . . . . . . 18
Figure 12: Range of 2015 Profits . . . . . . . . . . . . . . . . . . . . . . . . . . . . . . . . . . . . . . . . . . . . . . . . . . . . . . . . . . . 19
Figure 13: Cost of Producing Milk by Profit Groups . . . . . . . . . . . . . . . . . . . . . . . . . . . . . . . . . . . . . . . . . . . . 20
Figure 14A: Profit vs. Milk Sold per Cow . . . . . . . . . . . . . . . . . . . . . . . . . . . . . . . . . . . . . . . . . . . . . . . . . . . . 20
Figure 14B: Profit vs. NCOP . . . . . . . . . . . . . . . . . . . . . . . . . . . . . . . . . . . . . . . . . . . . . . . . . . . . . . . . . . . . . . 21
Figure 15: Winning Management Styles of Top 25% . . . . . . . . . . . . . . . . . . . . . . . . . . . . . . . . . . . . . . . . . . . . 22
Figure 16: Farm Size and Profitability . . . . . . . . . . . . . . . . . . . . . . . . . . . . . . . . . . . . . . . . . . . . . . . . . . . . . . . 23

NORTHE AST DA IRY FAR M SU MMARY | 2015
1
INTRODUCTION
The purpose of Farm Credit’s annual Dairy Farm Summary (DFS) is to assess the financial health and progress of dairy farm businesses within an eight-state area of the Northeast – New England, New York, and New Jersey. It is intended to provide dairy producers, Farm Credit personnel, Northeast public policymakers and dairy industry leaders with a better understanding of the current status and future prospects of the Northeast’s largest farm industry.
As a major regional summary of actual dairy farm business results, the Dairy Farm Summary is a unique annual project within the U.S. dairy industry. It is the result of cooperation and hard work by many people. We are grateful, first and foremost, to the 487 dairy producers who allowed their financial and production records to be used in this study. Further, we appreciate the teamwork and timeliness of Farm Credit East and Yankee Farm Credit staff who helped customers provide that information. This report contains five years of financial data for dairy farms in Connecticut, Maine, Massachusetts, New Hampshire, New Jersey, New York and Vermont4. The majority of the farms in this study are from New York.
We believe this sample of 487 farm operations represents a solid cross section of better-than-average Northeast dairy farm businesses, most of which maintain loan relationships with Farm Credit. All farms included in the study received the majority of their income from milk sales, but many farms have additional business income, such as custom work, maple sugaring or crop sales. We have purposely not excluded these farms from the sample (unless such income comprises a majority of farm income) as we feel it reflects the diversity of Northeast dairying, where many producers have supplementary income streams to increase earnings.
Where such activity constitutes a separate enterprise from the main dairy farming activity, and both revenue and expenses can be broken out, the net return is included in Nonfarm income. If the expenses of this ancillary activity cannot be separated from the dairy farming expenses, such revenue is included in Other Farm Income. Thus, the total farm income represented in this report often includes some return from these affiliated business ventures, over and above the income generated from the dairy enterprise alone.
Partnerships and corporations were adjusted to a sole proprietor basis for consistency. Farms with unusual events, such as a large expansion, a major herd-health problem, an inheritance, significant unexplained gains or losses (>10 percent of total assets) or other types of business anomalies, were excluded from the sample. Each farm’s data was carefully reviewed to ensure both cash flow and net worth reconciled to within a limited margin of error. This approach ensures a high level of integrity for the financial results presented in the 2015 Dairy Farm Summary.
The DFS tends to focus discussion on the “average farm.” And while there is no single farm which is exactly “average,” focusing on the average allows us to highlight changes of Northeast dairy farms over time. While the use of averages leads to an effective discussion with respect to change and overall industry trends, it tends to minimize both the best and worst conditions experienced by farms within the sample.
This is again true in a year such as 2015. While the “average farm” had $14 per cow in net household earnings in 2015, nearly half the farms in our sample had negative net farm income, while a handful earned more than $1,000 per cow. Focusing on average results belies the fact that many producers, of all sizes, still struggle to make a profit in this challenging industry. For this reason, we also look at the data within individual herd-size groups and within the top and bottom profitability groups.
4 No farm data was submitted from Rhode Island.

2015 | NORTHE AST DA IRY FAR M SU MMARY
2
CHANGES TO THE DAIRY FARM SUMMARY
This year’s dairy farm summary includes farms within both Farm Credit East and Yankee Farm Credit’s loan servicing areas. The 2014 data referenced in this report has been restated from the 2014 DFS to include Vermont farms.
In the tables, the term “Net Earnings” has been changed to “Net Household Earnings” to better reflect that this figure includes family living and non-farm income.

NORTHE AST DA IRY FAR M SU MMARY | 2015
3
Figure 1
DAIRY FARM PROFITABILITYNet Household
Earnings Per Cow1Return
on Assets2Return
on Equity3
2011 $797 8.4% 10.7%
2012 $415 4.7% 5.0%
2013 $490 4.8% 5.3%
2014 $1,169 10.0% 13.5%
2015 $14 0.8% 1.4%
3-Year Average $558 5.2% 6.7%
5-Year Average $577 5.7% 7.2%1Net household earnings includes non-farm income.2Return on assets = (net household earnings + interest) / average total assets3Return on equity = (net household earnings + interest) / average net worth
Figure 2
NET HOUSEHOLD EARNINGS PER COW 1979-2015
$0
1979
1981
1983
1985
1987
1989
1991
1993
1995
1997
1999
2001
2003
2005
2007
2009
2011
2013
2015
$1,200
$1,400
$1,000
$800
$600
$400
$200
$-200
$-400
$-600
Actual
Real1
1Real price is actual price adjusted for inflation

2015 | NORTHE AST DA IRY FAR M SU MMARY
4
Analysis of 2015A CHALLENGING YEAR
In 2014, average profitability set a DFS record in both actual and inflation-adjusted terms, but what a difference a year makes. Even by October of 2014, milk prices had peaked and begun a steep decline. By the end of 2014, the U.S. All-Milk price had fallen by more than $5 from its September peak and continued to decline and remain well below 2014 levels throughout 2015.
Average net household earnings fell by 99 percent to only $14 per cow. Subtracting non-farm income from this figure yields a loss of $30 per cow. This brings the three-year household earnings average to $558 per cow. Many producers were able to cut expenses significantly, which helped avoid or reduce losses. Several expense line items declined, including feed costs, fuel, crop input and repairs and maintenance.
Income was down primarily due to falling milk prices. Milk price received declined by $7.34 per cwt. to an average of $18.24. Net cost of production decreased as well by $2.48 per cwt. to $18.36, still higher than the price received for milk. Thus, the only reason for the average net positive return of $14 per cow was the addition of non-milk and non-farm income.
2015 was the least profitable year since the $386 loss per cow in 2009. In the 36-year history of the DFS, 2015 ranks 29th in terms of profitability.
This summary uses three primary measures of profitability, each of which provides a useful perspective on dairy farm financial performance:
› Net household earnings per cow measures sheer dollars of profit earned relative to the size of the operation and includes all sources of income, including non-farm sources.
› Return on assets (ROA) measures profit earned relative to the present market value of total farm assets. This indicates the earning power of each dollar invested in the farming operation, regardless of whether it comes from the farm operator or was borrowed from a lender.
› Return on equity (ROE) measures profit earned relative to the farmer’s equity investment in the operation. This measure is the best indicator of how the dairy producer’s investment is paying off compared to how it might pay off if invested another way.
We have often observed that a single year does not provide an accurate picture of the industry’s long-term operating performance, and that is certainly still true. To further illustrate, when ranked, five of the last ten years account for both the top three years for profitability in the DFS history and also the bottom two. Given these extremes, multi-year averages create a more accurate picture of the industry. If we look at both a shorter- and longer-term average, we see similar results (Figure 2A). Continued year-to-year volatility confirms the challenges and opportunities that Northeast dairy producers face. Unfortunately after a very difficult 2015, dairy farmers continue to face weak prices in 2016.

NORTHE AST DA IRY FAR M SU MMARY | 2015
5
Figure 2A
COMPARISON OF MULTIYEAR AVERAGES
Three-Year Average
Five-Year Average
Ten-Year Average
Net Earnings per Cow $558 $577 $412
Return on Assets 5.2% 5.7% 4.9%
Return on Equity 6.7% 7.2% 5.4%
It is important to differentiate net earnings (profit) from cash flow. Farm businesses rely on cash flow to pay ongoing bills, but cash flow is not an accurate measure of profitability. Net earnings are an accrual measure of profit, which represents a farm business’s ability to provide an economic return for the operator’s investment and management. It offers the most complete picture of a farm’s profitability by adjusting cash farm income and expenses to reflect changes in inventories, accounts receivable, accounts payable and prepaid expenses. The difference is particularly notable in a year such as 2015, when many producers relied on savings and prepaid expenses to make ends meet on a cash basis, while incurring losses on an accrual basis.
MILK PRICE DECLINES
The average farm milk price at $18.24 per cwt. was nearly 30 percent less than 2014’s $25.58. It was $3.04 below the five-year average of $21.28/cwt. (Figure 3A). In terms of actual (nominal dollars, not adjusted for inflation) milk prices, 2015 ranked 7th in the 35 years of the DFS. However, to better understand the true story of how milk prices have changed over time, we must account for the impact of inflation (Figure 3B). In terms of “real,” inflation-adjusted rankings, 2015 drops to 30th. The first year of the DFS, 1979, ranks first.

2015 | NORTHE AST DA IRY FAR M SU MMARY
6
Figure 3A
FARM MILK PRICES PER CWT.
Figure 3B
FARM MILK PRICES PER CWT.
1979
1981
1983
1989
1985
1987
1991
1993
1995
1997
1999
2001
2003
2005
2007
2009
2013
2015
$35.00
$30.00
$25.00
$20.00
$15.00
$10.00
$5.00
$0.00
2011
Real1
Actual
1993
1995
1997
1999
2001
2003
2005
2007
2009
2011
2013
2015
$24.00
$22.00
$20.00
$18.00
$14.00
$12.00
$10.00
$16.00
$26.00
$28.00
Actual
5-Year Rolling Average
1Real = actual price adjusted for inflation, 2015 dollars.

NORTHE AST DA IRY FAR M SU MMARY | 2015
7
The Federal Milk Marketing Order One statistical uniform price began 2015 at $17.57/cwt (Boston blend). The price then declined to $16.40 in March before recovering to $18.32 in November. The price fell again in December, to end the year at $17.27. The average Boston blend price for 2015 was $17.14. Several factors have contributed to increased milk price volatility in recent years. Changes in export markets and domestic demand as well as shifts in supply affect prices. Increased global market activity has quickened the pace by which production is required to adjust, further contributing to price volatility. Investment decisions should include an analysis of management’s ability to cope with price and earnings volatility.
COST OF PRODUCTION DECLINES DUE TO BELT-TIGHTENING
The net cost of production (NCOP) declined from 2014’s record high of $20.84 per cwt., falling by 12 percent to $18.36. Three key figures to review for 2015’s cost of production analysis of the average dairy farm in the DFS include:
› Cash operating expenses were $20.00 per cwt., 10.2 percent lower than 2014.
› Total costs, including depreciation and family living, were $22.13 per cwt., down $2.37.
› After subtracting non-milk income, NCOP was $18.36 per cwt., $2.48 below the previous year.
› An increase in non-milk income in 2015 contributed to the decrease in NCOP5.
Figure 4A
COST OF PRODUCING MILK - ACCRUAL BASIS
2011 2012 2013 2014 2015
Feed $6.79 $7.61 $7.75 $7.99 $7.12
Labor 2.97 3.11 3.09 3.34 3.27
Interest 0.52 0.50 0.49 0.48 0.47
Freight & Trucking 0.87 0.95 0.95 0.95 0.97
Crop 1.28 1.54 1.61 1.64 1.40
Other Expenses 6.87 6.78 6.74 7.86 6.77
Adjusted Cash Operating Expenses $19.29 $20.49 $20.63 $22.26 $20.00
+ Depreciation 1.33 1.34 1.43 1.49 1.44
+ Family Living 0.69 0.64 0.76 0.75 0.69
Total Costs $21.31 $22.47 $22.82 $24.50 $22.13
- Non-Milk Income* 3.21 4.24 3.59 3.66 3.77
Net Cost of Production** $18.10 $18.23 $19.23 $20.84 $18.36
*Non-milk income includes cattle, crop and other income adjusted for inventory changes.**Before any return on equity. Each 1 percent return on equity would be equivalent to another $0.40 added to the NCOP for 2015.5Nonfarm income is not factored into NCOP.

2015 | NORTHE AST DA IRY FAR M SU MMARY
8
Given the sharply reduced milk prices in 2015, Northeast dairy producers engaged in significant cost cutting. This was helped by declines in feed commodities and energy costs. Producers spent an average of 8.6 percent less on feed per cow in 2015 than they did the prior year. They also realized significant savings in fuel costs, spending an average of 35.7 percent less per cow in 2015.
Other categories with decreases include repairs, supplies and crop inputs. Some of this was driven by falling prices of certain inputs, such as fuel, while other declines were driven by producers’ attempts to spend less and economize given their reduced income. Presumably Northeast dairy producers utilized some of their 2014 profits to catch up on deferred maintenance that they had put off in prior years as well as make some improvements to facilities, as repair expenses increased to $421 per cow in 2014 after averaging $285 for the previous five years. While repairs declined to $350 per cow in 2015, this level is still considerably higher than the five year average.
Figure 4B
SPECIFIC COST CATEGORIES 2014 2015 Percent Change per Cow per Cwt. per Cow per Cwt. per Cow per Cwt.
Feed $1,897 $7.99 $1,733 $7.12 -8.6% -10.9%
Labor $791 $3.34 $797 $3.27 0.8% -2.1%
Fuel $258 $1.08 $166 $0.68 -35.7% -37.0%
Supplies $295 $1.25 $287 $1.18 -2.7% -5.6%
Rent $107 $0.45 $110 $0.45 2.8% 0.0%
Repairs $410 $1.73 $350 $1.43 -14.6% -17.3%
Crop Inputs $388 $1.64 $339 $1.40 -12.6% -14.6%
Other Expenses $1,487 $6.27 $1,444 $5.91 -2.9% -5.7%
Analysts differ in their opinions as to how to calculate Net Cost of Production (NCOP) and what should be included. The formula used in the DFS for calculating NCOP is as follows:
[Cash Operating Expenses (with accrual adjustments made for pre-pays, accounts payable, etc) + Calculated Depreciation6 + Family Living Expense] - Non-Milk Farm Income7= Net Cost of Production.
It is important to note that the $18.36 average NCOP includes no return on the producer’s equity investment. While it may be debatable what an appropriate return on equity (ROE) might be, earning some level of return should be a business objective. For the average DFS producer in 2015, each one percent return on equity is equivalent to an additional $0.40 per cwt. If we were to include a six percent ROE goal, for example, this would be equivalent to a $20.76 net cost of production. In 2015, the actual milk price was far below that goal, and producers realized only an average 1.4 percent ROE.
6For the DFS, all farms have their submitted depreciation restated by applying a standard percentage of straight-line depreciation to various asset classes in order to be able to compare consistent numbers from year to year and avoid variations driven by accounting and changes in tax laws.7Non-milk income includes cattle, crop and other income adjusted for inventory changes.

NORTHE AST DA IRY FAR M SU MMARY | 2015
9
Figure 4C compares NCOP between New York and New England in 2015. New York producers typically have an advantage in lower costs and higher production per cow over producers in New England. Additionally, with the ability to grow more feed, New York farms generally have higher crop sales and are able to grow more grain. However, Connecticut, Maine and Massachusetts have state support programs for dairy farmers, which help supplement farm income. Income from these support programs is included under “Government Payments” in the tables in the back of the report, and reduces their NCOP. Even taking support programs into account, New York farms’ NCOP was still $1.12 per cwt. lower than New England farms.
Figure 4C
NCOP BY REGION 2015
Cost per CWT. New York New England
Feed $6.94 $7.53
Labor 3.23 3.40
Interest 0.50 0.43
Freight & Trucking 0.96 0.99
Crop Inputs 1.44 1.31
Other Expenses 6.80 6.75
Adjusted Cash Operating Expenses $19.87 $20.41
+ Depreciation 1.39 1.56
+ Family Living 0.68 0.70
Total Costs $21.95 $22.67
- Non-milk Income 3.80 3.40
Net Cost of Production $18.15 $ 19.27

2015 | NORTHE AST DA IRY FAR M SU MMARY
10
Figure 4D shows NCOP by herd size. Generally, larger herds have an advantage in spreading costs over more units, driving per-unit costs down. Smaller herds have lower labor costs and higher non-milk income per unit; however, family living and other costs are usually higher, when expressed on a per-unit basis. Some of the herds with fewer than 100 cows were among the most profitable in the study due to their low labor costs, even when family living expenses are accounted for. This may understate the true value of the family labor put into the farm, but on paper, several of them showed healthy net returns.
Figure 4D
NCOP BY HERD SIZE
Cost per CWT. < 100 Cows 122 farms
100-299 Cows180 farms
300-699 Cows 107 farms
700+ Cows 78 farms
Feed $6.55 $6.74 $6.96 $7.32
Labor 1.85 3.05 3.35 3.38
Interest 0.64 0.52 0.44 0.46
Freight & Trucking 1.05 1.02 0.93 0.97
Crop Inputs 1.78 1.52 1.43 1.31
Other Expenses 8.05 7.00 6.58 6.71
Adjusted Cash Operating Expenses $19.93 $19.85 $19.69 $20.15
+ Depreciation 2.63 1.95 1.40 1.22
+ Family Living 2.66 1.45 0.68 0.33
Total Costs $25.21 $23.25 $21.77 $21.70
- Non-Milk Income* 6.23 3.66 3.54 3.31
Net Cost of Production $18.99 $19.59 $18.22 $18.39 *Non-milk income includes cattle, crop and other income adjusted for inventory changes.
In an industry noted for volatile milk prices, the ability to control expenditures, improve efficiency and adjust to changing input costs is critical to a dairy producer’s financial performance.
HERD SIZE CHANGES
The farms that participate in the Dairy Farm Summary change slightly from year-to-year. The average number of cows per farm typically hovers between 300 and 400 milking head in the DFS, even as average farm size has increased in the region. The DFS average increased from 348 head in 2014 to 374 in 2015.
As shown in Figure 5A, the largest size group remains responsible for the greatest percentage of milk production, and that percentage is increasing.

NORTHE AST DA IRY FAR M SU MMARY | 2015
11
Figure 5A
FARM SIZE AND MILK PRODUCTION
99 Cows or Fewer 100-299 Cows 300-699 Cows
700 Cows or More
Number of Farms 122 180 107 78Volume of Milk Produced1 3.7% 15.8% 28.4% 52.1%
1 As a percent of all farms in the 2015 DFS
Figure 5B illustrates the relationship between labor productivity, cow productivity and overall dairy farm profitability. As more cows are handled per worker, milk sold per worker increases. Milk sold per worker and per cow are closely correlated. More milk per cow is favorable in terms of greater productivity and total production and also drives gross revenue, a key factor in profitability.
While milk sold per cow correlates positively with adjusted net earnings per cow, more important is a low NCOP, which is enhanced by better labor efficiency. Figure 5B also shows increasing labor and family living expenses as milk sold per worker increases. Farms with higher labor efficiency tend to have a lower cost per cwt. for labor and family living. For example, those farms selling less than 500,000 pounds of milk per worker have the lowest average combined labor and family living expense per person at $20,580, but on a per cwt. basis, their cost is $5.18 per cwt. In contrast, those selling 1.4 million or more pounds of milk per person have a lower labor and family living cost, or $3.31 per cwt. despite paying more than 2.6 times more per person. Thus the efficiency gained also allows for greater flexibility with respect to employee compensation and family living draws. Note that while adjusted net earnings per cow generally trends higher with increased labor productivity, there are some inconsistencies from one group to the next, such as between the 700,000+ pounds category and the 800,000+ category, indicating that labor productivity is only one factor in determining overall profitability.
Figure 5B
LABOR PRODUCTIVITY INFLUENCES PROFITS
Pounds of Milk Sold per Worker
Percent of Farms
Number of Cows
Cows per Worker
Milk Sold per Cow
Avg. Labor & Family Living Per Person1
Adjusted Net Earnings Per Cow2
499,000 or less 9% 69 22 17,757 $20,580 $-204
500,000-599,000 6% 96 29 18,850 $23,834 $-252
600,000-699,000 9% 120 32 20,334 $30,275 $-244
700,000-799,000 9% 162 36 20,803 $32,765 $-27
800,000-899,000 10% 253 36 22,725 $36,550 $-82
900,000-999,000 10% 318 39 23,876 $41,201 $98
1 to 1.09 million 9% 535 42 24,101 $42,184 $-30
1.1 to 1.19 million 8% 629 47 23,633 $42,314 $20
1.2 to 1.39 million 14% 597 52 24,219 $48,978 $85
1.4 million or more 14% 648 67 24,675 $54,489 $120
1 Includes operator and other family labor2 Net earnings per cow less net nonfarm income

2015 | NORTHE AST DA IRY FAR M SU MMARY
12
When viewed on a per cow, or per cwt. basis, larger farms are able to spread costs and investments over more units. For example, the 99 cows or fewer group produced almost 50 percent less milk per worker than the average of all farms and had 83 percent more investment per cwt. sold ($97 versus $53). Return on assets was poor for all groups, though the 700 or more cows group had the highest return on assets.
Figure 6
CAPITAL EFFICIENCYHerd Size
(No. of Cows)Pounds Sold Per Worker
Pounds Sold Per Cow
Total Assets Per Cwt. Sold1
Asset Turnover (Years)2
Return on Assets3
99 or Fewer 583,449 19,957 $97 0.25 0.8%
100 to 299 933,327 22,225 $71 0.31 -0.6%
300 to 699 1,159,492 24,423 $53 0.40 0.4%
700 or More 1,292,340 25,482 $46 0.47 1.5%
All Farms 1,134,300 24,366 $53 0.41 0.8%1 Total assets / cwt. of milk sold2 Total assets / cash receipts = number of years3 Return on assets = (net earnings + interest) / average farm assets

NORTHE AST DA IRY FAR M SU MMARY | 2015
13
CASH FLOW WEAKENS
Cash flow is another measure of financial health for a dairy operation or any business. Each business has a minimum cash requirement to meet its ongoing commitments, such as operating costs, overhead, debt principal payments and family living. What remains can be used for capital investment, to build liquidity or to invest in a retirement fund. Cash margin declined in 2015 to a deficit of $0.08 per cwt., down from +$4.87 in 2014 (Figure 7). This is the lowest cash margin since 2009’s deficit of $2.22 per cwt.
Figure 7
CASH FLOW ANALYSIS PER CWT.2011 2012 2013 2014 2015
Actual Milk Price $21.53 $19.74 $21.30 $25.58 $18.24
Cash Required $21.36 $22.09 $22.77 $24.25 $22.14
- Other Income 3.26 3.91 3.57 3.54 3.81
Breakeven Milk Price $18.10 $18.18 $19.19 $20.71 $18.32
Cash Margin $3.43 $1.56 $2.11 $4.87 $-0.08Cash Margin Definitions
Total cash operating expenses Cattle sales+ Family living expense and income tax + Capital sales+ Scheduled principal payments + Crop sales + Other farm & non-farm income
= Cash required = Other income
Figure 7 shows cash margins that the average dairy farm in the summary has experienced since 2011. Cash margins have exhibited substantial volatility during this time. Due to the substantial inflation of farm costs in recent years, the breakeven milk price has increased significantly from approximately $14 per cwt., which was common prior to 2007. Milk prices have also increased, on average, in recent years, setting new records in 2011 and 2014. In 2015, the milk price received declined sharply, while the breakeven milk price fell by a lesser amount, resulting in a deficit.
Given the high level of volatility in the dairy industry, making a financial decision based on a single year’s performance would be dangerous. Figure 7 further illustrates this point: Cash margins in 2011 and 2014 were very strong, while margins in 2012, 2013 and 2015 were much lower.
This level of variability makes financial management more challenging, stressing the importance of a long-range view of cash flow. Timing of major capital expenditures, managing debt load, building liquidity for the tight years and adjusting family withdrawals are all means of managing volatility. Some producers have adopted risk management strategies involving both input costs and milk prices using a combination of crop insurance-type government programs as well as hedging strategies.

2015 | NORTHE AST DA IRY FAR M SU MMARY
14
CAPITAL DEBT EXCEEDS DEBT CAPACITY
Debt capacity measures the maximum amount of capital debt a farmer could repay from cash generated from the farm business and nonfarm sources. It is determined primarily by cash flow and, to a lesser extent, by interest rates. Reserve debt capacity is the difference between debt capacity and the actual amount of capital debt invested in the business. It is a buffer against financial adversity which could occur within the business, such as herd health problems or crop failure, or from the marketplace, such as low milk prices or high feed costs. It represents the amount by which capital debt can be increased above existing levels and still be repaid from that year’s cash flow. In 2015, weak farm earnings provided inadequate cash flow to service all financial obligations for many DFS farms, requiring some to take on additional debt (Figure 8). No additional reserve debt capacity remained in 2015 for the average DFS farm.
Figure 8
DEBT CAPACITY
2011 2012 2013 2014 2015
Average Farm Credit Interest Rate1
Commercial (Intermediate Term) 4.1% 4.0% 4.0% 4.0% 4.0%
Real Estate (Long Term) 4.5% 4.4% 4.3% 4.3% 4.3%
Debt Capacity (per Cow) $8,074 $5,322 $6,108 $11,384 $3,361
- Capital Debt 2,939 3,080 3,104 3,109 3,390
RESERVE DEBT CAPACITY (per Cow) $5,135 $2,242 $3,004 $8,275 $-29
3-Year Average Reserve Debt Capacity2 $1,119 $3,007 $3,460 $4,507 $3,750
5-Year Average Reserve Debt Capacity2 $2,118 $1,549 $1,721 $4,060 $3,725
Debt Payments as Percent of Milk Sales 11% 13% 12% 7% 13%
1 Average interest rates for outstanding debt with Farm Credit, excluding benefit of patronage dividends.2 Averages include pre-2011 data.
The current debt capacity is substantially impacted by historically low interest rates, which continued during 2015. In planning for the future, it is important not to be lulled into thinking that today’s low interest rates will last indefinitely. The Federal Reserve has already begun to increase short-term rates and this will impact debt service requirements and capacity for those producers who have variable rate debt. If the average producer had to repay today’s debt at 2007

NORTHE AST DA IRY FAR M SU MMARY | 2015
15
interest rates (7.7 percent and 7.6 percent), it would reduce both debt capacity and reserve debt capacity by about $1,500 per cow, a major change in repayment capacity.
Figure 8 shows the five-year average for reserve debt capacity. In 2015, it was $3,725 per cow, a high level heavily influenced by 2014’s remarkable profitability. “Never borrow your last dollar during a good year” is time-tested financial wisdom in the farming community. The implication is that a prudent borrower preserves significant liquidity in terms of unused borrowing capacity to fall back on during years of low income or other adversity. The spending restraint showed by many producers in 2014 will help them cope during this extended downturn in milk prices.
Figure 8 shows Northeast dairy farmers and their Farm Credit lenders have taken this advice to heart during the post-2000 period in terms of maintaining a healthy level of reserve debt capacity. During 2009, when Northeast dairy farmers had little cash flow capacity to repay debt, farmers and their lenders were better positioned to get through this difficult year than in other parts of the country where both farmers and lenders struggled. The lessons learned from that downturn influenced producers to use 2014 profits to shore up their financial position going into 2015. This year, 2016, brings greater concern as the low milk price environment continues, while farmers have largely exhausted their cash reserves.
In today’s increasingly volatile dairy business climate, liquidity is a critical factor to achieve long-term business viability and financial flexibility to deal with tough years. Whether cash in a savings account, prepaid expenses, inventories that can be quickly turned into cash or substantial unused capacity on one’s line of credit, strong liquidity is critical to dairy business success. It remains to be seen when the dairy industry’s fortunes will recover. In the meantime, managing liquidity and cash flow during an extended downturn will be critical for survival.

2015 | NORTHE AST DA IRY FAR M SU MMARY
16
PRODUCERS TRIM CAPITAL PURCHASES
Northeast dairy farmers’ capital spending reverted to close to the five-year average in 2015 (Figure 9). The majority of capital purchases were for replacement machinery and equipment, with some buildings and land expansion. Total capital purchases per farm were $304,062, just above the five-year average of $287,697. While the average capital purchases were $813 per cow, it should be noted that this represents expansion investments (some of which were planned in 2014) by some more profitable farms, and substantially lower spending by others.
In addition to reduced capital purchases, Northeast producers also cut back on annual repairs and maintenance expense in 2015 compared to 2014.
Figure 9
CAPITAL PURCHASES Per Farm Per Cow % of Total Assets1
2011 $246,890 $757 5.6%
2012 $265,825 $775 7.1%
2013 $256,095 $813 6.5%
2014 $365,612 $1,066 7.9%
2015 $304,062 $813 6.2%
3-Year Average $308,590 $897 6.9%
5-Year Average $287,697 $845 6.7%
1 Capital purchases as a percent of total assets show an approximate rate of reinvestment in the farm enterprise.

NORTHE AST DA IRY FAR M SU MMARY | 2015
17
Figure 10 shows a cash flow statement on a per-cow basis for the average Northeast dairy producer in the study. It includes sources and use of cash for the business, including what was available to cover capital purchases.
Figure 10
CASH SOURCES AND USE STATEMENT
2011 2012 2013 2014 2015
Sources Dollars per Cow
Net Farm Income1 $916 $613 $617 $1,555 $449
Net Nonfarm Income 41 44 57 45 42
Sale of Capital Assets 50 58 59 50 67
Paid-in Capital2 18 42 33 33 40
Money Borrowed 329 589 703 66 847
TOTAL SOURCES $1,354 $,346 $1,469 $1,749 $1,445
Uses
Family Living $160 $150 $180 $178 $166
Capital Purchases 778 775 813 1,089 813
Debt Principal Payments 416 421 476 482 466
TOTAL USES $1,354 $1,346 $1,469 $1,749 $1,445
Percent Capital Purchases Financed3 42% 76% 86% 6% 104%
1 Cash basis – No accrual adjustment to expenses2 Includes savings withdrawn, gifts, inheritances, grants, debt forgiven, and other extraordinary income 3 Money borrowed / capital purchases
Total sources of cash fell by $304 in 2015 to $1,445 per cow. Net cash farm income fell by more than 70 percent from 2014, to $449 per cow. This required producers to finance capital purchases (and some operating expenses) by taking on additional debt. Producers were generally able to meet loan servicing requirements during the year, but many sought additional financing or extended trade credit, so net debt per cow increased.
BALANCE SHEETS WEAKEN
Net worth, or owner’s equity, measures the wealth of the farm business owner. It is measured at each year’s end in the DFS in order to accurately compare changes. Net worth is an indicator of the ability of the business to absorb financial losses and to collateralize additional borrowing. It is also a measure of the amount of money that could be redeployed toward other endeavors if the business were liquidated.

2015 | NORTHE AST DA IRY FAR M SU MMARY
18
The average DFS dairy farmer’s net worth in 2015 declined by $813 to $9,397 per cow from $10,210 in 2014. Percent net worth also decreased to 72 percent (Figure 11). Nonetheless, solvency remains solid for the average DFS farm, meaning that the average DFS participant would have more than enough farm assets to liquidate, in order to satisfy all farm debts, selling fees and resulting income tax liability and leave a cash surplus.
Figure 11
CHANGE IN FINANCIAL POSITIONChange in NW
per CowPercent Net
Worth1CurrentRatio2
QuickRatio3
AssetTurnover4
2011 $1,087 72% 2.8 1.2 0.52
2012 $-367 72% 2.8 1.2 0.52
2013 $1,351 73% 2.8 1.2 0.48
2014 $1,048 75% 3.5 1.6 0.53
2015 $-813 72% 2.8 1.1 0.50
1 Percent net worth = Owner’s net worth / total assets2 Current ratio = Current assets / current liabilities3 Quick ratio = Current assets - inventory / current liabilities4 Asset turnover = Value of farm production / average total assets
There is an important distinction between growth in net worth resulting from earnings versus market revaluation. Net earnings are the result of profits from dairy farming. Market revaluation generally occurs in farm real estate and cattle, while machinery and equipment ordinarily depreciate.
In 2014 livestock values increased significantly to $2,397 per milking head (Table A-3). This was reflective of both the high milk price environment as well as high beef prices. Given that both milk and beef prices fell in 2015, livestock values declined as well to $2,372 per cow. The average DFS farm raises a relatively large amount of replacement heifers as reflected in youngstock as a percent of cows.
Liquidity is the ability of the farm operator to convert short-term assets (current assets) to cash to meet short-term obligations (current liabilities) as they become due. Its importance cannot be overstated in a volatile industry, such as dairy. Current and quick ratios are two measures of liquidity. In 2015, the average dairy farm had a current ratio of 2.8, reverting to the mean of years prior to 2014 (Figure 11). Savings from 2014, a high level of prepaid expenses, and sufficient feed inventories relative to current liabilities helped maintain this ratio.
However, since inventory on a dairy farm is primarily feed for onfarm use and not intended to be directly converted into cash to pay bills, subtracting inventory from the current ratio produces the quick ratio and provides a closer look at a dairy farm’s true liquidity situation. The quick ratio of 1.1 at the end of the year demonstrates that the average farm maintained sufficient current assets to meet financial obligations. This indicates that producers had, on average, 110 percent of the value of short-term liabilities available in cash or assets that could be quickly converted to cash.
Finally, asset turnover is commonly used to measure the efficiency of total capital invested in the business by determining gross revenue dollars generated for every dollar invested. The higher the asset turnover ratio, the more efficiently the

NORTHE AST DA IRY FAR M SU MMARY | 2015
19
investment is working for the business. Thus greater asset turnover should translate into a higher return on assets (ROA). In 2015, asset turnover for the average Northeast dairy business was 0.50, down from prior years. This was largely a result of the decrease in milk prices. This means $0.50 of gross revenue was generated for every $1 invested in assets.
NET MARGIN DIFFERENCES REMAIN SIGNIFICANT IN 2015
We again saw a wide range of profits around the $14 per cow average in 2015. Many farms had negative net income, while a few posted more than a $1,000 profit per cow. Figure 12 demonstrates the range of profitability between the top, bottom and all farms profit groups. Farms in the summary are ranked by profit margin and divided into four quartiles.
Figure 12
RANGE OF 2015 PROFITS Bottom 25% All Farms Top 25%
Number of Farms 121 487 122
Average Number of Cows 340 374 366
Milk Sold per Cow (lbs.) 23,866 24,366 25,068
Milk Sold per Worker (lbs.) 1,030,140 1,134,300 1,230,631
Net Earnings
Per Farm $-83,300 $5,236 $106,506
Per Cow $-245 $14 $291
Per Cwt. $-1.03 $0.06 $1.16
Return on Assets1 -0.9% 0.8% 2.5%
Return on Equity1 -1.0% 1.4% 3.3%1 ROA and ROE calculations do not include asset appreciation.
There was a $536 difference in net earnings per cow between the top and bottom quartile groups. This is less than 2014’s difference, which stood at $993. Similarly, on a per cwt. basis, the top farms posted $2.19 more in net earnings than the least profitable farms with earnings of $1.16/cwt., while the bottom group lost $1.03 per cwt. Several management factors contribute to this disparity. Also shown in Figure 12 are two productivity measures: Milk Sold per Worker and Milk Sold per Cow. The Top 25 percent group sold 5 percent more milk per cow and 19 percent more milk per worker than the Bottom 25 percent, which contributes to the disparity in the bottom line.
Interestingly, the average herd size of the top profit quartile was lower than that of the group overall. Some of the most profitable farms on a per cow basis were found at both the high and low end of herd sizes. The large herd dairy farms were able to capitalize on economies of scale, while some of the small herd farms were able to keep a tight rein on expenses and utilize family labor. When combined together, the result was a lower average herd size. The group that had the lowest profitability was not the small farm group, but those between 100 and 299 cows.
2015 | NORTHE AST DA IRY FAR M SU MMARY
20
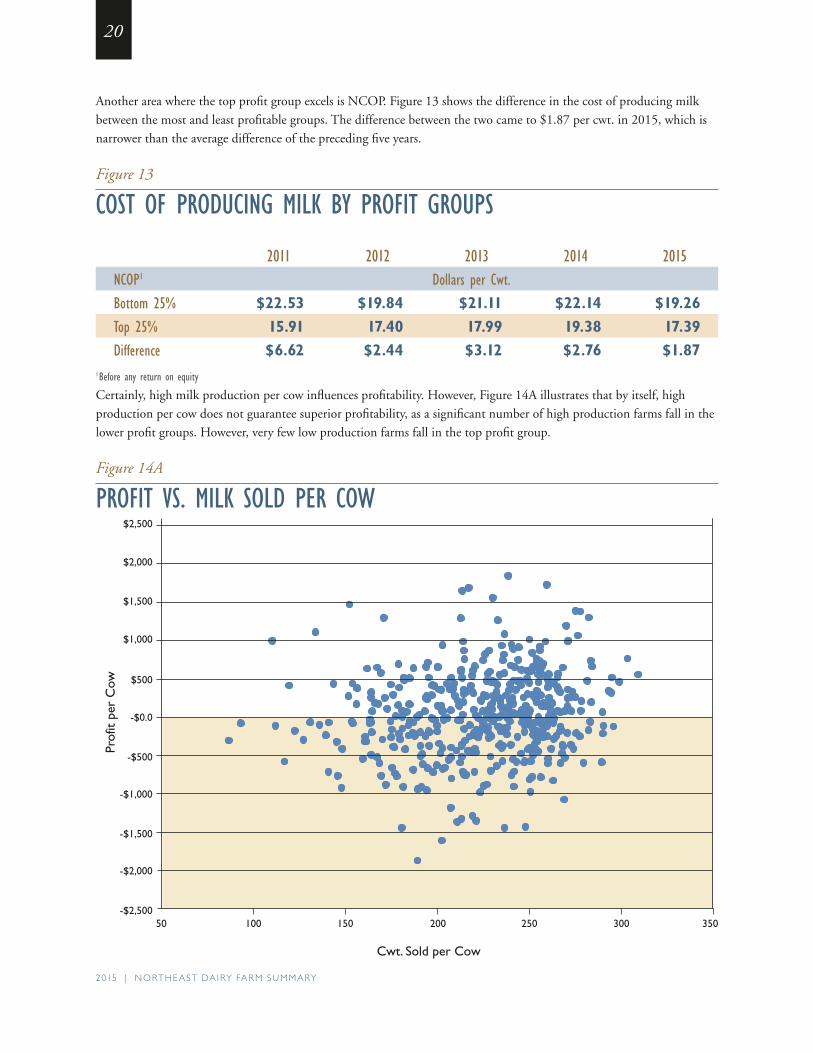
Another area where the top profit group excels is NCOP. Figure 13 shows the difference in the cost of producing milk between the most and least profitable groups. The difference between the two came to $1.87 per cwt. in 2015, which is narrower than the average difference of the preceding five years.
Figure 13
COST OF PRODUCING MILK BY PROFIT GROUPS
2011 2012 2013 2014 2015NCOP1 Dollars per Cwt.
Bottom 25% $22.53 $19.84 $21.11 $22.14 $19.26
Top 25% 15.91 17.40 17.99 19.38 17.39
Difference $6.62 $2.44 $3.12 $2.76 $1.871 Before any return on equity Certainly, high milk production per cow influences profitability. However, Figure 14A illustrates that by itself, high production per cow does not guarantee superior profitability, as a significant number of high production farms fall in the lower profit groups. However, very few low production farms fall in the top profit group.
Figure 14A
PROFIT VS. MILK SOLD PER COW
-$0.0
-$500
-$1,000
-$1,500
-$2,000
-$2,500
$500
$1,000
50
Cwt. Sold per Cow
350300250200150100
$2,500
$2,000
$1,500
Prof
it pe
r C
ow

NORTHE AST DA IRY FAR M SU MMARY | 2015
21
The importance of balancing production with total costs to achieve profitability is much more obvious (Figure 14B). As NCOP decreases, the possibility of higher profits increases on nearly a straight line. Cost control, production ability, buying savvy and labor management are the main factors determining the cost of production.
Figure 14B
PROFIT VS. NCOP
MANAGEMENT STYLE AND DAIRY PROFITS
Above average management is critical to profits, but “above average” can encompass a range of styles. Successful managers have been able to identify and leverage their individual management strengths on which to build a profitable dairy business. In short, these managers have developed a management strategy that fits their personalities and resources.
-$10.00
-$15.00
-$5.00
$0.00
$5.00
NCOP per Cwt.
$35.00$30.00$25.00$20.00$15.00$10.00
$15.00
$10.00
$5.00
Prof
it pe
r C
wt.

2015 | NORTHE AST DA IRY FAR M SU MMARY
22
Figure 15
WINNING MANAGEMENT STYLES OF THE TOP 25% Great
with Cows Labor
Efficient Better
Milk Price Tight With a Buck Balanced
Number of Farms 25 41 12 32 12
Average Number of Cows 357 651 291 174 131
Milk Sold per Cow (lbs.) 27,279 25,725 21,493 22,773 20,773
Milk Sold per Worker (lbs.) 1,100,671 1,655,962 920,056 1,031,607 889,471
NCOP Per Cwt. $17.05 $17.22 $18.60 $16.52 $17.64
Milk Price per Cwt. $18.12 $18.02 $19.80 $18.35 $18.29
Net Earnings per Cow $291 $205 $258 $417 $135
Net Earnings per Cwt. $1.07 $0.80 $1.20 $1.83 $0.65
Return on Assets (%) 2.8% 2.3% 2.5% 3.1% 1.4%
Percent Net Worth (%) 78% 76% 86% 79% 69%
Of the 122 farms included in 2015 top profit quartile, 110 exhibited distinct management styles, while the remaining 12 farms displayed a more balanced approach, doing well in all areas, without any single area standing out. Figure 15 breaks down these styles of farms excelling in the corresponding management factor. For example, farms included in the Great-with-Cows group outperformed all others in producing the most milk per cow.
Great with Cows. These farmers likely spend more time and money on cow productivity. Average milk sold of 27,279 pounds per cow is the highest among the five styles. High production allowed them to produce and sell 1.1 million pounds of milk per worker, second only to the Labor Efficient group.
Labor Efficient. Effective labor management, highly productive cows and the largest herd size enabled this group to be the most labor efficient, with milk sold per worker of more than 1.6 million pounds. In addition to labor efficiency, this group reported the second highest milk sold per cow. This management style typically gains labor efficiencies from economies of scale and high output per cow.
Better Milk Price. This group received $19.80 per cwt. for their milk, $1.45 more than average for the top profit group. Higher milk prices could be the result of high milk fat or protein content, negotiated premiums for quality and/or specialty markets. This category likely contains some non-Holstein herds.
Tight With A Buck. These operators excel at cost control, achieving the lowest cost of production at $16.52 per cwt. Although milk per cow and milk per worker are below the top profit group average, these farmers have implemented tight cost control to achieve superior results. Some of these farms also have significant non-milk business income, which influences NCOP. The rewards of managing costs are easily seen in the highest earnings per cow and per cwt.
Balanced. These are good, all-around managers performing well in all areas. Although profits are less than some of the other styles, these farms tend to be smaller than the other top profit farms and are able to respond quickly to adversity affecting their businesses. This management style is well suited to smaller farms where family members provide much of the production labor.
NORTHE AST DA IRY FAR M SU MMARY | 2015
23
The common theme is that top-profit farmers have reached a profitable balance between milk production per cow and costs through a variety of management styles.
DO LARGER FARMS HAVE THE EDGE ON PROFITABILITY?
Average farm sizes in the Northeast and across the country have continually increased for many decades. The DFS has illustrated that to some extent all size farms can be profitable. However, there are strong correlations in the data regarding size of farm, efficiency, pounds of milk sold per cow, cost of production and, ultimately, profitability.
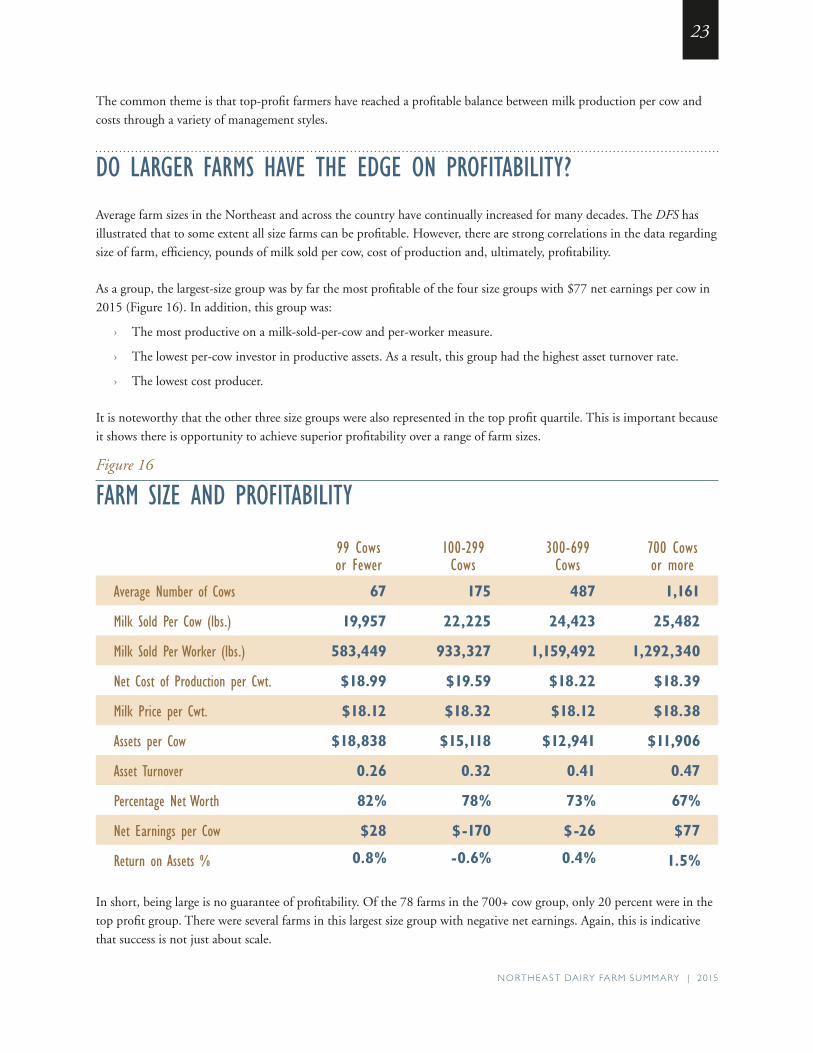
As a group, the largest-size group was by far the most profitable of the four size groups with $77 net earnings per cow in 2015 (Figure 16). In addition, this group was:
› The most productive on a milk-sold-per-cow and per-worker measure.
› The lowest per-cow investor in productive assets. As a result, this group had the highest asset turnover rate.
› The lowest cost producer.
It is noteworthy that the other three size groups were also represented in the top profit quartile. This is important because it shows there is opportunity to achieve superior profitability over a range of farm sizes.
Figure 16
FARM SIZE AND PROFITABILITY
99 Cows or Fewer
100-299 Cows
300-699 Cows
700 Cows or more
Average Number of Cows 67 175 487 1,161
Milk Sold Per Cow (lbs.) 19,957 22,225 24,423 25,482
Milk Sold Per Worker (lbs.) 583,449 933,327 1,159,492 1,292,340
Net Cost of Production per Cwt. $18.99 $19.59 $18.22 $18.39
Milk Price per Cwt. $18.12 $18.32 $18.12 $18.38
Assets per Cow $18,838 $15,118 $12,941 $11,906
Asset Turnover 0.26 0.32 0.41 0.47
Percentage Net Worth 82% 78% 73% 67%
Net Earnings per Cow $28 $-170 $-26 $77
Return on Assets % 0.8% -0.6% 0.4% 1.5%
In short, being large is no guarantee of profitability. Of the 78 farms in the 700+ cow group, only 20 percent were in the top profit group. There were several farms in this largest size group with negative net earnings. Again, this is indicative that success is not just about scale.

2015 | NORTHE AST DA IRY FAR M SU MMARY
24
CONCLUSIONFollowing 2014, which was a year for the record books, 2015 was a difficult year for Northeast producers. Milk prices fell sharply, and while some costs decreased as well, it was not nearly enough to preserve profitability for a number of the region’s dairy farmers.
Thankfully, in general, most producers appear to have utilized the bulk of their 2014 profits to shore up their finances, and came into 2015 in good financial shape. While capital purchases and repairs rose significantly, family living draw remained flat on a per cow basis in 2014 and many farms entered 2015 with significant prepaid expenses and on average had not financed capital purchases with additional debt. This forward-looking strategy helped save some producers from financial crisis as incomes fell.
What is more worrisome is what happens in 2016. At this writing in April 2016, the wholesale milk price has fallen an additional $2.40 from its level in December 2015. While some recovery is expected in the second half of 2016, it is projected to be modest, and 2017 remains uncertain. The actual profitability of 2016 may not be much below that of 2015, however producers began 2015 in better financial position, while in 2016 many are beginning the year in an already-stressed position. It is likely that significantly more pain will be felt across the countryside this year than in 2015.
Many producers are reevaluating the USDA Dairy Margin Protection Program (MPP), as well as other risk management strategies like LGM-Dairy, crop insurance and futures hedging. Many were disappointed that the MPP program made few payouts in 2015, as despite the depressed milk prices, the Income-Over-Feed-Cost margin (IOFC) remained close to $8.00 per cwt most of the time. Sign-ups for the second year of the program were significantly lower than for 2015.
The greatest risk management tool however, remains smart management and cost control. By investing in property, livestock and equipment in 2014, Northeast producers entered the current downturn better prepared than they were in 2009, and milk prices have not fallen as precipitously as they did then. What is different this time, is the apparent duration of the downturn. Some analysts argue that in fact, this is not a downturn at all, but rather a reversion to the mean of marginal profitability for the dairy industry, and that producers need to retool their business models to survive in a low-margin environment. Only time will tell.
Overall, the Northeast Dairy Farm Summary shows us that there are multiple paths to success in the dairy business. Strategies are as different as the individual characteristics of farms within this study. Positioning your farm for success will be crucial to meeting the challenges of today and tomorrow. This summary presented various proven management strategies that have consistently resulted in above-average performance. Working closely with your Farm Credit loan officer and/or business consultant to assess your strengths and weaknesses and develop a strategy to position your farm to meet industry challenges is now more critical than ever.
If you are interested in improving your profitability, the DFS is only the beginning. Farm Credit’s Success Strategies Dairy Benchmarks delves much deeper into not only farm financial data, but a host of production and herd management metrics as well. Membership includes a personalized profit assessment of your farm. For more on this program, a joint project between Farm Credit East, Yankee Farm Credit, AgChoice Farm Credit and the Pennsylvania Farm Bureau/MSC – Business Services, contact a representative of one of those partner organizations to learn more.
We hope that this year’s Northeast Dairy Farm Summary is a useful tool for managing your farm and business. It remains essential that dairy farmers and those who serve them continue to seek answers in order to have a healthy, economically sustainable Northeast dairy industry. The entire Farm Credit team of loan officers, farm accounting professionals and business consultants are eager and prepared to help Northeast dairy farmers achieve financial success. On behalf of our entire team, thank you for your participation.

NORTHE AST DA IRY FAR M SU MMARY | 2015
25
FINANCIAL RECORDS
The following 17 tables present the detailed financial data on which this summary was based. These tables are organized into four sets:
› Tables A-1 through A-5 are COMPARISONS BETWEEN YEARS
› Tables B-1 through B-3 are DATA BY HERD SIZES
› Tables C-1 through C-6 are DATA BY PROFIT GROUPS
› Tables D-1 through D-3 are DATA BY REGIONS
Each set includes a condensed earnings worksheet, a balance sheet summary and a page of evaluation factors. The 2011-to-2015 data series includes farms in Connecticut, Maine, Massachusetts, New Hampshire, New Jersey, New York and Vermont8.
Please note the following cautions to properly use this data:
› Cattle purchased for replacements are considered operating expenses, but cattle purchased for expansion are capital purchases. The accrual adjustment change in the inventory of raised livestock is calculated by subtracting purchases for expansion from the total increase in cattle inventory value.
› Depreciation for all farms was restated by applying a standard percentage of depreciation to various asset classes in order to compare consistent numbers from year-to-year and avoid variations driven by accounting and changes in tax laws.
› Incorporated farms were adjusted to sole proprietor status, and owner draw was recorded as Family Living Expense. If there was more than one owner, the largest draw was recorded as Family Living, and other owner salaries were recorded under Hired Labor.
› Appreciation and revaluation of capital assets do not appear in the earnings statements. They are, however, included on the balance sheets.
› Current liabilities on the balance sheet include both current debts as well as the current portion of intermediate-term and long-term liabilities.
› Government payments include MPP and state program payments, but do not include significant one-time grants, which are accounted for as paid-in capital. Crop insurance indemnities are recorded as Crop Revenue.
› Supply expenses include rBST costs, if used.
Your Farm Credit team of ag finance specialists encourages you to review the following financial data thoughtfully and thoroughly. It allows you to identify your strengths and weaknesses and to improve your operation for the future.
For further information, please contact your local Farm Credit office.
8 No farm data was submitted from Rhode Island. 2014 Data has been restated from last year’s report to include Vermont farms.

2015 | NORTHE AST DA IRY FAR M SU MMARY
26
TABLE A-1.
COMPARISON BETWEEN YEARS – EARNINGS WORKSHEET 2011 2012 2013 2014 2015Number of Farms 532 504 517 474 487Average Number of Cows 326 343 315 348 374Receipts Milk Sales $1,631,221 $1,594,407 $ 1,600,058 $ 2,111,261 $ 1,662,185 Cattle Sales 86,137 112,841 96,009 136,337 197,941 Crop Sales 65,395 98,865 52,877 67,552 44,799Government Payments1 28,185 12,112 27,947 Other 65,441 88,846 54,794 51,003 51,745CASH RECEIPTS $1,848,194 $1,894,959 $1,831,923 $2,378,265 $1,984,617
Accrual Adjustments + Change in Inventory-Raised Livestock $12,927 $22,814 $19,198 $34,838 $21,523VALUE OF FARM PRODUCTION (a) $1,861,121 $1,917,773 $1,851,121 $2,413,103 $2,006,140
COST OF GOODS SOLD Chemicals & Sprays $17,202 $18,266 $18,525 $23,467 $18,632 Custom Hire 48,485 50,175 48,814 59,086 67,315 Purchased Feed 514,478 606,162 582,279 660,022 648,148 Fertilizer & Lime 48,540 63,550 61,429 61,748 61,829 Freight & Trucking (Marketing) 65,960 75,749 71,550 78,300 88,766 Gasoline, Fuel & Oil 81,067 86,746 78,925 89,719 62,094 Hired Labor 224,937 247,698 232,019 275,440 298,246 Seed & Plants 30,883 40,965 40,896 49,750 46,404 Supplies 82,408 96,904 83,997 102,636 107,466 Veterinary, Medicine & Breeding 63,570 66,622 62,360 75,495 76,649 Cow Replacements 4,063 3,848 4,121 15,747 1,611Total Cost of Goods Sold $1,181,593 $1,356,685 $1,284,915 $1,491,410 $1,477,160Gross Margin $679,528 $561,088 $566,206 $921,693 $528,980
OVERHEAD Insurance 19,944 20,196 19,464 24,516 26,756 Interest 39,733 40,140 37,049 39,477 43,080 Rent 26,920 27,910 29,358 37,327 41,130 Repairs 103,965 104,147 104,372 142,733 130,927 Property & Misc. Taxes 19,533 21,464 22,402 24,899 25,680 Utilities 35,328 35,014 35,256 43,726 42,831 Other 34,968 27,262 17,310 32,991 35,610Accrual Adjustments + Depreciation 100,598 106,684 107,267 123,144 131,249Total Overhead Expenses $380,989 $382,817 $372,478 $468,813 $477,263Total Farm Production Costs (b) $1,562,582 $1,739,502 $1,657,393 $1,960,223 $1,954,423 NET FARM EARNINGS (a) - (b) $298,539 $178,271 $193,728 $452,880 $51,717 + Net Nonfarm Income 13,437 14,924 17,799 15,660 16,289 - Family Living & Income Taxes 52,147 51,371 56,837 61,785 62,711NET HOUSEHOLD EARNINGS $259,829 $141,824 $154,690 $406,755 $5,295
Note: Expenses are adjusted for changes in accounts payable, prepaid expenses, and supply inventories to remove the effects of tax planning and reflect only 1 year’s expenses.
1Prior to 2013, government payments have been included in “other”

NORTHE AST DA IRY FAR M SU MMARY | 2015
27
TABLE A-2.
COMPARISON BETWEEN YEARS – EARNINGS WORKSHEET PER CWT. 2011 2012 2013 2014 2015Number of Farms 532 504 517 474 487Average Number of Cows 326 343 315 348 374
Receipts DOLLARS PER CWT. OF MILK Milk Sales $ 21.53 $ 20.01 $ 21.30 $ 25.58 $ 18.24 Cattle Sales 1.14 1.42 1.28 1.66 2.17 Crop Sales 0.86 1.24 0.70 0.81 0.49 Government Payments 0.38 0.15 0.31 Other 0.86 1.11 0.73 0.61 0.56 CASH RECEIPTS $ 24.39 $ 23.78 $ 24.39 $ 28.81 $ 21.77
Accrual Adjustments + Change in Inventory-Raised Livestock $ 0.17 $ 0.29 $ 0.26 $ 0.43 $ 0.24VALUE OF FARM PRODUCTION (a) $ 24.56 $ 24.07 $ 24.64 $ 29.24 $ 22.01
COST OF GOODS SOLD Chemicals & Sprays $ 0.23 $ 0.23 $ 0.25 $ 0.29 $ 0.21 Custom Hire 0.64 0.63 0.65 0.71 0.74 Purchased Feed 6.79 7.61 7.75 7.99 7.12 Fertilizer & Lime 0.64 0.80 0.82 0.75 0.68 Freight & Trucking (Marketing) 0.87 0.95 0.95 0.95 0.97 Gasoline, Fuel & Oil 1.07 1.09 1.05 1.08 0.68 Hired Labor 2.97 3.11 3.09 3.34 3.27 Seed & Plants 0.41 0.51 0.54 0.60 0.51 Supplies 1.09 1.21 1.12 1.25 1.18 Veterinary, Medicine & Breeding 0.84 0.84 0.83 0.91 0.84 Cow Replacements 0.05 0.05 0.05 0.19 0.03 Total Cost of Goods Sold $15.60 $17.03 $17.10 $18.06 $16.23Gross Margin $8.96 $7.04 $7.54 $11.18 $5.78
OVERHEAD Insurance 0.26 0.25 0.26 0.29 0.29 Interest 0.52 0.50 0.49 0.48 0.47 Rent 0.36 0.35 0.39 0.45 0.45 Repairs 1.37 1.31 1.39 1.73 1.43 Property & Misc. Taxes 0.26 0.27 0.30 0.31 0.28 Utilities 0.47 0.44 0.47 0.53 0.47 Other 0.46 0.34 0.23 0.41 0.38 Accrual Adjustments + Depreciation 1.33 1.34 1.43 1.49 1.44Total Overhead Expenses $5.03 $4.80 $4.96 $5.69 $5.21Total Farm Production Costs (b) $20.63 $21.83 $22.06 $23.75 $21.44
NET FARM EARNINGS (a) - (b) $ 3.93 $ 2.24 $ 2.58 $ 5.49 $ 0.57 + Net Nonfarm Income 0.18 0.18 0.24 0.19 0.18 - Family Living & Income Taxes 0.69 0.60 0.76 0.75 0.69NET HOUSEHOLD EARNINGS $ 3.42 $ 1.82 $ 2.06 $ 4.93 $ 0.06
Note: Expenses adjusted for changes in accounts payable, prepaid expenses and supply inventories to remove the effects of tax planning and reflect only one year’s expenses.

2015 | NORTHE AST DA IRY FAR M SU MMARY
28
TABLE A-3.
COMPARISON BETWEEN YEARS – BALANCE SHEET SUMMARY DECEMBER 31 2011 2012 2013 2014 2015Number of Farms 532 504 517 474 487Average Number of Cows 326 343 315 348 374
Assets DOLLARS PER FARM Livestock $752,107 $788,849 $720,116 $834,062 $887,198 Feed & Crops 328,481 394,507 356,717 418,949 434,736 Machinery & Equipment 662,191 699,551 725,365 846,834 857,528 Farm–Land & Buildings 1,422,083 1,696,332 1,675,190 1,852,583 1,974,315 All Other 532,822 472,771 474,546 767,829 737,271TOTAL ASSETS $3,697,684 $4,052,010 $3,951,934 $4,720,257 $4,891,048
TOTAL LIABILITIES $1,032,076 $1,156,617 $1,066,046 $1,167,218 $1,376,593
TOTAL NET WORTH $2,665,608 $2,895,393 $2,885,888 $3,553,039 $3,514,455
Assets DOLLARS PER COW Livestock $2,307 $2,300 $2,286 $2,397 $2,372 Feed & Crops 1,008 1,150 1,132 1,204 $1,162 Machinery & Equipment 2,031 2,040 2,303 2,433 $2,293 Farm-Land & Buildings 4,362 4,946 5,141 5,324 $5,279 All Other 1,634 1,378 1,684 2,206 $1,971TOTAL ASSETS $11,342 $11,813 $12,546 $13,564 $13,078
TOTAL LIABILITIES $3,164 $3,372 $3,384 $3,354 $3,681
TOTAL NET WORTH $8,178 $8,441 $9,162 $10,210 $9,397
Assets DOLLARS PER CWT. OF MILK Livestock $9.93 $9.90 $9.59 10.02 10.09 Feed & Crops 4.33 4.95 4.75 5.03 4.95 Machinery & Equipment 8.74 8.78 9.66 10.17 9.76 Farm–Land & Buildings 18.77 21.29 22.30 22.25 22.46 All Other 7.03 5.93 6.32 9.22 8.39TOTAL ASSETS $48.80 $50.85 $52.61 $56.69 $55.65
TOTAL LIABILITIES $13.62 $14.51 $14.19 $14.02 $15.66
TOTAL NET WORTH $35.18 $36.34 $38.42 $42.67 $39.99
PERCENT NET WORTH 72% 72% 73% 75% 72%

NORTHE AST DA IRY FAR M SU MMARY | 2015
29
TABLE A-4.
COMPARISON BETWEEN YEARS – EVALUATION FACTORS 2011 2012 2013 2014 2015Number of Farms 532 513 517 474 487 Average Number of Cows 326 339 315 348 374
Worker Equivalents 7.0 7.2 6.8 7.5 8.1Cows Per Worker 47 47 46 46 47Pounds of Milk Sold Per Worker 1,085,617 1,115,785 1,097,288 1,102,149 1,134,300
Pounds of Milk Sold 7,577,606 8,078,285 7,512,009 8,255,565 9,142,456Pounds of Milk Sold Per Cow 23,244 23,552 23,848 23,759 24,365Milk Price Per Cwt. $21.53 $19.74 $21.30 $25.58 $18.24
Total Crop Acres 769 822 766 819 825Crop Acres Per Cow 2.4 2.4 2.4 2.4 2.2
Feed Cost Per Cow $1,578 $1,767 $1,849 $1,897 $1,733Feed as a Percent of Milk Sales 32% 38% 36% 31% 39%Feed & Crop Expense Per Cow* $1,875 $2,123 $2,233 $2,287 $2,072Feed & Crop Expense Per Cwt. $8.07 $9.01 $9.36 $9.63 $8.51
Machinery Costs Per Cow** $869 $1,016 $910 $1,039 $898Machinery Costs Per Cwt. $3.74 $4.31 $3.82 $4.37 $3.69
Labor & Family Living Per Cow $849 $863 $917 $965 $958Labor & Family Living Per Cwt. $3.65 $3.66 $3.85 $4.06 $3.93
Assets Per Cow $11,342 $11,408 $12,546 $13,564 $13,078Debt Per Cow $3,164 $3,136 $3,384 $3,354 $3,681
Net Worth Per Cow $8,178 $8,272 $9,162 $10,210 $9,397
Percent Net Worth 72% 72% 73% 75% 72%
*Feed & Crop Expense = Feed + Seed & Plants + Fertilizer + Chemicals & Spray. **Machinery Costs = Machinery Repairs + Fuel & Oil + Custom Hire + Machinery & Equipment Depreciation.

2015 | NORTHE AST DA IRY FAR M SU MMARY
30
TABLE A-5.
COMPARISON BETWEEN YEARS – TREND ANALYSISADJUSTED FINANCIAL CONDITION AS OF DECEMBER 31 2011 2012 2013 2014 2015Current Assets $576,196 $586,106 $621,951 $807,176 $745,987 Intermediate Assets 1,582,712 1,589,227 1,642,957 1,917,597 1,998,014 Fixed Assets 1,538,776 1,568,586 1,687,026 1,995,484 2,147,047 TOTAL ASSETS $3,697,684 $3,743,919 $3,951,934 $4,720,257 $4,891,048Change (+ or -) from Prior Years $506,564 $46,235 $208,015 $768,323 $170,791
Current Liabilities $209,387 $207,872 $219,220 $233,547 $271,247Intermediate Liabilities 426,589 439,020 430,905 464,711 544,019Long-Term Liabilities 396,100 417,587 415,921 468,959 561,327TOTAL LIABILITIES $1,032,076 $1,064,479 $1,066,046 $1,167,217 $1,376,593Change (+ or -) from Prior Years $10,938 $32,403 $1,567 $101,171 $209,376
NET WORTH $2,665,608 $2,679,440 $2,885,888 $3,553,040 $3,514,455Change (+ or -) from Prior Years $495,626 $13,832 $206,448 $667,152 -$38,585
% Net Worth 72% 72% 73% 75% 72%
I & E Farm (Cash Basis) 2011 2012 2013 2014 2015Sales - Milk $1,631,221 $1,594,407 $1,600,058 $2,111,261 $1,662,185Sales - Livestock 86,137 112,841 96,009 136,337 197,941Other Farm Income 130,836 187,711 135,856 130,667 124,491TOTAL FARM INCOME $1,848,194 $1,894,959 $1,831,923 $2,378,265 $1,984,617
FARM CASH EXPENSES $1,461,984 $1,632,818 $1,550,126 $1,837,079 $1,823,174
NET CASH FARM INCOME $386,210 $262,141 $281,797 $541,186 $161,443ADD: Interest $39,733 $40,140 $37,049 $39,477 $43,080TOTAL AVAILABLE - Farm $425,943 $302,281 $318,846 $580,663 $204,523
ADD: Net Nonfarm Income $13,437 $31,690 $17,799 $15,660 $16,289 Sale Capital Assets $16,436 $25,406 $14,251 $14,489 $25,033TOTAL FUNDS AVAILABLE (a) $455,816 $359,377 $350,896 $610,812 $245,845
Family Living + Income Taxes $52,147 $51,371 $56,837 $61,785 $62,711Debt Service Requirement $175,259 $183,882 $180,421 $204,112 $219,747TOTAL FUNDS REQUIRED (b) $227,406 $235,253 $237,258 $265,897 $282,458
EXCESS (DEFICIT) (a – b) $228,410 $124,124 $113,638 $344,915 -$36,613

NORTHE AST DA IRY FAR M SU MMARY | 2015
31
TABLE B-1.
2015 DATA BY HERD SIZE – EARNINGS WORKSHEET HERD SIZE 99 COWS 100-299 300-699 700 COWS ALL OR FEWER COWS COWS OR MORE FARMSNumber of Farms 122 180 107 78 487Average Number of Cows 67 175 487 1,161 374
Receipts DOLLARS PER COWMilk Sales $3,628 $4,075 $4,390 $4,660 $4,444 Cattle Sales 709 515 494 512 529Crop Sales 213 86 122 118 120 Government Payments 53 81 92 64 75Other 249 123 116 149 138CASH RECEIPTS $4,852 $4,880 $5,214 $5,503 $5,306
Accrual Adjustments + Change in Inventory-Raised Livestock $19 $8 $41 $91 $58VALUE OF FARM PRODUCTION (a) $4,871 $4,888 $5,255 $5,594 $5,364
COST OF GOODS SOLD Chemicals & Sprays $54 $43 $49 $52 $50 Custom Hire 88 140 170 206 180 Purchased Feed 1,307 1,498 1,699 1,865 1,733 Fertilizer & Lime 172 168 178 158 165 Freight & Trucking (Marketing) 210 226 228 247 237 Gasoline, Fuel & Oil 178 177 169 159 166 Hired Labor 370 678 818 862 797 Seed & Plants 130 127 122 123 124 Supplies 278 285 290 286 287 Veterinary, Medicine & Breeding 155 180 202 219 205 Cow Replacements 30 12 5 0 4Total Cost of Goods Sold $2,972 $3,534 $3,930 $4,177 $3,948Gross Margin $1,899 $1,354 $1,325 $1,417 $1,416OVERHEAD Insurance 83 81 75 65 72 Interest 128 115 108 117 115 Rent 63 93 104 124 110 Repairs 346 298 318 385 350 Property & Misc. Taxes 123 84 73 55 69 Utilities 137 116 112 114 115 Other 125 90 89 98 96
Accrual Adjustments + Depreciation 525 433 342 312 351Total Overhead Expenses $1,530 $1,310 $1,221 $1,270 $1,278Total Farm Production Costs (b) $4,502 $4,844 $5,151 $5,447 $5,226
NET FARM EARNINGS (a) - (b) $369 $44 $104 $147 $138 + Net Nonfarm Income 189 109 35 13 44 - Family Living & Income Taxes 530 323 165 83 168NET HOUSEHOLD EARNINGS $28 $-170 $-26 $77 $14
Note: Expenses adjusted for changes in accounts payable, prepaid expenses, and supply inventories to remove the effects of tax planning and reflect only one year’s expenses.
2015 | NORTHE AST DA IRY FAR M SU MMARY
32
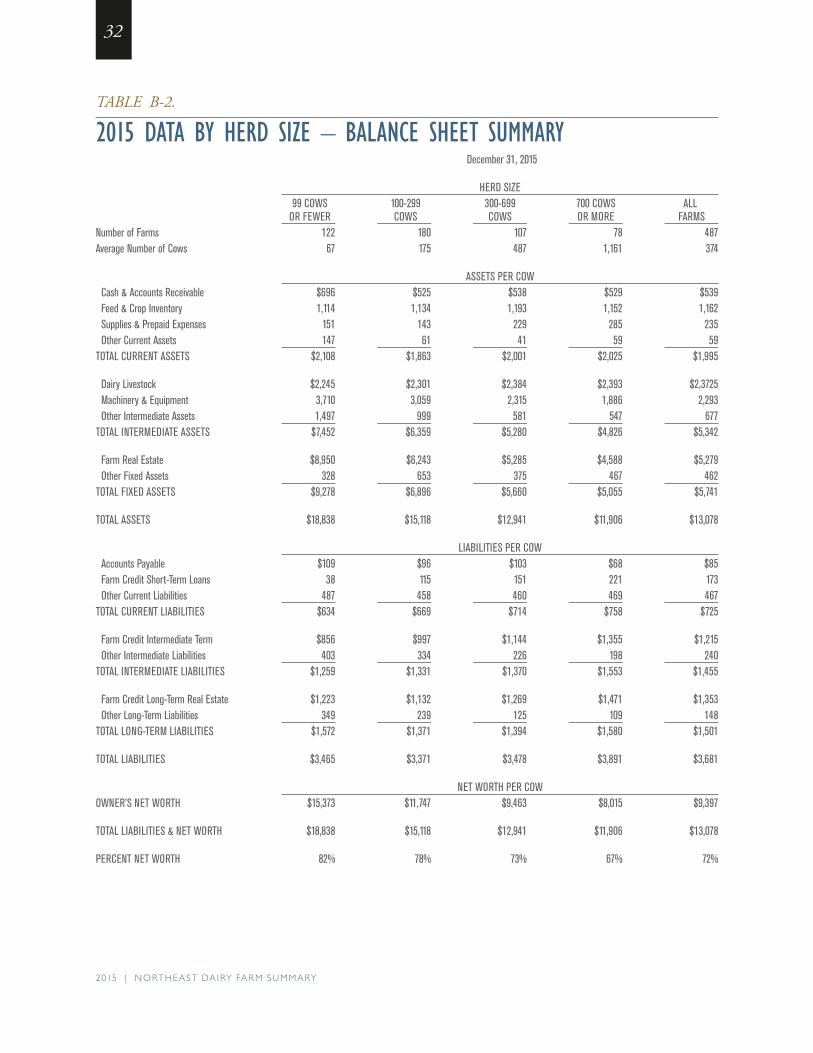
TABLE B-2.
2015 DATA BY HERD SIZE – BALANCE SHEET SUMMARYDecember 31, 2015
HERD SIZE 99 COWS 100-299 300-699 700 COWS ALL OR FEWER COWS COWS OR MORE FARMSNumber of Farms 122 180 107 78 487Average Number of Cows 67 175 487 1,161 374
ASSETS PER COW Cash & Accounts Receivable $696 $525 $538 $529 $539 Feed & Crop Inventory 1,114 1,134 1,193 1,152 1,162 Supplies & Prepaid Expenses 151 143 229 285 235 Other Current Assets 147 61 41 59 59TOTAL CURRENT ASSETS $2,108 $1,863 $2,001 $2,025 $1,995
Dairy Livestock $2,245 $2,301 $2,384 $2,393 $2,3725 Machinery & Equipment 3,710 3,059 2,315 1,886 2,293 Other Intermediate Assets 1,497 999 581 547 677TOTAL INTERMEDIATE ASSETS $7,452 $6,359 $5,280 $4,826 $5,342
Farm Real Estate $8,950 $6,243 $5,285 $4,588 $5,279 Other Fixed Assets 328 653 375 467 462TOTAL FIXED ASSETS $9,278 $6,896 $5,660 $5,055 $5,741
TOTAL ASSETS $18,838 $15,118 $12,941 $11,906 $13,078
LIABILITIES PER COW Accounts Payable $109 $96 $103 $68 $85 Farm Credit Short-Term Loans 38 115 151 221 173 Other Current Liabilities 487 458 460 469 467TOTAL CURRENT LIABILITIES $634 $669 $714 $758 $725
Farm Credit Intermediate Term $856 $997 $1,144 $1,355 $1,215 Other Intermediate Liabilities 403 334 226 198 240TOTAL INTERMEDIATE LIABILITIES $1,259 $1,331 $1,370 $1,553 $1,455
Farm Credit Long-Term Real Estate $1,223 $1,132 $1,269 $1,471 $1,353 Other Long-Term Liabilities 349 239 125 109 148TOTAL LONG-TERM LIABILITIES $1,572 $1,371 $1,394 $1,580 $1,501
TOTAL LIABILITIES $3,465 $3,371 $3,478 $3,891 $3,681
NET WORTH PER COWOWNER’S NET WORTH $15,373 $11,747 $9,463 $8,015 $9,397
TOTAL LIABILITIES & NET WORTH $18,838 $15,118 $12,941 $11,906 $13,078
PERCENT NET WORTH 82% 78% 73% 67% 72%

NORTHE AST DA IRY FAR M SU MMARY | 2015
33
TABLE B-3.
2015 DATA BY HERD SIZE – EVALUATION FACTORS HERD SIZE 99 COWS 100-299 300-699 700 COWS ALL OR FEWER COWS COWS OR MORE FARMSNumber of Farms 122 180 107 78 487Average Number of Cows 67 175 487 1,161 374
Worker Equivalents 2.3 4.2 10.3 23.1 8.0Cows Per Worker 29 42 48 51 47
Pounds of Milk Sold Per Worker 583,449 933,327 1,159,492 1,292,340 1,134,300Pounds of Milk Sold Per Farm 1,341,608 3,886,502 11,797,655 29,632,494 9,111,895Pounds of Milk Sold Per Cow 19,957 22,225 24,423 25,482 24,366Milk Price Per Cwt. $18.12 $18.32 $18.12 $18.38 $18.24
Total Crop Acres 249 492 1,088 2,138 826Crop Acres Per Cow 3.7 2.8 2.2 1.8 2.2Crop Acres Per Worker 108 118 107 94 103
Feed Cost Per Cow $1,307 $1,498 $1,699 $1,865 $1,733Feed Cost Per Cwt. $6.55 $6.74 $6.96 $7.32 $7.11Feed as a Percent of Milk Sales 36% 37% 38% 40% 39%Feed & Crop Expense Per Cow1 1,665 1,836 2,048 2,196 2,073Feed & Crop Expense Per Cwt. $8.34 $8.26 $8.39 $8.62 $8.51
Machinery Cost Per Cow2 $989 $917 $867 $900 $897Machinery Costs Per Cwt. $4.96 $4.13 $3.55 $3.53 $3.68
Labor & Family Living Per Cow $851 $991 $973 $941 $958Labor & Family Living Per Cwt. $4.26 $4.46 $3.98 $3.69 $3.93
Assets Per Cow $18,839 $15,118 $12,940 $11,905 $13,078Debt Per Cow $3,464 $3,371 $3,478 $3,891 $3,681Net Worth Per Cow $15,375 $11,747 $9,462 $8,014 $9,397
Percent Return on Assets3 0.8% -0.6% 0.4% 1.5% 0.8%Percent Return on Equity4 1.2% -0.5% 0.9% 2.5% 1.4%
1Feed & Crop Expense = Feed + Seed & Plants + Fertilizer + Chemicals & Sprays.2Machinery Cost = Machinery Repairs + Custom Hire + Fuel & Oil + Machinery & Equipment Depreciation.3Return on Assets = (Net Earnings + Interest) / Average Farm Assets.4Return on Equity = (Net Earnings + Interest) / Average Farm Net Worth.

2015 | NORTHE AST DA IRY FAR M SU MMARY
34
TABLE C-1.
2015 DATA BY PROFIT GROUPS – EARNINGS WORKSHEET PROFIT GROUP BOTTOM THIRD SECOND TOP ALL 25% 25% 25% 25% FARMSNumber of Farms 121 122 122 122 487Average Number of Cows 340 379 413 366 374
Receipts DOLLARS PER COW Milk Sales $4,285 $4,320 $4,524 $4,599 $4,444 Cattle Sales 649 485 482 527 529 Crop Sales 137 130 67 150 120 Government Payments 37 88 82 61 75 Other 162 120 145 155 138CASH RECEIPTS $5,270 $5,143 $5,300 $5,492 $5,306
Accrual Adjustments + Change in Inventory-Raised Livestock $72 $40 $85 $43 $58VALUE OF FARM PRODUCTION (a) $5,342 $5,183 $5,385 $5,535 $5,364
COST OF GOODS SOLD Chemicals & Sprays $42 $41 $48 $68 $50 Custom Hire 187 204 168 152 180 Purchased Feed 1,783 1,696 1,710 1,740 1,733 Fertilizer & Lime 179 174 165 140 165 Freight & Trucking (Marketing) 229 218 262 238 237 Gasoline, Fuel & Oil 189 167 160 153 166 Hired Labor 831 802 818 737 797 Seed & Plants 135 121 124 119 124 Supplies 329 287 274 260 287 Veterinary, Medicine & Breeding 216 207 207 191 205 Cow Replacements 4 3 3 18 4Total Cost of Goods Sold $4,124 $3,920 $3,939 $3,816 $3,948Gross Margin $1,218 $1,263 $1,446 $1,719 $1,416OVERHEAD Insurance 90 68 64 67 72 Interest 126 125 122 88 115 Rent 125 107 111 97 110 Repairs 369 354 346 340 350 Property & Misc. Taxes 76 64 60 76 69 Utilities 125 110 111 112 115 Other 97 104 104 80 96
Accrual Adjustments + Depreciation 364 326 316 411 351Total Overhead Expenses $1,372 $1,258 $1,234 $1,271 $1,278Total Farm Production Costs (b) $5,496 $5,178 $5,173 $5,087 $5,226
NET FARM EARNINGS (a) - (b) $-154 $5 $212 $448 $138 + Net Nonfarm Income 67 28 31 51 44 - Family Living & Income Taxes 158 163 151 208 168NET HOUSEHOLD EARNINGS $-245 $-130 $92 $291 $14
Note: Expenses adjusted for changes in accounts payable, prepaid expenses and supply inventories to remove the effects of tax planning and reflect only one year’s expenses.

NORTHE AST DA IRY FAR M SU MMARY | 2015
35
TABLE C-2.
2015 DATA BY PROFIT GROUPS – BALANCE SHEET SUMMARYDecember 31, 2015
PROFIT GROUP BOTTOM THIRD SECOND TOP ALL 25% 25% 25% 25% FARMSNumber of Farms 121 122 122 122 487Average Number of Cows 340 379 413 366 374
ASSETS PER COW Cash & Accounts Receivable $471 $461 $494 $733 $539 Feed & Crop Inventory 1,263 1,124 1,124 1,175 1,162 Supplies & Prepaid Expenses 96 169 217 431 235 Other Current Assets 51 48 54 75 59TOTAL CURRENT ASSETS $1,881 $1,802 $1,889 $2,414 $1,995 Dairy Livestock $2,368 $2,240 $2,498 $2,371 $2,372 Machinery & Equipment 2,261 2,084 2,076 2,811 2,293 Other Intermediate Assets 845 657 530 713 677TOTAL INTERMEDIATE ASSETS $5,474 $4,981 $5,104 $5,895 $5,342 Farm Real Estate $5,896 $4,894 $4,848 $5,558 $5,279 Other Fixed Assets 528 437 356 535 462TOTAL FIXED ASSETS $6,424 $5,331 $5,204 $6,093 $5,741 TOTAL ASSETS $13,779 $12,114 $12,197 $14,402 $13,078
LIABILITIES PER COW Accounts Payable $129 $82 $80 $64 $85 Farm Credit Short-Term Loans 174 174 190 144 173 Other Current Liabilities 466 497 457 440 467TOTAL CURRENT LIABILITIES $769 $753 $727 $648 $725 Farm Credit Intermediate Term $1,230 $1,426 $1,268 $922 $1,215 Other Intermediate Liabilities 261 249 208 242 240TOTAL INTERMEDIATE LIABILITIES $1,491 $1,675 $1,476 $1,164 $1,455 Farm Credit Long-Term Real Estate $1,645 $1,382 $1,354 $1,064 $1,353 Other Long-Term Liabilities 168 117 158 162 148TOTAL LONG-TERM LIABILITIES $1,813 $1,499 $1,512 $1,226 $1,501 TOTAL LIABILITIES $4,073 $3,927 $3,715 $3,038 $3,681
NET WORTH PER COWOWNER’S NET WORTH $9,706 $8,187 $8,482 $11,364 $9,397
TOTAL LIABILITIES & NET WORTH $13,779 $12,114 $12,197 $14,402 $13,078
PERCENT NET WORTH 70% 68% 70% 79% 72%

2015 | NORTHE AST DA IRY FAR M SU MMARY
36
TABLE C-3.
2015 DATA BY PROFIT GROUPS – EVALUATION FACTORS PROFIT GROUP BOTTOM THIRD SECOND TOP ALL 25% 25% 25% 25% FARMSNumber of Farms 121 122 122 122 487Average Number of Cows 340 379 413 366 374
Worker Equivalents 7.87 8.45 8.48 7.44 8.00Cows Per Worker 43 46 49 49 47Pounds of Milk Sold Per Worker 1,030,140 1,068,417 1,193,795 1,230,631 1,134,300
Pounds of Milk Sold Per Farm 8,134,468 8,990,755 10,126,038 9,160,949 9,111,895Pounds of Milk Sold Per Cow 23,866 23,700 24,606 25,068 24,366Milk Price Per Cwt. $17.95 $18.24 $18.38 $18.35 $18.24
Total Crop Acres 803 837 895 766 826Crop Acres Per Cow 2.4 2.2 2.2 2.1 2.2Crop Acres Per Worker 102 101 105 103 103
Feed Cost Per Cow $1,783 $1,696 $1,710 $1,741 $1,733Feed Cost Per Cwt. $7.47 $7.16 $6.95 $6.95 $7.11Feed as a Percent of Milk Sales 41% 39% 37% 38% 39%Feed & Crop Expense Per Cow1 2,139 2,033 2,047 2,067 2,073Feed & Crop Expense Per Cwt. $8.96 $8.58 $8.32 $8.25 $8.51
Machinery Cost Per Cow2 $945 $898 $848 $912 $897Machinery Cost Per Cwt. $3.96 $3.79 $3.45 $3.64 $3.68
Labor & Family Living Per Cow $983 $960 $965 $935 $958Labor & Family Living Per Cwt. $4.12 $4.05 $3.92 $3.73 $3.93
Assets Per Cow $13,779 $12,114 $12,197 $14,402 $13,078Debt Per Cow $4,073 $3,927 $3,715 $3,038 $3,681Net Worth Per Cow $9,706 $8,187 $8,482 $11,364 $9,397
Percent Return on Assets3 -0.9% -0.3% 1.6% 2.5% 0.8%Percent Return on Equity4 -1.0% -0.1% 2.6% 3.3% 1.4%
1 Feed & Crop Expense = Feed + Seed & Plants + Fertilizer + Chemicals & Spray2 Machinery Cost = Machinery Repairs + Custom Hire + Fuel & Oil + Machinery & Equipment Depreciation3 Return on Assets = (Net Earnings + Interest) / Average Farm Assets4 Return on Equity = (Net Earnings + Interest) / Average Farm Net Worth

NORTHE AST DA IRY FAR M SU MMARY | 2015
37
TABLE C-4.
2015 COST OF PRODUCING MILK BY PROFIT GROUPS BOTTOM ALL FARM TOP 25% AVERAGE 25% DOLLARS PER CWT.Feed $7.47 $7.12 $6.94Labor 3.48 3.27 2.94 Interest 0.53 0.47 0.35 Trucking (Marketing & Hauling) 0.96 0.97 0.95 Crop Expenses 1.49 1.40 1.30 All Other Expenses 7.57 6.77 6.16 Adjusted Cash Operating Expenses $21.50 $20.00 $18.65
+ Depreciation 1.53 1.44 1.64+ Family Living 0.66 0.69 0.83Total Costs $23.69 $22.13 $21.12
– Non-milk Income1 4.43 3.77 3.73
Net Cost of Production2 $19.26 $18.36 $17.39
1 Nonmilk income includes accrual basis cattle, crop, other income and farm income.2 Before any return on equity
TABLE C-5.
2015 CASH MARGINS BY PROFIT GROUPS 2011 2012 2013 2014 2015Bottom Profit Group Actual Milk Price $21.61 $19.81 $21.25 $25.20 $17.95 Break-Even Milk Price 21.59 20.43 21.48 22.48 19.37
CASH MARGIN $0.02 $-0.62 $-0.23 $2.72 $-1.42
Top Profit Group Actual Milk Price $21.24 $19.70 $21.18 $25.41 $18.35 Break-Even Milk Price 16.21 15.82 18.04 19.02 17.28
CASH MARGIN $5.03 3.88 $3.14 $6.39 $1.07
TABLE C-6.
2015 RESERVE DEBT CAPACITY BY PROFIT GROUPS BOTTOM ALL FARM TOP 25% AVERAGE 25% DOLLARS PER COWDebt Capacity $1,795 $3,361 $5,563– Capital Debt 4,184 3,390 2,793RESERVE DEBT CAPACITY $-2,389 $-29 $2,770

2015 | NORTHE AST DA IRY FAR M SU MMARY
38
TABLE D-1.
2015 DATA BY REGIONS – EARNINGS WORKSHEET REGIONS NEW YORK NEW ENGLAND ALL FARMS Number of Farms 327 160 487Average Number of Cows 379 368 374
Receipts DOLLARS PER COW Milk Sales $4,489 $4,379 $4,444 Cattle Sales 545 466 529 Crop Sales 148 60 120 Government Payments 56 115 75 Other 126 160 138CASH RECEIPTS $5,364 $5,180 $5,306Accrual Adjustments + Change in Inventory-Raised Livestock $63 $46 $58VALUE OF FARM PRODUCTION (a) $5,427 $5,226 $5,364
COST OF GOODS SOLD Chemicals & Sprays $59 $31 $50 Custom Hire 184 172 180 Purchased Feed 1,713 1,774 1,733 Fertilizer & Lime 159 179 165 Freight & Trucking (Marketing) 238 233 237 Gasoline, Fuel & Oil 165 167 166 Hired Labor 797 801 797 Seed & Plants 137 98 124 Supplies 288 285 287 Veterinary, Medicine & Breeding 209 194 205 Cow Replacements 5 2 4Total Cost of Goods Sold $3,954 $3,936 $3,948Gross Margin $1,473 $1,290 $1,416OVERHEAD Insurance 72 70 72 Interest 123 101 115 Rent 115 101 110 Repairs 365 318 350 Property & Misc. Taxes 78 49 69 Utilities 107 131 115 Other 91 102 96Accrual Adjustments Depreciation 344 367 351Total Overhead Expenses $1,295 $1,239 $1,278Total Farm Production Costs (b) $5,249 $5,175 $5,226
NET FARM EARNINGS (a) - (b) $178 $51 $138 + Net Nonfarm Income 44 42 44 - Family Living & Income Taxes 169 166 168NET HOUSEHOLD EARNINGS $53 $-73 $14
Note: Expenses adjusted for changes in accounts payable, prepaid expenses and supply inventories to remove the effects of tax planning and reflect only one year’s expenses

NORTHE AST DA IRY FAR M SU MMARY | 2015
39
TABLE D-2.
2015 DATA BY REGIONS – BALANCE SHEET SUMMARYDECEMBER 31, 2015
REGIONS1
NEW YORK NEW ENGLAND ALL FARMS Number of Farms 327 160 487Average Number of Cows 379 368 374
ASSETS PER COW Cash & Accounts Receivable $568 $482 $539 Feed & Crop Inventory 1,216 1,062 1,162 Supplies & Prepaid Expenses 216 274 235 Other Current Assets 57 65 59 TOTAL CURRENT ASSETS $2,057 $1,883 $1,995
Dairy Livestock $2,419 $2,289 $2,372 Machinery & Equipment 2,276 2,358 2,293 Other Intermediate Assets 681 683 677TOTAL INTERMEDIATE ASSETS $5,376 $5,330 $5,342
Farm Real Estate $5,165 $5,516 $5,279 Other Fixed Assets 429 535 462TOTAL FIXED ASSETS $5,594 $6,051 $5,741
TOTAL ASSETS $13,027 $13,264 $13,078
LIABILITIES PER COW Accounts Payable $78 $96 $85 Farm Credit Short-Term Loans 144 235 173 Other Current Liabilities 483 445 467TOTAL CURRENT LIABILITIES $705 $776 $725 Farm Credit Intermediate Term $1,340 $987 $1,215 Other Intermediate Liabilities 222 283 240TOTAL INTERMEDIATE LIABILITIES $1,562 $1,270 $1,455 Farm Credit Long-Term Real Estate $1,454 $1,121 $1,353 Other Long-Term Liabilities 145 173 148TOTAL LONG-TERM LIABILITIES $1,599 $1,294 $1,501 TOTAL LIABILITIES $3,866 $3,340 $3,681
NET WORTH PER COW OWNER’S NET WORTH $9,161 $9,924 $9,397
TOTAL LIABILITIES & NET WORTH $13,027 $13,264 $13,078
PERCENT NET WORTH 70% 75% 72%
1Regions are divided by state not Federal Milk Orders.

2015 | NORTHE AST DA IRY FAR M SU MMARY
40
TABLE D-3.
2015 DATA BY REGIONS – EVALUATION FACTORS REGIONS1
NEW YORK NEW ENGLAND ALL FARMS Number of Farms 327 160 487Average Number of Cows 379 368 374
Worker Equivalents 8.36 7.53 8.00Cows Per Worker 45 50 47Pounds of Milk Sold Per Worker 1,116,550 1,163,777 1,134,300
Pounds of Milk Sold Per Farm 9,334,358 8,763,241 9,111,895Pounds of Milk Sold Per Cow 24,683 23,554 24,366Milk Price Per Cwt. $18.19 $18.60 $18.24
Total Crop Acres 850 771 826Crop Acres Per Cow 2.3 2.1 2.2Crop Acres Per Worker 102 104 103
Feed Cost Per Cow $1,713 $1,777 $1,733Feed Cost Per Cwt. $6.94 $7.54 $7.11Feed as a Percent of Milk Sales 38% 41% 39%Feed & Crop Expense Per Cow2 $2,067 $2,085 $2,073Feed & Crop Expense Per Cwt. $8.37 $8.85 $8.51
Machinery Cost Per Cow3 $890 $916 $897Machinery Cost Per Cwt. $3.61 $3.89 $3.68
Labor & Family Living Per Cow $963 $955 $958Labor & Family Living Per Cwt. $3.90 $4.05 $3.93
Assets Per Cow $13,026 $13,264 $13,078Debt Per Cow $3,866 $3,340 $3,681Net Worth Per Cow $9,160 $9,924 $9,397
Percent Return on Assets4 1.4% -0.3% 0.8%Percent Return on Equity5 1.9% 0.3% 1.4%
1 Regions are divided by states not Federal Milk Orders.2 Feed & Crop Expense = Feed + Seed & Plants + Fertilizer + Chemicals & Spray3 Machinery Cost = Machinery Repairs + Custom Hire + Fuel & Oil + Machinery & Equipment Depreciation4 Return on Assets = (Net Earnings + Interest) / Average Farm Assets5 Return on Equity = (Net Earnings + Interest) / Average Farm Net Worth

NORTHE AST DA IRY FAR M SU MMARY | 2015
41
GLOSSARY
Net Farm IncomeA measure of farm profitability in terms of cash flow, net farm income reflects the ability of a farm business to meet its cost of production through cash income. It is equal to:
Cash Receipts — Adjusted Cash Operating Expenses
Adjusted Cash Operating ExpensesCash farm operating expenses adjusted to reflect 12 months of operation and to remove the effect of tax planning. Adjustments account for changes in supply inventories, accounts payable and prepaid expenses. Operating expenses do not include family living costs or capital expenditures.
Net Household EarningsAn accrual measure of overall household earnings, reflecting all revenues and costs, including both farm and non-farm sources. It is equal to: Net Farm Income + Change in Accounts Receivable + Change in Production Inventories + Net Nonfarm & Noncash Income - Depreciation - Family Living Expenses & Taxes
Return on AssetsMeasures profit earned relative to total farm assets, including assets financed with debt and those financed with farm equity. Return on assets is equal to:
Net Earnings + Interest ExpenseAverage Assets
Return on EquityMeasures profit earned relative to a farmer’s equity investment in the farm operation. Return on equity is equal to:
Net Earnings + Interest ExpenseAverage Net Worth
Debt CapacityThe maximum amount of capital debt that can be repaid from a farm’s cash flow, the calculation of debt capacity is described in the summary.
Reserve Debt CapacityThe amount of additional capital debt (beyond that already incurred) that a farm can service from cash flow. Reserve debt capacity represents a farm’s buffer against financial adversity. It is equal to:
Debt Capacity — Capital Debt
Overhead CostsCosts that do not vary with a change in production output, such as depreciation, interest, repairs, taxes and insurance, etc.

2015 | NORTHE AST DA IRY FAR M SU MMARY
42
Report prepared by Farm Credit East in cooperation with Yankee Farm Credit.May 2016


Farm Credit East, ACA240 South Road
Enfield, CT 06082-4451860.741.4380
FarmCreditEast.com