north shore rapid transit programme business case addendum · recent update to the auckland...
TRANSCRIPT

North Shore Rapid Transit
Programme Business Case
Addendum
Aurecon NZ Ltd for Auckland Transport
November 2018
VERSION 1
Programme business case
North Shore Rapid Transit Programme Business Case Addendum
AUCKLAND TRANSPORT November 2018 2
North Shore Rapid Transit Programme Business Case Addendum
AUCKLAND TRANSPORT November 2018 3
TABLE OF CONTENTS
Introduction ....................................................................................................................................................................... 4
Strategic Context .................................................................................................................................................... 5
Recent and committed changes to the North Shore bus network ....................................................................... 7
Passenger demands ............................................................................................................................................... 9
Implications of an Onewa Road RTN connection ................................................................................................ 14
Review of Recommended Programme timing ..................................................................................................... 14
Figure 1: Comparison of trends and projections for public transport patronage across the Auckland Harbour
Bridge from MSM model outputs (i11 scenario) and actual screenline counts (AM 2-hour peak) – Updated year
shown in red ................................................................................................................................................................. 10 Figure 2: Enhanced busway (double decker or advanced bus) demand v capacity (MSM, i11 demands) ................ 11 Figure 3: Light rail 66m trams @ 2 min headway demand v capacity (MSM, i11 demands) ..................................... 11 Figure 4: Light rail 99m trams @ 2 min headway demand v capacity (MSM, i11 demands) ..................................... 12 Figure 5: Heavy rail from north of Albany and light rail demand v capacity (MSM, i11 demands) .......................... 12 Figure 6: Recommended Programme - Capacity and Demand Profiles (Light Rail Strategy) ............................ 13 Figure 7: Recommended Programme - Capacity and Demand Profiles (Light and Heavy Rail Strategy) ................. 14 Figure 8: Constellation Station – Conflict between bus and pedestrian movements . Error! Bookmark not defined.
North Shore Rapid Transit Programme Business Case Addendum
AUCKLAND TRANSPORT November 2018 4
INTRODUCTION
Since the completion of the North Shore Rapid Transit Network PBC (NSRTN PBC) in December 2017,
several changes have occurred that are relevant to the case for investment. These include the most
recent update to the Auckland Transport Alignment Project (ATAP), the implementation of the New
Network bus services on the North Shore, and the indicated preference for light rail as the preferred
mode for the Northwest and City Centre to Mangere sections of Auckland’s rapid transit network
(RTN).
These updates reinforce the case for investigation into the development of the rapid transit network
north of the Waitemata Harbour. In particular, they highlight the urgent need for further investigation
of Northern Busway enhancement options outlined in stage one of the PBC’s recommended
programme and further support the recommendation to introduce light rail as patronage volumes
increase and the operational capacity of the busway is exceeded.
The purpose of this addendum is to provide an update on current and forecast demands, given a year
has passed since the completion of the PBC, and a summary of how other changes might impact the
findings of the PBC.
Major changes since the PBC include:
• Light Rail
o Preferred option for Northwest and City Centre to Mangere rapid transit
• ATAP 2018 recommendations for
o Bus shoulder lanes to Orewa and possible extension of RTN to Grand Drive
o Road Pricing
o Bus priority improvements on Fanshawe St
o Additional general vehicle harbour crossing by 2048
o Light rail between the City Centre and North Shore (by the mid-2030s)
• New Network bus service implementation
Summary
• Strategic Context – the policies and projects highlighted in the Government Policy Statement
on Transport (GPS), ATAP 2018 and planned light rail projects indicate a strengthened
strategic alignment with the recommended programme in the PBC.
• Light Rail – light rail has become the preferred mode for additions or upgrades to some parts
of the RTN, which strengthens the case in the NSRTN PBC for LRT being selected as the
preferred higher-capacity mode for the Northern Busway corridor to provide a connected
network across the region (though the RTN mode selection for the North Shore still needs to
be confirmed through next steps).
• Forecast demand – no changes have been made to the land-use growth assumptions
underpinning demand forecasts in the NSRTN PBC report, so these modelled demands for
travel remain unchanged.
• Patronage growth – continued growth in patronage on buses from the North Shore increases
the urgency for investment to improve or upgrade the existing busway and plan for a future
step change in capacity.
• The New Network – the implementation of the bus services as part of the New Network
highlighted the urgency for improvements to the busway, as capacity constraints are
North Shore Rapid Transit Programme Business Case Addendum
AUCKLAND TRANSPORT November 2018 5
increasingly evident.
Strategic Context
Government Policy Statement on Land Transport (GPS)
A new Government Policy Statement on Land Transport (GPS) for 2018/19–2027/28 was released in
June 2018. The recommended programme outlined in the PBC is strongly aligned with the priorities
of the GPS, which demonstrated a clear commitment to public transport. Alignment with Government
policy is stronger now than it was in 2017.
Ensuring that the RTN network on the North Shore continues to meet demand over the next two
decades means that the travelling public have meaningful transport choice to access social and
economic opportunities. Development of the network in conjunction with planning for an alternative
Waitemata harbour crossing also ensures the resiliency of the network. The GPS signals the need for
mode shift towards lower emissions forms of transport including public transport. Finally, the
incremental, staged approach of the recommended programme meets the GPS goal of representing
good value for money by delivering the appropriate infrastructure at the appropriate level with
flexibility to respond to changes in demand and interaction with other major projects over the next
two decades.
ATAP 2018
The ATAP update completed in April 2018 outlines several projects that have implications for or
interact with the Northern busway:
ATAP commits to providing bus shoulder lanes from Albany to Orewa over the next decade, which
will have potential network implications for the busway, including increased passenger volumes and
vehicle frequencies and consideration of Albany as a “through” station for services originating or
terminating in Orewa. The original PBC indicates the RTN ending at Albany with limited or no bus
priority further north and therefore the next stages of the I/DBC process would need to incorporate
an anticipated extension.
Bus priority improvements on Fanshawe Street and the extension of the Northern Busway from
Constellation to Albany are also listed as committed projects over the next decade that are relevant
to the North Shore corridor. The Fanshawe St components will need to be monitored in relation to
how much of this is delivered by the City Centre to Mangere LRT project, and any gaps.
The ATAP package also indicates future priorities to be completed over the medium to longer term as
funding becomes available, consisting of an upgrade of the Northern Busway, extension of the RTN
north to Orewa and south to the city centre (including a new crossing of the harbour, though not
specifying any form or alignment) and a Takapuna connection. The upgrade of the Busway, a
connection to Takapuna and a new harbour crossing are included in the PBC recommended
programme, but extension of the RTN further north would need to be added to be considered at the
next stages of the business case process.
ATAP points out the need to upgrade the Northern Busway to (or supplement it with) a higher
capacity mode over the medium to longer term. The urgency of selecting this higher capacity mode
and confirming how it integrates with the City to Māngere light rail corridor and a potential future
road crossing of the harbour is highlighted.

North Shore Rapid Transit Programme Business Case Addendum
AUCKLAND TRANSPORT November 2018 6
ATAP identified congestion pricing as having significant potential to manage travel demand and
reduce congestion, in conjunction with implementing the wider strategic approach. The Congestion
Question project has carried out Phase 1 of its work and has reaffirmed this potential. Of relevance to
the NSRTN PBC, the Phase 1 report acknowledges that “core to successful schemes internationally has
been the availability of sufficient high quality public transport to support modal shift where this has
been a viable alternative.”
Preferred pricing options and their resulting impacts and timing of implementation have not been
determined at this stage, so it is difficult to predict the impacts of pricing on the recommended
direction with any specificity. It is likely, however, that any pricing of road congestion in the northern
corridor would have an upward effect on demands for rapid transit services, potentially bringing
forward the timing improvements are required and/or increasing the design capacity. The potential
for, and ongoing investigation into congestion pricing does not undermine the PBC’s recommended
direction. If there is any effect, it is one of further supporting the need to investigate enhancing the
RTN north of the Waitemata Harbour.
City Centre Masterplan
Auckland Council is underway with refreshing the City Centre Masterplan, particularly in view of the
transformational change expected with LRT planned for Queen Street. The updated Masterplan is
expected to recommend continuing provision for greater public transport capacity and a reduction in
city centre traffic volumes, compared to current plans to maintain existing volumes. Given that AT is
responsible for following and delivering components of the Masterplan, this strategic context is
significant in terms of supporting NSRTN investigations and reducing traffic volumes into the city
centre.
Light Rail
Since the North Shore RTN PBC was prepared, the following changes have occurred regarding light
rail in Auckland:
• ATAP recommendation to providing light rail between the City Centre and Māngere in the next
10 years (2018–2028)
• ATAP recommendation to providing light rail to Auckland’s northwest within the next 10 years
(2018–2028)
• According to the NZ Transport Agency business case for City Centre to Mangere Line, this
route is expected to run along Queen Street
• The Mt Roskill to City section of the route will progress as quickly as possible
The ATAP preference for light rail points to a change in strategic direction, with light rail being
favoured over other modal options across Auckland on new or upgraded rapid transit corridors. In
particular, light rail has been considered more suitable than heavy rail to the airport and Māngere,
and light rail has been considered more favourable than a busway to the northwest.
Such decisions suggest light rail is likely to be a favoured strategic approach to the next phase of
RTN network expansion in Auckland over the next decade at least. The PBC’s recommended direction
to investigate light rail as a next higher capacity RTN mode for the North Shore is more aligned with
wider network planning and strategic direction than it was in 2017.

North Shore Rapid Transit Programme Business Case Addendum
AUCKLAND TRANSPORT November 2018 7
Recent and committed changes to the North Shore bus network
New Network
Implementation of the New Network on the North Shore in September 2018 has highlighted the
capacity constraints of the existing busway. Constellation Station in particular, experienced major
operational issues with the network update, with up to 120 buses per hour scheduled to arrive at the
existing two platforms. The long dwell times (Northern Busway dwell times range between 50 to 100
seconds per vehicle during AM and PM peaks) result in platooning of vehicles, which has a negative
impact on the reliability of services, and customer experience.
Figure 1: Constellation Station – Afternoon Peak 1 October 2018
Customer Feedback on Northern Express Services undertaken by AT’s Customer Experience team
between 2016 and September 2018 indicate a higher number of passenger complaints citing capacity
issues and overcrowding than anywhere else on the network.
Current improvement to the station including the extension of the citybound platform, and the
construction of a northbound platform will mitigate some of this congestion. However, the current
failure of the station to accommodate the increased frequency and volume of buses with the New
Network changes is a preview to future capacity constraints on the busway as patronage continues to
increase. This reinforces the need to start investigations into the enhanced busway options
recommended in the PBC.
Due to the high number of vehicles circulating around the existing two platforms, AT have been
forced to change a number of routes to maintain movement through the station. As a short-term
measure, changes to the existing parking area have provided space to provide new active stops and
layover bays for all Sunset Road services, which have reduced the pressure on the busway platform.
The high number of buses circulating through the station have also increased the conflict with
pedestrians accessing the station via Constellation Drive and the Park and Ride facility.
North Shore Rapid Transit Programme Business Case Addendum
AUCKLAND TRANSPORT November 2018 8
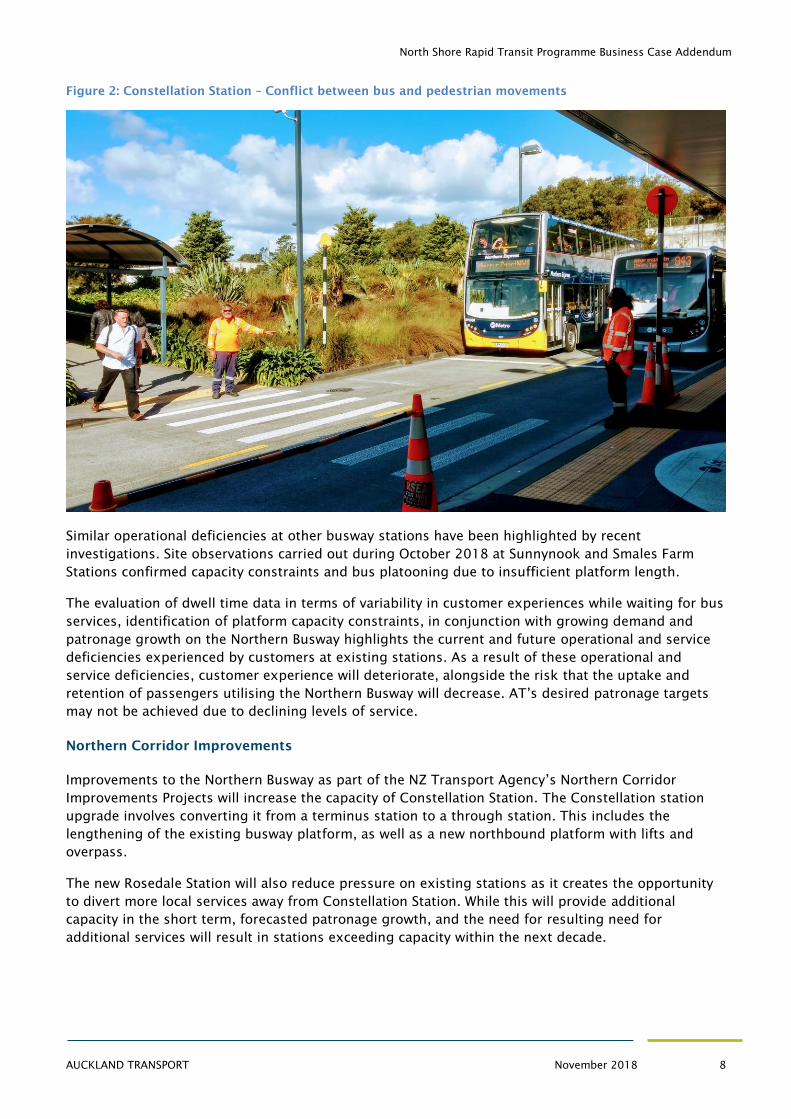
Figure 2: Constellation Station – Conflict between bus and pedestrian movements
Similar operational deficiencies at other busway stations have been highlighted by recent
investigations. Site observations carried out during October 2018 at Sunnynook and Smales Farm
Stations confirmed capacity constraints and bus platooning due to insufficient platform length.
The evaluation of dwell time data in terms of variability in customer experiences while waiting for bus
services, identification of platform capacity constraints, in conjunction with growing demand and
patronage growth on the Northern Busway highlights the current and future operational and service
deficiencies experienced by customers at existing stations. As a result of these operational and
service deficiencies, customer experience will deteriorate, alongside the risk that the uptake and
retention of passengers utilising the Northern Busway will decrease. AT’s desired patronage targets
may not be achieved due to declining levels of service.
Northern Corridor Improvements
Improvements to the Northern Busway as part of the NZ Transport Agency’s Northern Corridor
Improvements Projects will increase the capacity of Constellation Station. The Constellation station
upgrade involves converting it from a terminus station to a through station. This includes the
lengthening of the existing busway platform, as well as a new northbound platform with lifts and
overpass.
The new Rosedale Station will also reduce pressure on existing stations as it creates the opportunity
to divert more local services away from Constellation Station. While this will provide additional
capacity in the short term, forecasted patronage growth, and the need for resulting need for
additional services will result in stations exceeding capacity within the next decade.

North Shore Rapid Transit Programme Business Case Addendum
AUCKLAND TRANSPORT November 2018 9
Passenger demands
Updated transport modelling
The demand forecasts on which the North Shore RTN PBC were based came from the ART strategic
transport model using the ATAP Common Elements Enhanced version 4 (CEE4) infrastructure scenario
and the i11 land-use scenario. Modelling is now available for a newer infrastructure scenario more
closely aligned with the updated ATAP programme. A new version of the strategic transport model,
known as MSM, has also been developed in 2018. Nevertheless, the primary determinant of forecast
transport demand is land use, which remains unchanged.
Modelling of the 2018 ATAP update has only been completed for 2028, and this addendum has
analysed updated modelling from the previous iteration, ATAP 1.1. Like ATAP 2018, the ATAP 1.1
scenario includes new harbour crossings in the 2040s, which provide additional capacity for private
vehicles and a grade-separated light rail crossing. Despite these changes, there is negligible change
in the forecast total public transport demand across the harbour compared to the ATAP CEE4
scenario documented in the North Shore RTN PBC report.
Any additional changes to the transport project assumptions included in the transport modelling –
such as updates to the projects included in ATAP – will impact the forecast demand for the North
Shore RTN. However, the fundamental land use and transport demands captured in the i11 scenario
remain the same as when the North Shore RTN PBC was prepared.
Continued growth in North Shore bus patronage
Currently, patronage on buses travelling across the Auckland Harbour Bridge is currently exceeding
forecast demands. Passenger numbers has continued to grow strongly throughout 2018, increasing
the likelihood that actual demands will continue to exceed forecast demands in the 2020s. Figure 3
shows an update of Figure 20 from the original North Shore RTN PBC report, with the actual demands
for 2018 now included in red. The growth in morning peak patronage in 2018 was 1200 (12%) more
passengers than in 2017. This shifts the linear projections of demands that might be expected if
future growth continues as it has in recent years. If the observed growth rates from the last 6 to
13years continue, demand for public transport across the Auckland Harbour Bridge could increase to
between 24,000 (taking the 13-year trend) and 31,000 (taking the 6-year trend) passengers by 2048.
The MSM modelled demands for 2028 are about the same as is expected based on the average
growth rate since 2006, but the modelled demands for 2038 and 2048 are lower than would be
expected based on the growth rates since 2006 (see Table 1below). For example, a linear fit based on
the trend since 2006 would result in 1,200 (5%) more trips over the Harbour Bridge in the 2-hour AM
peak in 2048 than is predicted in the transport model forecasts (MSM model, i11, ATAP 1.1). This
indicates that if the growth rates from the last 13 years continue, the modelled demands would be
underestimating the actual demands in future decades.
Table 1: Difference between linear forecasts and MSM, i11, ATAP 1.1 forecasts.
2028 2038 2048
Linear fit (long term
trend, 2006-2018) 50 (0.3%) 1,500 (9%) 1,200 (5%)
Linear fit (short term
trend, 2013-2018) 2,800 (19%) 6,700 (38%) 8,600 (38%)
North Shore Rapid Transit Programme Business Case Addendum
AUCKLAND TRANSPORT November 2018 10
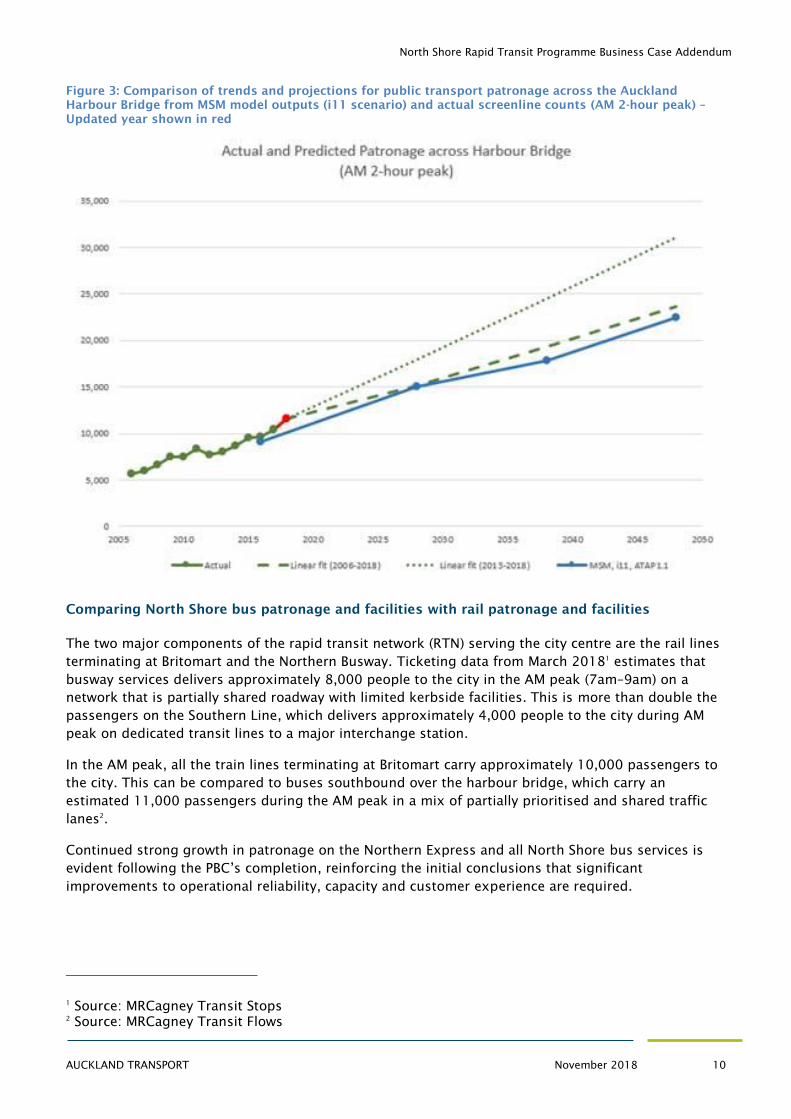
Figure 3: Comparison of trends and projections for public transport patronage across the Auckland
Harbour Bridge from MSM model outputs (i11 scenario) and actual screenline counts (AM 2-hour peak) –
Updated year shown in red
Comparing North Shore bus patronage and facilities with rail patronage and facilities
The two major components of the rapid transit network (RTN) serving the city centre are the rail lines
terminating at Britomart and the Northern Busway. Ticketing data from March 20181
estimates that
busway services delivers approximately 8,000 people to the city in the AM peak (7am–9am) on a
network that is partially shared roadway with limited kerbside facilities. This is more than double the
passengers on the Southern Line, which delivers approximately 4,000 people to the city during AM
peak on dedicated transit lines to a major interchange station.
In the AM peak, all the train lines terminating at Britomart carry approximately 10,000 passengers to
the city. This can be compared to buses southbound over the harbour bridge, which carry an
estimated 11,000 passengers during the AM peak in a mix of partially prioritised and shared traffic
lanes2
.
Continued strong growth in patronage on the Northern Express and all North Shore bus services is
evident following the PBC’s completion, reinforcing the initial conclusions that significant
improvements to operational reliability, capacity and customer experience are required.
1
Source: MRCagney Transit Stops
2
Source: MRCagney Transit Flows

North Shore Rapid Transit Programme Business Case Addendum
AUCKLAND TRANSPORT November 2018 11
Capacity Assessment
The total demands for public transport across the harbour do not change significantly with ATAP 1.1
compared to the demands that were previously modelled using the ATAP CEE4 scenario.
The demand-capacity charts from the PBC report have been updated here to show the forecast AM
peak hour demand from the ATAP 1.1 model (MSM model, i11 land-use scenario). The updated charts
show little difference in the timing of required investments and still indicate that the busway will run
out of capacity by the mid-2030s.
These charts show the total demand and capacity across the harbour from the North Shore to the city
centre, made up of the demand and capacity from two corridors: Onewa Road and the RTN corridor
(currently the Northern Busway). As in the 2017 PBC, the charts show the i11 demands and an
additional, higher “forecast” which is i11 + 10% to reflect the observed pattern of actual patronage
exceeding forecast demands outlined in Figure 3 above. The potential capacities of various
improvement options are shown in vertical columns. This indicates the time at which forecast
demand growth exceeds the capacity of the various improvement options.
Figure 4: Enhanced busway (double decker or advanced bus) demand v capacity (MSM, i11 demands)
In terms of capacity, an enhanced busway is expected to provide enough capacity until the early to
mid-2030s. For context, the enhanced busway can be implemented using double deckers or
advanced buses and assumes station upgrades and additional dedicated right of way south of
Akoranga, including the Fanshawe Street bus corridor. The two options have a similar capacity
outcome but provide different outcomes from a customer experience, reliability and urban
environment perspective due to the different City Centre terminal operation and arrangement.
Figure 5: Light rail 66m trams @ 2 min headway demand v capacity (MSM, i11 demands)

North Shore Rapid Transit Programme Business Case Addendum
AUCKLAND TRANSPORT November 2018 12
Light rail on its own harbour crossing, using 66m trams at a 2-minute headway, is likely to provide
enough capacity for the current demand forecasts, which end at 2048, although by 2048 there is
likely to be no additional headroom remaining in this system for growth in demand beyond this time
or higher than expected growth rates. However, if demand growth is stronger or occurs earlier than
predicted, additional network capacity would be required before 2048.
Figure 6: Light rail 99m trams @ 2 min headway demand v capacity (MSM, i11 demands)
Light rail has also been assessed using a 99m vehicle operating at a 2-minute headway. This option
has headroom beyond the forecast period, through to the 2060s based on extrapolated growth
forecasts. However, this has some risks in terms of its acceptability in a dense urban on-street
context, and there may be operational challenges with integrating this system with current plans for
66m light rail vehicles on the City to Mangere and Northwestern lines.
Figure 7: Heavy rail from north of Albany and light rail demand v capacity (MSM, i11 demands)
Heavy rail has been assessed as an augmentation to the light rail option, assuming 6-car trains at 5-
minute headways. Heavy rail can operate at greater lengths and high frequencies enabling
significantly greater capacity than the capacity shown, which is aligned with extrapolated forecast
growth. This provides significant additional headroom for growth beyond the demand forecast period
to 2048. This option would require the consideration of a new harbour crossing (or crossings) that
could accommodate both light rail and heavy rail, with the understanding that light rail will be
required earlier. Early delivery of heavy rail together with light rail would provide considerably excess
capacity relative to currently projected demands and land use patterns, but heavy rail creates
significant room for further growth beyond that currently forecast. Heavy rail also opens up
opportunities for inter-regional operations and travel patterns that do not exist in the current or
planned network.
North Shore Rapid Transit Programme Business Case Addendum
AUCKLAND TRANSPORT November 2018 13
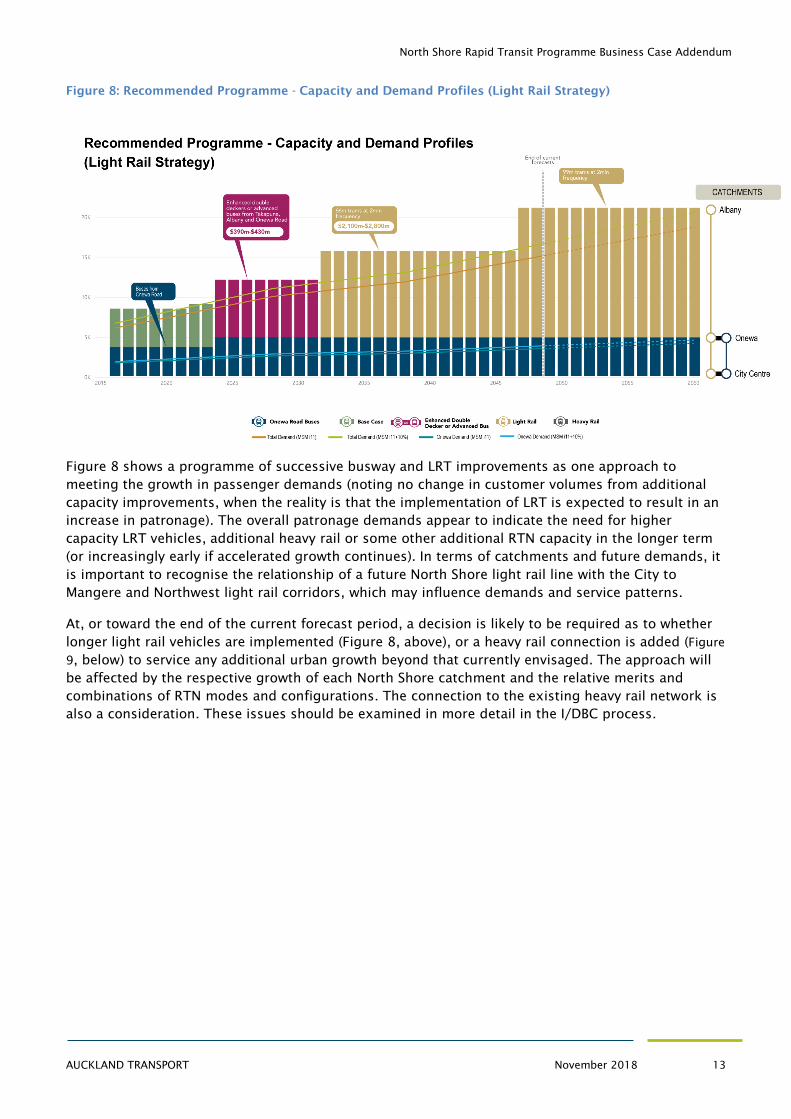
Figure 8: Recommended Programme - Capacity and Demand Profiles (Light Rail Strategy)
Figure 8 shows a programme of successive busway and LRT improvements as one approach to
meeting the growth in passenger demands (noting no change in customer volumes from additional
capacity improvements, when the reality is that the implementation of LRT is expected to result in an
increase in patronage). The overall patronage demands appear to indicate the need for higher
capacity LRT vehicles, additional heavy rail or some other additional RTN capacity in the longer term
(or increasingly early if accelerated growth continues). In terms of catchments and future demands, it
is important to recognise the relationship of a future North Shore light rail line with the City to
Mangere and Northwest light rail corridors, which may influence demands and service patterns.
At, or toward the end of the current forecast period, a decision is likely to be required as to whether
longer light rail vehicles are implemented (Figure 8, above), or a heavy rail connection is added (Figure
9, below) to service any additional urban growth beyond that currently envisaged. The approach will
be affected by the respective growth of each North Shore catchment and the relative merits and
combinations of RTN modes and configurations. The connection to the existing heavy rail network is
also a consideration. These issues should be examined in more detail in the I/DBC process.
North Shore Rapid Transit Programme Business Case Addendum
AUCKLAND TRANSPORT November 2018 14
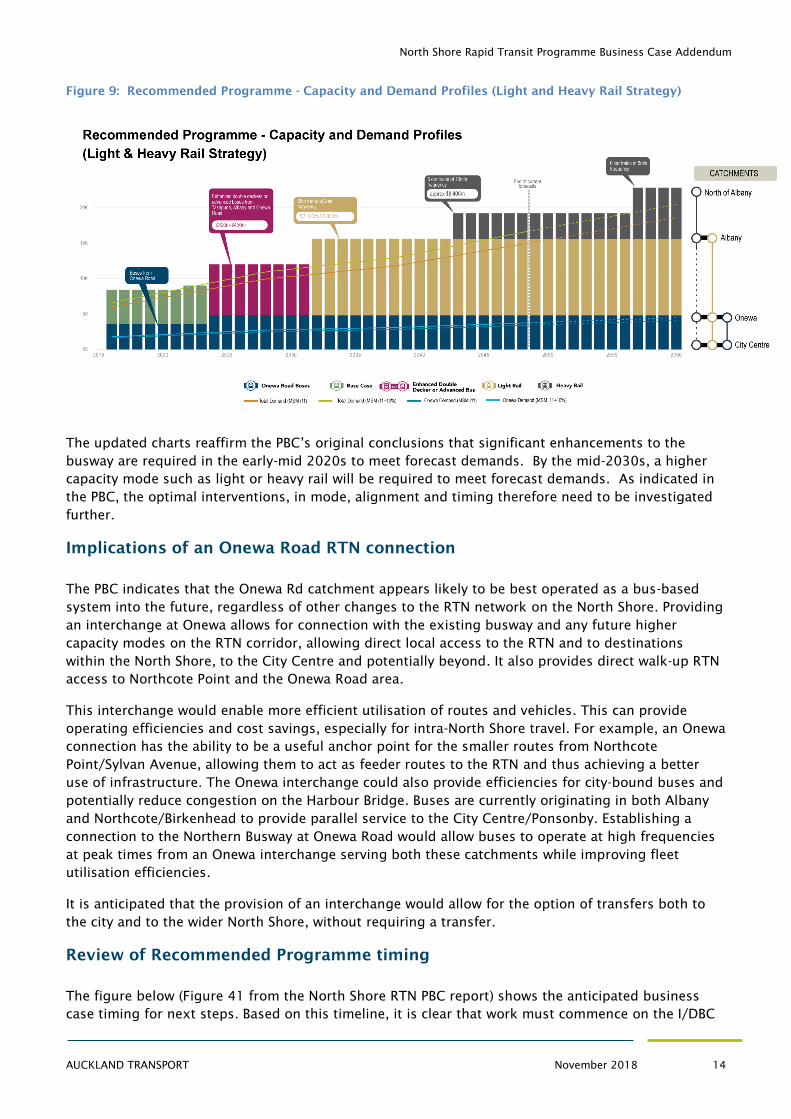
Figure 9: Recommended Programme - Capacity and Demand Profiles (Light and Heavy Rail Strategy)
The updated charts reaffirm the PBC’s original conclusions that significant enhancements to the
busway are required in the early-mid 2020s to meet forecast demands. By the mid-2030s, a higher
capacity mode such as light or heavy rail will be required to meet forecast demands. As indicated in
the PBC, the optimal interventions, in mode, alignment and timing therefore need to be investigated
further.
Implications of an Onewa Road RTN connection
The PBC indicates that the Onewa Rd catchment appears likely to be best operated as a bus-based
system into the future, regardless of other changes to the RTN network on the North Shore. Providing
an interchange at Onewa allows for connection with the existing busway and any future higher
capacity modes on the RTN corridor, allowing direct local access to the RTN and to destinations
within the North Shore, to the City Centre and potentially beyond. It also provides direct walk-up RTN
access to Northcote Point and the Onewa Road area.
This interchange would enable more efficient utilisation of routes and vehicles. This can provide
operating efficiencies and cost savings, especially for intra-North Shore travel. For example, an Onewa
connection has the ability to be a useful anchor point for the smaller routes from Northcote
Point/Sylvan Avenue, allowing them to act as feeder routes to the RTN and thus achieving a better
use of infrastructure. The Onewa interchange could also provide efficiencies for city-bound buses and
potentially reduce congestion on the Harbour Bridge. Buses are currently originating in both Albany
and Northcote/Birkenhead to provide parallel service to the City Centre/Ponsonby. Establishing a
connection to the Northern Busway at Onewa Road would allow buses to operate at high frequencies
at peak times from an Onewa interchange serving both these catchments while improving fleet
utilisation efficiencies.
It is anticipated that the provision of an interchange would allow for the option of transfers both to
the city and to the wider North Shore, without requiring a transfer.
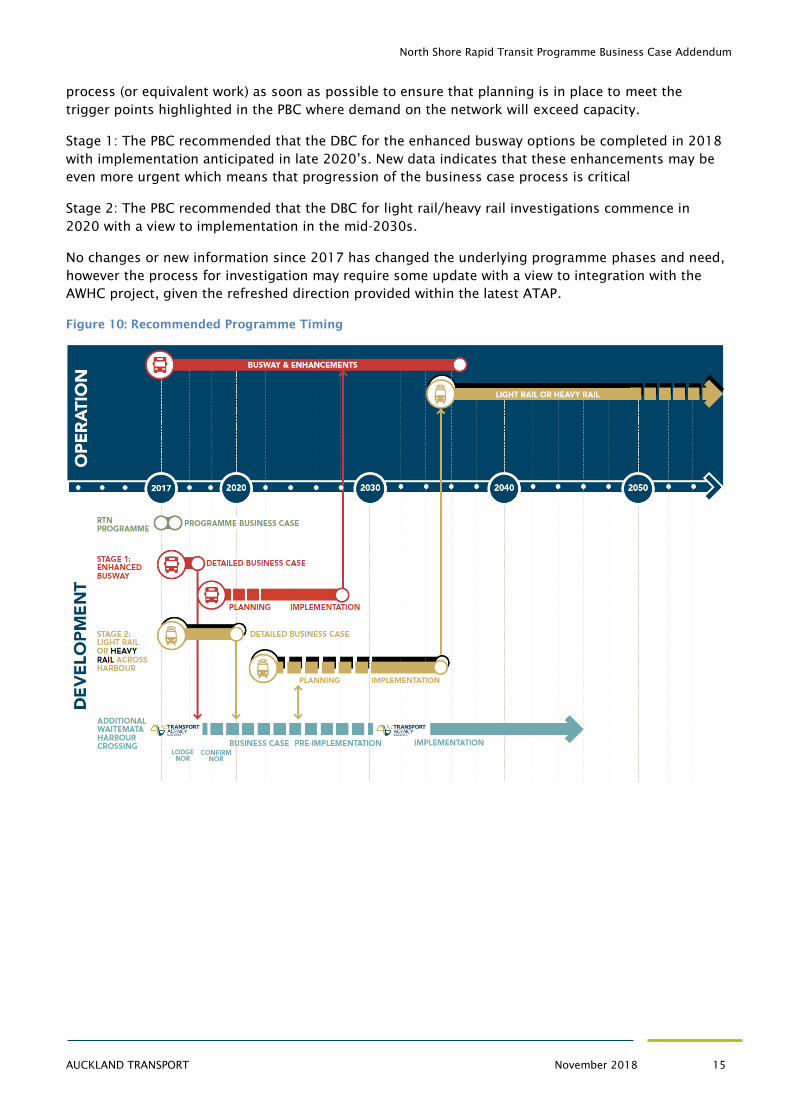
Review of Recommended Programme timing
The figure below (Figure 41 from the North Shore RTN PBC report) shows the anticipated business
case timing for next steps. Based on this timeline, it is clear that work must commence on the I/DBC
North Shore Rapid Transit Programme Business Case Addendum
AUCKLAND TRANSPORT November 2018 15
process (or equivalent work) as soon as possible to ensure that planning is in place to meet the
trigger points highlighted in the PBC where demand on the network will exceed capacity.
Stage 1: The PBC recommended that the DBC for the enhanced busway options be completed in 2018
with implementation anticipated in late 2020’s. New data indicates that these enhancements may be
even more urgent which means that progression of the business case process is critical
Stage 2: The PBC recommended that the DBC for light rail/heavy rail investigations commence in
2020 with a view to implementation in the mid-2030s.
No changes or new information since 2017 has changed the underlying programme phases and need,
however the process for investigation may require some update with a view to integration with the
AWHC project, given the refreshed direction provided within the latest ATAP.
Figure 10: Recommended Programme Timing