north sea star spreading transnational results
TRANSCRIPT
North Sea STAR Spreading Transnational
Results
Annex A: Overview of National Energy
Policies for North Sea Countries
Targeted Analysis 2013/2/23
Final Report | Version 31/03/2014

Contents
1. Belgium ......................................................................................................................... 41.1 Context ............................................................................................................................. 4 1.2 Review of baseline data and data sources for Belgium .................................................. 5
2. Denmark ........................................................................................................................ 72.1 Context ............................................................................................................................. 7 2.2 Denmark’s Energy Strategy ........................................................................................... 10 2.3 Review of baseline data and data sources for Denmark ............................................... 12
3. Germany.......................................................................................................................143.1 Context ........................................................................................................................... 14 3.2 Drivers of German energy policy .................................................................................... 18 3.3 Trends in energy production and consumption.............................................................. 19 3.4 Review of baseline data and data sources for Germany ............................................... 20
4. The Netherlands ..........................................................................................................224.1 Context ........................................................................................................................... 22 4.2 Dutch Policy Drivers ....................................................................................................... 22 4.3 Review of baseline data and data sources for the Netherlands .................................... 24
5. Norway .........................................................................................................................265.1 Energy policies in a Nordic context ................................................................................ 26 5.2 Norwegian energy production and use .......................................................................... 26 5.3 Norwegian energy policy – main goals and future perspectives ................................... 29 5.4 Baseline data, information and trends for Norway ......................................................... 30
6. Sweden ........................................................................................................................316.1 Context ........................................................................................................................... 31 6.2 Main trends and projections ........................................................................................... 34 6.3 Dimensions driving Sweden’s energy policy towards Europe’s 20:20:20 goals ........... 35 6.4 Review of baseline data and data sources for Sweden ................................................ 37
7. The UK .........................................................................................................................387.1 Introduction ..................................................................................................................... 38 7.2 Main Trends in Energy Supply and Demand ................................................................. 38 7.3 Drivers of Energy Policy ................................................................................................. 43 7.4 Energy Production .......................................................................................................... 44 7.5 Energy Consumption ...................................................................................................... 45 7.6 Data Availability .............................................................................................................. 45
ESPON 2013 2

Figures
Figure 1: Energy consumption in Denmark by use, 1980-2011 [PJ] ............................................ 7 Figure 2: Share of total energy consumption in Denmark by use 1980-2011[%] ....................... 8 Figure 3: Energy consumption for transport in Denmark by type 1980-2011 [PJ]...................... 8 Figure 4: Gross energy consumption in Denmark ........................................................................... 9 Figure 5: Energy flow in Denmark 2011 (Peta Joules) ................................................................. 10 Figure 6: Average extra costs for the implementation of the national energy strategy ............ 11 Figure 7: Contributions to Germany´s power production in 2011 ............................................... 15 Figure 8: Germany’s Share in Global Primary Energy Consumption ......................................... 15 Figure 9: Historical trends in contributions to overall electricity generation in Germany ......... 16 Figure 10: Contribution to the energy consumption mix in Germany in 2011 ........................... 17 Figure 11: Energy flow (in PJ) in the State Lower Saxony ........................................................... 17 Figure 12: German wind energy capacity on the State level ....................................................... 18 Figure 13: Norwegian Energy Consumption, 1990-2007 ............................................................. 27 Figure 14: Norwegian Electricity Consumption, 1990-2007 ......................................................... 27 Figure 15: Energy Consumption by Industry and Source, 2007 ................................................. 28 Figure 16: Total Domestic Energy Consumption by Type of Energy ......................................... 29 Figure 17: Sweden’s Total Primary Energy Supply, 1973-2011 ................................................. 32 Figure 18: Sweden’s Energy Production by Source, 1973-2011 ................................................ 32 Figure 19: Total Final Energy Consumption by Sector, 1973-2011 ............................................ 33 Figure 20: Total Primary Energy Supply Projections for Sweden to 2030 ................................. 35 Figure 21: Final Energy Consumption by User .............................................................................. 39 Figure 22: Total Average Energy Consumption per capita in 2010 (KwH per Capita) ............ 40 Figure 23: Growth in Renewable Energy Production (Installed Capacity), 2000-2012 ........... 41 Figure 24: Sub-National (L) and Regional Renewable Energy Generation (R) in the UK, ..... 41 Figure 25: Onshore Wind Farm Capacity in the Construction or Planning Phase .................. 42 Figure 26: Biomass Electricity Projects in the Construction or Planning Phase ....................... 42 Figure 27: UK Jobs and Investment in Renewables ..................................................................... 43
Tables Table 1: Danish energy policy milestones up to 2050 .................................................................. 10
ESPON 2013 3

1. Belgium
1.1 Context
The production of energy from primary sources in Belgium lay in 2011 at 740 PJ. The majority (70%) of this production stemmed from nuclear heat, roughly 100 PJ (14%) from renewable and waste resources, of which industrial waste contributed a 94% share. In the same year, gross inland energy consumption in Belgium lay at 2,500 PJ and final energy consumption (excluding energy used by power producers) lay at 1,600 PJ. Industry (34%) and transport (28%) were the largest consumers of the available energy in Belgium (Eurostat, 2013a). The consumption of energy by industry exceeded the European average which lay, in 2010, at 25% (Eurostat, 2013b). In 2011 Belgium relied on 73% of its energy production coming from imports (Eurostat, 2013c).
The primary production of energy in Flanders has in 2011, according to statistic accounts of the Energie- en Milieu-Informatiesysteem voor het Vlaamse Gewest (Energy and Environmental Information System for the Flemish Region) (EMIS, 2012), been marginal (140 PJ). It stemmed for 70% from industrial waste or, as more precisely described in European accounts, residual fuels in chemistry (Eurostat, 2013a). 24% of this energy was produced from biomass. In the same year the gross regional energy consumption in Flanders exceeded the primary production by far. It lay in 2011 at 1,600 PJ. In transformation processes 400 PJ were lost which left 1,200 PJ for final consumption. When distinguishing consumption by energy source, petrochemical products (32%), gas (25%) and electricity from thermal and nuclear power (18%), were the most important sources. The largest sector consuming the available energy was the Flemish industry (43%). Biomass had a share of 2.4%. In an assessment of environmental change, the Vlaamse Milieumaatschappij (Flemish Environmental Agency) (2011, p. 12) notes that ‘the total net production of green power increased in 2010 by 21 % with respect to 2009.’ This remains small, given the overall picture.
Belgium is committed to goals as they are set out by the European Union and the Kyoto protocol. Targets for CO2 reductions differ in regions. The national benchmark for the share of energy from renewable resources in energy consumption is set at 13% in 2020.
Energy policies in Belgium are carried out at both, the national (federal) and the regional level of government. Involvement differs according to responsibilities for sector policies (the portfolio of the federal government includes economic, financial and social issues; the regions are responsible for territorial matters, including the environment) and changes along the lines of planning protocols. Several planning objects in the field of energy policies gain attention by both, the federal and the regional level of government. Among those are electricity transmission networks and gas market structures. Relations among levels of government are complex and the subject of ongoing reforms. Competences for territorial matters have in recent years shifted towards the regional governments.
The Belgium federal government applies, for the purpose of realizing benchmarks on CO2 reductions, largely fiscal measures. Incentives for reduction are included in the taxation of transport (for example through tax exempt bio-fuel quotas), energy production (for example through tax reductions for investment in energy production from renewable resources) and pollution. Regulations that relate to benchmarks for renewable energy production and are applied by the national government include the mandatory use of bio-fuel in the fuel mix. Development in the Belgium waters of the North Sea falls, as in other countries, under national responsibility. The Belgium federal government has reserved zones for the generation of off-shore wind energy. Belgium announced in 1999 to phase out the
ESPON 2013 4

utilisation of nuclear power. As in other European countries, this development was expected to lead to a more important role of renewable energies in energy market structures. The high dependency of Belgium on the import of energy made this development specifically urgent. The Belgium federal government promotes the European Emissions Trade System (ETS). The effect of applications is monitored at the regional level. Specifically in the highly industrialized Flemish region effects are (as the environmental balance in general) strongly influenced by ups and downs of economic development.
Although regional policies are interwoven with federal policies, the Belgium regions are (at least compared to their Dutch neighbours) relatively autonomous in formulating and applying energy policies. This autonomy is illustrated by the broad range of policy measures that are applied by the government of the Flemish region. The government of the Flemish region formulates legislation applied to environmental development and grants environmental and land use permits accordingly. This authority is used to make structural plans, such as the Windplan Vlaanderen (Wind Plan Flanders) and to intervene in a multitude of local development processes by means of regulation. The right of regions to control local electricity transmission networks is used to prioritize the feeding of renewable energy into these. The Flemish region does not use statutory frameworks only. The production of energy from renewable resources is stimulated through the provision of funding for voluntary agreements and the region supports sustainable consumption patterns by individual households and businesses through information campaigns.
The most important measure to stimulate the production of energy from renewable resources, taken by the Flemish government, is the application of schemes of tradable green certificates. Two schemes have in 2002 been introduced to achieve yearly increasing quota obligations on electricity generation from renewable sources. The mechanism is applied to the production of electricity by wind and biomass. It is driven by guaranteeing minimum prices for certificates, the possibility given to producers to trade rights and penalties for shares that are not covered. Outcomes of the scheme are controversially discussed. Belgium has for a long time, compared to most European countries, been a late runner in the production of renewable energy. The certificate trading model is associated with a rapidly increasing amount of renewable energy since 2002. Criticism however indicates that the five different schemes that are applied in Belgium regions have accelerated differences among regional renewable energy market structures.
1.2 Review of baseline data and data sources for Belgium
Several organisations on the national and regional level publish data on energy production and consumption. For this inception report, the availability of data at these organisations has only partially been reviewed. Preliminary outcomes are summarized in the list below:
- National accounts are published by the Federal Planning Bureau (www.plan.be/), including data on energy use.
- Federal Ministry of Employment and Labour (www.meta.fgov.be/) publishes a large amount of data on economic development in Belgium. Few entries relate to energy, among those data on the development of green jobs.
- The energy balance of the region of Flanders is published by the Energie- en Milieu-Informatiesysteem voor het Vlaamse Gewest (Energy and Environmental Information System for the Flemish Region) (EMIS). In the publicly available dataset production and consumption is distinguished by energy carriers and sectors that consume.
- An assessment of environmental change, the Milieurapport Vlaanderen (Environmental Report Flanders) (MIRA) is published by the Vlaamse Milieumaatschappij (Flemish Environmental Association). Detailed environmental
ESPON 2013 5

data available via a ‘dynamic core set’ (www.milieurapport.be) which shows data in current years.
- The Agentschap voor Geografische Informatie Vlaanderen (Agency for Geographic Information Flanders) publishes detailed geographic information, among this information underpinning the Flemish wind plan (http://metadata.agiv.be).
References – Belgium Eurostat, 2013a. Supply, transformation, consumption - all products - annual data [nrg_100a]. Available online at http://epp.eurostat.ec.europa.eu. Accessed 5 February 2013.
Eurostat, 2013b. Consumption of energy (YB2013). Available online at http://epp.eurostat.ec.europa.eu. Accessed 5 February 2013.
Eurostat, 2013c. Energy dependence. Available online at http://epp.eurostat.ec.europa.eu. Accessed 5 February 2013.
Energie- en Milieu-Informatiesysteem voor het Vlaamse Gewest (EMIS), 2012. Balans 2011. Available online at http://www.emis.vito.be/. Accessed 5 February 2013.
Federal Planning Bureau (FPB), Institut de Conseil et d’Etudes en Developpment Durable (ICEDD) & Vlaams Instituut voor Technologisch Onderzoek (VITO), 2012. Towards 100% renewable energy in Belgium in 2050.
Vlaamse Milieumaatschappij, 2011. Indicator Report 2011. MIRA Vlanders Environment Report. Available online at http://www.milieurapport.be. Accessed 5 February 2013.
ESPON 2013 6

2. Denmark
2.1 Context Denmark is a modern and well developed country with a population of 5,574,000 inhabitants. According to OECD standards it is a region of high income (GNI per capita: 60,390 US$). It is the easiest place to do business in Europe as said by the World Bank (2013). Denmark has the fourth highest ratio of tertiary degree holders in the world (UNESCO-UIS, 2009). Its economy is diverse but relies to a large degree on human resources. Denmark is an export nation ranked 28th worldwide by WTO (2013) and depends heavily on foreign trade with Germany being the most important trading partner. Since 1980, the Danish economy has grown by 78% (GDP), while energy consumption has remained more or less constant, and CO2 emissions have been reduced (KEMIN, 2009). There has been a trend towards a slight increase of energy consumption in Denmark until 2008 (fig. 1). But the current international slowdown of the economy has also had an impact on the Danish economy and led to a stabilisation of energy consumption at around 810 PJ. Figure 1: Energy consumption in Denmark by use, 1980-2011 [PJ]
(data source: ENS, 2013)
The total consumption of energy in Denmark has been relatively stable over the last three decades. However, the share of single uses in total energy consumption has partly changed (fig.2). In particular the transport sector has shown an increase from 18% (1980) to 26% (2011) (144 vs. 213 PJ). This development is mainly driven by increasing consumption in road traffic (fig. 3). Another driving sector for increasing energy consumption is the energy sector itself. Its share in total energy consumption increased from 2% (1980) to 6% (2011) (17 vs. 45 PJ). The increase in energy consumption in these two sectors is compensated by a slightly decreasing consumption in agriculture and industry, where the share has fallen from 28% (1980) to 23% (2011) of which about 2% seem to be caused by the global economic slowdown since 2008 (228 vs. 183 PJ). Energy savings have been achieved mainly at households whose share decreased from 34% (1980) to 28% (2011) (277 vs. 228
-
100
200
300
400
500
600
700
800
900
1 000
1980 '8
2'8
4'8
6'8
8'9
0'9
2'9
4'9
6'9
8'0
0'0
2'0
4'0
6'0
8'1
0
Households
Commercial and public services
Agriculture and industry
Transport
Non-energy use
Energy sector
ESPON 2013 7

PJ). While the progress in energy savings in households has been achieved mainly prior to the year 2000 this situation is different in the agricultural and industrial sectors. Here energy savings are noticeable in national consumption statistics mainly from the year 2002 onwards while savings in households stagnate. These numbers are based on total consumption. Under consideration of growth of both the Danish economy and population an increase of energy efficiency can be stated for all sectors. On average energy efficiency in Denmark increased by 1.1%/year since 1990. Figure 2: Share of total energy consumption in Denmark by use 1980-2011[%]
(source: own calculations)
Figure 3: Energy consumption for transport in Denmark by type 1980-2011 [PJ]
(data source: ENS, 2013)
0%
10%
20%
30%
40%
50%
60%
70%
80%
90%
100%
1980 '8
2'8
4'8
6'8
8'9
0'9
2'9
4'9
6'9
8'0
0'0
2'0
4'0
6'0
8'1
0
Households
Commercial and public services
Agriculture and industry
Transport
Non-energy use
Energy sector
0.0
20.0
40.0
60.0
80.0
100.0
120.0
140.0
160.0
180.0
1980 '8
2
'84
'86
'88
'90
'92
'94
'96
'98
'00
'02
'04
'06
'08
'10
Road
Rail
Domestic sea transport
Domestic aviation
International aviation
Military transport
ESPON 2013 8

Denmark’s energy consumption rests upon a small number of energy carriers. Before transformation (e.g. production of electricity and heat) oil has the largest share with 39% in 2011 (fig. 4) followed by renewables with 22%, natural gas with 20% and coal with 17%. After transformation oil remains the largest energy product with 37% followed by electricity with 32 %, natural gas with 12% and district heating with 11% (all numbers: 2011). Renewables have a share of 8% in these statistics which considers the consumption of renewables by end-users, mainly households. About one half of the energy provided by renewables is transformed into heat and electricity (cf. fig. 5). Figure 4: Gross energy consumption in Denmark
(By energy carrier after transformation 1980-2011 [%] and (inset) gross energy consumption in 2011 by energy carrier before transformation)
(data source: ENS, 2013; own calculations)
The domestic energy production in Denmark is based on crude oil (470 PJ), natural gas (265 PJ) and renewables (152 PJ) (all numbers: 2011). Denmark is a net exporter of energy, mainly of fossil fuels such as crude oil, oil products and natural gas. Nonetheless Denmark also imports energy. These imports mainly encompass processed oil products, crude oil to operate Danish refineries with full capacity, and coal. Nearly one quarter (42 PJ) of the renewable energy consumed in Denmark in 2011 was imported (fig. 5). There are spatial deviations both in consumption and production of renewable energies in Denmark. Energy production by land-based wind turbines, for instance, shows concentrations in west coast areas, e.g. western Limfjord region (Thisted, Lemvig, Morsø, Skive), western Sealand (Slagelse) and western Lolland (ENS, 2012). In energy consumption the share of renewable energies varies from 10% to 44% per municipality. Leading municipalities are Herning with a share of 44% followed by Samsø Island and Syddjurs each with 43% (Region Midtjylland, 2012).
0%
10%
20%
30%
40%
50%
60%
70%
80%
90%
100%
Gas works gas
District heating
Electricity
Renewable energy etc.
Coal and coke
Natural gas
Oil
Mineral oil
39%
Natural gas 20%
Coal 17%
Refuse 2%
Renew-ables 22%
Consumption 2011
ESPON 2013 9

Figure 5: Energy flow in Denmark 2011 (Peta Joules)
(source: ENS, 2013)
2.2 Denmark’s Energy Strategy In November 2011 the Danish government passed an energy strategy (Danish Government, 2011) aiming for an ambitious goal: the entire energy supply – electricity, heating, industry and transport – is to be covered by renewable energy by 2050. This goal of 100% renewables has been renewed by the Energy Agreement passed in March 2012 (KEMIN, 2012). With this strategy the Danish Government plans to over-fulfil Europe’s 20-20-20 goals. The national energy strategy includes a few milestones which illustrates how the implementation of this goal shall be achieved (see Table 1). Table 1: Danish energy policy milestones up to 2050
2020 2030 2035 2050 Half of the traditional consumptions of electricity is covered by wind power 35% greenhouse gas reduction compared to 1990
Coal is phased out from Danish power plants Oil burners phased out
The electricity and heat supply covered by renewable energy
All energy supply – electricity, heat, industry and transport – is covered by renewable energy
ESPON 2013 10

Energy savings play a major role to achieve this strategy. Therefore the Danish Ministry of Climate, Energy and Building published a more detailed roadmap for the time until the year 2020 (KEMIN, 2012). According to this energy agreement the national gross energy consumption (PJ) shall decrease from today’s (2010) value of 810 PJ down to 750 PJ by 2020, a reduction of 7.6 %. In 2013 and 2014, energy savings realised by energy companies have to increase by 2.6% of final energy consumption excl. transport compared to the 2010 level. From 2015 to 2020 this figure will rise to an annual 2.9%. Energy companies are obliged to realise energy savings in enterprises and households by offering subsidies or consultancy, for example. The initiatives will target industry and buildings. By the year 2020 the share of renewables in final energy consumption shall be more than 35% and approximately 50% of the electricity consumption shall be supplied by wind power. To achieve this both offshore and onshore wind farms shall be expanded. Planned are 600 MW offshore wind turbines at Kriegers Flak (Baltic Sea) and 400 MW offshore wind turbines at Horns Rev (North Sea). Additionally 500 MW offshore wind turbines shall be implemented in coastal areas. And new planning tools shall encourage an increase in net capacity of 500 MW onshore wind power (repowering). Even more important than wind farms shall be the role of biomass, e.g. as a substitute for coal and natural gas in combined heat and power plants. The energy agreement foresees more detailed studies on the potential of biomass in 2013. Consumption by industrial processes is also to be converted to renewable energy. Therefore, the energy agreement has laid down the following: A new green business scheme of DKK 250 million in 2013 and 500 million per year from 2014 to 2020 will promote the efficient use of renewable energy in enterprises. DKK 30 million per year from 2013 to 2020 has been committed to maintaining and promoting industrial combined heat and power plants in industry and greenhouses. Furthermore the energy agreement contains a number of initiatives which will reduce individual heating based on oil and gas in buildings substantially and promote renewable alternatives; a halt to installation of oil-fired and gas-fired boilers in new buildings from 2013. The installation of oil-fired boilers in existing buildings will be banned from 2016 on (in areas with district heating or natural gas). And DKK 42 million has been committed to fund the conversion from oil-fired and gas-fired boilers in existing building to renewable alternatives (solar, heat pumps, etc.). The total financing requirement for the new energy strategy amounts to DKK 3.5 billion by 2020. These costs shall not impact public funds but shall be financed via the companies’ tariffs and therefore through consumers’ energy bills. The expansion of renewables in electricity production such as offshore and onshore wind turbines will be financed through the Public Service Obligation schemes (PSO) which are a supplement to the price of electricity paid by all electricity consumers. In addition, there is a new gas PSO scheme, collected through gas bills, which finances subsidies for renewable energy for the gas grid (KEMIN, 2012). The national energy assumes an increase of energy prices of approx. 17% per average household (excluding energy savings) (fig. 6). Figure 6: Average extra costs for the implementation of the national energy strategy
(source: Danish Government, 2012).
ESPON 2013 11

Denmark’s economic policy encompasses intensive green growth ambitions including intensified development of various kinds of renewable energy products. However, competitiveness has deteriorated in the past decade and productivity growth has been weak, eroding potential growth (OECD, 2013). The OECD (2013) currently states a potential of these green growth ambitions to translate into new sources of growth, but recommends also to review energy and climate change policies to achieve better results at low cost. Further challenges are the development of storage techniques and facilities as well as the reorganisation of electricity and pipeline networks. Another yet unsolved question is how the increasing consumption of oil products by the transport sector, especially road traffic, can be decreased and substituted by an alternative energy carrier.
2.3 Review of baseline data and data sources for Denmark Denmark has maintained a detailed statistics system for a long time. Therefore Denmark’s statistics agency Danmarks Statistik and the Danish energy agency Energi Styrelsen are able to provide detailed time series on energy data over the last three decades (since 1980). However, for single time series data is available only for certain time steps, e.g. 1980, 1990, 1995, and most of the accessible systematic data is available on national level only (NUTS 0). Danish regions and municipalities partly provide energy data for their territory on NUTS 2 or NUTS 3 level. But this data is provided only for single topics and selected time periods and is not accessible nationwide. Nonetheless, on national level comprehensive energy data is available providing insights on energy production, energy transformation, energy consumption, prices, taxation and economic values as well as international markets (import and export). This data is usually broken down into details such as energy consumption by economic sector by type of activity and by fuel type. This high degree of detail allows the traceability of energy flows on national level as shown in fig. 5 (see above). Spatial distinctions between energy productions in the marine versus the terrestrial environment are possible with some constraints. Extraction of oil and natural gas by Denmark occurs only in the North Sea and detailed data for these production types is available at least for single years. And data is also available on the capacity (but not on the actual production) of wind farms separated into marine areas and terrestrial areas. References - Denmark Danish Government (2011): Our Future Energy. Danish Ministry of Climate, Energy and Building. Copenhagen. ENS (2012): Overview map of the Danish power infrastructure in 2009 (map), http://www.ens.dk/en-US/Info/FactsAndFigures/EnergyInfoMaps/DownloadPremadeMaps/Documents/Kort_2009_ac_dc.png (last accessed: 2012-12-20) ENS (2013): Annual Energy Statistics 2011, http://www.ens.dk/EN-US/INFO/FACTSANDFIGURES/ENERGY_STATISTICS_AND_INDICATORS/ANNUAL%20STATISTICS/Sider/Forside.aspx (last accessed: 2013-02-13) KEMIN (2009): “The Danish example” – the way to an energy efficient and energy friendly economy, Danish Ministry of Climate, Energy and Building. Copenhagen. KEMIN (2012): Accelerating Green Energy, TOWARDS 2020 - The Danish Energy Agreement of March 2012.Danish Ministry of Climate, Energy and Building. Copenhagen.
ESPON 2013 12

OECD (2013): Economic Survey of Finland 2012, http://www.oecd.org/eco/economicsurveyofdenmark2012.htm (last accessed: 2013-02-13) Region Midtjylland. (2012). Perspektivplan for 50 % vedvarende energi i Region Midtjylland i 2025. Regional udvikling. Viborg: Region Midtjylland. UNESCO-UIS (2009): Global Education Digest 2009, Comparing Education Statistics across the World. Montreal. World Bank (2013): Doing Business 2013: Smarter Regulations for Small and Medium-Size Enterprises. Economy Profile: Denmark. Washington, DC: World Bank Group. DOI: 10.1596/978-0-8213-9615-5 WTO (2013): World Trade Organization - Trade Profiles, http://stat.wto.org/CountryProfile/WSDBCountryPFHome.aspx?Language=E (last accessed: 2013-02-13)
ESPON 2013 13
3. Germany 3.1 Context Germany (approx. 357,000 square kilometres, 81.8 million inhabitants) is the most populous member state in the European Union. Germany is one of the major political and economic powers of the EU. It is a member of the United Nations, NATO, the G8, the G20, the OECD and the Council of Europe. Germany has the world's fourth largest economy by nominal GDP and the fifth largest by purchasing power parity. Subsequently, it is the second largest exporter and third largest importer of goods. Given these facts, Germany and in particular it´s northern and north-western States (Länder) are of major importance in shaping the energy landscape of the European North Sea Region.
The energy policy of the German Federal Republic is an integral part of the energy policy principles of the European Union (BMWI 2012, BMU 2012). In 2007, in its action plan entitled “an Energy Policy for Europe,” the EU set an indicative target to be achieved by 2020 of reducing energy consumption in the EU by 20 % compared to the reference scenario. The European ESD forms a part of this implementation strategy. In addition, on 28 September 2010, against the backdrop of the ambitious European and national energy- and climate-policy targets the Federal government adopted a new energy concept for environmentally-friendly, reliable and affordable energy supply and in June 2011 supplemented it with further energy policy measures and accelerated its implementation. For the key area of energy efficiency and energy conservation, the energy concept included the target of reducing primary energy consumption by 20 % by 2020 compared to 2008.
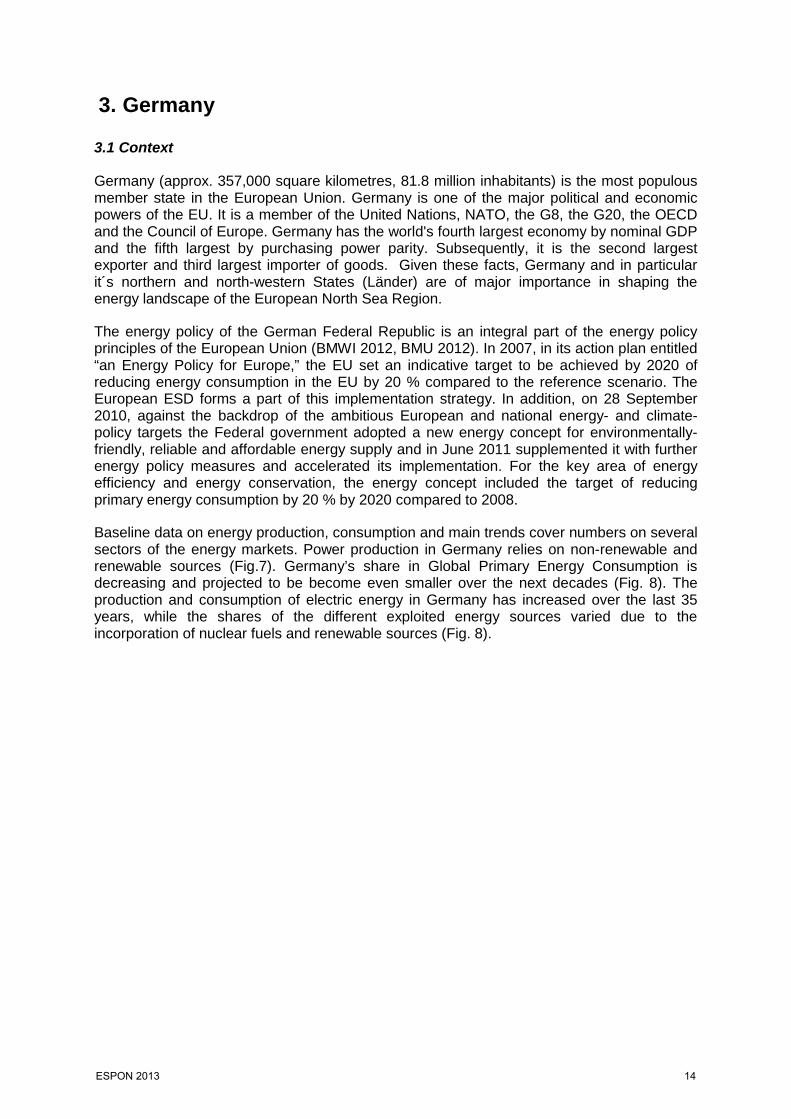
Baseline data on energy production, consumption and main trends cover numbers on several sectors of the energy markets. Power production in Germany relies on non-renewable and renewable sources (Fig.7). Germany’s share in Global Primary Energy Consumption is decreasing and projected to be become even smaller over the next decades (Fig. 8). The production and consumption of electric energy in Germany has increased over the last 35 years, while the shares of the different exploited energy sources varied due to the incorporation of nuclear fuels and renewable sources (Fig. 8).
ESPON 2013 14
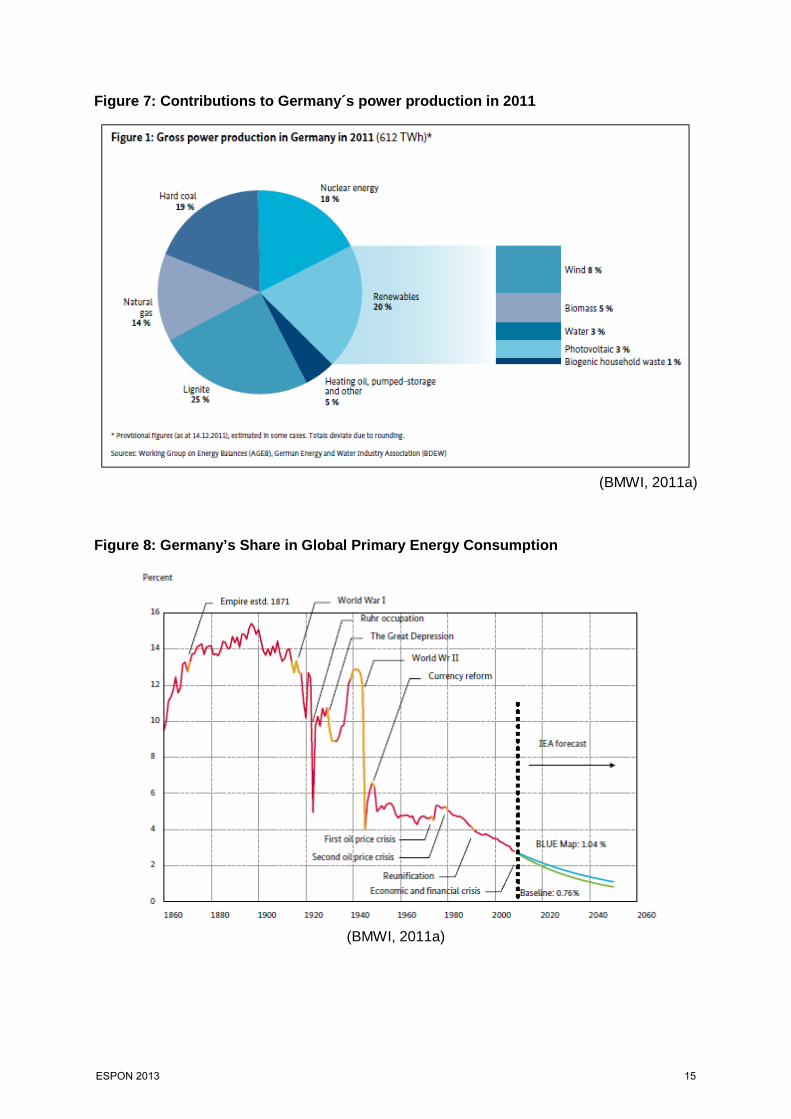
Figure 7: Contributions to Germany´s power production in 2011
(BMWI, 2011a)
Figure 8: Germany’s Share in Global Primary Energy Consumption
(BMWI, 2011a)
ESPON 2013 15

Figure 9: Historical trends in contributions to overall electricity generation in Germany
(BMU, 2012)
Several renewable sources gained more importance over the last year and contributed significantly to energy consumption in 2011 (Fig. 10).
The overall numbers on and shares in the German energy sector differ significantly if compared with data for the State level. The differences are due to the inhomogeneity of structural characteristics of the States. Fig. 11 provides an example for the annual energy flow on the State level. The wind energy sector exemplifies the differences in the State approaches to energy production (Fig. 12).
ESPON 2013 16

Figure 10: Contribution to the energy consumption mix in Germany in 2011
(BMU 2012)
Figure 11: Energy flow (in PJ) in the State Lower Saxony (Germany´s largest State with respect to the European North Sea Region). Data from 2008
(MU, 2009)
ESPON 2013 17

Figure 12: German wind energy capacity on the State level
(BMU, 2012)
3.2 Drivers of German energy policy
The Federal Government of Germany set out its binding Energy Concept in September 2010. The Concept was subsequently updated following the reactor failure that occurred in Japan in 2011. The revised objective is now to achieve the transition to an era of renewable energy within an even shorter time frame. However, the Energy Concept’s guidelines for an environmentally sound, reliable and affordable energy supply remain unchanged. The same is true of the quantitative targets that extend as far as 2050 and specify the main features of an energy supply for Germany (BMWI 2011 a).
The long-term objectives are of particular importance to the future direction of energy research policy (BMWI, 2011b). The key targets for 2050 are as follows: (i) Reduce emissions of greenhouse gases by between 80 percent and 95 percent compared with 1990 (by 40 percent by 2020), (ii) Cut primary energy consumption by 50 percent compared with 2008 and (iii) Curb overall electricity consumption by approximately 25 percent compared with 2008 (by 18 percent by 2020), (iv) Ensure that energy from renewable sources accounts for 60 percent of gross final energy consumption (18 percent by 2020) or 80 percent of gross electricity consumption (at least 35 percent by 2020). The energy agendas set at all the levels of the German political and administrative system (from Federal via -State to -regions and municipalities) consider this framework. The energy strategies and schemes, however reflect the different natural and societal conditions and the geographical and political context.
German activities to reach the EU energy and climate targets were challenged by the decision to shut down all nuclear power plants earlier than planned. This so called German Energiewende (transition) rose to the challenge two years ago. Activities need to be sped up to set the German energy supply system on a new footing by the middle of the century. Whilst around 80 % of electricity currently comes from conventional sources, renewable
ESPON 2013 18

energy should account for at least 80 % of electricity production 40 years from now. This goes hand in hand with the necessary grids, power stations and storage technologies, and therefore involves the development of a completely new energy system (BMWi, 2012)
The national framework (BMWI 2011 b, BMU 2012) defines some priority goals thus providing a catalyst for action in political and economic sectors and society as a whole. The basic statements of the framework are (i) the restructuring of the energy system must be as cost effective as possible, (ii) grid expansion is the foundation for the continued development of renewable energy, (iii) new gas- and coal-fired power stations necessary to safeguard future supply security, (iv) closer market integration of renewable energy is important, (v) energy research drives growth and investments in new energy technology, (vi) better energy efficiency is a central requirement for restructuring the energy system, (vii) partnership with European countries as partner to restructure the energy system in Germany plus (viii) a good foreign energy policy guarantees a secure energy supply.
3.3 Trends in energy production and consumption
For the German national level a comprehensive view on the trends in relevant fields of energy has been developed (BMAS 2005), work is in progress to update this view according to recent developments and the needs of the Energiewende. Basic projections up to 2030 are:
- Final energy consumption will decline in all demand sectors by 2030. Electricity and natural gas will increase their respective shares. Households will consume some 14 % less energy in 2030 than in 2002. Owing to the increasing use of electrical devices, electricity consumption will not decline until after 2020.
- Energy demand will decline by 23 % in the agricultural sector, commercial, services and other consumption areas by the year 2030. The energy mix will change considerably. Consumption of all energy sources will fall except for renewable energies. Final energy consumption in industry will decline by a total of 7 % by 2030. The demand for electricity will increase. Final energy consumption in the transport sector will decline by just under 4 % by 2030 owing to increasingly efficient vehicles. Conventional diesel fuel and bio fuels will take on considerably more importance.
- Electricity will increasingly be produced in Germany from natural gas. Domestic lignite will move up to second place. The renewables will account for 38 % of power station capacities and cover 26 % of gross electricity production at the end of the forecast period.
- District heating will decline. Savings in the heating sector will be responsible for the drop. The share of final energy consumption accounted for by district heating will remain unchanged at some 3 %. Hard coal, lignite, and fuel oil will be nearly entirely replaced in district heating by waste, biomass, and natural gas.
- Renewable energies' share of primary energy consumption will rise from 3.4 % in 2002 to 11.5 % in 2030. More than half of the increase will be accounted for by electricity production, a quarter of which will rely on renewable energies in 2030. Renewable fuels will cover 8 % of fuel needs in 2030.
- Primary energy consumption in Germany will fall in the long term. This represents a new trend and a break from the past. Per capita energy consumption will be 12 % lower.
ESPON 2013 19

- The structure of primary energy consumption will change considerably in the forecast period. The share of gas and renewable energies will expand while coal will lose significance.
These projections are based on a set of assumptions on future socio-economic developments. The positive impact of continual growth in the renewable energy sector in the German States of the European North Sea region is already contrasting certain assumptions on the demographic changes and market behaviour of the trend study on the national level (BMAS, 2005):
- There will be no fundamental changes in the framework conditions determining the trend in the energy sector up to the year 2030. Democracy and the market economy will remain the underlying principles of society. Energy usage will not be subject to any revolutionary changes. For the majority of consumers, energy does not capture the focus of attention.
- Demographic changes are determining social development. The number of persons living in Germany will decline by 2030, and the population will age significantly. The economy will expand at an annual average of 1.4 %. Additional jobs will be created in the service sector. The industrial base will be sustained. Technological advances will boost energy efficiency.
- Energy policy measures will reinforce the rational use of energy. Technical innovation will mainly be implemented as part of normal investment cycles. Revolutionary innovations should not be anticipated.
- Energy prices for final users will be determined by international energy prices, domestic processing and transportation costs, and taxes and other levies. Transport and distribution costs will decline in real terms.
- Energy tax rates will remain constant in real terms. The promotion of renewable energies will be continued during the entire forecast period. Emission trading will be expanded far beyond the borders of the EU. To ensure the participation of many countries, reduction commitments and thus certificate prices will remain moderate.
Specific trends in regional energy production/consumption or policies (within North Sea regions) different from national level can be expected from the on-going development of the northern States as an area of net energy production which needs to exported to other German regions. Wind energy (on shore and off shore) and bioenergy are the main contributors. Grid integration (all types of energy carriers and respective grids) are and will be crucial.
3.4 Review of baseline data and data sources for Germany Main Sources
Many relevant data on the German national and the sub-national regions are available via EU stats. Pan-European Associations representing the energy sector provide valuable data on the German situation as well.
The statistics agencies of Germany and the single Länder provide data on the energy production/consumption plus contributions of involved sectors. Time series are available over different periods, but with a good coverage of the last three decades.
ESPON 2013 20

Comprehensive energy data is available providing insights on energy production, energy transformation, energy consumption, prices, stakeholders, taxation and economic values as well as international markets (import and export). This data is usually broken down into details such as energy consumption by economic sector by type of activity and by fuel type. This high degree of detail enables tracing of energy flows.
Regional level data and below
Fragmented information is accessible on the NUTS2 and NUTS 3 level. For certain time spans and more local settings only, data on the energy production and the energy transmission is available for the renewable energy sector. Some of the data sets are detailed and enable further statistics on processes in energy generation, energy consumption and the interaction predictions within the energy market.
Marine/Terrestrial Sources
The spatio-temporal coverage of data sets on the marine and terrestrial realms differs. This reflects the traditions in the energy exploitation (oil/gas extraction on shore and off shore) and the progress in the construction of off shore wind installations.
References – Germany BMAS - Federal Ministry of Economics and Labour (2005): EWI/Prognos Study on The Trend of Energy Markets up to the Year 2030. 44p BMU - Federal Ministry for the Environment, Nature Conservation and Nuclear Safety (2012): Development of renewable energy sources in Germany 2011. 52 p. BMWI - Federal Ministry of Economics and Technology (2011a): Research for an environmentally sound, reliable and affordable energy supply - 6th Energy Research Programme of the Federal Government. 114 p. BMWI - Federal Ministry of Economics and Technology (2011b): Second National Energy Efficiency Action Plan (NEEAP) of the Federal Republic of Germany. 111 p. BMWI - Federal Ministry of Economics and Technology (2012): Germany’s new energy policy Heading towards 2050 with secure, affordable and environmentally sound energy. MU - Lower Saxony State Ministry for the Environment, Energy and Climate Protection (2005) - Das Energiekonzept des Landes Niedersachsen. 80 p (in German). MU - Lower Saxony State Ministry for the Environment, Energy and Climate Protection (2009) - Niedersächsische Energie- und CO2-Bilanzen 2009. 41 p (in German).
ESPON 2013 21

4. The Netherlands
4.1 Context In 2011 the primary production of energy in The Netherlands lay at roughly 2.700 petajoule (PJ). 90% of this production stemmed from gas, 5% from renewable sources with biomass (3,5%) being the most important among these (Statline, 2013a). In the same year the gross inland energy consumption was 3.250 PJ (Statline, 2013b). Consumption patterns, when looking at the percentage with which sectors participated in the final consumption (2.100 PJ), resembled European averages, with the exception of consumption by agriculture (6% compared to a European average of 2%). Dutch households consumed, compared to European averages, relatively little energy (19% versus 27%). When distinguishing consumption by energy source, gas (45%), oil (38%) and coal (10%) had the largest shares. The export of gas from Dutch gas fields grants The Netherlands a, in comparison to other European countries, low energy dependency. The Dutch economy relied in 2011 for 30% upon imports in order to meet its energy needs (Eurostat, 2013). Targets of Dutch energy policies have changed over recent years. In 2012 they were set at a 20% reduction of CO2 emissions in 2020 (in respect to 1990), a production of 16% of the total energy production from renewable sources in the same year and energy savings of 2% per year (Ministerie van Economische Zaken, Landbouw & Innovatie, 2012a). In September 2013 the Dutch Energie Akkord (Energy Agreement) was published (SER, 2013). In this most recent document on Dutch national energy policies, targets are set at a 1,5 % reduction of the total energy consumption per year, total energy consumption savings of 100 PJ until 2020 and a production of 14% of the total energy production from renewable sources in 2020 (16% in 2023). Without being expressed in concrete benchmarks, applied policy is often associated with energy security (Ministerie van Economische Zaken, Landbouw & Innovatie, 2012b).
4.2 Dutch Policy Drivers Policies to achieve benchmarks are largely taken by the Dutch ministry of economic affairs. Many measures seek to realize CO2 reductions while sustaining the important role that the Dutch grey energy sector takes in the production, refinement and trading of energy carriers in North West Europe. As a recent ex-ante evaluation of policy measures (Planbureau voor de Leefomgeving (PBL) & Energieonderzoek Centrum Nederland (ECN), 2012) demonstrates, the most critical building stone in Dutch energy policies is the European Emission Trade System (ETS). The Dutch government intends to broaden the application of this system by including other than the up until now defined economic sectors in the trading of rights. As shown above, gas plays an important role in Dutch energy market structures and, more general, the Dutch economy. The Dutch government intends to, by pointing at the relative low CO2 emissions that production of energy from gas causes, consolidate this role. Dutch gas fields are acknowledged to be finite though (Ministerie van Economische Zaken, Landbouw & Innovatie, 2012a). By a range of measures, among them the facilitation of storage and transport capacities and diplomatic and trade missions the government supports a transition of the gas sector from being focused on winning to being focused on the trading and refinement of gas (Ministerie van Economische Zaken, Landbouw & Innovatie, 2011). Another important issue in energy policies that sustain existing production patterns while reducing CO2 emissions is C2C. Plans for on-land storage have in 2011 been abandoned since siting problems could not sufficiently be tackled. At the moment the government
ESPON 2013 22

investigates the storage of CO2 in the North Sea bed through pilot projects. Fiscal measures aim at more sustainable consumption patterns by transport. The Dutch Centraal Bureau voor de Statistiek (Central Office for Statistics) (2012) has investigated which policies have contributed most to an increase of the use of energy from renewable resources in recent years. It concludes that (1) the provision of subsidies for the production of energy from renewable resources (under discussion since 2009 and likely be replaced by a feed-in tariff in the near future) and (2) the obligation of the transport sector to add bio-fuels to fossil fuels were most effective. The Dutch legal framework for gas and electricity production has been reformed in 2012. The revision introduces new regulations, among them the obligation to add biomass to the winning of energy from coal. The most important aim of the reform is the liberalization of the Dutch gas and electricity market tough. The Dutch government recognises that the stimulation of the production and consumption of energy from renewable resources can not be covered through generic policies only as the issue is too complex. To address specific initiatives it supports the formation of voluntary agreements, called ‘green deals’, among market parties, knowledge institutes and lower levels of government through funding. Despite the recognition that a change of energy market structures has multiple implications for spatial development (Ministerie van Infrastructuur en Ruimte, 2011) the Ministerie van Infrastructuur & Milieu (ministry of Infrastructure & the Environment) takes a marginal role in achieving the benchmarks that are set. The recently published national structural vision (Ministerie van Infrastructuur en Milieu, 2012) includes guidelines for the location of pipe lines, on-land and off-shore wind production and new electricity power lines. Most of these spatial measures are associated with the so called Rijkscoordinatieregeling (national regulation on coordination). This regulation allows the national government to make own land use plans, a responsibility that the Dutch planning system usually allocates to the municipal level. Spatial development in the North Sea falls by definition under this regulation. The formulation, implementation, coordination and integration of energy policies that do not fall under this regulation are in the hands of lower levels of government. Specifically provinces and city regions seek for interpretations. All Dutch provinces that are part of the North Sea region as well as a range of governance arrangements in the area have drawn up structural visions to guide spatial development that leads to more sustainable production and consumption of energy. Regional energy self-sufficiency is a re-occurring theme is these visions under construction. There are, however, currently nor regional energy authorities nor policies to address specific trends in regional energy production and consumption. Most recently, in 2013, the Dutch national government has investigated societal support to implement ambitioned changes to Dutch energy production and consumption patterns. For this purpose it addressed several types of non-governmental organisations, notably civil, employee, financial, entrepreneur and housing organisations. Under the guidance of the Dutch Sociaal Economisch Raad (Council for Social and Economic Affairs) these groups negotiated with the government on a refinement of the general benchmarks set out earlier as well as measures to meet them. In the Energy Agreement (SER, 2013) civil and housing organisations agreed that all houses in The Netherlands should be energy neutral in 2050. To monitor progress a certificate system of energy labels was decided upon, including differing obligations for buildings in the private and social housing segment. This approach, in which the largest portion of energy savings is realized through an improvement of the built environment, will be supported financially and through information campaigns by the government. Housing organisations also concurred to contribute to the realization of 1 mio households and businesses gaining energy from de-central, renewable sources. Governmental support in this respect is intended through the reduction of regulations and taxes.
ESPON 2013 23

Ambitions related to transport were refined to a 60% reduction of CO2 emissions in 2050 and 15-20 PJ energy savings in 2020. Most measures proposed to meet these targets are fiscal (including a tax system that takes account of distances travelled and mobility budgets). Provinces and municipalities are expected to consider benchmarks for sustainable transport in land use planning. The document also incorporates the ambition that all newly sold cars in 2035 should be CO2 emission free. Employer’s and employee’s organizations agreed to create at least 15.000 new jobs in the sustainable energy sector. Entrepreneurs intend to support the creation of these jobs by education and training programs. The Dutch government promised in turn to invest in innovative clean tech pilot projects, act as a launching customer for these projects and reduce regulations for the benefit of experimental approaches. Agreements also relate to distinct economic segments. The agriculture sector (green houses) agreed to contribute substantially to energy savings. Industries with intensive energy needs agreed with the government on intended improvements of the ETS (including custom fit application arrangements), a more intense use of residual heat, a release from obligations related to cogeneration and a stricter enforcement of the Dutch Environmental Management Act. Energy producing industries agreed to realize specified amounts of renewable energy (specifically on and off shore wind energy) and invest in smart grids.
4.3 Review of baseline data and data sources for the Netherlands
The main source of publicly available energy data in The Netherlands is the Centraal Bureau voor Statistiek (Central Office for the Statistics) (CBS). This organisation publishes energy data on the production and consumption of energy in The Netherlands, among this the Dutch energy balance. The only data set by the CBS that includes regional accounts describes the development of the production of energy from wind power in Dutch provinces (NUTS2). In this dataset the North Sea is an own spatial unit. It is thus possible to distinguish productivity in a marine versus a terrestrial environment. For this inception report the Planbureau voor de Leefomgeving (Dutch Environmental Assessment Agency) (PBL) was consulted on the availability of regional energy data. They confirmed a lack of data on the development of energy market structures in regions. To investigate spatial policies, The PBL makes use of estimations in which detailed insights into national accounts are combined with spatial data (see for an example PBL, 2012). The availability of data at the different provinces that fall within the North Sea Region has not yet been investigated.
ESPON 2013 24

References – the Netherlands Centraal Bureau voor de Statistiek, 2012. Hernieuwbare energie in Nederland 2011. Den Haag: Centraal Bureau voor de Statistiek.
Eurostat, 2013. Energy dependence. Available online at http://epp.eurostat.ec.europa.eu. Accessed 5 February 2013.
Ministerie van Economische Zaken, Landbouw & Innovatie, 2011. Kamerbrief. Voortgangsrapportage Gasrotonde 2011. Available online at www.rijksoverheid.nl. Accessed 5 February 2013.
Ministerie van Economische Zaken, Landbouw & Innovatie, 2012a. Energierapport 2011. Den Haag: Ministerie van Economische Zaken, Landbouw & Innovatie.
Ministerie van Economische Zaken, Landbouw & Innovatie, 2012b. Naar de Top. Het bedrijvenbeleid in actie(s). Den Haag: Ministerie van Economische Zaken, Landbouw & Innovatie.
Ministerie van Infrastructuur en Milieu, 2011. Verkenning Energietransitie en Ruimte. Den Haag: Ministerie van Infrastructuur en Milieu.
Ministerie van Infrastructuur en Milieu, 2012. Structuurvisie Infrastructuur en Ruimte. Nederland concurrerend, bereikbaar, leefbaar en veilig. Den Haag: Ministerie van Infrastructuur en Milieu.
Planbureau voor de Leefomgeving (PBL) & Energieonderzoek Centrum Nederland (ECN), 2012. Referentieraming Energie en Emissies: Actualisatie 2012. Energie en emissies in de jaren 2012, 2020 en 2030. Den Haag: Uitgeverij PBL.
Planbureau voor de Leefomgeving (PBL), 2012. Vesta ruimtelijk energiemodel voor de gebouwde omgeving. Data en methoden. Den Haag: Uitgeverij PBL
Sociaal Economisch Raad (SER), 2013. Energieakkord voor duurzame groei. Available online at http://www.energieakkoordser.nl/
Statline, 2013a. Energie; verbruik en producentenprijs naar energiedrager. Available online at http://statline.cbs.nl/statweb/. Accessed 5 February 2013.
Statline, 2013b. Energiebalans; kerncijfers. Available online at http://statline.cbs.nl/statweb/. Accessed 5 February 2013.
ESPON 2013 25

5. Norway
5.1 Energy policies in a Nordic context
Norwegian energy policies are closely interrelated with the other Nordic countries and there are several common features in their energy policies. Norway has, as the other Nordic countries very long-term ambitious goals towards decarbonising their energy systems. Decarbonisation is vital in the areas of electricity generation and energy use in industry, transport and buildings; it also requires deployment of carbon capture and storage (CCS) for cost-effective reduction of greenhouse-gas (GHG) emissions (IEA 2012).
In order to achieve this goal Nordic electricity generation needs to be fully decarbonised by 2050. This implies that wind power must play a more important role in energy supply and that the need for flexible generation capacity, grid interconnections, demand response and electricity storage will increase. A significant reduction in direct industry emissions is also needed but energy efficiency and use of new technologies must be aimed for in all sectors. Norwegian industry is characterised by a high share of energy-intensive industries and, together with the other Nordic countries, except Denmark, uses more energy per unit of GDP than the OECD average. Transport requires the most dramatic emissions slash, and although direct CO2 emissions in the building sector are relatively low, emissions associated with the energy used in buildings must be significantly reduced. These two sectors make up for 80 % of energy consumption in Norway, the main bulk being concentrated in the larger cities. The decarbonising goals will require limiting growth in transport demand, substantial reductions in technology costs, securing a sustainable bio fuel supply and intelligent modal shifts. In the building sector, in addition to decarbonising electricity supply, retrofits of older building stock are needed to achieve the necessary energy efficiency. In the longer term, more advanced building technologies, urban planning, and intelligent systems that empower consumers and encourage behavioural change are required.
5.2 Norwegian energy production and use
The Norwegian energy system utilises both renewable and non-renewable resources. Renewable energy is converted from resources such as water, wind, bio mass and tidal water to electricity or heating. Norway is a large producer of energy and a net exporter but mainly of non-renewable energy such as fossil fuel. It is the seventh largest oil producer and the second largest gas producer in the world (Norwegian Petroleum Directorate). Norway is also the sixth largest producer of hydro power in the world and the largest one in Europe (NOU 2012:19). According to the Energy balance sheet for Norway the production of primary energy commodities was 2 314 TWh in 2011. The main bulk of this - 2 058 TWh - which is mainly oil and gas, was exported. Net domestic supply amounts to 326 TWh. A more detailed picture of the various energy sources shows that crude oil stands for 970 TWh and natural gas for 1 046 TWh. Extraction of crude oil and gas on the Norwegian continental shelf amounts to more than 90 per cent of the total production of primary energy carriers in Norway. The gross product from oil and gas production in 2008 amounted to around 24.8 per cent of the GDP in Norway .The third largest energy source is waterfall and wind, but wind power represents only about 1 % of the electricity supply in Norway (http://www.vindportalen.no). Expected production of wind power in 2012 is from 1.5 -1.7 TWh, and approximately 7 – 8 TWh in 2020. There are several plans for wind power plants along the Norwegian coast in all parts of Norway. These areas are exposed to frequent and strong wind, particularly in autumn, winter and spring when the need for energy is highest. There is no energy production from nuclear power in Norway.
ESPON 2013 26

The total energy consumption in Norway1 amounted to 282 TWh in 2009. Much of this energy is used in manufacturing industries, households, oil and gas extraction and road transport. In the period 1990-2009, the total energy consumption in Norway rose by 28 per cent (see Figures 13 and 14 for energy and electricity consumption trends from 1990 to 2007).
Figure 13: Norwegian Energy Consumption, 1990-2007
Source: Statistics Norway
Figure 14: Norwegian Electricity Consumption, 1990-2007
Source: Statistics Norway
1 Including households, excl. shipping and energy used as raw materials. Note that the energy used in the energy sectors is included in the figure (Statistics Norway)
ESPON 2013 27

An important reason for the large increase in energy consumption in Norway is the increased activity in oil and gas extraction and road transport (SSB 2011). Around 50 per cent of the end consumption of energy is electricity and hydropower accounts for about 98-99 per cent of the total electricity production. Petroleum products are the second largest user category with 35 per cent. Transport, energy-intensive industry and households represent the three largest energy consumption user groups. Energy-intensive industry and households are also responsible for the largest electricity consumption. When looking more closely into energy consumption by industry and energy source a clearly divided picture appears. Figure 15 shows that the transport sector almost completely relies on oil products and fisheries and agriculture also uses mainly oil products.
Figure 15: Energy Consumption by Industry and Source, 2007
Source: Statistics Norway
The picture is more mixed for the other sectors. Households, electricity-intensive industries, services and construction use mainly electricity from waterfalls; for manufacturing industries approximately half of the energy comes from electricity. Within household energy consumption, Figure 16 shows that electricity and petroleum products make up the biggest sources of energy, while other fuels and sources make up only a small share of energy consumption.
ESPON 2013 28
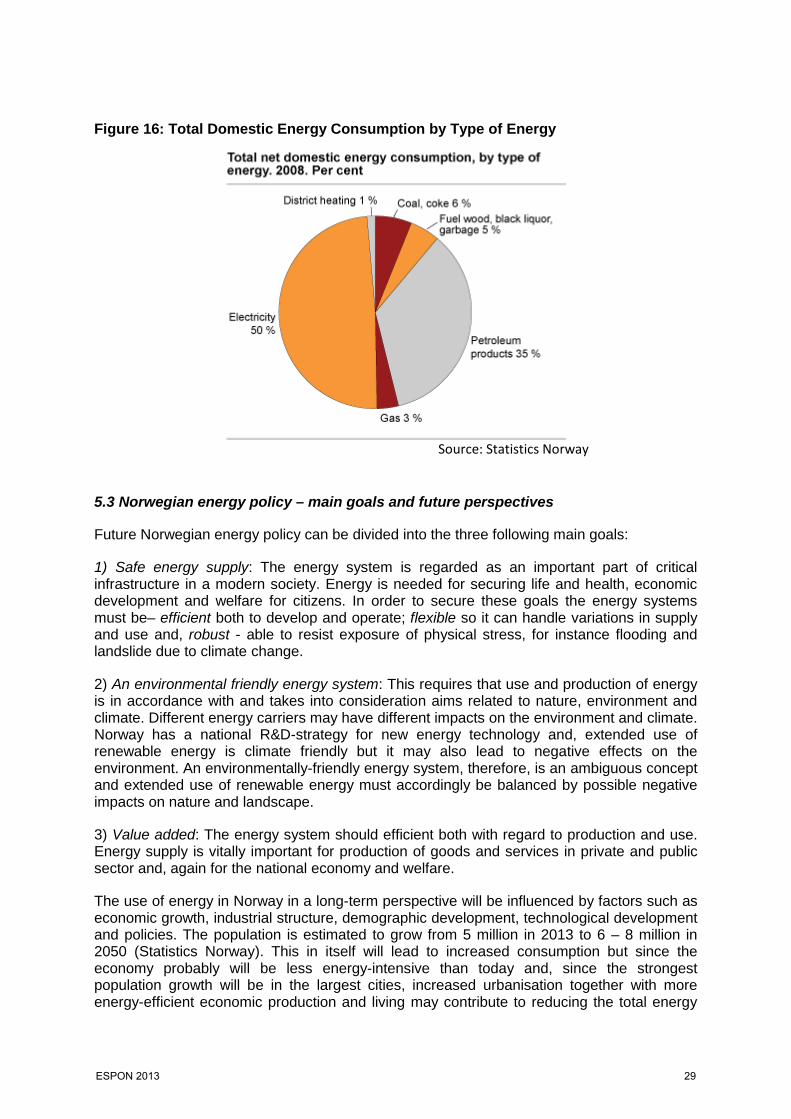
Figure 16: Total Domestic Energy Consumption by Type of Energy
Source: Statistics Norway
5.3 Norwegian energy policy – main goals and future perspectives
Future Norwegian energy policy can be divided into the three following main goals:
1) Safe energy supply: The energy system is regarded as an important part of critical infrastructure in a modern society. Energy is needed for securing life and health, economic development and welfare for citizens. In order to secure these goals the energy systems must be– efficient both to develop and operate; flexible so it can handle variations in supply and use and, robust - able to resist exposure of physical stress, for instance flooding and landslide due to climate change.
2) An environmental friendly energy system: This requires that use and production of energy is in accordance with and takes into consideration aims related to nature, environment and climate. Different energy carriers may have different impacts on the environment and climate. Norway has a national R&D-strategy for new energy technology and, extended use of renewable energy is climate friendly but it may also lead to negative effects on the environment. An environmentally-friendly energy system, therefore, is an ambiguous concept and extended use of renewable energy must accordingly be balanced by possible negative impacts on nature and landscape.
3) Value added: The energy system should efficient both with regard to production and use. Energy supply is vitally important for production of goods and services in private and public sector and, again for the national economy and welfare.
The use of energy in Norway in a long-term perspective will be influenced by factors such as economic growth, industrial structure, demographic development, technological development and policies. The population is estimated to grow from 5 million in 2013 to 6 – 8 million in 2050 (Statistics Norway). This in itself will lead to increased consumption but since the economy probably will be less energy-intensive than today and, since the strongest population growth will be in the largest cities, increased urbanisation together with more energy-efficient economic production and living may contribute to reducing the total energy
ESPON 2013 29

consumption. However, this requires increased energy efficient use and more production based on renewable energy sources.
The climate policy globally and in EU and Norway requires a substantial change in Norwegian energy policy and strong efforts geared to greater renewable energy production. The EU "20-20-20" targets, set three key objectives for 2020 - a 20% reduction in EU greenhouse gas emissions from 1990 levels; raising the share of EU energy consumption produced from renewable resources to 20% and; a 20% improvement in the EU's energy efficiency. Norway has a very high share of renewable energy compared to other countries; it increased from approximately 58% in 2005 to 62% in 2008 (Bøeng 2011). This is mainly due to easy access to hydro power. In negotiations with EU Norway has committed itself to a share of renewable energy of 67.5% in 2020.
Norway has high ambitions and has also implemented several measures which will contribute to reduce total use of energy and increase renewable energy production and use. Greenhouse gasses shall be reduced by 30 per cent in 2020 compared to 1990 levels. Approximately two third of the reductions will take place in Norway whereas the rest will be solved by Emission Trading. In addition there are several incentives for stimulating energy efficiency in the building sector and projects to increase use of renewable energy in the transport sector. Norway will have few problems to fulfil the renewable energy target in general but may face problems related to the transport target in the EU Renewable Directive (2009/28/EC) which aims at a 10% share of renewable energy in the transport sector. In Norway this share was only 3.3% in 2008.
5.4 Baseline data, information and trends for Norway Data from Statistics Norway (SSB) has information on how much energy is produced (and in what way) and how much is consumed and to what extent the country is self-sufficient. Data are data available on a temporal basis to ascertain trends. There any significant regional variations in energy production and consumption but the energy grid is integrated in national and Nordic grids. Most data on energy and consumption is publicly available from SSB at all NUTS level and LAU level. Information on how much energy comes from the marine as opposed to the terrestrial environment is available. Oil and gas, and partly wind energy comes from the marine, waterfall from terrestrial environment. References – Norway Ann Christin Bøeng, Elisabeth Isaksen, Sadiya M. Jama og Marita Stalund (2011), Energiindikatorer for Norge 1990-2009, Statistics Norway.
EU Renewable Directive (2009/28/EC)
IEA (2012), Nordic Energy Technology Perspectives. Pathways to a Carbon Neutral Energy Future.
Vindportalen (2013), http://www.vindportalen.no
Norwegian Petroleum Directorate, http://www.npd.no/en/
NOU 2012:19. Energiutredningen. Verdiskaping, forsyningssikkerhet og miljø.
Statistics Norway, www.ssb.no
ESPON 2013 30
6. Sweden 6.1 Context
Swedish energy production/supply2
• Total primary energy supply (TPES):
48.9 Mtoe (renewables 35.5%, nuclear 32.5%, oil 25.3%, coal 4.1%, natural gas 2.4%) +2.8% since 2000
• TPES per capita: 5.2 toe (IEA average: 4.7 toe)
• Electricity generation: 150.5 TWh (hydro 44.1%, nuclear 40.5%, biofuels and waste 8.5%, wind 4%, natural gas 1.2%, coal 0.8%, oil 0.5%, peat 0.4%) +3.6% since 2000
• Inland energy production: 33.9 Mtoe, 69.3% of TPES
• Import: 15 Mtoe, 30.7% of TPES
In 2011, Sweden’s total primary energy supply (TPES) was 48.9 million tonnes of oil equivalent (Mtoe), a level which has remained fairly stable over the last three decades with a sharp drop in 2009 amid the global financial and economic crisis (see Figure 17). Fossil fuels, oil, coal and natural gas, represented 31.8% of TPES in 2011. Sweden is the IEA member country with the lowest share of fossil fuels in its energy mix (without nuclear). The average share in IEA member countries was 81% in 2011. Sweden’s share of coal accounted for 4.1% and natural gas for 2.4%, compared to the IEA average of 20% and 25% respectively. Oil accounts for the lion’s share of the fossil fuels supplied to Sweden, amounting to 25.3% of TPES and 78.2% of all fossil fuels.
2 Source: Energy Policies of IEA Countries: Sweden 2013 IEA/OECD Paris, 2013; Energy Balances of OECD Countries, IEA/OECD Paris, 2012.
ESPON 2013 31

Figure 17: Sweden’s Total Primary Energy Supply, 1973-2011
* Provisional for 2011. ** Negligible.
Source: IEA/OECD (2013) Energy Policies of IEA Countries: Sweden, 2013
Nuclear makes a large contribution to the Swedish electricity mix, accounting for 15.9 Mtoe or 40.5% of its electricity generation in 2011 (as shown in Figure 18 below). Sweden’s share of nuclear in TPES was the second-highest among IEA member countries after France. Figure 18: Sweden’s Energy Production by Source, 1973-2011
* Provisional for 2011. ** Negligible.
Source: IEA/OECD (2013) Energy Policies of IEA Countries: Sweden, 2013
ESPON 2013 32

Rich natural resources and efficient, long-term policies rewarding renewable energy make Sweden rank third-highest among IEA member countries in terms of the share of renewable energy in TPES, reaching just over 35% in 2011. This is mainly due to both the second-highest share of biofuels and waste (22.7% of TPES) after Finland and the fourth-highest share of hydro (11.7% of TPES). Swedish energy consumption/demand3 • Total final consumption:
33.7 Mtoe (oil 32.5%, electricity 32.1%, renewables 18.7%, heat 12.9%, natural gas 1.9%, coal 1.7%), -4.4% since 2000.
• Consumption by sector: Industry 39.3%, transport 24.1%, residential 22.5%, services and other 14.1%. Consumption in Mtoe per sector is shown in Figure 19 below.
Figure 19: Total Final Energy Consumption by Sector, 1973-2011
* Provisional for 2011.
** Other includes commercial, public service, agricultural, fishing and other non-specified sectors. Source: IEA/OECD (2013) Energy Policies of IEA Countries: Sweden, 2013
Around 15 Mtoe of TPES was used in transformation in 2011; therefore, total final energy consumption (TFC) was 33.7 Mtoe in 2011. This constitutes a 4.2% decline from 2010 and a 5.8% recovery from 2009 levels in the economic downturn. The industry sector consumed the largest share of energy, accounting for 13.3 Mtoe or 39.3% of the country’s final consumption. It was followed by transport (24.1%) and the residential sector (22.5%), while the commercial, public services and agricultural sectors amounted to 14.1% of total final consumption in Sweden in 2011.
3 Source: Energy Policies of IEA Countries: Sweden 2013 IEA/OECD Paris, 2013; Energy Balances of OECD Countries, IEA/OECD Paris, 2012.
ESPON 2013 33

6.2 Main trends and projections4
According to the latest long-term projections of the Swedish Energy Agency, Sweden’s total final consumption is expected to grow up to 2020, while remaining stable in the following decade up to 2030. Different sectors of the economy are forecast to exhibit different trends. Under the reference scenario, total final consumption in Sweden will increase by 10.4% to 37.2 Mtoe in 2020, with most of the increase expected to come from the industrial sector. Consumption growth will slow to 1.8% over the period to 2030, reaching 37.9 Mtoe. The reference scenario assumes that new nuclear will replace existing reactors after 60 years of operation. Industrial consumption is expected to increase by 28.5% up to 2030, as the economic recovery was faster than expected, thus fostering Swedish industrial growth, but also electricity and coal use in the iron and steel, and pulp and paper industries. Industrial consumption will grow by 24.2% by 2020, and a further 3.5% in the years to 2030. This increase in energy consumption in the industrial sector is expected however to be compensated by lower consumption in the commercial sector, in particular thanks to expected energy efficiency gains in buildings. Residential energy consumption will grow at a slower rate of 9.1% to 2030, while transport usage will remain relatively constant, growing by a mere 0.5% over the nineteen years. The transport, commercial and residential sectors are expected to experience much slower growth in consumption compared to industry mainly due to an increase of renewable energy usage, including biodiesel (rapeseed-oil methyl ester or FAME), hydro-treated vegetable oils (HVO) and biogas. Sweden considers that it can reach its 2020 renewable energy target of 10% in transport already around 2015. In the residential sector, the increased use of heat pumps could largely replace existing electric heating. Energy use in the transport sector is projected to fall slightly to 2020, with a recovery in the ten years to 2030. The Swedish Energy Agency’s projections indicate that energy supply from biofuels and waste is to steadily increase from 22.7% in 2011 to around 25.3% of TPES in 2030 (see Figure 20). After 2030, most of the growth is expected to come from wind power which is to grow slowly between 2020 and 2030 but strongly between 2030 and 2040. According to the long term forecast of the Swedish Energy Agency, electricity generation in Sweden is expected to total 175 terawatt-hours (TWh) with electricity exports of 24 TWh in 2020 and 23 TWh in 2030. This surplus would emerge with increased electricity generation, with additions coming from nuclear, combined heat and power (CHP) and wind power, and only a moderate increase in electricity use to reach 152 TWh.
4 Sources: Energy Policies of IEA Countries: Sweden 2013 IEA/OECD Paris, 2013; Energy Balances of OECD Countries, IEA/OECD Paris, 2012; submission by the Swedish government to the IEA.
ESPON 2013 34

Figure 20: Total Primary Energy Supply Projections for Sweden to 2030
*Negligible.
Source: IEA/OECD (2013) Energy Policies of IEA Countries: Sweden, 2013
6.3 Dimensions driving Sweden’s energy policy towards Europe’s 20:20:20 goals5
Sweden’s energy policy – integrated with climate policy – is guided by two government Bills 2008/09:162 and 163) which were approved by the Swedish Parliament in 2009. The bill on En integrerad energi- och klimatpolitik or “integrated climate and energy policy” sets out ambitious targets in support of and beyond the 20/20/20 objectives of the EU, in pursuit of a sustainable policy for the environment, competitiveness and long-term stability. Short- to medium-term targets for 2020: • 40% reduction in greenhouse gases (GHGs) or about 20 million tonnes of carbon dioxide
equivalent (Mt CO2-eq), compared to 1990, to be achieved outside the European Union Emissions Trading Scheme (EU-ETS) with two-thirds in Sweden and one-third by investments in other EU countries or the use of flexible mechanisms;
• at least 50% share of renewable energy in the gross final energy consumption; • at least 10% share of renewable energy in the transport sector; and • 20% more efficient use of energy compared to 2008 The long-term priorities: • by 2020, Sweden aims to phase out fossil fuels in heating; • by 2030, Sweden should have a vehicle stock that is independent of fossil fuels; • Sweden is committed to develop a third pillar in electricity supply, next to hydro and
nuclear power, with increased co-generation, wind and other renewable power production to reduce vulnerability and increase security of electricity supply; and
5 Source: Energy Policies of IEA Countries: Sweden 2013 IEA/OECD Paris, 2013.
ESPON 2013 35

• by 2050, the vision is that Sweden will have a sustainable and resource-efficient energy supply with zero net emissions of GHGs.
Sweden sees a role for natural gas as a transition fuel in industry and co-generation. The Swedish Environmental Agency, supported by the Swedish Energy Agency and other national authorities, presented a proposal for a Climate Roadmap in December 2012. The roadmap identifies scenarios for achieving the long-term 2050 priority and is to be adopted in the course of 2013. Action plans show the way Three action plans are showing the way toward the transition of society that must occur in the long run. • Action plan for renewable energy
As part of the integrated climate and energy policy, Sweden set in motion an action plan for renewable energies. This included a higher ambition for the electricity certificate system with an increase of 25 TWh by 2020 compared to 2002, when the system started. Sweden also put forward a national planning framework for wind power of 30 TWh by 2020 (20 TWh onshore, 10 TWh offshore) to provide orientation to municipal spatial planning procedures.
• Action plan for energy efficiency
Under the integrated climate and energy policy bill, Sweden adopted a comprehensive five-year energy efficiency programme for 2010-14 with a total of SEK 1 350 million (EUR 156.23 million) or SEK 270 million (EUR 31.25 million) per year. The activities under this programme aim to strengthen the regional and local climate and energy initiatives, to support green procurement by the public sector, to encourage small and medium sized enterprises (SMEs) to manage and audit their energy consumption, and to procure energy-efficient technology. In addition, Sweden continues the Programme for Energy Efficiency in Energy-Intensive Industry (PFE). Overall funding from the State budget in the area of energy efficiency is around SEK 530 million (EUR 61.44 million) per year.
• Action plan for a fossil-fuel-independent vehicle fleet
With a view to implement the priority of a fossil-fuel independent vehicle fleet by 2030, a committee has been created by the government to present concrete proposals on how Sweden can reach the 2030 decarbonisation goal. As part of the integrated climate and energy policy, an action plan for a fossil-fuel-independent vehicle fleet has been set in motion. Carbon tax and beneficial conditions for vehicles with a low environmental impact, alternative fuels and initiatives to increase the number of plug-in hybrids and electric vehicles will make the Swedish vehicle fleet carbon-neutral and independent of fossil fuels by 2030. The action plan includes both tax proposals and initiatives on renewable fuels as well as the development of alternative technologies.
Nuclear replacement Nuclear energy in Sweden has been controversial and the policy towards nuclear has changed over time. As part of the 2009 agreement, Sweden has extended the transitional period during which nuclear power will be in use by allowing the construction of new reactors at existing sites within the limit of the existing ten reactors. In 2010, the Swedish Parliament annulled the Nuclear Phase-Out Act and lifted the prohibition against the new construction in the Nuclear Activities Act. The replacement of old
ESPON 2013 36

reactors will be possible under the conditions that the old reactor is permanently closed and that the new reactor is situated at the same site. The legislation entered into force on 1 January 2011. The nuclear liability legislation has also been adapted to provide for unlimited liability by operators. The government does not provide any direct or indirect subsidies for new nuclear power. Co-ownership of nuclear reactors has raised competition concerns. Efforts by the Swedish authorities to overcome these structural links between generators were made but did not succeed. As a result, the monitoring and supervision of nuclear power plants operations were strengthened. Regional Energy Trends Within Sweden, the following regional energy trends can be observed: Production: • Hydro power production in the north • Nuclear power production in the south • Bio- based power production more evenly distributed? Consumption: • Consumption pattern reflects settlement pattern: higher consumption in the south and
around the largest cities Stockholm, Gothenburg, and Malmö.
6.4 Review of baseline data and data sources for Sweden The two main sources of energy data within Sweden are: Statistics Sweden: Energy statistics – national level (http://www.scb.se/Pages/SubjectArea____6059.aspx) Swedish Energy Agency: Energy statistics – regional and municipal level (http://www.energimyndigheten.se/sv/Statistik/) All energy data are available at NUTS2 level and/or NUTS3 level. Domestic energy production is from the terrestrial environment, i.e. there is no production from marine (offshore wind, wave or tidal) sources.
ESPON 2013 37

7. The UK 7.1 Introduction
Energy policy in the UK is politically contested and there are many overlapping dimensions to what is required. The UK’s overarching aspirations to energy production have to a large extent been framed by the 2008 Climate Change Act, which has all party support and commits the UK government to ensuring that by 2050 greenhouse gas emissions are reduced by 80% against a 1990 base line level. In order to achieve these inspirational and challenging targets, small incremental steps are being made in five year carbon budget cycles. The general direction of policy is internally consistent with European policy initiatives, with strong incentives towards the promotion of renewable, the promotion of domestic and commercial energy efficiency (including within the public sector). However there is a growing realisation that some of the traditional sources of energy (e.g. North Sea oil and gas) are now a declining resource, existing large energy production plants (oil, gas and nuclear) are coming towards the end of their natural life and new sources of energy such as shale gas and the siting of renewable energy provision (especially wind turbines) are often locally controversial. In addition government estimates suggest that the demand for electricity is likely to increase by 30-100% by 2050 (Department of Energy and Climate Change (DECC), 2012:9). Hence there is growing realisation that the UK is perhaps heading towards an energy cliff as ageing infrastructure is taken off line and subsequently needs to be replaced. It is also important to note that energy infrastructure is a private good and producers and supply networks are driven by profit, and need encouragement and certainty to invest. There are interesting debates as to where such incentives should come from and recently the subsidy for investment is seen as coming from consumers, through higher bills rather than directly from government, although this remains an important part of the way the market is operating.
National government policy is set by the Department of Energy and Climate Change, a relatively new body created in 2008 to ensure ‘clean, secure and affordable’ energy supplies. It is a body that collects and analyses national data, mainly on patterns of consumption (see below), and provides reports to Europe in accordance with the requirements of various European directives.
It is also important to note from the outset the devolved administrative structures within the UK mean that within a common framework established by DECC there are significant variations between the way energy policy is being operationalised in England and Scotland. Hence the Draft Energy Policy for Scotland (2010) seeks to ensure that an output of equivalent to 100% of Scotland’s electricity demands come from renewable resources by 2020 and 11% of heating requirements come from renewable resources. The 2020 Routemap for Renewable Energy in Scotland (Scottish Government, 2011) outlines how this can be achieved.
7.2 Main Trends in Energy Supply and Demand
DECC produces excellent information and summary reports of energy trends on a regular basis, and many of these summaries are syntheses of publically available statistical information. Subtle variations in language used to describe the data provided can lead to very different perceptions of energy issues. For example, in Scotland the aspiration is that 100% of electricity demand is serviced from renewable sources, whereas DECC’s ambition is that 15% of energy comes from renewable resources by 2020.
ESPON 2013 38

The latest Energy digest from DECC (Energy Trends, Released September 26th 2013), changes in energy demand (measured as final energy consumption) shows a variable picture. Provisional figures show a 1.5% increase in total final energy consumption between Q2 of 2012 and Q2 of 2013, with rises of 2.6% in the transport sector, 1.1% in industry, 0.3% in services and a 1.0% decrease in domestic energy consumption (see Figure 21). Adjusted for temperature and seasonal variations, energy consumption fell by 0.1% overall over the same period, with a 2.6% decrease in the domestic sector.
Figure 21: Final Energy Consumption by User
Source: DECC/National Statistics (2013a), Total Energy Trends September 2013
Such information can be further broken down on a subnational scale and at lower levels. Figure 22 shows how average energy consumption per capita varies across the country at a local authority scale, with no discernible patterns emerging, particularly between those local authorities on the east coast of England and Scotland (making up the North Sea Region) and elsewhere.
ESPON 2013 39

Figure 22: Total Average Energy Consumption per capita in 2010 (KwH per Capita)
Source: DECC/National Statistics (2013), Sub-national Energy Consumption
Other data sets show how energy demand is being met. The following figures illustrate how much electricity is being generated by various forms of renewable energy type and also by region. What is evident from Figure 23 is that renewable energy production as a whole in the UK is showing an upward trajectory, reaching 15,538 MW by the end of 2012 with wind energy (both on and offshore) and solar PV showing significant increases in capacity,
ESPON 2013 40

andwith new capacity in a range of renewable sources coming on stream and being planned all the time (see Figures 25 and 26). As well as exploring the broad trends in terms of the growth of renewables there is some information at a sub-national scale as to where this renewable energy is being produced, (see Figure 24). Within England, the East, South East and the Yorkshire and Humber regions on the North Sea coastline are the biggets producers of renewable energy, with a high proportion of this coming from biofuels and wind energy.
Figure 23: Growth in Renewable Energy Production (Installed Capacity), 2000-2012
Source: DECC (2013c:160)
(1) All waste combustion plant is included because both biodegradable and non-biodegradable wastes are burned together in the same plant.
(2) Hydro includes both large scale and small scale, and shoreline wave (6.7 MW in 2012).
Figure 24: Sub-National (L) and Regional Renewable Energy Generation (R) in the UK,
Source: DECC (2013d:54)
ESPON 2013 41

Figure 25: Onshore Wind Farm Capacity in the Construction or Planning Phase
Source: DECC (2012:37)
Figure 26: Biomass Electricity Projects in the Construction or Planning Phase
Source: DECC (2012:29)
Beyond consumption and production statistics a third dimension which is seen as being critically important is the role that energy has in terms of captial investment and job creation. Figure 27 provides a breakdown of the jobs created in this sector as a result of investment
ESPON 2013 42

over a 17 month period from April 2011 to July 2012. In the regions bordering the North Sea, including the whole of Scotland, this amounts to approximately £9.6 billion of investment with the creation of over 14,000 jobs. This equates to about 75% of the total investment in renewables in the UK.
Figure 27: UK Jobs and Investment in Renewables
Source: DECC (2012:24)
7.3 Drivers of Energy Policy
Central Government sets the broad approach to energy policy and whilst most of its activities are designed to shape domestic production and consumption patterns it is interesting to note some of the production challenges are in part being met by international collaborations. For example, recently (January 2013) the UK and Irish governments have signed a Memorandum of Understanding focusing on the potential of importing substantial gigawatts of green energy (predominantly produced by wind) from Ireland to the UK.
Carbon budgeting, which forms the main mechanism for the UK to reduce its Greenhouse Gas emissions, also has an international dimension, utilising the EU Emissions Trading System to regulate emissions from energy production and large industrial producers. In the UK’s first carbon budgeting cycle, from 2008 to 2012, emissions from the traded sector accounted for approximately 40% of total emissions in the UK’s carbon account (DECC 2013e:8).
With regards to renewable energy the broad policy framework is set out in the Renewable Energy Roadmap which was updated in December 2012. Given the broad range of producers and consumers the incentive packages to encourage production and reduce consumption are very wide ranging. The following paragraphs deal with both consumption
ESPON 2013 43

and production issues to provide a flavour of the incentives on offer. It is not intended to be a comprehensive summary.
Furthermore as noted earlier, whilst the direction of travel is the same the devolved administrations (most notably in this case Scotland) are able to set their own policy objectives and within their own devolved competencies provide the framework for this to happen. For example, the aspiration that an output equivalent to 100% of Scotland’s electricity demand will be generated by renewables is driving the development of both onshore and offshore wind farms and with it local planning controversies.
7.4 Energy Production
In production terms a number of incentives and initiatives are being promoted to increase the supply of renewable energy, although more traditional licenses for oil and gas exploration and exploitation continue to be offered. Alongside international collaborations, continued exploitation of fossil fuel reserves is deemed necessary to ensure security of the UK’s energy supply. Recent debates surrounding the exploration of shale gas are particularly controversial, and as yet there are no conclusive figures on the total volume of shale gas reserves that are present in the UK, nor an indicator of the volume of shale gas that could usefully be extracted by hydraulic fracturing (“fracking”). However, the UK government is taking steps to support further development of shale gas and is consulting on a new fiscal regime that can stimulate investment in test drilling and extractions (HM Treasury, 2013).
In the more immediate future, to create certainty in the market, energy supplying companies are required to source an ever increasing proportion of their energy from renewable resources or pay a penalty. This is known as the Renewable Energy Obligation. Energy producers are awarded Renewables Obligation Certificates (ROCs) per MWh of electricity produced. ROCs are “banded”, meaning that a different number of certificates are awarded depending on the technology used to generate energy and potential for large scale deployment (DECC 2013c:169).
In addition large scale renewable energy suppliers are being guaranteed prices over a long timescale to encourage investment in such activities. More recently the way this subsidy is to be provided is switching from a government grant to a subsidy paid via the consumers energy bills. Small scale producers have also been incentivised to invest in renewables, although for some the cost of connecting to the grid has so far proved to be prohibitive. One of the key mechanisms is to provide Feed-in Tariffs, both for domestic and commercial producers, with rate varying depending on the type and scale of renewable energy being produced.
One of the key policy agendas for government is how to stream line the delivery of renewable energy projects and drive down the cost of construction and management (DECC, 2012). Within this area of policy debate the way the planning system works, particularly on land is seen by government and the industry as a particular barrier to the UK realising its potential. The government is therefore in the process of exploring the extent to which local communities, which might receive the negative externalities associated with visual intrusion and noise, should be compensated through some form of community benefit scheme directly related to the energy generated by the project, and paid for by the project proponent.
The different targets for renewable energy in the UK as a whole and for Scotland are leading to some differences in energy production methods. Scotland, with its target for 100% equivalent of electricity demand to come from renewables is also committed to phasing out its nuclear energy production as power stations reach the end of their operating lives. The Electricity Generation Policy Statement (Scottish Government, 2013) confirms that whilst nuclear generation remains important in the energy transition, the expansion of renewables
ESPON 2013 44

will mean that there is no need for further nuclear power plants to be built in Scotland. This is in contrast to England, where the government has stated that nuclear has the potential to provide up to 75GW of the UK’s energy needs (HM Government, 2013:6), and the first new nuclear power plants are expected to be online before 2020.
7.5 Energy Consumption
From a consumption perspective there are a number of government agencies who are charged with promoting greater energy efficiency amongst consumers. Organisations such as the Environment Agency and the Carbon Trust are charged with providing advice and guidance to business on carbon reduction/energy efficiency schemes. The Environment Agency for example, which has as part of its remit a responsibility for pollution control, has amongst other powers and responsibilities a particular responsibility with managing large scale energy consuming plants through emissions trading etc. The Carbon Trust seeks to promote energy efficiency using softer, more persuasive measures.
Within the domestic sector, energy supply companies are expected to promote energy efficiency amongst consumers, through such activities as subsidised building insulation activities, better more efficient heating systems, smart metering etc. This funded through what is now known as the Energy Company Obligation and is guesstimated to be worth £1.3billion from 2014 onwards. This is complimented by the Green Deal, a loan scheme for households to make improvements to their properties that support energy efficiency, which is intended to reduce energy waste from buildings (guesstimated to account for 43% of UK greenhouse gas emissions). More recently a £125 million cash back arrangement has been announced, whereby early adopters could be eligible for up to £1000 cash back to encourage take up of the scheme.
Transport
It is guesstimated that domestic transport (excluding aviation and shipping) amounts to about 25% of UK CO2 emissions and 21% of greenhouse gas emissions. The promotion of biofuels, encouragement for large scale operators, bus companies, haulage companies and rail companies to become more efficient and switch to alternative fuel sources is encouraged by a combination of the price of traditional oil based fuels combined with incentives to use alternative sources, notably biofuels (through the Renewable Transport Fuel Obligation) and hybrid vehicles. Progress is relatively slow but steady, for example, in Scotland the Scottish Government’s Green Bus Fund has seen the rolling out of 74 low carbon buses. With private transportation the cost of more environmentally friendly vehicles, compared with conventional cars, the limited range of in particular electric cars and the lack of infrastructure for refuelling are all seen as factors limiting widespread take up of such technologies. However there remains high expectations that towards the end of the current decade further improvements to the technology and substantial government investment in ultra-low emissions vehicles (for example in recharging infrastructure and grants for electric vehicle purchase) will see a more rapid deployment of renewables-based transport.
7.6 Data Availability
The availability of energy data for the UK is generally good, with DECC and the Office for National Statistics providing comprehensive and up to date statistics on energy production, consumption, pricing, efficiency and greenhouse gases. The RESTATS website also offers significant information on renewable energy performance at national and local level.
ESPON 2013 45

Most energy consumption statistics are provided at national and lower level geographies (region and local authority level – although this tends to be regions of England only with data for Scotland, Wales and Northern Ireland provided at national level). However there is less information available for energy production. This is due to the fact that there are only a small number of energy producers within the regions of the UK and there may be issues of disclosure associated with releasing regional/local data. Some data is available for renewable production by site.
In terms of onshore and offshore data, information is available through DECC for production from oil and gas fields, and the RESTATS website provides a breakdown of capacities of both on and offshore wind farms.
References - UK
Department of Energy and Climate Change (2012) Renewable Energy Road Map: Update 2012.
DECC (2013a) Total Energy Trends. Released 26th September 2013. https://www.gov.uk/government/uploads/system/uploads/attachment_data/file/244719/total_energy.pdf [Last accessed 28/10/2013]
DECC (2013b) Sub-National Energy Consumption: Maps showing domestic, industrial and commercial energy consumption at local authority level. Publication Ref 12D/327. https://www.gov.uk/government/uploads/system/uploads/attachment_data/file/49409/6266-maps-showing-average-final-energy-consumption.pdf [Last accessed 28/10/2013]
DECC (2013c) Digest of United Kingdom Energy Statistics (DUKES). Released 25th July 2013 https://www.gov.uk/government/uploads/system/uploads/attachment_data/file/225067/DUKES_2013_published_version.pdf [last accessed 28/10/2013]
DECC (2013d) Energy Trends: September 2013, special feature articles – Renewable electricity in Scotland, Wales, Northern Ireland and the regions of England in 2012. Released 26th September 2013. https://www.gov.uk/government/uploads/system/uploads/attachment_data/file/244740/1_regional_renewables_2012.pdf [last accessed 28/10/2013]
DECC (2013e) Updated Energy and Emissions Projections, 2013. Released 17th September 2013 (Ref 13D/231) https://www.gov.uk/government/uploads/system/uploads/attachment_data/file/239937/uep_2013.pdf [Last accessed 28/10/2013]
Department of Energy and Climate Change (DECC) Statistics https://www.gov.uk/government/organisations/department-of-energy-climate-change/about/statistics
HM government (2013) Long-term Nuclear Energy Strategy. Ref BIS13/630. https://www.gov.uk/government/uploads/system/uploads/attachment_data/file/168047/bis-13-630-long-term-nuclear-energy-strategy.pdf [last accessed 27/10/2013]
HM Treasury (2013) Harnessing the potential of the UK’s natural resources: a fiscal regime for shale gas Consultation Document. https://www.gov.uk/government/consultations/harnessing-the-potential-of-the-uks-natural-
ESPON 2013 46

resources-a-fiscal-regime-for-shale-gas/harnessing-the-potential-of-the-uks-natural-resources-a-fiscal-regime-for-shale-gas [Last accessed 27/10/2013]
RESTATS: https://restats.decc.gov.uk/cms/welcome-to-the-restats-web-site/
Scottish Government (2010) Draft energy Policy for Scotland. http://www.scotland.gov.uk/Publications/2010/11/17094217/0
Scottish Government (2011) 2020 Routemap for Renewable Energy in Scotland. http://www.scotland.gov.uk/Publications/2011/08/04110353/0
Scottish Government (2013) Electricity Generation Policy Statement. http://www.scotland.gov.uk/Publications/2013/06/5757/0
ESPON 2013 47