north carolina beach monitoring project quality assurance ... › recreational › images ›...
TRANSCRIPT

1
Division of Environmental Health
North Carolina Shellfish Sanitation & Recreational Water Quality Section
North Carolina Beach Monitoring Project Quality Assurance Project Plan
June 16, 2003 Revised January 4, 2005
Mission “To protect the public health by monitoring the quality of North Carolina’s coastal recreational waters and notifying the public when bacteriological standards for safe bodily contact are exceeded”. Prepared by: J. D. Potts, R.S. ---------------------------------- Project Manager, Recreational Water Quality Program Approving Signatures: Terry Pierce, Director, Division of Environmental Health -------------------------- Wayne Mobley, Section Chief ------------------------------ Gary Bennett, QA Reviewer, EPA ------------------------------- Joel Hansel, Project Manager, EPA -------------------------------

2
Table of Contents Section Page
A Project Management
3 Distribution List 4 Project/Task Organization 5 Problem Definition/Background 6 Project/Task Description and Schedule 7 Quality Objectives and Criteria for Measurement Data 8 Special Training Requirements/Certification 9 Documentation and Records
B Measurement/Data Acquisition
1 Sampling Process Design (Experimental Design) 2 Sampling Methods Requirements 3 Sample Handling and Custody Requirements 4 Analytical Methods Requirements 5 Quality Control Requirements 6 Instrument/Equipment Testing, Inspection, and Maintenance 7 Instrument Calibration and Frequency 8 Inspection/Acceptance Requirements for Supplies 9 Data Acquisition Requirements 10 Data Management
C Assessment/Oversight
1 Assessment/Oversight 2 Reports to Management
D Data Validation and Usability
1 Data Review, Validation, and Verification 2 Validation and Verification Methods 3 Reconciliation with Data Quality Objectives
3
A3 Distribution List
Joel Hansel, EPA Terry Pierce, Director, DEH Laura Leonard, PIO, DEH NC Shellfish Sanitation & Recreational Water Quality (Wrightsville Beach) NC Shellfish Sanitation & Recreational Water Quality (Nags Head) Jay Sauber NC Division of Water Quality Rachel T. Noble, Ph. D. Institute of Marine Sciences, UNC Newt McCormick, Ph. D., M.D., Division of Epidemiology Molly Fullwood, Dare County Health Department Coastal County Health Directors

4
A4 - Project / Task Organization Wayne Mobley, Section Chief, Shellfish Sanitation and Recreational Water Quality Section Morehead City Office J. D. Potts, Project Manager, Public Notification, QA Laura Leonard, Public Information Officer, DEH (Raleigh) Media Notification The following staff members have responsibilities in both Shellfish and Recreational Programs: Morehead City Office Patricia Fowler, Laboratory, QA Diane Mason, Laboratory Andy Haines, Laboratory Christine Miller, Gov’t, Health Dept., and Public Notification, Outreach, Data Entry/Management Erin Bryan, Sample Collection, Outreach, Data Entry/Management Paul Moore, Sample Collection, GPS Timmy Moore, Sample Collection, Data Entry Mike Millard, Sample Collection Shannon Jenkins, Shoreline Survey, GPS Phil Piner, Sample Collection, Data Entry Wrightsville Beach Office Amy Javorsky, Laboratory Jeremy Humphrey, Sample Collection, Data Entry Stan Sherman, Sample Collection, GPS Ed Jackson, Shoreline Survey Matthew Stokely, Sample Collection, Data Entry Nags Head Office Misty Gower, Laboratory Kenny Midget, Sample Collection Jeff Rheubottom, Shoreline Survey, GPS Bradley Fitzgerald, Sample Collection, Data Entry

5
A5 - Problem Definition / Background
Coastal North Carolina is blessed with surface water resources: 320 miles
of Atlantic Ocean shoreline, 4,000 miles of estuarine shoreline and 2 million
acres of shellfish growing waters. The beaches, coastal rivers and sounds play a
large part in North Carolina’s prosperous tourism industry, attracting more than
15 million vacationers each year. The resident population is growing rapidly, as
more people find the North Carolina coast a desirable place to live and retire. As
the population continues to grow, water quality is expected to decline as a result
of increased run-off from land-disturbing activities.
In the mid 1990s, pfiesteria emerged in the national media as a possible
public health threat, and North Carolina’s Neuse River was in the spotlight for
harboring the dinoflagellate organism. At that time, pfiesteria was found only in
the brackish waters of the Neuse River, but the negative publicity carried the
underlying possibility that all of North Carolina’s coastal waters were unsafe for
the consumption of seafood or for swimming. Water quality issues were rekindled
in 1996 when a report from the Natural Resources Defense Council (NRDC)
labeled North Carolina as a “Beach Bum” state for its lack of beach monitoring
and public notification programs. When the legislature assembled the next year,
it took very little lobbying to convince lawmakers to fund a recreational water
quality program for coastal waters. In June1997 the North Carolina Shellfish

6
Sanitation Section was charged with monitoring coastal waters for two years as a
pilot project. Approximately 300 stations were monitored weekly during the
swimming season using fecal coliform as the indicator organism. As a result of
the two years of monitoring, the reputation of North Carolina’s coastal waters
started improving, and public confidence in the health and safety of the coastal
resources was being restored. In 1999 the program was funded permanently.
This document will report new program requirements and standards
necessary for compliance with the Environmental Protection Agency’s (EPA)
guidance and will be a guide or protocol for operating the program. One aspect of
the program that will not change is the protocol for posting swimming advisories
and methods for notifying the public. Advisories will still be based on the
exceedance of the bacteriological standard; however, the standard will be
enterococci instead of fecal coliform. The posting of advisories for single-sample
maximum exceedances is another significant change to the program this year.
A6 - Project/Task Description and Schedule
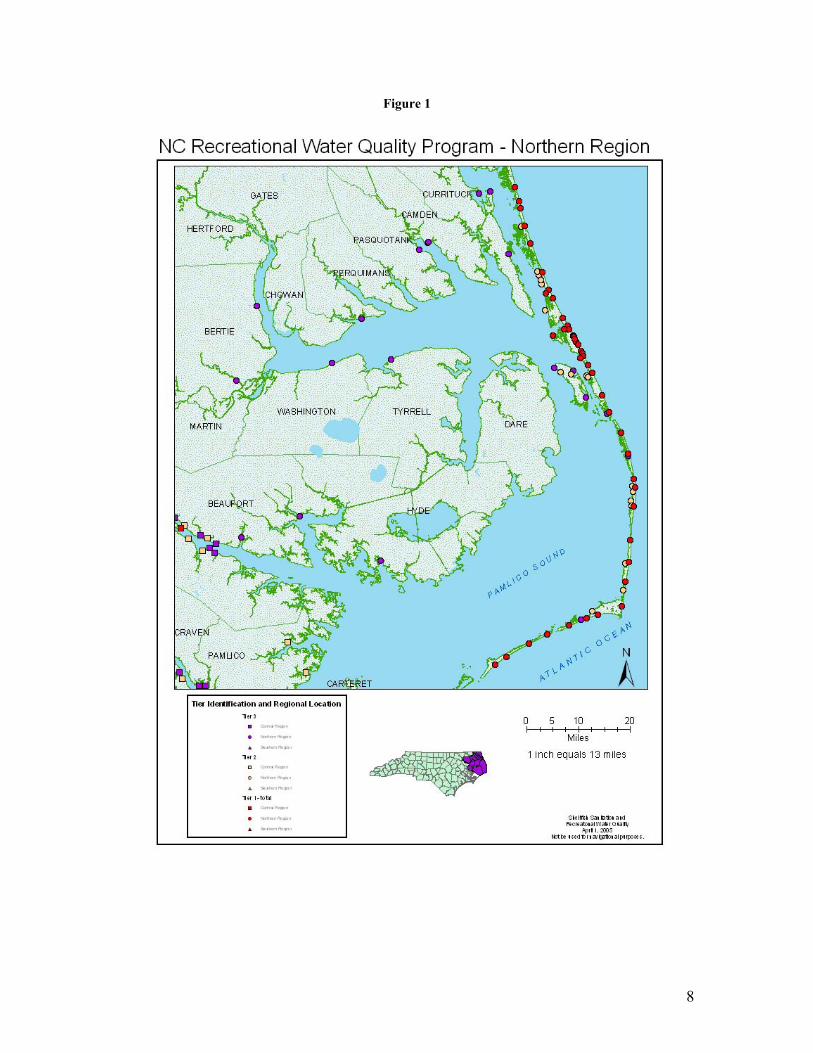
The coastal counties are divided into three regions, Northern, Central and
Southern (see figures 1, 2, 3). The three regions combined have approximately
240 sites that are monitored either weekly or twice monthly during the swimming
season. Monitoring stations that are adjacent to resort areas, public accesses
and summer camps are considered high usage (Tier I beaches) and are sampled
weekly. Medium usage sites, (Tier II beaches) sampled twice monthly, constitute
areas such as those in the ICWW, tidal creeks and exposed shoals. People
frequent Tier II sites mostly on weekends and they are usually accessed by

7
watercraft. Tier III designations are areas that are used infrequently, where
people have minimal full body contact. Tier III sites are also sampled twice
monthly.
The Shellfish Sanitation and Recreational Water Quality Section
(SSRWQ) has a State and Food and Drug Administration (FDA)-accredited
laboratory in each region. Sample collection, laboratory analysis, and beach
monitoring activities are conducted entirely by the SSRWQ staff; however, Dare
County Health Department in the northern region has an agreement with the
SSRWQ to issue the public notification locally for the Dare County swimming
advisories. The state Division of Environmental Health then follows up with
public notification to the Associated Press.
The State will continue to fund the Tier II and Tier III monitoring sites,
approximately 50% of all the swimming areas, while the EPA grant will be used
to fund the monitoring of the Tier I beaches. Appendices 1, 2 and 3 list the
monitoring sites that are supported by the state of North Carolina and the EPA
grant. Appendix 4 contains the coordinates for each monitoring site or swimming
area.
The EPA grant is also used to fund public education and outreach.
Appendix 8 contains educational materials used at the public meetings; they are
required by the EPA to be grant-eligible.
8
Figure 1

9
Figure 2

10
Figure 3

11
A7: Quality Objectives and Criteria
Primary Objective:
“To protect the public health by monitoring the quality of North Carolina’s coastal
recreational waters and notifying the public when bacteriological standards for
safe bodily contact are exceeded”.
Quality Objectives:
To identify swimming areas/beaches and classify them based on human
recreational usage.
To identify monitoring stations that exceed the enterococci geometric
mean and single-sample maximum criteria using the Enterolert MPN
method for enumeration.
To evaluate the public health significance of approximately twenty (20)
ocean storm drains.
To document trends in coastal bacteriological water quality.
Measurement Performance Criteria:
Swimming advisory signs are posted and press releases issued for Tier I
swimming areas/beaches when a minimum of five (5) samples are collected,
equally spaced over 30 days, exceed a geometric mean of 35 enterococci per
100 ml or, when a single sample exceeds 500 enterococci per 100 ml. The
public is notified only by press release, without an advisory sign when a single
sample exceeds 104 enterococci per 100 ml and is less than 500 enterococci
per 100 ml. for a Tier I site. This is called an alert. A second sample will be
collected immediately. If the second sample exceeds 104 enterococci per 100

12
ml, the alert is converted into an advisory and the public will be notified by press
release, and a sign will be posted.
A swimming advisory will also be issued when at least two out of three samples
collected at a monitoring site exceeds 104 enterococci per 100 ml. The project
manger will determine which Tier I stations, if any, will have triplicate sampling.
Rescinding Tier I Advisories
Once the geometric mean exceeds the standard, the swimming advisory
is not lifted until two consecutive weekly samples meet the EPA standard of 35
enterococci per 100 ml. For a geometric mean advisory to be rescinded, the
station must have two consecutive good samples, with ‘good’ being defined as
35 enterococci per 100 ml or fewer. However, if a situation occurs where two
consecutive good samples are recorded, but the geometric mean is still
exceeded, the advisory will remain in place until the geometric mean falls below
35 enterococci per 100 ml.
In a case where a station under advisory is subject to triplicate sampling,
two of the three triplicate samples must be under the single-sample maximum of
104 enterococci per 100 ml. In a situation where two of the three samples are
above the single-sample maximum of 104 enterococci per 100 ml, an advisory
will be put into place. The advisory will be rescinded when two of the three re-
samples are under the single-sample level, as long as the running geometric
mean has not been exceeded.
Beaches that violate the single-sample maximum criteria are re-sampled
at the time of the public notification and/or sign posting, depending on the level of
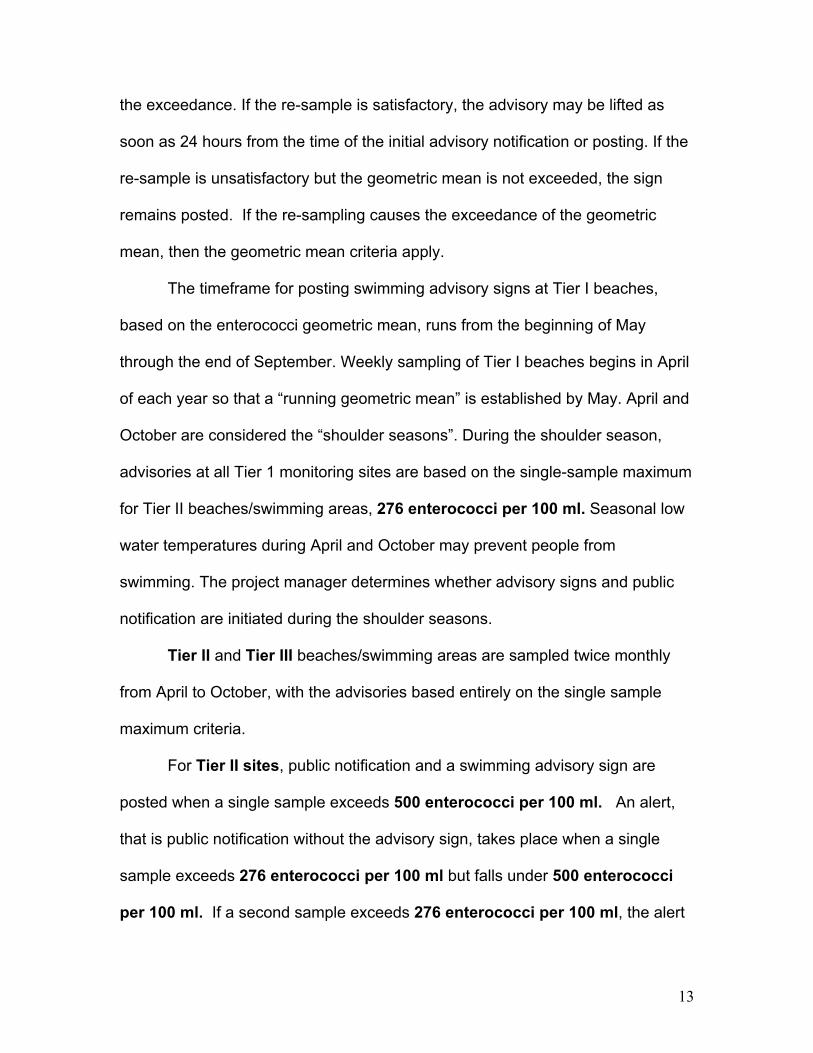
13
the exceedance. If the re-sample is satisfactory, the advisory may be lifted as
soon as 24 hours from the time of the initial advisory notification or posting. If the
re-sample is unsatisfactory but the geometric mean is not exceeded, the sign
remains posted. If the re-sampling causes the exceedance of the geometric
mean, then the geometric mean criteria apply.
The timeframe for posting swimming advisory signs at Tier I beaches,
based on the enterococci geometric mean, runs from the beginning of May
through the end of September. Weekly sampling of Tier I beaches begins in April
of each year so that a “running geometric mean” is established by May. April and
October are considered the “shoulder seasons”. During the shoulder season,
advisories at all Tier 1 monitoring sites are based on the single-sample maximum
for Tier II beaches/swimming areas, 276 enterococci per 100 ml. Seasonal low
water temperatures during April and October may prevent people from
swimming. The project manager determines whether advisory signs and public
notification are initiated during the shoulder seasons.
Tier II and Tier III beaches/swimming areas are sampled twice monthly
from April to October, with the advisories based entirely on the single sample
maximum criteria.
For Tier II sites, public notification and a swimming advisory sign are
posted when a single sample exceeds 500 enterococci per 100 ml. An alert,
that is public notification without the advisory sign, takes place when a single
sample exceeds 276 enterococci per 100 ml but falls under 500 enterococci
per 100 ml. If a second sample exceeds 276 enterococci per 100 ml, the alert

14
is converted to an advisory and the public is notified and an advisory sign is
posted. A third sample is then collected the following week. Weekly sampling of
the site continues until the enterococci counts are 276 enterococci per 100 ml
or fewer.
Tier III beaches/swimming areas, because of infrequent use, do not
receive public notification or advisory signs until the second sample exceeds 500
enterococci per 100 ml. If the second sample exceeds 500 enterococci per
100 ml, an advisory sign and public notification are issued. A third sample is then
collected the following week. Weekly sampling of the site will continue until the
enterococci counts are 500 enterococci per 100 ml or fewer.
Other swimming advisories will be posted as precautionary measures
when the following activities occur:
- Pumping of floodwaters between the primary dune and the ocean
beaches.
- Storm drains with discharges into ocean beaches. Storm drains that
have flow that may be able to reach ocean recreational waters are
posted with hinged advisory signs. The signs read as follows:
“ATTENTION SWIMMING IS NOT RECOMMENDED BETWEEN
SIGNS. WATERS MAY BE CONTAMINATED BY DISCHARGE FROM
PIPE. Office of the state health director.” When the pipes are not
discharging, the signs are folded closed so the wording cannot be
read. When the pipes are discharging, the signs are opened to allow
the advisory to be visible. The advisory signs remain open until 24

15
hours after the discharge has ceased. No press release will be issued.
The pipes are checked daily while the advisories are in place, as well
as after rainfall events. The regional field offices notify the central
office when an advisory is placed or lifted in this way. These pipes are
also regular sampling stations. When the bacteriological sampling
results for these pipes exceeds the standards and the pipe is flowing,
the hinged sign will also serve as the bacteriological swimming
advisory. No press release will be issued. If the pipe is not discharging
and the hinged sign is closed so the advisory is not visible, the
bacteriological advisory sign will be posted and a press release will be
issued.
- Disposal of dredge material from closed shellfishing waters on ocean
beaches.
These swimming advisories are lifted 24 hours after visible discharge into the
ocean ceases.
Swimming advisories are not posted from November through March;
however, all sampling stations are sampled once per month during the non-
swimming season.
Public notification and risk communication plan:
The health director or the environmental health supervisor of the local
health department is the first to be informed of a swimming advisory. Discussion
with the health department determines who the next contact should be, such as a
town or county manager. The media are not contacted concerning a swimming

16
advisory before local and state officials are aware of the situation. The North
Carolina Division of Environmental Health (NCDEH) then sends out the press
release to the Associated Press and local community newspapers at the same
time the advisory sign is posted. The press release advisories are aired on TV,
radio stations and web sites (see Appendix 5 for press release templates and
links to web sites).
Rescinding an advisory follows the same procedures in reverse. The first
communication involves the local health department, then the sign is removed
and another press release is issued, declaring the waters are within the
swimming standard.
If an advisory sign is needed on the ocean beaches, the sign will be
placed on a post or posts at the interface of the wet and dry sand area of the
beach. For estuarine waters, the sign may be posted by boat just offshore of the
beach or on the shoreline. There may be instances where permission will have to
be obtained to post signs on private property, such as on bulkheads or at
entrances to marinas. Local Environmental Health Specialists or other local
officials may be present when the signs are erected (see Appendix 6 for sign
descriptions).
A8 - Special Training Requirements/Certification
SSRWQ laboratory personnel have been instructed in specific health and
safety needs as required for employment. The laboratory maintains the required
United States FDA and State certifications.

17
Field personnel are trained in small boat handling and navigation in
coastal waters. Users of GPS equipment must be trained and certified before
collecting field data for boundaries and monitoring sites. Personnel are trained in
sample collection, transporting samples, recording field data, keying data into the
database and following QA/QC protocols.
A9 - Documentation and Records
SSRWQ performs all sample collections and carries responsibility for
handling all data collected in the field (see Appendix 7 for an example of the field
sampling sheet). The SSRWQ laboratory is responsible for recording the
bacteriological data on the field sheet (see Appendix 7). After the bacteriological
data is recorded by laboratory staff, the project manager then reviews the
bacteriological results and field data before passing the field sheet to the data
entry person. Currently, the data is entered into an Excel spread sheet and
Access database; however, an Oracle database is being developed to work with
an EPA data exchange node that will be used to meet reporting requirements.
Hard copies of the laboratory data, laboratory quality assurance forms, and field
sampling data sheets are archived indefinitely at the Morehead City office.
Electronic copies of the bacteriological data are backed up and stored on the
server in Morehead City as well as backup copies stored on compact disc.
Sanitary survey reports of recreational waters and any other reports or audits are
kept on file in the same manner. Documentation of public notification, original
press releases, are filed for one year; however, a spread sheet documenting
advisories and rescinds will be filed electronically indefinitely.

18
B1 - Sampling Process Design
The method for monitoring the 240 sites throughout coastal North Carolina
began by grouping the sites in each region to create “sampling runs” or routes
that the staff would travel for a particular day of sample collection. The northern
region has eight sampling runs consisting of 73 monitoring sites, the central
region has six sampling runs consisting of 92 monitoring sites and the southern
region has 6 sampling runs with 60 monitoring sites. It is common for a sampling
run to have a combination of Tier I, II and III swimming areas. Half of the
sampling runs are accessed by boat and half are reached by car and then
wading into water from the beach. Weather conditions and tides have a strong
influence on choosing a sampling run; therefore, the person collecting the water
samples must plan his/her day accordingly. The sampling runs are close enough
to one of the three regional laboratories to have water samples in the testing
media before 2:00 p.m. each day (see holding time for samples in laboratory
QAP Appendix 9).
Tier I beaches that require a minimum of five (5) samples in 30 days are
tested using the following schedule:
Northern Region
Sampling Run Day Roanoke Island Monday Currituck to Corolla Tuesday Ocracoke to Pea Island Wednesday Kitty Hawk to Oregon Inlet Thursday Central Region
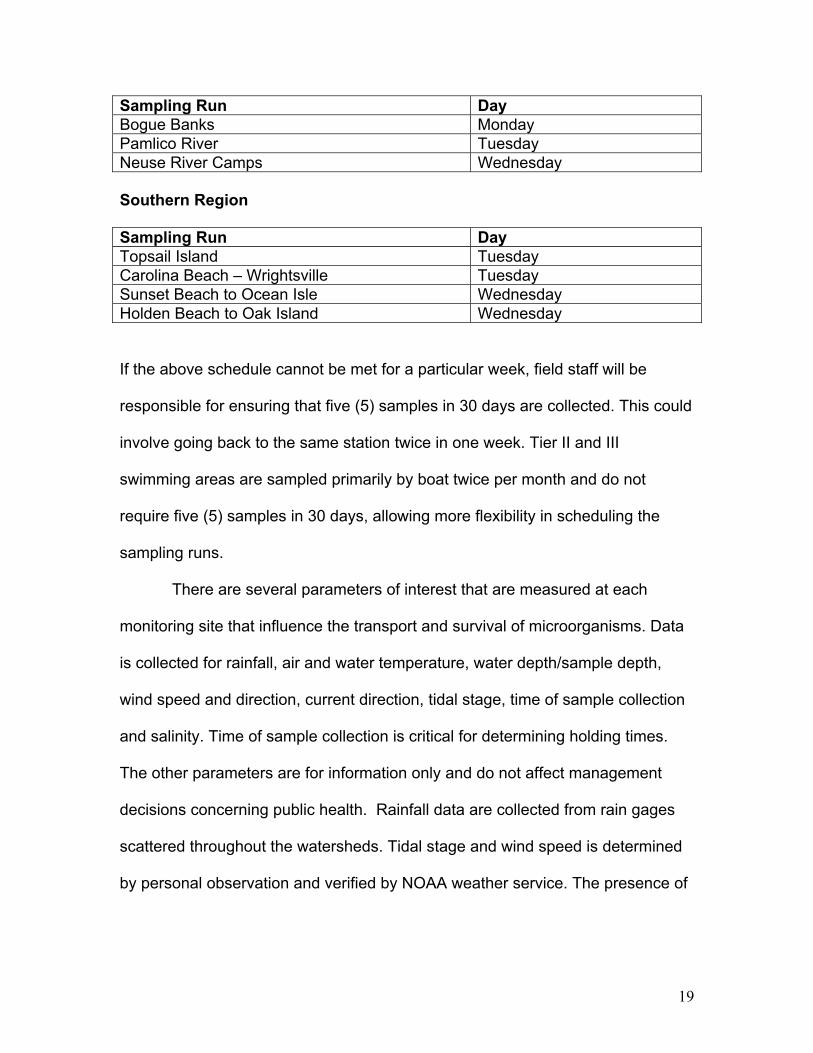
19
Southern Region Sampling Run Day Topsail Island Tuesday Carolina Beach – Wrightsville Tuesday Sunset Beach to Ocean Isle Wednesday Holden Beach to Oak Island Wednesday
If the above schedule cannot be met for a particular week, field staff will be
responsible for ensuring that five (5) samples in 30 days are collected. This could
involve going back to the same station twice in one week. Tier II and III
swimming areas are sampled primarily by boat twice per month and do not
require five (5) samples in 30 days, allowing more flexibility in scheduling the
sampling runs.
There are several parameters of interest that are measured at each
monitoring site that influence the transport and survival of microorganisms. Data
is collected for rainfall, air and water temperature, water depth/sample depth,
wind speed and direction, current direction, tidal stage, time of sample collection
and salinity. Time of sample collection is critical for determining holding times.
The other parameters are for information only and do not affect management
decisions concerning public health. Rainfall data are collected from rain gages
scattered throughout the watersheds. Tidal stage and wind speed is determined
by personal observation and verified by NOAA weather service. The presence of
Sampling Run Day Bogue Banks Monday Pamlico River Tuesday Neuse River Camps Wednesday

20
waterfowl and wildlife in proximity of the monitoring site is also recorded on the
field data sheet.
B2 - Sampling Methods
Water samples are collected in autoclaved borosilicate glass bottles with
the station identification on the lid. Once the water sample is collected, the bottle
is tipped to give one (1) inch of air space in the bottle. The water samples are
stored immediately on ice in a cooler until all the samples are returned to the
laboratory. The six-hour holding time for enterococci samples is not an issue
because of the relative proximity of the sampling runs to one of the three
laboratories. Quanti-trays with positive wells for enterococci are disposed of by
placing them in orange biohazard bags and then autoclaving. The autoclaved
bags are then taken to the landfill.
Approximately half of the beach monitoring will be accomplished by
wading into the surf to collect the sample. When wading, the sampler will use a
telescopic golf ball retriever, modified to hold the sample bottle, to reach out
approximately 16 feet from the body in knee-deep water to collect the sample.
Many of the camps on the coastal rivers and sounds have long piers that extend
out over the water. The sample should be taken 6 – 12 inches below the surface
of the water at a location along the pier that receives the most use, e.g., ladders,
etc. Sampling by boat takes place in approximately three feet of water with the
sample collected 12 inches below the surface. A stainless steel rod with a
sample holder will be used to collect the sample from the boat. Sampling

21
personnel should avoid disturbing bottom sediment in either approach, to
collecting the sample.
Dare County has nine ocean storm drains that extend to the water’s edge
at low tide. The mouths of these storm drains are partially or completely
submerged at high tide. Samples are to be collected approximately 10 feet to
either side of the Dare County drains when practical. At times, surf conditions
may not be safe to be within 10 feet of the pipe. The water sample collected at
the Hanby Beach storm drain in New Hanover County will be sampled in the
same manner. The remaining storm drains in New Hanover, Brunswick and
Carteret counties do not extend to the water’s edge. These drains are sampled
where the swash enters the surf. The water depth for sample collection at all
storm drains is the same as the other monitor sites in the surf, just below the
surface in approximately “knee- deep water”.
The Dare County storm drains that are discharging after rainfall will be
sampled temporarily 100 feet on each side of the pipe to help determine the
extent of the plume. The project manager will determine the timeframe for
conducting the lateral sampling of storm drains.
It may be necessary at some sites that exceed the geometric mean
protocol to conduct additional sampling to define the extent of the pollution.
Once the advisory sign is posted, sampling may be initiated at a point 200 feet on
either side of the sign. The program manager determines when, if any, additional
sampling will be conducted.

22
Personal watercraft rental sites in most cases are classified as Tier II
sites. The samples are collected in the area of the sound where the renters are
allowed to ride. This is usually a sectioned-off area marked by buoys. If an
advisory is needed, the sign will be posted near shore where watercraft users
can see the sign before entering the riding area.
B3 – Sample Handling and Custody
The sample collectors are responsible for ensuring the samples are stored
and handled properly while in the field. The samples are stored immediately on
ice in a cooler to chill the sample and to limit the exposure to UV light. The time is
recorded on the field-sampling sheet for each sample collected. The six-hour
holding limit for enterococci is not a factor because each sampling run can be
completed with samples back to one of the three laboratories within 3 – 4 hours.
Laboratory personnel are responsible for recording the time on data sheets when
samples are planted into the media and the times samples can be analyzed after
incubation (see appendix 9 for laboratory QA). Both laboratory and field
personnel are responsible for signing off on the chain of custody checklist on the
back side of the field sampling sheet (see appendix 7 page 2).
B4 - Analytical Methods
Using the Idexx enterolert method is a simple procedure involving three
steps that are discussed in the laboratory quality assurance plan. A failure in any
part of the laboratory procedure results in the collection of another sample.
Laboratory staff members are responsible for ensuring that the project manager
receives the bacteriological results immediately upon completion of the analysis,

23
and correcting any laboratory procedures that may occur. The laboratory staff
members are: Misty Gower in Nags Head, Diane Mason and VACANT in
Morehead City, and Amy Javorsky in Wrightsville Beach.
B5 - Quality Control
A sample is collected in the field and labeled “temperature control” that is
measured upon arrival to the laboratory. The laboratory refuses samples that are
above 10 degrees Celsius and samples that exceed holding time. Split samples
are also taken at different frequencies and shared among the three labs to
compare results. During laboratory analysis, a pure culture of Enterococcus
faecium is used as a positive control and Serratia marcescens is used as the
negative control.
The acceptance criteria for enterococci are based upon the MPN table
provided by Idexx Laboratories. The smallest number of enterococci that can be
analyzed is 9 organisms per 100 ml. The highest density of enterococci that can
be analyzed is 2005 organisms per 100 ml. Higher densities can be analyzed by
further diluting the sample. The critical values of enterococci, 104, 276, and 500
organisms per 100 ml for single samples exceedances, are well within the
capabilities of the Enterolert method. Idexx reports that Enterolert has a false
negative rate 0.4% and a false positive rate of 5.1 %.
Other analytical controls are detailed in the laboratory QAP in appendix 9.
Technicians at each regional office review each other’s data entry for mistakes.

24
B6 – Instrument /Equipment Testing, Inspection, and Maintenance
The two major equipment items needed to do the Enterolert method are
an autoclave and an air incubator. A maintenance contract with the autoclave
manufacturer requires that the autoclave have preventive maintenance once
every two months by authorized technicians. Laboratory personnel check the
autoclave monthly for sterility. Air incubators are checked twice daily for proper
temperatures using a certified thermometer.
B7- Instrumentation Calibration and Frequency
Laboratory equipment is routinely inspected and calibrated at different
times of the year to meet FDA and State certification requirements. The only field
instruments that need calibrating are refractometers and thermometers. These
two instruments are calibrated against known standards.
B8 - Inspection/acceptance of Supplies and Consumables
Lab supplies are ordered through major scientific supply companies and
inspected upon receipt by the project manager. All of the Idexx items are
sterilized with ethylene oxide and received in sealed packaging. Each package
has a certificate of sterility by the manufacturer. The supplies will be returned to
Idexx if a seal is broken on any of the packaging. Field personnel inspect field
supplies before leaving the office each day.
B9 – Non-direct Measurements
Tide tables are the only non-direct measurements that will be used in the
project. Tide tables are often used when planning sampling runs by boat.

25
Storms and wind can cause delays or early arrival in the actual tidal stage but are
not a critical issue to the project.
B10 – Data Management
The data is currently being entered into an Excel spread sheet and it is
also entered into an Access database that will be used until a more elaborate
Oracle database is completed in April 2005. The Oracle database will be web-
enabled that will have both numerical and Program tracking, beach Advisories,
Water quality standards, and Nutrients (PRAWN) data.
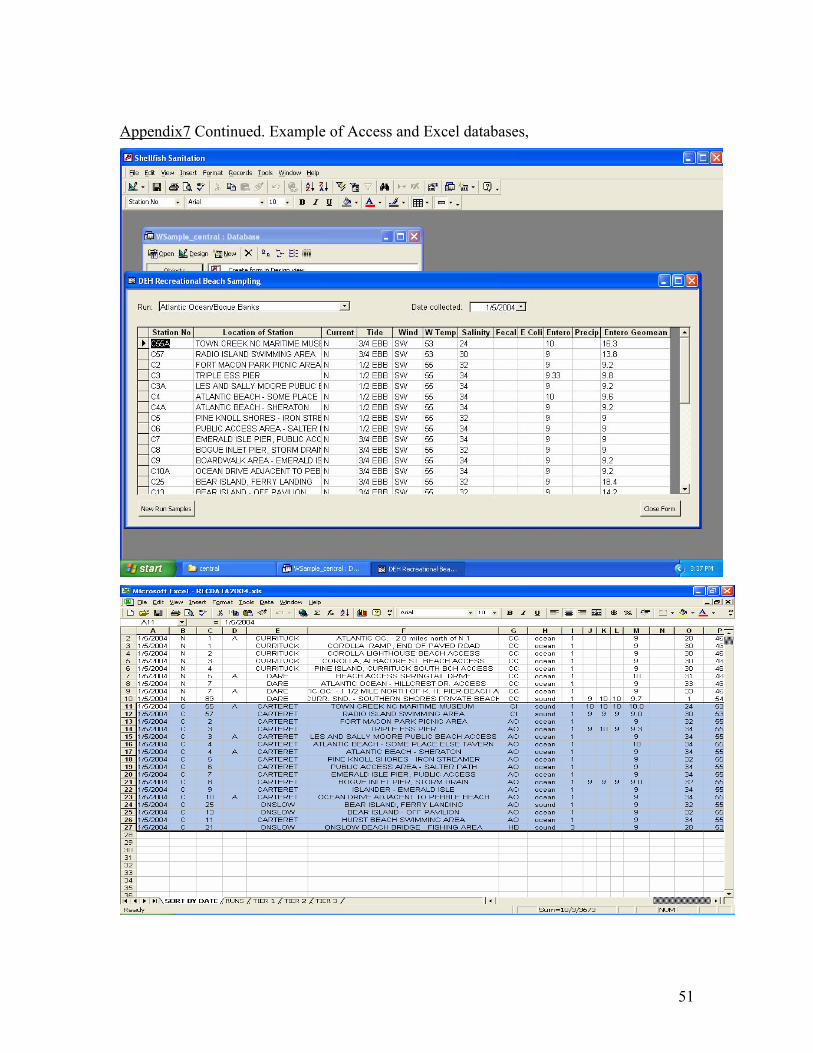
Data is entered into the Access database at each regional office and is
sent to a FTP site at the main office in Morehead City. All of the data from each
region is entered into the Excel spread sheet from staff at the Morehead City
Office for redundancy. Entries from the spread sheet and database are
compared to one another as a check (see appendix 7). When data entered in the
Northern Region and Southern Region into Access do not match with the Central
Region spread sheet, the data entry staff are required to find and correct the
mistake. Advisories are not posted until both databases can verify the geometric
mean. The project manager reviews the database daily to look at the geometric
mean data and orders the posting of advisory signs and the issue of press
releases accordingly.
All of the data on the server have timed backups that are stored on tape.
Redundancy in data entry prevents incorrect data from being stored on the tapes.
Current copies of the data are also available on employees’ desktop computers.

26
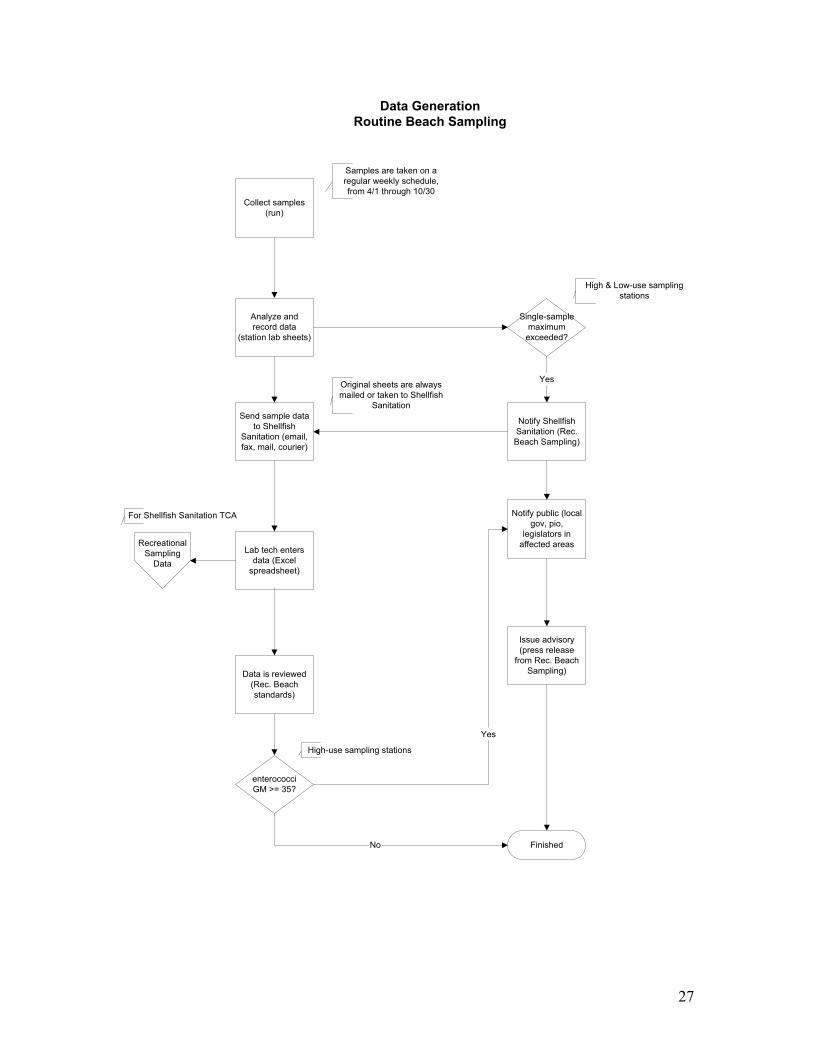
The following flow chart shows the process by which the data is generated
and how the data is used.
27
Collect samples(run)
Analyze andrecord data
(station lab sheets)
Send sample datato Shellfish
Sanitation (email,fax, mail, courier)
Lab tech entersdata (Excel
spreadsheet)
Data is reviewed(Rec. Beachstandards)
enterococciGM >= 35?
FinishedNo
Issue advisory(press release
from Rec. BeachSampling)
Samples are taken on aregular weekly schedule,from 4/1 through 10/30
Data GenerationRoutine Beach Sampling
Single-samplemaximumexceeded?
Notify ShellfishSanitation (Rec.Beach Sampling)
Yes
High & Low-use samplingstations
High-use sampling stations
For Shellfish Sanitation TCA
Original sheets are alwaysmailed or taken to Shellfish
Sanitation
Notify public (localgov, pio,
legislators inaffected areasRecreational
SamplingData
Yes

28
Group C: Assessment and Oversight
C1 Assessments and Response Actions
As Section Chief, Wayne Mobley has oversight for the shellfish and beach
monitoring programs. Assistant Section Chief, Patti Fowler, is responsible for
laboratory quality assurance for both the shellfish and beach monitoring
programs. JD Potts is the Beach Monitoring Project Manager and is responsible
for regularly reviewing the progress of the project, compiling data and supervising
employees. The project manager is responsible for posting swimming advisory
signs, directing public notification activities, and visiting the field offices regularly
to assure adherence to the quality assurance project plan. Performance reviews
are scheduled every six months for individual employee assessments. The
project manager is responsible for any corrective action needed to ensure that
the staff in the recreational water quality program is adhering to the QAPP and
program objectives. Christine Miller, the Environmental Specialist II, is
responsible for public outreach and education about the program and notification
of health departments, local, state and federal governments as well as interest
groups and the public.
The SSRWQ staff monitors the documentation of laboratory/field
procedures and data analysis for each other throughout the beach monitoring
project.
C2 – Reports to Management
Data entry personnel are responsible for submitting data summaries to the
project manager daily. Field and lab staff members are responsible for reporting

29
quality assurance issues as they occur to the project manager. Individual reports
for daily objectives and accomplishments are available for management at
anytime. The project manager reports to the EPA all swimming advisories as
they are issued. An in-depth survey of the beach monitoring is reported to the
EPA in January of each year.
Group D: Data Validation and Usability
D1 – Data Review, Verification, and Validation
Each region has standardized field and laboratory procedures. Sample
collection, handling of samples and lab analysis are all conducted in the same
manner. Splitting samples and sharing them with each of the three labs to
analyze helps verify that protocols are followed properly. Bacteriological data that
is derived from samples where quality assurance is questionable will be rejected.
All three regional laboratories are state- and FDA- certified.
D2 – Verification and Validation Methods
Verification and validation are conducted by the staff members who record
and enter the data. At least two people are involved in the laboratory analysis to
ensure that samples are read and recorded correctly on to the field/lab form. The
laboratory staff responsible for resolving laboratory issues are: Misty Gower and
a field technician in Nags Head, Diane Mason and Andy Haines in Morehead
City, Amy Javorsky and a field technician in Wrightsville Beach.
Controls are setup to verify that samples are being read properly (see
Sect. B-5 Quality Control). The laboratory results are entered into the database
by technicians. Two technicians at each regional office are responsible for

30
ensuring the data is entered into the system free of mistakes. Each technician’s
work is reviewed by the other technician for 100% verification. The project
manager performs random spot checks on 5% of each office’s data handling.
The database is set up so that data summaries are verified by having the
program to automatically calculate geometric means.
D3 – Reconciliation with User Requirements
The geometric means and single sample maximums are compared to the
standards in the EPA’s Beach Guidance manual for posting swimming
advisories.

31
Appendix 1: List of Tier One Monitoring Sites Funded by EPA Grant with
sampling frequency and the single sample maximum.
AREA STATION NO COUNTY TIER RUN LOCATION FREQUENCY SSMax C 112 A BEAUFORT 1 PR sound 5 in 30 days 104C 119 A BEAUFORT 1 PR sound 5 in 30 days 104C 120 A BEAUFORT 1 PR sound 5 in 30 days 104C 121 BEAUFORT 1 PR sound 5 in 30 days 104S 1 BRUNSWICK 1 SB/OI ocean 5 in 30 days 104S 2 BRUNSWICK 1 SB/OI ocean 5 in 30 days 104S 5 BRUNSWICK 1 SB/OI ocean 5 in 30 days 104S 6 A BRUNSWICK 1 SB/OI ocean 5 in 30 days 104S 6 BRUNSWICK 1 SB/OI ocean 5 in 30 days 104S 9 BRUNSWICK 1 HB/OI ocean 5 in 30 days 104S 10 BRUNSWICK 1 HB/OI ocean 5 in 30 days 104S 10 A BRUNSWICK 1 HB/OI ocean 5 in 30 days 104S 13 BRUNSWICK 1 HB/OI ocean 5 in 30 days 104S 14 A BRUNSWICK 1 HB/OI ocean 5 in 30 days 104S 15 BRUNSWICK 1 HB/OI ocean 5 in 30 days 104S 16 A BRUNSWICK 1 HB/OI ocean 5 in 30 days 104S 16 B BRUNSWICK 1 HB/OI ocean 5 in 30 days 104S 16 C BRUNSWICK 1 HB/OI ocean 5 in 30 days 104C 2 CARTERET 1 AO ocean 5 in 30 days 104C 3 A CARTERET 1 AO ocean 5 in 30 days 104C 3 CARTERET 1 AO ocean 5 in 30 days 104C 4 A CARTERET 1 AO ocean 5 in 30 days 104C 4 CARTERET 1 AO ocean 5 in 30 days 104C 5 CARTERET 1 AO ocean 5 in 30 days 104C 6 CARTERET 1 AO ocean 5 in 30 days 104C 7 CARTERET 1 AO ocean 5 in 30 days 104C 8 CARTERET 1 AO ocean 5 in 30 days 104C 9 CARTERET 1 AO ocean 5 in 30 days 104C 10 A CARTERET 1 AO ocean 5 in 30 days 104C 10 B CARTERET 1 AO ocean 5 in 30 days 104C 55 A CARTERET 1 AO sound 5 in 30 days 104C 57 CARTERET 1 AO sound 5 in 30 days 104N 1 A CURRITUCK 1 CC ocean 5 in 30 days 104N 1 CURRITUCK 1 CC ocean 5 in 30 days 104N 2 CURRITUCK 1 CC ocean 5 in 30 days 104N 3 CURRITUCK 1 CC ocean 5 in 30 days 104N 4 CURRITUCK 1 CC ocean 5 in 30 days 104N 5 A DARE 1 CC ocean 5 in 30 days 104N 7 A DARE 1 CC ocean 5 in 30 days 104N 7 DARE 1 CC ocean 5 in 30 days 104N 12 A DARE 1 KH ocean 5 in 30 days 104

32
N 12 B DARE 1 KH ocean 5 in 30 days 104N 12 DARE 1 KH ocean 5 in 30 days 104N 13 DARE 1 RI sound 5 in 30 days 104N 14 DARE 1 KH ocean 5 in 30 days 104N 14 A DARE 1 KH ocean 5 in 30 days 104N 15 DARE 1 KH ocean 5 in 30 days 104N 16 A DARE 1 KH ocean 5 in 30 days 104N 16 DARE 1 KH ocean 5 in 30 days 104N 17 A DARE 1 KH ocean 5 in 30 days 104N 17 DARE 1 KH ocean 5 in 30 days 104N 18 DARE 1 KH ocean 5 in 30 days 104N 19 DARE 1 KH ocean 5 in 30 days 104N 22 DARE 1 KH ocean 5 in 30 days 104N 23 DARE 1 KH ocean 5 in 30 days 104N 25 DARE 1 O/PI ocean 5 in 30 days 104N 26 B DARE 1 O/PI ocean 5 in 30 days 104N 26 DARE 1 O/PI ocean 5 in 30 days 104N 27 DARE 1 O/PI ocean 5 in 30 days 104N 29 B DARE 1 O/PI ocean 5 in 30 days 104N 29 DARE 1 O/PI ocean 5 in 30 days 104N 30 DARE 1 O/PI ocean 5 in 30 days 104N 32 DARE 1 O/PI ocean 5 in 30 days 104N 34 DARE 1 O/PI ocean 5 in 30 days 104N 37 DARE 1 O/PI ocean 5 in 30 days 104N 39 DARE 1 O/PI ocean 5 in 30 days 104N 40 DARE 1 O/PI ocean 5 in 30 days 104N 85 A DARE 1 KH ocean 5 in 30 days 104N 85 DARE 1 KH ocean 5 in 30 days 104N 88 DARE 1 RI sound 5 in 30 days 104N 89 DARE 1 CC sound 5 in 30 days 104N 91 DARE 1 RI sound 5 in 30 days 104N 41 A HYDE 1 O/PI ocean 5 in 30 days 104N 41 HYDE 1 O/PI ocean 5 in 30 days 104N 42 HYDE 1 O/PI ocean 5 in 30 days 104N 43 HYDE 1 O/PI ocean 5 in 30 days 104
S 18 NEW HANOVER 1 WB ocean 5 in 30 days 104
S 19 B NEW HANOVER 1 WB ocean 5 in 30 days 104
S 19 NEW HANOVER 1 WB ocean 5 in 30 days 104
S 20 NEW HANOVER 1 WB ocean 5 in 30 days 104
S 21 A NEW HANOVER 1 SCL ocean 5 in 30 days 104
S 22 A NEW HANOVER 1 WB ocean 5 in 30 days 104
S 23 NEW HANOVER 1 WB ocean 5 in 30 days 104
S 23 A NEW HANOVER 1 WB ocean 5 in 30 days 104
C 11 ONSLOW 1 HB ocean 5 in 30 days 104

33
C 13 ONSLOW 1 AO ocean 5 in 30 days 104S 29 A ONSLOW 1 JTB ocean 5 in 30 days 104S 30 A ONSLOW 1 JTB ocean 5 in 30 days 104S 30 B ONSLOW 1 JTB ocean 5 in 30 days 104C 92 PAMLICO 1 LNR sound 5 in 30 days 104C 92 A PAMLICO 1 LNR sound 5 in 30 days 104C 93 PAMLICO 1 UNR sound 5 in 30 days 104C 94 PAMLICO 1 UNR sound 5 in 30 days 104C 95 PAMLICO 1 UNR sound 5 in 30 days 104C 114 PAMLICO 1 PR sound 5 in 30 days 104S 25 A PENDER 1 JTB sound 5 in 30 days 104S 28 A PENDER 1 JTB ocean 5 in 30 days 104S 28 PENDER 1 JTB ocean 5 in 30 days 104S 29 PENDER 1 JTB ocean 5 in 30 days 104
Appendix 2: List of Tier II Monitoring Sites Funded by State of North Carolina
with sampling frequency and the single sample maximum.
C 126 A BEAUFORT 2 PR sound 2X per month 276 S 32 BRUNSWICK 2 SCL sound 2X per month 276 S 32 A BRUNSWICK 2 SCL sound 2X per month 276 S 34 BRUNSWICK 2 SCL sound 2X per month 276 S 35 BRUNSWICK 2 SCL sound 2X per month 276 S 35 A BRUNSWICK 2 SCL sound 2X per month 276 S 36 BRUNSWICK 2 SCL sound 2X per month 276 S 37 BRUNSWICK 2 SCL sound 2X per month 276 S 38 A BRUNSWICK 2 SCL sound 2X per month 276 S 39 BRUNSWICK 2 SCL sound 2X per month 276 S 40 BRUNSWICK 2 SCL sound 2X per month 276 S 40 B BRUNSWICK 2 SCL sound 2X per month 276 S 40 A BRUNSWICK 2 SCL sound 2X per month 276 S 42 A BRUNSWICK 2 SCL sound 2X per month 276 S 42 B BRUNSWICK 2 SCL sound 2X per month 276 S 43 A BRUNSWICK 2 SCL sound 2X per month 276 C 7 B CARTERET 2 AO sound 2X per month 276 C 30 A CARTERET 2 HB sound 2X per month 276 C 30 CARTERET 2 HB sound 2X per month 276 C 31 CARTERET 2 HB sound 2X per month 276 C 33 CARTERET 2 AO sound 2X per month 276 C 34 CARTERET 2 HB sound 2X per month 276 C 35 CARTERET 2 HB sound 2X per month 276 C 36 CARTERET 2 HB sound 2X per month 276 C 39 CARTERET 2 HB sound 2X per month 276 C 39 A CARTERET 2 HB sound 2X per month 276

34
C 40 CARTERET 2 HB sound 2X per month 276 C 41 B CARTERET 2 AO sound 2X per month 276 C 47 A CARTERET 2 HB sound 2X per month 276 C 48 A CARTERET 2 HB sound 2X per month 276 C 51 CARTERET 2 HB sound 2X per month 276 C 51 B CARTERET 2 HB sound 2X per month 276 C 53 A CARTERET 2 CI sound 2X per month 276 C 56 CARTERET 2 CI sound 2X per month 276 C 58 CARTERET 2 CI sound 2X per month 276 C 59 A CARTERET 2 CI sound 2X per month 276 C 60 A CARTERET 2 CI sound 2X per month 276 C 62 CARTERET 2 CI sound 2X per month 276 C 64 CARTERET 2 CI sound 2X per month 276 C 65 A CARTERET 2 CI sound 2X per month 276 C 66 CARTERET 2 CI sound 2X per month 276 C 68 CARTERET 2 CI sound 2X per month 276 C 69 B CARTERET 2 CI sound 2X per month 276 C 69 A CARTERET 2 CI sound 2X per month 276 C 75 CARTERET 2 CI sound 2X per month 276 C 76 CARTERET 2 CI sound 2X per month 276 C 84 CARTERET 2 LNR sound 2X per month 276 C 85 CARTERET 2 LNR sound 2X per month 276 C 102 A CRAVEN 2 UNR sound 2X per month 276 C 104 CRAVEN 2 UNR sound 2X per month 276 C 105 A CRAVEN 2 UNR sound 2X per month 276 C 106 CRAVEN 2 UNR sound 2X per month 276 C 107 CRAVEN 2 UNR sound 2X per month 276 C 110 CRAVEN 2 LNR sound 2X per month 276 N 84 A CURRITUCK 2 CC sound 2X per month 276 N 5 B DARE 2 CC sound 2X per month 276 N 5 C DARE 2 CC sound 2X per month 276 N 6 A DARE 2 CC sound 2X per month 276 N 9 A DARE 2 KH sound 2X per month 276 N 20 A DARE 2 RI sound 2X per month 276 N 21 B DARE 2 KH sound 2X per month 276 N 26 C DARE 2 O/PI sound 2X per month 276 N 28 A DARE 2 O/PI sound 2X per month 276 N 28 DARE 2 O/PI sound 2X per month 276 N 29 A DARE 2 O/PI sound 2X per month 276 N 31 DARE 2 O/PI sound 2X per month 276 N 33 DARE 2 O/PI sound 2X per month 276 N 33 A DARE 2 O/PI sound 2X per month 276 N 69 DARE 2 RI sound 2X per month 276 N 82 A DARE 2 CC sound 2X per month 276 N 86 DARE 2 RI sound 2X per month 276 N 88 A DARE 2 RI sound 2X per month 276
S 18 A NEW HANOVER 2 WB sound 2X per month 276
S 45 NEW HANOVER 2 SCL sound 2X per month 276
S 46 A NEW 2 SCL sound 2X per month 276

35
HANOVER
S 47 A NEW HANOVER 2 SCL sound 2X per month 276
S 48 NEW HANOVER 2 SCL sound 2X per month 276
S 48 A NEW HANOVER 2 SCL sound 2X per month 276
S 49 A NEW HANOVER 2 MS sound 2X per month 276
S 50 NEW HANOVER 2 MS sound 2X per month 276
S 50 A NEW HANOVER 2 MS sound 2X per month 276
S 50 B NEW HANOVER 2 MS sound 2X per month 276
C 22 A ONSLOW 2 HB sound 2X per month 276 C 23 A ONSLOW 2 HB sound 2X per month 276 C 27 A ONSLOW 2 HB sound 2X per month 276 S 56 ONSLOW 2 MS sound 2X per month 276 S 57 ONSLOW 2 MS sound 2X per month 276 S 58 ONSLOW 2 MS sound 2X per month 276 S 58 A ONSLOW 2 MS sound 2X per month 276 S 59 ONSLOW 2 MS sound 2X per month 276 S 61 A ONSLOW 2 MS sound 2X per month 276 S 61 B ONSLOW 2 MS sound 2X per month 276 C 86 A PAMLICO 2 LNR sound 2X per month 276 C 90 A PAMLICO 2 LNR sound 2X per month 276 C 96 A PAMLICO 2 UNR sound 2X per month 276 S 51 PENDER 2 MS sound 2X per month 276 S 52 PENDER 2 MS sound 2X per month 276 S 53 PENDER 2 MS sound 2X per month 276 S 54 PENDER 2 MS sound 2X per month 276 S 54 A PENDER 2 MS sound 2X per month 276
AREA STATION NO. COUNTY RUN LOCATION Frequency SSMAX C 22 A ONSLOW HB sound 2x Monthly 276 C 23 ONSLOW HB sound 2x Monthly 276 C 27 CARTERET HB sound 2x Monthly 276 C 30 A CARTERET HB sound 2x Monthly 276 C 30 CARTERET HB sound 2x Monthly 276 C 31 CARTERET HB sound 2x Monthly 276 C 34 CARTERET HB sound 2x Monthly 276 C 35 CARTERET HB sound 2x Monthly 276 C 36 CARTERET HB sound 2x Monthly 276 C 39 A CARTERET HB sound 2x Monthly 276 C 39 CARTERET HB sound 2x Monthly 276 C 40 CARTERET HB sound 2x Monthly 276 C 47 A CARTERET HB sound 2x Monthly 276 C 48 A CARTERET HB sound 2x Monthly 276 C 51 A CARTERET HB sound 2x Monthly 276 C 51 CARTERET HB sound 2x Monthly 276 C 53 A CARTERET CI sound 2x Monthly 276

36
AREA STATION NO. COUNTY RUN LOCATION Frequency SSMAX C 56 CARTERET CI sound 2x Monthly 276 C 58 CARTERET CI sound 2x Monthly 276 C 59 A CARTERET CI sound 2x Monthly 276 C 59 CARTERET CI sound 2x Monthly 276 C 60 A CARTERET CI sound 2x Monthly 276 C 62 CARTERET CI sound 2x Monthly 276 C 64 CARTERET CI sound 2x Monthly 276 C 65 A CARTERET CI sound 2x Monthly 276 C 66 CARTERET CI sound 2x Monthly 276 C 68 CARTERET CI sound 2x Monthly 276 C 69 A CARTERET CI sound 2x Monthly 276 C 69 B CARTERET CI sound 2x Monthly 276 C 69 CARTERET CI sound 2x Monthly 276 C 75 CARTERET CI sound 2x Monthly 276 C 76 CARTERET CI sound 2x Monthly 276 C 84 CARTERET LNR sound 2x Monthly 276 C 85 CARTERET LNR sound 2x Monthly 276 C 86 A PAMLICO LNR sound 2x Monthly 276 C 90 A PAMLICO LNR sound 2x Monthly 276 C 96 A PAMLICO UNR sound 2x Monthly 276 C 102 A CRAVEN UNR sound 2x Monthly 276 C 104 CRAVEN UNR sound 2x Monthly 276 C 105 A CRAVEN UNR sound 2x Monthly 276 C 106 CRAVEN UNR sound 2x Monthly 276 C 107 CRAVEN UNR sound 2x Monthly 276 C 110 CRAVEN LNR sound 2x Monthly 276 C 132 CARTERET CI sound 2x Monthly 276 N 86 DARE RI sound 2x Monthly 276 S 18 A NEW HANOVER WB sound 2x Monthly 276 S 32 BRUNSWICK SCL sound 2x Monthly 276 S 33 BRUNSWICK SCL sound 2x Monthly 276 S 34 BRUNSWICK SCL sound 2x Monthly 276 S 35 BRUNSWICK SCL sound 2x Monthly 276 S 36 BRUNSWICK SCL sound 2x Monthly 276 S 37 BRUNSWICK SCL sound 2x Monthly 276 S 38 BRUNSWICK SCL sound 2x Monthly 276 S 39 BRUNSWICK SCL sound 2x Monthly 276 S 40 BRUNSWICK SCL sound 2x Monthly 276 S 42 A BRUNSWICK SCL sound 2x Monthly 276 S 43 NEW HANOVER SCL sound 2x Monthly 276 S 44 NEW HANOVER SCL sound 2x Monthly 276 S 45 NEW HANOVER SCL sound 2x Monthly 276 S 46 NEW HANOVER SCL sound 2x Monthly 276 S 47 NEW HANOVER SCL sound 2x Monthly 276 S 48 NEW HANOVER SCL sound 2x Monthly 276 S 49 NEW HANOVER SCL sound 2x Monthly 276 S 50 NEW HANOVER MS sound 2x Monthly 276 S 51 PENDER MS sound 2x Monthly 276 S 52 PENDER MS sound 2x Monthly 276 S 53 PENDER MS sound 2x Monthly 276 S 54 PENDER MS sound 2x Monthly 276 S 55 ONSLOW MS sound 2x Monthly 276 S 56 ONSLOW MS sound 2x Monthly 276 S 57 ONSLOW MS sound 2x Monthly 276 S 58 ONSLOW MS sound 2x Monthly 276

37
AREA STATION NO. COUNTY RUN LOCATION Frequency SSMAX S 59 ONSLOW MS sound 2x Monthly 276 S 60 ONSLOW MS sound 2x Monthly 276 S 61 ONSLOW MS sound 2x Monthly 276 S 60 ONSLOW MS sound 2x Monthly 276 S 61 ONSLOW MS sound 2x Monthly 276
Appendix 3: List of Tier III Monitoring Sites Funded by State of North Carolina
with sampling frequency and single sample maximum.
AREA STATION NO. COUNTY RUN LOCATION Frequency SSMAX C 21 ONSLOW HB sound 2x Monthly 500 C 46 CARTERET HB sound 2x Monthly 500 C 55 B CARTERET CI sound 2x Monthly 500 C 56 A CARTERET CI sound 2x Monthly 500 C 73 CARTERET CI sound 2x Monthly 500 C 82 CARTERET LNR sound 2x Monthly 500 C 83 CRAVEN LNR sound 2x Monthly 500 C 89 PAMLICO LNR sound 2x Monthly 500 C 98 CRAVEN UNR sound 2x Monthly 500 C 99 CRAVEN UNR sound 2x Monthly 500 C 100 A CRAVEN UNR sound 2x Monthly 500 C 109 CRAVEN LNR sound 2x Monthly 500 N 24 DARE RI sound 2x Monthly 500

38
AREA STATION NO. COUNTY RUN LOCATION Frequency SSMAX N 38 DARE O/PI sound 2x Monthly 500 N 44 CURRITUCK EC sound 2x Monthly 500 N 46 CURRITUCK EC sound 2x Monthly 500 N 47 CURRITUCK EC sound 2x Monthly 500 N 49 A CAMDEN EC sound 2x Monthly 500 N 49 CAMDEN EC sound 2x Monthly 500 N 51 PASQUOTANK EC sound 2x Monthly 500 N 54 PERQUIMANS EC sound 2x Monthly 500 N 59 BERTIE C/MF sound 2x Monthly 500 N 61 BERTIE C/MF sound 2x Monthly 500 N 63 WASHINGTON PR/AR sound 2x Monthly 500 N 65 TYRRELL PR/AR sound 2x Monthly 500 N 67 DARE RI sound 2x Monthly 500 N 68 DARE RI sound 2x Monthly 500 N 70 DARE RI sound 2x Monthly 500 N 74 HYDE B/SP sound 2x Monthly 500 N 83 BEAUFORT B/SP sound 2x Monthly 500 N 87 BEAUFORT B/SP sound 2x Monthly 500 S 63 ONSLOW MS sound 2x Monthly 500 S 66 ONSLOW MS sound 2x Monthly 500 S 67 ONSLOW MS sound 2x Monthly 500 S 66 ONSLOW MS sound 2x Monthly 500 S 67 ONSLOW MS sound 2x Monthly 500
APPENDIX 4 : Station Locations
Station Longitude Latitude Station Longitude Latitude C1 -76.676192513 34.696927430C34 -77.01367991934.676835503C10 -77.097821664 34.644946052C35 -77.03386991234.676434141C100A -77.034878766 35.102980025C36 -77.00931347634.697298419C102 -76.972827267 35.022754891C37 -76.97139453934.708357019C104 -76.947509140 34.985444583C39 -76.94511796534.722179847C105 -76.906447877 34.944845587C4 -76.73933850734.697034796C106 -76.852640622 34.919776083C40 -76.89501330634.724020248C107 -76.818538597 34.941621183C41A -76.88605673734.689933489C109 -76.762786822 34.905902490C43 -76.83636527334.724394539C11 -77.269487290 34.569768458C45 -76.83231428134.701673596C110 -76.710483085 34.952294033C46 -76.78034285034.725643860C111 -77.051248658 35.535489610C47A -76.74574750334.709637298C112 -76.975586165 35.483640679C48A -76.73039549134.719052365C113 -76.953927445 35.484553126C5 -76.82876369934.692741552

39
C115 -76.855102497 35.451863601C51 -76.75159580134.721827079C116 -76.854428239 35.426399074C53A -76.68738635934.721589412C117 -76.900114710 35.433796309C55 -76.66926323834.722599869C118 -76.927363228 35.449261183C55A -76.66633293634.727078856C119 -76.964299148 35.437243701C55A -76.66628001034.727120323C120 -76.984924540 35.471923467C56 -76.66280368634.714686829C121 -77.022013868 35.506094114C56A -76.63219874334.709503984C126 -76.931791200 35.477473561C57 -76.68052952934.712907879C132 -76.391081145 34.877387307C58 -76.64462955134.688345961C133 -77.028055353 35.090181526C59 -76.61901574734.679418610C2 -76.697739982 34.693943138C6 -76.88112213334.686610139 C21 -77.271557146 34.572985793C60 -76.61479887034.708016190C22 -77.204969632 34.632508645C61 -76.62389855734.744176362C23 -77.181631768 34.634679200C62 -76.60816405034.789670161C26 -77.158395684 34.678575245C64 -76.57954809434.714194684C27 -77.116748698 34.686453112C65 -76.50700017734.721576289C3 -76.710739494 34.695234877C66 -76.52611623034.683908729C30 -77.100093151 34.672750255C67 -76.55899639834.692165236C31 -77.087364483 34.673968450C68 -76.51897059434.656150763C33 -77.046111220 34.669563760C69 -76.54988820334.629861110
Station Longitude Latitude Station Longitude Latitude C69A -76.524890730 34.623956597N18 -75.607950959 35.931427449C7 -76.956468619 34.675096843N19 -75.595232190 35.909120354C70 -76.506212295 34.786962032N2 -75.823630251 36.376580798C73 -76.450868321 34.818634978N20 -75.609894387 35.901302935C75 -76.318660481 34.856486596N21A -75.539971797 35.798597487C76 -76.331447347 34.883077466N21A -75.606525134 35.902055099C7A -76.909020955 34.685269887N22 -75.563146404 35.846935610C8 -77.034071621 34.660067573N24 -75.548283277 35.794852945C82 -76.690283605 34.850565257N25 -75.502511489 35.740506419C83 -76.648684617 34.905521001N26 -75.480072661 35.680190176C84 -76.652623135 34.938829009N26A -75.481257505 35.675173389C85 -76.596312138 34.981948607N26B -75.464863331 35.608633993C87 -76.639079008 35.056332038N27 -75.461071913 35.584637998C88 -76.662769243 35.039955297N28 -75.468587777 35.573357698C89 -76.681716351 35.029955807N29 -75.468287803 35.531190830

40
C9 -77.055400553 34.655208221N29A -75.475647812 35.533764701C90 -76.700763717 35.023224680N3 -75.809995754 36.328534901C92 -76.752293218 34.995337782N30 -75.492489048 35.376316031C93 -76.793613271 34.971373441N31 -75.501185632 35.369796565C94 -76.798148231 34.967167053N32 -75.507009613 35.320654615C95 -76.855544470 34.993477027N33 -75.514666188 35.298654708C96 -76.867348756 35.003182937N34 -75.520804424 35.254094799C97 -76.937091411 35.040918624N37 -75.604510371 35.232351881C98 -76.947721239 35.062713512N38 -75.660714343 35.220144348C99 -76.969988269 35.064260062N39 -75.643300965 35.223805252N1 -75.828589222 36.395900771N4 -75.792121734 36.278783180N12 -75.689589406 36.066736659N40 -75.703829781 35.204154799N12A -75.674080278 36.043669358N41 -75.778707089 35.180215473N12B -75.668471405 36.034940012N42 -75.920680997 35.123597437N13 -75.686800710 36.035516518N43 -75.959352070 35.102543745N14 -75.655798666 36.015373474N44 -75.863675538 36.234781792N15 -75.645905320 35.998360697N46 -75.924313362 36.425332729N16 -75.640609492 35.989196937N47 -75.965124608 36.422638207N17 -75.627210864 35.965340514N49 -76.146958333 36.289307232
Station Longitude Latitude Station Longitude Latitude N5 -75.766710244 36.203707833S19a -77.897369706 34.018418777N51 -76.177656992 36.269808547S19b -77.899879655 34.011794687N54 -76.382576548 36.081743746S2 -78.506642479 33.866738947N59 -76.743160248 36.124196652S20 -77.890965128 34.033675865N6 -75.757121240 36.168579488S21 -77.882522171 34.053686402N61 -76.818644041 35.916741092S22a -77.804552442 34.193089698N63 -76.488616678 35.959662385S23 -77.788756596 34.213892915N65 -76.285757854 35.965595269S25 -77.744938889 34.267404992N67 -75.620101383 35.841538824S28 -77.629162578 34.364554042N68 -75.723533114 35.927016022S29 -77.550263137 34.421631356N69 -75.702561515 35.915940041S30 -77.421343503 34.491061309N7 -75.734348072 36.145396324S32 -78.504150910 33.883248768N70 -75.660644669 35.919045959S33 -78.430797453 33.897080475N74 -76.340366732 35.403177722S34 -78.372285210 33.913505509N7A -75.722016270 36.121661220S35 -78.367659511 33.930822070N82 -75.757493045 36.175322313S36 -78.308194497 33.916081781N83 -76.816271027 35.476887168S37 -78.390963983 33.904746725N84 -75.822640987 36.325637070S38 -78.221634232 33.944395160N85 -75.653451477 36.011260505S39 -78.222649673 33.924446785N85A -75.650269426 36.006195860S40 -78.153927414 33.927216860N86 -75.668173972 35.908999026S41 -78.068827863 33.921271077N87 -76.612352544 35.532988370S42 -78.048223994 33.918640020N88 -75.632348393 35.951793014S43 -77.953442764 33.959697945
41
N89 -75.744420039 36.136351469S44 -77.940204932 34.011158926N9 -75.742850621 36.090753019S45 -77.918313674 34.051717435N91 -75.726800613 36.018639629S46 -77.882987765 34.081942431S1 -78.515342160 33.863766768S47 -77.861763118 34.139966581S10 -78.260460029 33.914140850S48 -77.819894005 34.183062275S13 -78.146863580 33.913182054S48 -77.823480184 34.196828383S14 -78.082999024 33.904049531S5 -78.438488200 33.886417382S15 -78.054430332 33.896655050S50 -77.806652815 34.223920491S18 -77.921292375 33.964301240S50 -77.770239366 34.262983248S18a -77.942101804 33.958935970S51 -77.732264570 34.308634227S19 -77.905223336 33.998303826S52 -77.674163714 34.359335344S53 -77.608161883 34.401670684S58 -77.342367726 34.551796486S54 -77.550306786 34.430485334S59 -77.398450646 34.578564881S55 -77.482245401 34.479566545S6 -78.412031897 33.893411461S56 -77.417732074 34.503511808S60 -77.382402994 34.615845594S57 -77.359901569 34.543997877S61 -77.389102065 34.673640547S9 -78.296994149 33.910952120S63 -77.434086631 34.752775713S67 -77.429412738 34.740373277S66 -77.427703079 34.741593299

42
APPENDIX: 5 Press release templates F. Easley, Governor William G. Ross Jr., Secretary
N.C. Department of Environment and Natural Resources
Release: Immediate Contact: Laura Leonard 919-715-3204, J.D. Potts 252-726 6827, Local Health Dir.
Date: Distribution: AP, Targeted BEACH WATER QUALITY ADVISORY FOR (name of place), OR
WATER QUALITY SWIMMING ADVISORY FOR (name of place); (CAUSE) BLAMED
RALEIGH- An advisory against swimming was posted today at a XX County site, where state environmental health officials found bacteria levels in the water that exceed the EPA recreational water quality standards. Waterfowl/stormwater runoff/boat discharges (pick one or say cause unknown) are the probable source of the bacteria. The advisory affects a portion of the XX (site name and general location), where water test results showed a level of Y colonies of enterococci bacteria per 100 milliliters of water, which exceeds the EPA standard of 35 colonies per 100 milliliters. Enterococcus, the organism used for testing, is found in the intestines of warm-blooded animals. While it does not cause illness itself, scientific studies indicate that its presence is closely correlated to the presence of other disease-causing organisms. People swimming or playing in waters with bacteria levels higher than the standard have an increased risk of developing gastrointestinal illness. This advisory is not a beach closing, nor does the advisory affect the entire ____ area. Swimming advisories affect waters within 200 feet of the sign. The sign posted reads as follows:
ATTENTION
SWIMMING IN THIS AREA NOT RECOMMENDED. BACTERIA TESTING INDICATES
LEVELS OF CONTAMINATION THAT MAY BE HAZARDOUS TO YOUR HEALTH. THIS ADVISORY AFFECTS WATERS WITHIN 200’ OF THIS SIGN.
OFFICE OF THE STATE HEALTH DIRECTOR State officials will continue testing the site, and they will remove the sign and notify the public again when the bacteria levels decrease to levels below the standard. Environmental health officials sample 225 sites throughout the coastal region, most of

43
them on a weekly basis from April to October. Testing continues on a reduced schedule during the rest of the year, when fewer people are in the water. “North Carolina’s coastal waters are generally very clean, and we test them frequently to confirm that they continue to be clean,” said Wayne Mobley, chief of the Shellfish Sanitation and Recreational Water Quality Section of the N.C. Division of Environmental Health. “On the occasions when waters do fail to meet the standards set by the EPA, we need to protect the public health by letting residents and visitors know.”
###

44
APPENDIX: 5 Press release templates continued Michael F. Easley, Governor William G. Ross Jr., Secretary
N.C. Department of Environment and Natural Resources
Release: Immediate Contact: Laura Leonard 919-715-3204, J.D. Potts 252-726 6827 Local Health Dir.
Date: Distribution: AP, Targeted BEACH WATER QUALITY ADVISORY FOR (name of place), OR
WATER QUALITY SWIMMING ADVISORY FOR (name of place); (CAUSE) BLAMED
RALEIGH- An advisory against swimming was posted today at a XX County site, where state environmental health officials found bacteria levels in the water that exceed the EPA recreational water quality standards. Waterfowl/stormwater runoff/boat discharges (pick one or say cause unknown) are the probable source of the bacteria. The advisory affects a portion of the XX (site name and general location), where water test results showed a level of Y colonies of enterococci bacteria per 100 milliliters of water, which exceeds the EPA single-sample standard of 104/276/500 colonies per 100 milliliters. Enterococcus, the organism used for testing, is found in the intestines of warm-blooded animals. While it does not cause illness itself, scientific studies indicate that its presence is closely correlated to the presence of other disease-causing organisms. People swimming or playing in waters with bacteria levels higher than the standard have an increased risk of developing gastrointestinal illness. This advisory is not a beach closing, nor does the advisory affect the entire ____ area. Swimming advisories affect waters within 200 feet of the sign. The sign posted reads as follows:
ATTENTION
SWIMMING IN THIS AREA NOT RECOMMENDED. BACTERIA TESTING INDICATES
LEVELS OF CONTAMINATION THAT MAY BE HAZARDOUS TO YOUR HEALTH. THIS ADVISORY AFFECTS WATERS WITHIN 200’ OF THIS SIGN.
OFFICE OF THE STATE HEALTH DIRECTOR State officials will test the site again tomorrow, and will continue testing the site if needed. They will remove the sign and notify the public again when the bacteria levels decrease to levels below the standard. Environmental health officials sample 225 sites throughout the coastal region, most of them on a weekly basis from April to October.

45
Testing continues on a reduced schedule during the rest of the year, when fewer people are in the water. “North Carolina’s coastal waters are generally very clean, and we test them frequently to confirm that they continue to be clean,” said Wayne Mobley, chief of the Shellfish Sanitation and Recreational Water Quality Section of the N.C. Division of Environmental Health. “On the occasions when waters do fail to meet the standards set by the EPA, we need to protect the public health by letting residents and visitors know.”
###

46
Appendix: 6 Advisories Signs
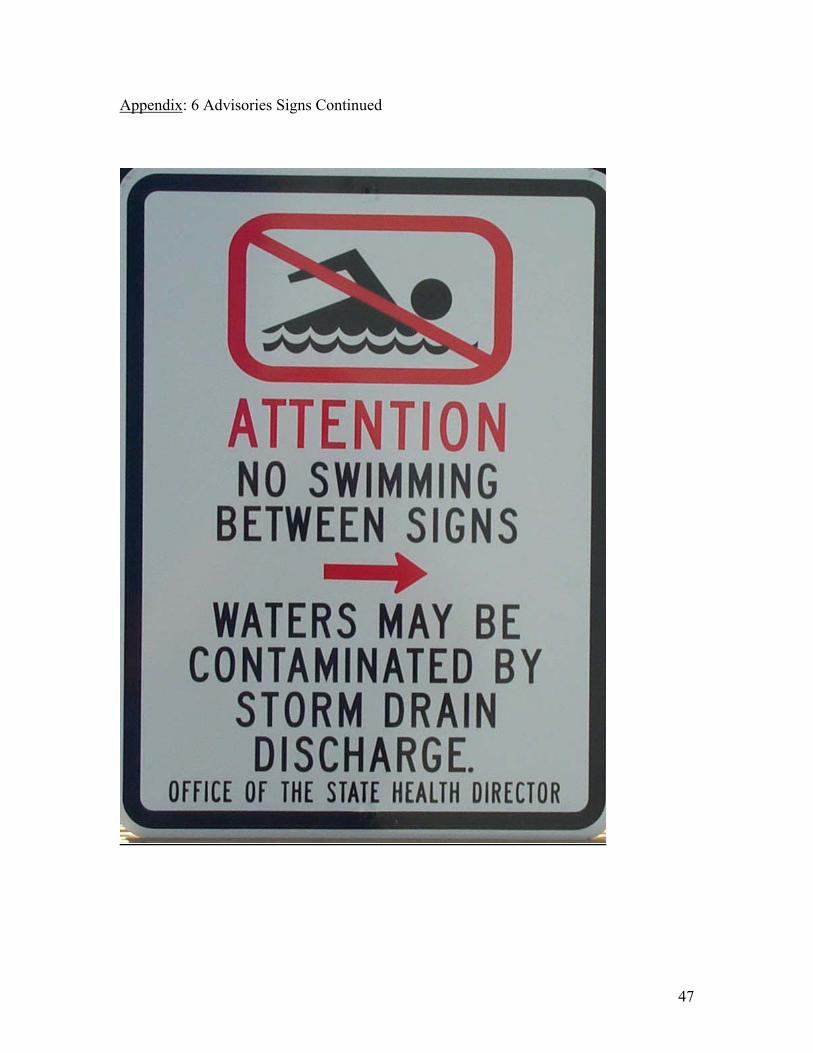
47
Appendix: 6 Advisories Signs Continued

48
Appendix: 6 Advisories Signs Continued

49
Appendix 7: Example of Field Sampling Sheet with Lab results

50
Appendix 7 continued. Flip Side of Sampling Sheet and Chain of Custody
51
Appendix7 Continued. Example of Access and Excel databases,

52
Appendix 8: Educational Materials
Recreational Water Quality Program—an overview of the new standard Malcolm Blalock, consultant to Shellfish Sanitation and Recreational Water Quality Does anyone check the waters on the coast to see if it’s safe to swim and play in them? Yes, the Recreational Water Quality Program operated by the Shellfish Sanitation Section of the Division of Environmental Health monitors coastal waters on a year-round basis. Since its inception in 1997, the program has fulfilled its purpose: “To protect the public health by monitoring the quality of North Carolina’s coastal recreational waters and notifying the public when bacteriological standards for safe bodily contact are exceeded”. The program has identified 225 specific locations where the public swims and plays in coastal waters and has sorted the areas into three tiers, determined by use patterns and the resultant risks of someone becoming ill from contaminated water. Approximately 50 percent of these sites are Tier I sites, those with the most use. Examples of these areas include oceanfront beaches, summer camp swimming areas and jet-ski rental facilities. Approximately 40 percent of the sites are Tier II areas. These areas have less usage and are generally accessible only via watercraft. Examples of these sites include public access areas, boat ramps, and other places where smaller numbers of people use the water. The remaining 10 percent of the sites are classified as Tier III areas; those have only occasional use and fewer people at risk. The ocean beaches and other high usage areas are sampled once per week from the beginning of April to the end of September. All stations are sampled twice per month during October, and then once per month in the winter and spring, November through March. The program uses enterococci as the indicator organism for contamination, based on current US EPA recommendations. Enterococci are the organisms most consistently present in the intestinal tracts of animals and are most closely associated with incidents of human illness. The program uses an EPA-mandated standard of 35 colonies per 100ml of water, based on a geometric mean (log average) using the most recent five sample results collected over the previous 30 days. It also uses a single-sample maximum of 104 colonies per 100 ml of water to indicate that the water in question exceeds that standard. Exceeding either of these standards will result in public notification procedures being activated. When the standards are exceeded, local officials are notified, a press release is issued, and a sign is posted at the affected area, warning the public of the risks associated with swimming or playing in the water at this site. The program will continue to sample the area repeatedly. When the area ceases to exceed the standard, the sign is removed, local

53
officials are notified again and another press release is issued. The program has placed as many as 13 (in 1998) and as few as zero (2002) signs over the duration of the program. Point-source contamination sources are also the sites of sign postings. Sources such as sewage treatment plant outfall pipes are permanently posted to warn swimmers not to swim or play in such areas. More problematic are pipes with stormwater discharges. These discharges are heavily contaminated but discharge only intermittently, during and after rainfall events. Currently the program posts these pipes when they begin discharging during a storm and removes the posting 24 hours after the discharge stops. In an effort to raise awareness of the program and to solicit input from the public, several public meetings are being scheduled for the spring. These meetings will be held primarily in beach communities along the coast and will involve local officials, travel/tourism representatives, property owners and members of the general public. Media packages will be developed to publicize the meetings. J.D. Potts leads the program from the Morehead City office, and five water samplers stationed in Nags Head (1), Morehead City (2), and Wrightsville Beach (2) perform the water testing. EPA awarded two grants were awarded in 2002 to fully implement the program and to fund the activities of two consultants. Malcolm Blalock and Dave Clawson were hired as consultants to focus on increasing public awareness and support of the program and developing state rules for the program, respectively. We hope to keep North Carolinian residents and visitors swimming in the coastal waters for generations to come!

54
Apendix 8: Educational Materials continued.
THE FACTS: RECREATIONAL WATER QUALITY MONITORING IN NORTH CAROLINA
ATTENTION
SWIMMING IN THIS AREA IS NOT RECOMMENDED. BACTERIA TESTING INDICATES LEVELS OF
CONTAMINATION THAT MAY BE HAZARDOUS TO YOUR HEALTH. THIS ADVISORY AFFECTS WATERS WITHIN 200 FT. OF THIS SIGN.
OFFICE OF STATE HEALTH DIRECTOR
I saw this sign at the beach- who put it there and what does it mean?
In June of 1997, the North Carolina Shellfish Sanitation and Recreational Water Quality Section of the Department of Environment and Natural Resources was given the responsibility of initiating a recreational water quality monitoring program in the coastal waters of the state. The coastal waters monitored include the ocean beaches, sounds, bays, and estuarine rivers.
The primary purpose of the program is to protect the public health by monitoring the quality of North Carolina’s coastal recreational waters and notifying the public when bacteriological standards for safe bodily contact are exceeded. To be in compliance with the swimming standard, a geometric mean (log average) of five weekly samples cannot exceed 35 enterococci organisms per 100 ml. The geometric mean is based upon five samples taken within a 30-day period. In addition, areas may be posted on a temporary basis if a single sample exceeds the standards for that area, which are set depending on usage. Areas posted based on single sample results will be retested on a daily basis. If the swimming standard is exceeded, a press release is sent out to inform the public and warning signs are posted at the swimming site. Discharges of stormwater and flood water into swimming areas may also prompt a swimming advisory that will last for 24 hours after the discharge has ended.
While the waters of North Carolina are generally very clean and safe places to swim, it is important to monitor them continually, so the public can be informed of any localized problems.
Are North Carolina’s beaches safe for swimming? Prior to 2003, North Carolina’s ocean beaches have not exceeded the swimming standard, which means that they are safe and healthy for swimming. Using the previously mandated standard,

55
which tested for different bacteria, in the summer of 2000 only five sound side stations exceeded the swimming standard.
Will I get sick if I swim in waters under a swimming advisory? Not necessarily, but you are at an increased risk.
What kind of illnesses can I contract from swimming in polluted waters? The most common are diarrheal diseases that can be caused by bacteria, viruses and parasitic protozoa. Ear, nose, throat, skin and respiratory infections are also commonly associated with swimming in contaminated water. What should I do if I become ill after swimming? If you develop diarrhea or an infection after swimming in NC coastal waters, seek medical treatment and then please contact the Shellfish Sanitation and Recreational Water Quality Section of the Division of Environmental Health at (252) 726-6827. We’d like to know about any possible waterborne illness outbreaks as soon as possible, to prevent more people from becoming ill.
Where are the disease-causing organisms coming from and how are
they getting into the water?
Pathogens come from both human and animals. Poorly treated wastewater from treatment plants, malfunctioning septic systems and boat discharges are sources of fecal contamination. Stormwater runoff from agricultural and urban areas delivers pathogens from humans, livestock, wildlife, and pets into recreational waters. Germs rinsed off other swimmers directly into the bathing area are common sources of contamination.
Can I get sick from swimming in fresh water lakes and rivers? Yes. Fresh water is affected by runoff and point source discharges just like coastal waters. Unfortunately the state does not have a monitoring program for inland recreational waters. The public should avoid fresh water swimming after heavy rain especially near storm drains.
How many stations do you monitor and how often do you monitor them? The section samples 225 stations throughout the coastal area at different frequencies, depending on the time of year and the use patterns of the site. The ocean beaches and other high usage areas

56
are sampled once per week between the beginning of April and the end of September. All stations are sampled twice per month during October, and then once per month in the winter and spring, November through March. How long does a swimming advisory stay posted? In the case of areas exceeding the geometric mean, the sign will remain up for at least two weeks. Two consecutive samples must be collected on a weekly schedule, which must register fewer than 35 enterococci per 100 ml. If the posting is due to the single maximum sample standard, the sign will remain posted as long as the standard is exceeded. I have more questions- where can I go for answers? If you have further questions about the recreational water quality monitoring program or wish to obtain further information, you can call J.D. Potts at the Shellfish Sanitation and Recreational Water Quality Monitoring Section of the Division of Environmental Health at (252) 726-6827 or [email protected]. You can also view beach postings online at http://www.earth911.org
Printing of this document was funded entirely through a grant from the U.S. EPA.

57
Appendix 9: Laboratory Quality Assurance