north beach technical workshop june 26, 2010 barton...
TRANSCRIPT

Barton Basin Public MeetingBarton Basin Public MeetingMarch 18 2010March 18 2010
North Beach Technical WorkshopJune 26, 2010
March 18, 2010March 18, 2010

Understanding the North Beach Understanding the North Beach B iB iBasinBasin
P id dditi l i f ti t d ibP id dditi l i f ti t d ib•• Provide additional information to describe Provide additional information to describe the North Beach basin collection systemthe North Beach basin collection system
•• Answer specific questions:Answer specific questions:–– How was the basis of design (flow and How was the basis of design (flow and
l ) d t d l d?l ) d t d l d?volume) data developed?volume) data developed?–– How was storage volume updated to How was storage volume updated to
reflect recent data?reflect recent data?reflect recent data?reflect recent data?–– How did the team consider I/I and Green How did the team consider I/I and Green
StormwaterStormwater Infrastructure (Infrastructure (GSIGSI)?)?
2
(( ))

Regional Regional C S tC S tConveyance SystemConveyance System
N th B h B i iN th B h B i i•• North Beach Basin is North Beach Basin is “headwaters” of regional “headwaters” of regional conveyance systemconveyance systemconveyance systemconveyance system
3

King County and King County and SPU S tSPU S tSPU SystemsSPU Systems
B th KiB th Ki•• Both King Both King County and County and SPU operateSPU operateSPU operate SPU operate sewer systems sewer systems in North Seattlein North Seattlein North Seattlein North Seattle
4

King County and King County and SPU S tSPU S tSPU SystemsSPU Systems
B th KiB th Ki•• Both King Both King County and County and SPU operateSPU operateSPU operate SPU operate sewer systems sewer systems in North Seattlein North Seattle
5

King County and King County and SPU S tSPU S tSPU SystemsSPU Systems
B th KiB th Ki•• Both King Both King County and County and SPU operateSPU operateSPU operate SPU operate sewer systems sewer systems in North Seattlein North Seattlein North Seattlein North Seattle
6

7

North Beach Conveyance SystemNorth Beach Conveyance SystemNorth Beach Conveyance SystemNorth Beach Conveyance System
North Beach pumps toNorth Beach pumps to CarkeekCarkeek Wet WeatherWet Weather•• North Beach pumps to North Beach pumps to CarkeekCarkeek Wet Weather Wet Weather Treatment Facility and Pump StationTreatment Facility and Pump Station–– Maximum North Beach PS capacity is ~3 Maximum North Beach PS capacity is ~3 mgdmgdp yp y gg
•• Under “low flow” conditions (below ~9 Under “low flow” conditions (below ~9 mgdmgd) ) CarkeekCarkeek flows are pumped to 8flows are pumped to 8thth Ave. Ave. I t t d lti t l t W t P i tI t t d lti t l t W t P i tInterceptor, and ultimately to West Point Interceptor, and ultimately to West Point Treatment PlantTreatment Plant
•• Under “high flow” conditionsUnder “high flow” conditions CarkeekCarkeek•• Under high flow conditions Under high flow conditions CarkeekCarkeekdischarges treated effluent discharges treated effluent andand pumps to pumps to West Point Treatment PlantWest Point Treatment Plant
8

Steps to Determine Control Steps to Determine Control R i tR i tRequirementsRequirements
M d i ti flM d i ti fl•• Measured existing flowsMeasured existing flows–– North Beach PS flow metersNorth Beach PS flow meters
C ll ti t fl itC ll ti t fl it–– Collection system flow monitorsCollection system flow monitors
•• Performed hydraulic/hydrologic analysisPerformed hydraulic/hydrologic analysis•• Calibrated the data to measured flowsCalibrated the data to measured flows•• Used the analysis to predict flow responseUsed the analysis to predict flow response•• Used the analysis to predict flow response Used the analysis to predict flow response
over a longover a long--term rainfall record (30 years)term rainfall record (30 years)•• Calculated storage/conveyance capacityCalculated storage/conveyance capacity
9
•• Calculated storage/conveyance capacity Calculated storage/conveyance capacity needed for regulatory complianceneeded for regulatory compliance

North Beach North Beach CSOCSO Basin Basin B d iB d iNorth Beach SubNorth Beach Sub--basin Delineationbasin DelineationBoundariesBoundaries
MM
North Beach Pump Station
M M
M
M
10

Flow Meters Used to Develop Basin Flow Meters Used to Develop Basin H d hH d hHydrographsHydrographs
0
5.00
5.50
3.50
4.00
4.50
2.00
2.50
3.00
Flow
(mgd)
FLO
W
0.50
1.00
1.50
11
0.00
11/13/2001 11/13/2001 11/14/2001 11/14/2001 11/15/2001TIME

“Typical” North Beach Basin“Typical” North Beach BasinD W th H d hD W th H d hDry Weather HydrographDry Weather Hydrograph
0
5.00
5.50
3.50
4.00
4.50
NBPSCapacity
2.00
2.50
3.00
Flow
(mgd)
0.50
1.00
1.50
12
0.00
11/13/2001 11/13/2001 11/14/2001 11/14/2001 11/15/2001
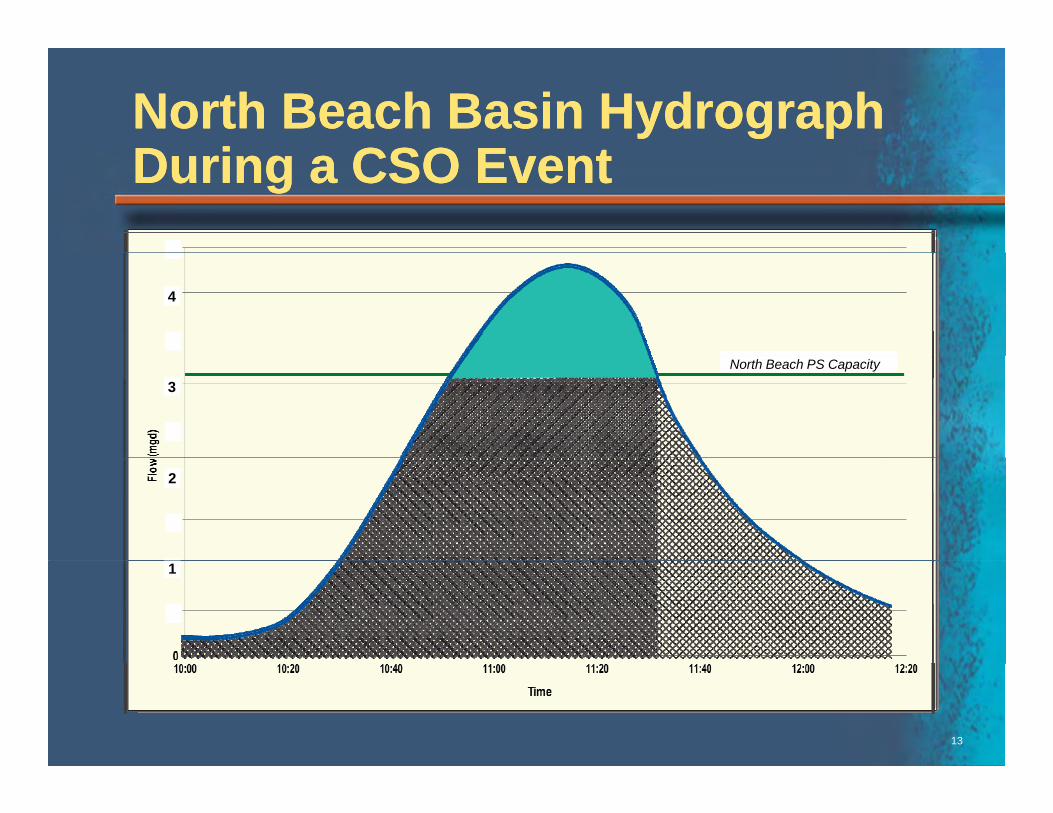
North Beach Basin HydrographNorth Beach Basin HydrographD iD i CSOCSO E tE tDuring a During a CSOCSO EventEvent
4
3North Beach PS Capacity
2
1
13

OneOverflowOneStoredFlow.gif

CSO Control Needs Determined CSO Control Needs Determined F H d hF H d hFrom Hydrograph From Hydrograph
Convey & Treat Approachand Onsite Treatment Approach
Additional Capacity Required
Storage ApproachVolume Required
4
Peak-Flow ReductionApproachFlo Red ction
3North Beach PS Capacity
Flow ReductionRequired2
1
15

Results of AnalysisResults of AnalysisResults of AnalysisResults of Analysis
N th B hN th B h CSOCSO•• North Beach North Beach CSOsCSOs–– Average of 10 events per yearAverage of 10 events per year
A f 2 2A f 2 2 M lM l–– Average of 2.2 Average of 2.2 MgalMgal per yearper year
•• 230,000 gal of storage for 230,000 gal of storage for CSOCSO controlcontrol–– Tank roughly 75’ x 30’ x 15’ deep (inside Tank roughly 75’ x 30’ x 15’ deep (inside
dimensions)dimensions)Alternately need 300’ of 12’ dia Pipe (insideAlternately need 300’ of 12’ dia Pipe (inside–– Alternately need 300 of 12 dia. Pipe (inside Alternately need 300 of 12 dia. Pipe (inside dimensions)dimensions)
•• 8 58 5 mgdmgd of conveyance/treatment capacityof conveyance/treatment capacity
16
•• 8.5 8.5 mgdmgd of conveyance/treatment capacity of conveyance/treatment capacity is required to eliminate storageis required to eliminate storage

Developing and Evaluating CSO Developing and Evaluating CSO Alt tiAlt tiAlternativesAlternatives
Provide additional information to describeProvide additional information to describe•• Provide additional information to describe Provide additional information to describe the process of developing alternativesthe process of developing alternatives
•• Answer specific questions:Answer specific questions:•• Answer specific questions:Answer specific questions:–– What process was used to develop What process was used to develop
alternatives?alternatives?–– How would I/I reduction and/or Green How would I/I reduction and/or Green
Stormwater Infrastructure (GSI) work in Stormwater Infrastructure (GSI) work in the basin?the basin?the basin?the basin?
–– What options and sites were considered in What options and sites were considered in the basin?the basin?
17

Approaches Based on Technical Approaches Based on Technical R i t d F ibilitR i t d F ibilitRequirements and FeasibilityRequirements and Feasibility
Hydrologic/hydraulicHydrologic/hydraulic•• Hydrologic/hydraulic Hydrologic/hydraulic analysis established analysis established control requirementscontrol requirementsqq
•• Range of control Range of control approaches considered :approaches considered :pppp–– StorageStorage–– OnOn--site Treatmentsite Treatment–– Conveyance and Conveyance and
treatmenttreatment–– Peak flow reductionPeak flow reduction
18
Peak flow reductionPeak flow reduction
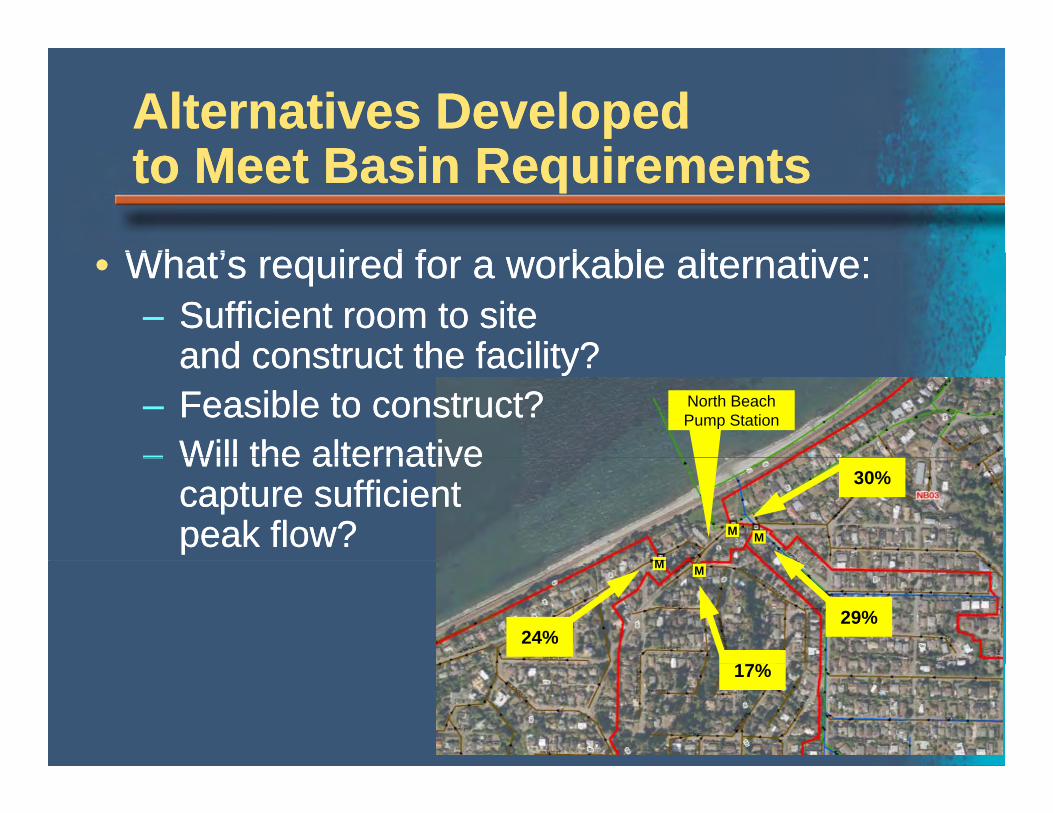
Alternatives DevelopedAlternatives Developedt M t B i R i tt M t B i R i tto Meet Basin Requirementsto Meet Basin Requirements
Wh t’ i d f k bl lt tiWh t’ i d f k bl lt ti•• What’s required for a workable alternative:What’s required for a workable alternative:–– Sufficient room to siteSufficient room to site
and construct the facility?and construct the facility?North Beach Pump Station
and construct the facility?and construct the facility?–– Feasible to construct?Feasible to construct?–– Will the alternativeWill the alternative
M
MM
30%–– Will the alternativeWill the alternative
capture sufficientcapture sufficientpeak flow?peak flow?
M M
29%24%
19
17%

What Alternatives Were What Alternatives Were C id d?C id d?Considered?Considered?
•• 1A: Bottom of Basin Storage (Rectangular Tank)1A: Bottom of Basin Storage (Rectangular Tank)•• 1A: Bottom of Basin Storage (Rectangular Tank)1A: Bottom of Basin Storage (Rectangular Tank)•• 1B: Bottom of Basin Storage (Pipe in ROW)1B: Bottom of Basin Storage (Pipe in ROW)
1C St /P i (St t T f B i )1C St /P i (St t T f B i )•• 1C: Storage/Pumping (Store at Top of Basin)1C: Storage/Pumping (Store at Top of Basin)•• 1D: Storage/Pumping (Store at Bottom of Basin)1D: Storage/Pumping (Store at Bottom of Basin)•• 2A: Convey and Treat (Beach FM alignment)2A: Convey and Treat (Beach FM alignment)•• 2B: Convey and Treat (Neighborhood FM alignment)2B: Convey and Treat (Neighborhood FM alignment)•• 3A: On3A: On--site Treatment (Bottom of Basin)site Treatment (Bottom of Basin)•• 3B: On3B: On--site Treatment (Up in Basin)site Treatment (Up in Basin)
20
( p )( p )•• 5A: Peak Flow Reduction (I/I Removal)5A: Peak Flow Reduction (I/I Removal)

Alternative 5A: Peak Flow Alternative 5A: Peak Flow R d ti (I/I R l)R d ti (I/I R l)Reduction (I/I Removal)Reduction (I/I Removal)
E l t fl d t d i k t tE l t fl d t d i k t t•• Evaluate flow data during peak events to Evaluate flow data during peak events to estimate:estimate:
Where in the basin flows are coming fromWhere in the basin flows are coming from–– Where in the basin flows are coming fromWhere in the basin flows are coming from–– What type of connection (inflow or What type of connection (inflow or
infiltration) is contributing to peakinfiltration) is contributing to peakinfiltration) is contributing to peakinfiltration) is contributing to peak
•• Based on prior experience, estimate:Based on prior experience, estimate:Amount of flow/volume that can beAmount of flow/volume that can be–– Amount of flow/volume that can be Amount of flow/volume that can be reducedreduced
–– Potential cost of inflow and infiltrationPotential cost of inflow and infiltration
21
Potential cost of inflow and infiltration Potential cost of inflow and infiltration removalremoval

North Beach Basin Flow Impacted byNorth Beach Basin Flow Impacted byB th I fl d I filt tiB th I fl d I filt tiBoth Inflow and InfiltrationBoth Inflow and Infiltration
NOTE: Separate stormNOTE: Separate storm sewers do not exist in North Beach basin
22

Flow Data Used to Estimate I/I Flow Data Used to Estimate I/I M it dM it d
5.5
Design 1‐Year Storm Flows(November2001)5.5
Design 1‐Year Storm Flows(November 2001)5 5
Design 1‐Year Storm Flows(November 2001)
MagnitudeMagnitude
4.5
5
5.5 (November 2001)
4.5
5
5.5 (November 2001)
4.5
5
5.5 (November 2001)
3
3.5
4
mgd)
3
3.5
4
mgd)
Sanitary+ Inflow3
3.5
4
mgd) Total Flow ( sanitary +
Inflow + Infiltration)
1 5
2
2.5
Flow
(m
Sanitary
1 5
2
2.5
Flow
(m Sanitary + Inflow
Sanitary
1 5
2
2.5
Flow
(m
Sanitary + Inflow
Sanitary
0.5
1
1.5
0.5
1
1.5
0.5
1
1.5 Sanitary
23
0
11/11/2001 11/12/2001 11/13/2001 11/14/2001 11/15/2001 11/16/2001
Time
0
11/11/2001 11/12/2001 11/13/2001 11/14/2001 11/15/2001 11/16/2001
Time
0
11/11/2001 11/12/2001 11/13/2001 11/14/2001 11/15/2001 11/16/2001
Time

Inflow Sources Estimated Using Inflow Sources Estimated Using Fl /GIS D tFl /GIS D tFlow/GIS DataFlow/GIS Data
Total No of Houses: 2 388Total No of Houses: 2 388•• Total No. of Houses: 2,388Total No. of Houses: 2,388•• Total Connected Rooftop Total Connected Rooftop
Area: 13 Ac.Area: 13 Ac.•• Avg. Rooftop Area: 1,780 ftAvg. Rooftop Area: 1,780 ft22
•• Equivalent to ~310 Houses Equivalent to ~310 Houses ConnectedConnectedConnectedConnected
•• Connected Houses Spread Connected Houses Spread Throughout BasinThroughout Basin
24

Inflow Reduction = Disconnecting Inflow Reduction = Disconnecting R f D i P i t P tR f D i P i t P tRoof Drains on Private PropertyRoof Drains on Private Property
K A ti /R i tK A ti /R i t•• Key Assumptions/RequirementsKey Assumptions/Requirements–– Approximately 75% of connected houses Approximately 75% of connected houses
could feasibly be separatedcould feasibly be separatedcould feasibly be separatedcould feasibly be separated–– For these houses, 100% of the rooftop For these houses, 100% of the rooftop
stormwaterstormwater would be removed from the would be removed from the sewer systemsewer system
–– Average construction cost of disconnecting Average construction cost of disconnecting i $3 300 h (b l )i $3 300 h (b l )is $3,300 per house (base cost only)is $3,300 per house (base cost only)
–– Additional Additional stormwaterstormwater must be controlledmust be controlledNeighborhood concerns with flooding slopeNeighborhood concerns with flooding slope
25
•• Neighborhood concerns with flooding, slope Neighborhood concerns with flooding, slope stabilitystability

Roof Drain DisconnectionRoof Drain DisconnectionI iti l C l iI iti l C l iInitial ConclusionsInitial Conclusions
St t b li i t d bSt t b li i t d b•• Storage cannot be eliminated by Storage cannot be eliminated by disconnecting roof drains alonedisconnecting roof drains alone–– Storage may be reduced to ~40 000 gallonsStorage may be reduced to ~40 000 gallons–– Storage may be reduced to 40,000 gallons Storage may be reduced to 40,000 gallons
with the most aggressive roof drain with the most aggressive roof drain disconnection programdisconnection program
•• Removing infiltration from private side Removing infiltration from private side sewers is also required to eliminate storagesewers is also required to eliminate storageAdditi l i f t t fAdditi l i f t t f t tt t•• Additional infrastructure for Additional infrastructure for stormwaterstormwater–– Storm sewers do not exist in majority of Storm sewers do not exist in majority of
basinbasin
26
basinbasin–– StormwaterStormwater treatment likely requiredtreatment likely required

Disconnection Would Decrease Disconnection Would Decrease V l d Si f StV l d Si f StVolume and Size of StorageVolume and Size of Storage
27
230,000 gallons Storage

Disconnection Would Decrease Disconnection Would Decrease V l d Si f StV l d Si f StVolume and Size of StorageVolume and Size of Storage
28
40,000 gallons Storage

Infiltration Reduction = Infiltration Reduction = R&RR&R of Side of Side S P i t P tS P i t P tSewers on Private PropertySewers on Private Property
K A ti /R i tK A ti /R i t•• Key Assumptions/RequirementsKey Assumptions/Requirements–– Leaking side sewers on private property Leaking side sewers on private property
must be repaired/replaced (must be repaired/replaced (R&RR&R) to reduce) to reducemust be repaired/replaced (must be repaired/replaced (R&RR&R) to reduce ) to reduce flowflow
–– ~60% of leaky side sewers on private ~60% of leaky side sewers on private % y p% y pproperty can feasibly be repairedproperty can feasibly be repaired
–– R&RR&R removes 60 to 75% of the groundwater removes 60 to 75% of the groundwater f hf hfrom the sewer systemfrom the sewer system
–– Average cost for repair is $11,000 per private Average cost for repair is $11,000 per private side sewer (base cost only)side sewer (base cost only)
29
side sewer (base cost only)side sewer (base cost only)
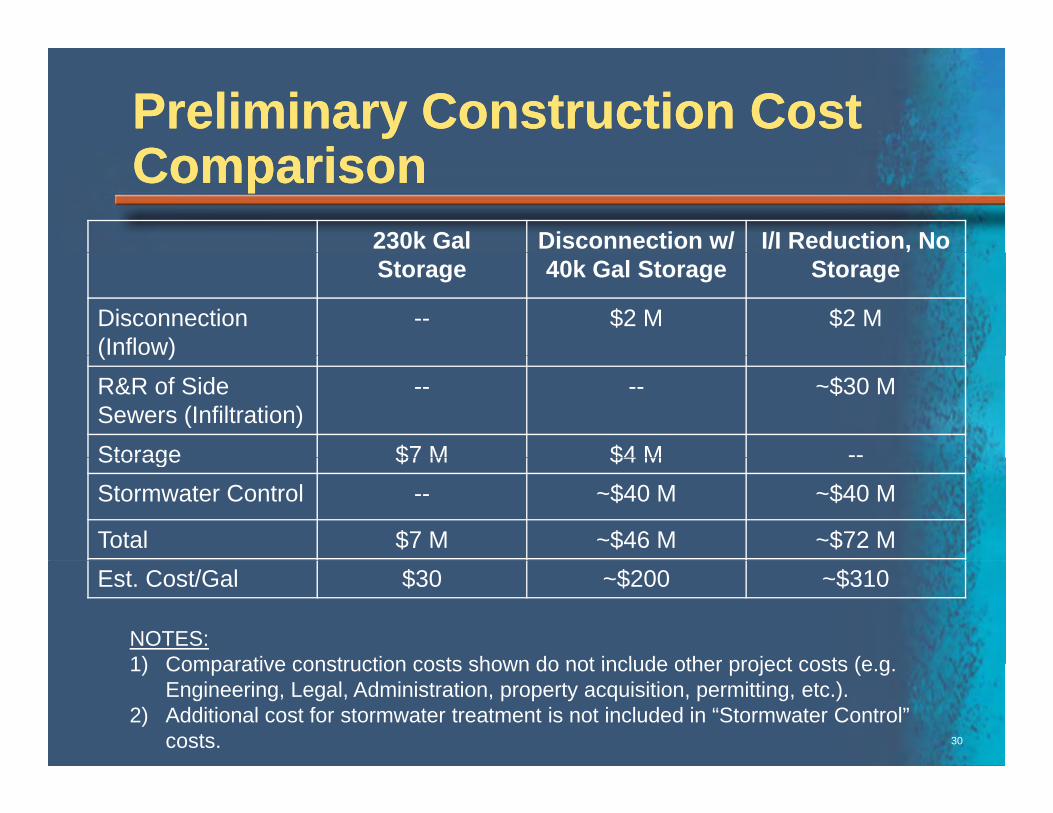
Preliminary Construction Cost Preliminary Construction Cost C iC iComparisonComparison
230k Gal Disconnection w/ I/I Reduction, No Storage 40k Gal Storage Storage
Disconnection (Inflow)
-- $2 M $2 M( )R&R of Side Sewers (Infiltration)
-- -- ~$30 M
Storage $7 M $4 M --Storage $7 M $4 MStormwater Control -- ~$40 M ~$40 M
Total $7 M ~$46 M ~$72 MEst. Cost/Gal $30 ~$200 ~$310
NOTES:1) Comparative construction costs shown do not include other project costs (e g
30
1) Comparative construction costs shown do not include other project costs (e.g. Engineering, Legal, Administration, property acquisition, permitting, etc.).
2) Additional cost for stormwater treatment is not included in “Stormwater Control” costs.

Overall Summary and Conclusions Overall Summary and Conclusions (I/I C t l)(I/I C t l)(I/I Control)(I/I Control)
I/I t fI/I t f CSOCSO t l t thi tit l t thi ti•• I/I not proven for I/I not proven for CSOCSO control at this timecontrol at this time•• King County’s I/I Program is under King County’s I/I Program is under
developmentdevelopment•• I/I projects are being pursued based on:I/I projects are being pursued based on:p j g pp j g p
–– Close coordination with member agenciesClose coordination with member agencies–– Lessons learned from I/I pilot basinsLessons learned from I/I pilot basins–– Cost effectiveness compared to other Cost effectiveness compared to other
alternativesalternatives
31

Why use GSI?Why use GSI?
• Green Stormwater Infrastructure (GSI)• Green Stormwater Infrastructure (GSI)• Considerable challenges with using GSI,
especially in the North Beach areaespecially in the North Beach area• King County and SPU worked together to
integrate GSI into CSO planningintegrate GSI into CSO planning– Reduce size of grey infrastructure project
Reduce costs of CSO program implementation– Reduce costs of CSO program implementation– Reduce stormwater volume over time– Adapt to unknown future conditions
32
– Adapt to unknown future conditions

GSI EvaluationGSI Evaluation
Where does the flowthe flow
come from and where isand where is
it going?
33

Three SourcesThree Sources
• Roofs• Impervious• Impervious
Areas• Pervious• Pervious
Areas
34

Field VerificationField Verification
35

GSI Spatial AnalysisGSI Spatial Analysis
Id tif fi GSI t h i• Identify five GSI techniques– Ecoroofs/Green Roofs
R f Di ti– Roof Disconnection– Street Trees
Bioretention– Bioretention– Permeable Pavement
U f i i id if i bl• Use a set of criteria to identify suitable locations
36

GSI Project in BartonGSI Project in Barton
Id tifi d B t b i h i hi h t• Identified Barton basin having highest feasibility for most green techniques
• Identified large area of connected streets• Proceed with a project similar to SPU’s p j
Ballard Roadside Rain Gardens project• Allow SPU and King County to evaluateAllow SPU and King County to evaluate
design, construction and performance of GSI in combined basins
37

Evaluation for Green Stormwater I f t t i N th B hInfrastructure in North Beach
• Connected areasConnected areas established through geographic g g pinformation system evaluation
38

Impervious Areas Connected to C bi d S S tCombined Sewer System
Source Acres
Residential Roof Area 5Residential Roof Area 5
Residential Impervious 6
Non Residential Roof 6Non-Residential Roof 6
Non-Residential Impervious 9
CSS ROW (Streets) 0
TOTAL 26
39

Challenges for GSIChallenges for GSI
St lSt l•• Steep slopesSteep slopes•• Lack of connection in public right of wayLack of connection in public right of way•• Unproven criteria and assumptionsUnproven criteria and assumptions•• Implementation requires voluntaryImplementation requires voluntary•• Implementation requires voluntary Implementation requires voluntary
participationparticipationSt till d d t t i k CSOSt till d d t t i k CSO•• Storage still needed to contain peak CSOStorage still needed to contain peak CSO
•• BuyBuy--in from regulatorsin from regulators
40

What Alternatives Were What Alternatives Were C id d?C id d?Considered?Considered?
•• 1A: Bottom of Basin Storage (Rectangular Tank)1A: Bottom of Basin Storage (Rectangular Tank)•• 1A: Bottom of Basin Storage (Rectangular Tank)1A: Bottom of Basin Storage (Rectangular Tank)•• 1B: Bottom of Basin Storage (Pipe in ROW)1B: Bottom of Basin Storage (Pipe in ROW)
1C St /P i (St t T f B i )1C St /P i (St t T f B i )•• 1C: Storage/Pumping (Store at Top of Basin)1C: Storage/Pumping (Store at Top of Basin)•• 1D: Storage/Pumping (Store at Bottom of Basin)1D: Storage/Pumping (Store at Bottom of Basin)•• 2A: Convey and Treat (Beach FM alignment)2A: Convey and Treat (Beach FM alignment)•• 2B: Convey and Treat (Neighborhood FM alignment)2B: Convey and Treat (Neighborhood FM alignment)•• 3A: On3A: On--site Treatment (Bottom of Basin)site Treatment (Bottom of Basin)•• 3B: On3B: On--site Treatment (Up in Basin)site Treatment (Up in Basin)
41
( p )( p )•• 5A: Peak Flow Reduction (I/I Removal)5A: Peak Flow Reduction (I/I Removal)

1A: Bottom of Basin Storage 1A: Bottom of Basin Storage (Rectangular Tank)(Rectangular Tank)(Rectangular Tank) (Rectangular Tank)
Characteristics:Characteristics:•• Characteristics:Characteristics:•• 230K gallons 230K gallons
storagestoragestoragestorage•• Property Property
acquisition acquisition i di drequiredrequired
•• Shoreline zone Shoreline zone is Conservancyis Conservancyis Conservancy is Conservancy RecreationRecreation
42

1A: Bottom of Basin Storage 1A: Bottom of Basin Storage (Rectangular Tank)(Rectangular Tank) PlanPlan(Rectangular Tank) (Rectangular Tank) -- Plan Plan
43
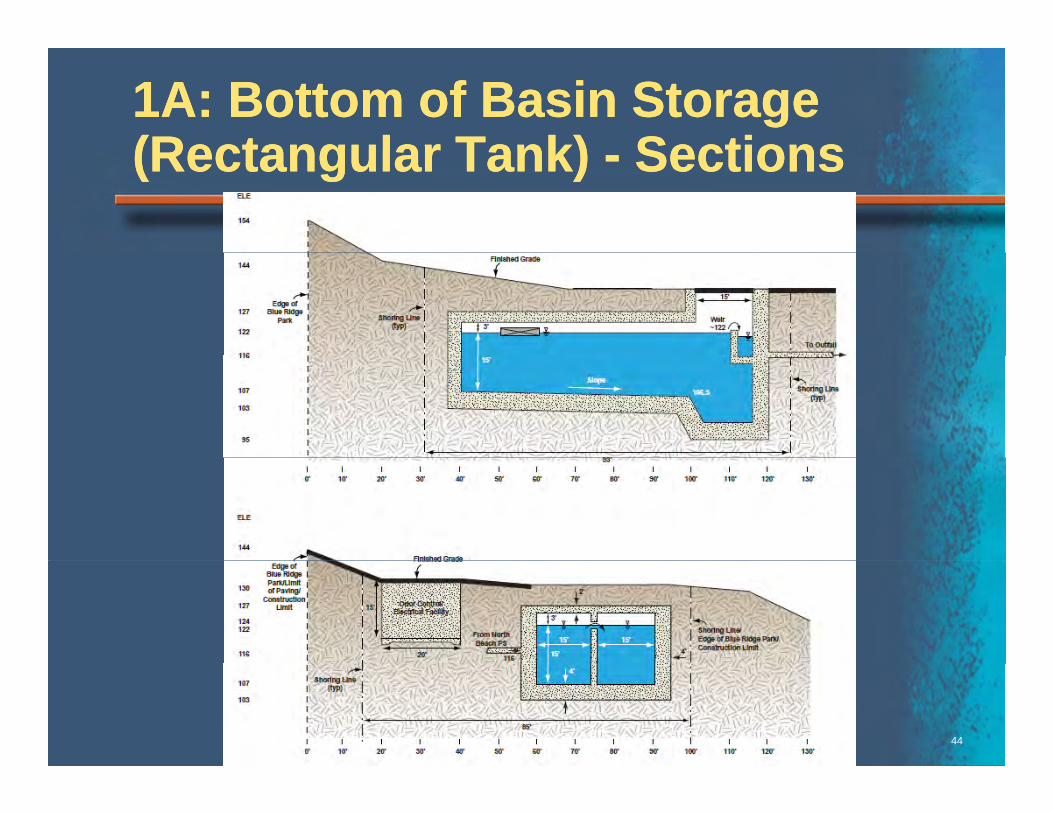
1A: Bottom of Basin Storage 1A: Bottom of Basin Storage (Rectangular Tank)(Rectangular Tank) SectionsSections(Rectangular Tank) (Rectangular Tank) -- Sections Sections
44

1B: Bottom of Basin Storage 1B: Bottom of Basin Storage (Pi li i Ri ht(Pi li i Ri ht ff W )W )(Pipeline in Right(Pipeline in Right--ofof--Way)Way)
Characteristics:Characteristics:•• Characteristics:Characteristics:•• 230K gallons 230K gallons
storagestoragestoragestorage•• Property Property
acquisition not acquisition not i di drequiredrequired
•• Street closures Street closures for constructionfor constructionfor construction for construction and O&M and O&M activitiesactivities
45

1B: Bottom of Basin Storage 1B: Bottom of Basin Storage (Pi li i Ri ht(Pi li i Ri ht ff W )W ) PlPl(Pipeline in Right(Pipeline in Right--ofof--Way) Way) -- PlanPlan
46

1B: Bottom of Basin Storage 1B: Bottom of Basin Storage (Pi li i Ri ht(Pi li i Ri ht ff W )W ) S tiS ti(Pipeline in Right(Pipeline in Right--ofof--Way) Way) -- SectionsSections
47

Storage/PumpingStorage/PumpingStorage/PumpingStorage/Pumping
•• Addresses Addresses CSO control CSO control requirementrequirementrequirement requirement
& & •• ReplacesReplacesReplaces Replaces
existing North existing North Beach Pump Beach Pump Station and Station and force mainforce main
48

1C: Storage/Pumping 1C: Storage/Pumping (St t T f B i )(St t T f B i )(Store at Top of Basin)(Store at Top of Basin)
Characteristics:Characteristics:•• Characteristics:Characteristics:•• 8.5 8.5 mgdmgd twotwo--stage pump stage pump
station/ 230K gallonsstation/ 230K gallonsstation/ 230K gallons station/ 230K gallons storage @ top of basin/ storage @ top of basin/ 8,000LF pipeline8,000LF pipelineR l E i ti N thR l E i ti N th•• Replaces Existing North Replaces Existing North Beach PS and FMBeach PS and FM
•• Property acquisitionProperty acquisitionProperty acquisition Property acquisition requiredrequired
•• Shoreline zone is Shoreline zone is CC
49
Conservancy RecreationConservancy Recreation

1D: Storage/Pumping 1D: Storage/Pumping (St t B tt f B i )(St t B tt f B i )(Store at Bottom of Basin)(Store at Bottom of Basin)
•• Characteristics:Characteristics:C a ac e s csC a ac e s cs•• 3.5 3.5 mgdmgd twotwo--stage pump station/ 150K gallons storage @ stage pump station/ 150K gallons storage @
bottom of basin/ 8,000LF pipelinebottom of basin/ 8,000LF pipeline•• Replaces existing North Beach PS and FMReplaces existing North Beach PS and FMReplaces existing North Beach PS and FMReplaces existing North Beach PS and FM•• PropertyProperty
acquisitionacquisitionrequiredrequiredqq
•• ShorelineShorelinezone iszone isConservancyConservancyR tiR tiRecreationRecreation
50

1D: Storage/Pumping 1D: Storage/Pumping (St t B tt f B i )(St t B tt f B i ) PlPl(Store at Bottom of Basin) (Store at Bottom of Basin) -- PlanPlan
51

1D: Storage/Pumping 1D: Storage/Pumping (St t B tt f B i )(St t B tt f B i ) S tiS ti(Store at Bottom of Basin) (Store at Bottom of Basin) -- SectionsSections
52

2A: Convey and Treat 2A: Convey and Treat (B h FM Ali t)(B h FM Ali t)(Beach FM Alignment)(Beach FM Alignment)
Characteristics:Characteristics:•• Characteristics:Characteristics:•• 8.5 8.5 mgdmgd pump pump
station/ 6,500 LFstation/ 6,500 LFstation/ 6,500 LF station/ 6,500 LF FM in beachFM in beach
•• Property Property i itii itiacquisition acquisition
requiredrequired•• Shoreline zone isShoreline zone isShoreline zone is Shoreline zone is
Conservancy Conservancy RecreationRecreation
CC53
•• 5.5 5.5 mgdmgd CarkeekCarkeekexpansionexpansion

2B: Convey and Treat 2B: Convey and Treat (N i hb h d FM Ali t)(N i hb h d FM Ali t)(Neighborhood FM Alignment)(Neighborhood FM Alignment)
Characteristics:Characteristics:•• Characteristics:Characteristics:•• 8.5 8.5 mgdmgd pump pump
station/ 8,000 LFstation/ 8,000 LFstation/ 8,000 LF station/ 8,000 LF FM through FM through neighborhoodneighborhoodP tP t•• Property Property acquisition requiredacquisition required
•• Shoreline zone isShoreline zone isShoreline zone is Shoreline zone is Conservancy Conservancy RecreationRecreation
CC54
•• 5.5 5.5 mgdmgd CarkeekCarkeekexpansionexpansion

3A: On3A: On--Site TreatmentSite Treatment(B tt f B i )(B tt f B i )(Bottom of Basin)(Bottom of Basin)
Characteristics:Characteristics:•• Characteristics:Characteristics:•• 5.5 5.5 mgdmgd
treatment facilitytreatment facilitytreatment facilitytreatment facility•• Property Property
acquisition acquisition i di drequiredrequired
•• Shoreline zone Shoreline zone is Conservancyis Conservancyis Conservancy is Conservancy RecreationRecreation
•• Single Family Single Family
55
Residential areaResidential area

3B: On3B: On--Site TreatmentSite Treatment(U i B i )(U i B i )(Up in Basin)(Up in Basin)
Characteristics:Characteristics:•• Characteristics:Characteristics:•• 5.5 5.5 mgdmgd pump station/ pump station/
2,500 LF FM and gravity2,500 LF FM and gravity2,500 LF FM and gravity 2,500 LF FM and gravity sewersewer
•• 5.5 5.5 mgdmgd treatment treatment f ilitf ilitfacilityfacility
•• Property acquisition Property acquisition requiredrequiredrequiredrequired
•• Shoreline zone is Shoreline zone is Conservancy RecreationConservancy Recreation
56
•• Single Family Residential Single Family Residential areaarea

How Were Alternatives Compared How Were Alternatives Compared t O A th ?t O A th ?to One Another?to One Another?
•• Land Use and PermittingLand Use and Permitting •• Operations & Maintenance (Operations & Maintenance (O&MO&M))•• Land Use and PermittingLand Use and Permitting–– City of Seattle Comprehensive PlanCity of Seattle Comprehensive Plan–– Seattle Municipal CodeSeattle Municipal Code–– Shoreline Master ProgramShoreline Master Program–– Permitting ComplexityPermitting Complexity
•• Operations & Maintenance (Operations & Maintenance (O&MO&M))–– StaffingStaffing–– TrainingTraining–– ReliabilityReliability–– MaintenanceMaintenance–– Permitting ComplexityPermitting Complexity
–– Property Acquisition ComplexityProperty Acquisition Complexity
•• EnvironmentEnvironment–– Cultural ResourcesCultural Resources
Fi h d WildlifFi h d Wildlif
–– MaintenanceMaintenance–– SafetySafety
•• Cost EffectivenessCost Effectiveness–– Relative Project CostRelative Project Cost
R l ti LifR l ti Lif C l C tC l C t–– Fish and WildlifeFish and Wildlife–– Wetlands, Streams, and ShorelineWetlands, Streams, and Shoreline–– Soils and SedimentsSoils and Sediments–– Water QualityWater Quality
T h i lT h i l
–– Relative LifeRelative Life--Cycle CostCycle Cost–– Relative Variability/RiskRelative Variability/Risk
CC•• TechnicalTechnical–– Technical ComplexityTechnical Complexity–– Compatibility with Existing WW SystemCompatibility with Existing WW System–– Flexibility/Adaptive ManagementFlexibility/Adaptive Management
C t t bilit /I l t tiC t t bilit /I l t ti
•• Community ImpactCommunity Impact–– LocationLocation–– Potential Community ImpactsPotential Community Impacts–– Construction ImpactsConstruction Impacts
57
–– Constructability/Implementation Constructability/Implementation ScheduleSchedule

Graphical Representation of Graphical Representation of EvaluationEvaluationEvaluationEvaluation
25
Land Use / Permitting Environment Technical O&M Cost Public
20
15
Impa
cts Alternatives
with highest impact / least
benefit
10
o. o
f Low
I benefit
5
N
58
0
"Best" 1A 1B 1C 1D 2A 2B 3A 3B 5A

Graphical Representation of Graphical Representation of EvaluationEvaluation
25
Land Use / Permitting Environment Technical O&M Cost Public
EvaluationEvaluation
20
Alternatives with lowest collective
i t
15
w Im
pact
s impact
10
No.
of L
ow
5
59
0
"Best" 1A 1B 1C 1D 2A 2B 3A 3B 5A

Graphical Representation of Graphical Representation of EvaluationEvaluation
25
Land Use / Permitting Environment Technical O&M Cost Public
EvaluationEvaluation
20
15
? ?w Im
pact
s
10
? ?
No.
of L
ow
5
60
0
"Best" 1A 1B 1C 1D 2A 2B 3A 3B 5A

Preliminary Alternatives Evaluation Preliminary Alternatives Evaluation R ltR ltResultsResults
B ildi /t t tB ildi /t t t•• Building more conveyance/treatment Building more conveyance/treatment capacity would have a high level of impactcapacity would have a high level of impact
•• Bottom of basin storage warrants further Bottom of basin storage warrants further considerationconsideration
•• Would 5A (I/I reduction) be effective for Would 5A (I/I reduction) be effective for CSOCSO control?control?
•• Should King County include potential future Should King County include potential future projects (Pump Station/projects (Pump Station/ForcemainForcemain) with ) with
61
this this CSOCSO control project?control project?

King County Works with Communities D i P j t D iDuring Project Design
• Public meetings and workshops• Presentations to community groups• Newsletters• Web updates
62

Community Input Shapes Facility Design
Ai t D R l t
Odor Control Stack
53rd St t P St ti
Air vent, Denny Regulator
Odor Control Stack Hidden Lake Underground Storage Pipe
53rd Street Pump Station
63
Pipe

King County Continues Outreach Th h t C t tiThroughout Construction
– Preconstruction community meetings with community meetings with the contractor
– Advance notice of work– Neighborhood and
community group briefingsg
64

We Work to Minimize Construction Impacts
– Approved Traffic Control Plan
– Maintain emergency and local access Provide advance public – Provide advance public and agency notice of traffic disruptions
65

We Will Keep You Up-to-date on ProgressWe Will Keep You Up to date on Progress
– WebWeb– Newsletters– Press releasesPress releases– Emails and
mailings– Community group
briefings
66

Problem Solving During ConstructionProblem Solving During Construction
– Address access issues f id t ifor residents, services, and deliveries
– Work with construction management team to dd d i
67
address odor, noise, dust, and other concerns Brightwater Project, Swamp Creek Connector,
Kenmore

We Respond to Your Concerns D i C t tiDuring Construction
Bellevue Force Main Installation Projectj
24-hour Construction Hotline:
Ki C t ’ j t t ill k ith th t t
206-296-4081
68
King County’s project team will work with the contractor to address concerns and complaints.

After Construction
• Complete restorationAdd ti d d i ti
Boeing Creek Park, Shoreline- Underground Flow Control Structure
69
• Address questions and concerns during operations• Notification of maintenance activities