normalization of deviance in mining engineering by …
TRANSCRIPT

NORMALIZATION OF DEVIANCE
IN MINING ENGINEERING
by
Trent Russell Mitchell
A thesis submitted to the faculty of The University of Utah
in partial fulfillment of the requirements for the degree of
Master of Science
Department of Mining Engineering
The University of Utah
August 2017

Copyright © Trent Russell Mitchell 2017
All Rights Reserved

T h e U n i v e r s i t y o f U t a h G r a d u a t e S c h o o l
STATEMENT OF THESIS APPROVAL
The thesis of Trent Russell Mitchell
has been approved by the following supervisory committee members:
Michael G. Nelson , Chair 3 / 31 / 2017 Date Approved
Brian R. Baucom , Member 3 / 31 / 2017 Date Approved
W. Pratt Rogers , Member 3 / 31 / 2017 Date Approved
and by Michael G. Nelson , Chair/Dean of
the Department/College/School of Mining Engineering
and by David B. Kieda, Dean of The Graduate School.

ABSTRACT
Normalization of deviance has been thoroughly studied and proven to have a
dramatic impact on the medical industry, particularly in the field of anesthesiology, and
for the National Aeronautics and Space Administration (NASA). Few such studies have
been conducted in the mining industry. This research was designed to show whether
normalization of deviance is occurring within the subculture of mining engineers.
This research project was based on a cross-sectional surveillance of a group of
mining engineers and consultants belonging to the Society for Mining, Metallurgy and
Exploration (SME).
There were three hypotheses for this research: 1) there is a correlation between
ethics, compensation, risk tolerance, and normalization of deviance; 2) there are either
positive or negative associations between each of the independent variables—ethics,
compensation, and risk tolerance—to the dependent variable—normalization of deviance;
3) the data would make it possible to predict normalization of deviance among mining
engineers. All three hypotheses were proven true in this study.
This research is important because it shows that normalization of deviance exists
among mining engineers.

4
I dedicate this research to all those who have lost their lives in mining incidents and their
surviving family members, for their courage. It is my hope that their great loss will help
the rest of us solidify our own resolve to increase mining safety.

TABLE OF CONTENTS
ABSTRACT ....................................................................................................................... iii
LIST OF TABLES ............................................................................................................ vii
LIST OF FIGURES ......................................................................................................... viii
ACKNOWLEDGEMENTS ............................................................................................... ix
Chapters
1 INTRODUCTION ...................................................................................................1
1.1 Background ........................................................................................................1 1.2 Objectives ..........................................................................................................2
2 LITERATURE REVIEW ........................................................................................3
2.1 Systematic Desensitization ................................................................................3 2.2 Behavior-Based Safety .......................................................................................4 2.3 Culture ................................................................................................................5 2.4 Mining Engineering and Design ........................................................................6 2.5 Compensation ....................................................................................................7 2.6 Ethics ..................................................................................................................8 2.7 Risk Tolerance and Acceptable Risk .................................................................8 2.8 Normalization of Deviance ..............................................................................10
3 HYPOTHESIS .......................................................................................................21
3.1 First Hypothesis ...............................................................................................21 3.2 Second Hypothesis ...........................................................................................21 3.3 Third Hypothesis ..............................................................................................22
4 RESEARCH DESIGN ...........................................................................................23
4.1 Sample Size ......................................................................................................23 4.2 Survey ..............................................................................................................25 4.3 Data Collection ................................................................................................26

vi
4.4 Target Group ....................................................................................................27 4.5 Analysis............................................................................................................27
5 RESULTS AND DISCUSSION ............................................................................31
5.1 Demographics ..................................................................................................31 5.2 Descriptive Statistics ........................................................................................33 5.3 Inferential Statistics .........................................................................................33
6 DISCUSSION AND CONCLUSIONS .................................................................57
6.1 Discussion ........................................................................................................57 6.2 Conclusions ......................................................................................................61 6.3 Limitations and Recommendations ..................................................................62
Appendices
A: SURVEY MAP .................................................................................................64
B: ONLINE SURVEY ...........................................................................................70
REFERENCES ..................................................................................................................79

LIST OF TABLES
Table Page
4.1 Power Analysis ......................................................................................................28
4.2 Modified Questions ................................................................................................29
4.3 Creating Risk Tolerance Questions .......................................................................30
5.1 T-test ......................................................................................................................39
5.2 Descriptive Statistics ..............................................................................................40
5.3 Achieved Power .....................................................................................................41
5.4 Cronbach’s Alpha Results ......................................................................................41
5.5 Correlation .............................................................................................................42
5.6 Linear Regression Ethics and Normalization of Deviance ....................................43
5.7 Linear Regression Compensation and Normalization of Deviance .......................43
5.8 Linear Regression Risk Tolerance and Normalization of Deviance ......................43
5.9 Hierarchical Regression Model Summary .............................................................44
5.10 Hierarchical Regression .........................................................................................44

LIST OF FIGURES Figure Page 2.1 Illustrative “DO IT” Process ..................................................................................19
2.2 Ranked Activities ...................................................................................................20
5.1 Gender Distribution in the Survey Population .......................................................45
5.2 PE Certification Distribution in the Survey Population .........................................46
5.3 Engineering Experience Distribution in the Survey Population ............................47
5.4 Operation Manager Experience Distribution in the Survey Population ................48
5.5 Type of Mining Distribution in the Survey Population .........................................49
5.6 Industry Sector Distribution in the Survey Population ..........................................50
5.7 Higher Education Distribution in the Survey Population ......................................51
5.8 Physical Work Location Distribution in the Survey Population ............................52
5.9 Interpreting Cronbach’s Alpha ..............................................................................53
5.10 Ethics vs. Normalization of Deviance ...................................................................54
5.11 Compensation vs. Normalization of Deviance ......................................................55
5.12 Risk Tolerance vs. Normalization of Deviance .....................................................56

ACKNOWLEDGEMENTS
I extend thanks to my committee for their guidance and dedication: Mike Nelson,
Brian Baucom, and Pratt Rogers. I am grateful for the tutelage of Tom Hethmon; without
him I would have never been interested in mining health and safety. I extend sincere
thanks to the SME Community for their participation in this research. I am also grateful
to Jessica Wempen for her guiding hand and Eric Riddle for his friendship and help.
I extend my deepest thanks to my family for their unfathomable love and support
during the entirety of my education, particularly while finishing this research.

CHAPTER 1
INTRODUCTION
1.1 Background
Mining is a high-risk profession. Those who work in this industry accept, and are
comfortable with, the high levels of risk. Like other high-risk professions, mining is not
exempt from having errors that can lead to fatalities, injuries, and lost production time.
These situations are called incidents, rather than accidents, by the health and safety
personnel, because all incidents are preventable (Darling 2011). Incidents are caused by
unintentional or intentional human error. When human errors involve cutting corners or
taking shortcuts to complete a given task, it is called normalization of deviance.
Normalization of deviance may have a negative effect on mine design and modifications
to mine design among other things. In 2016, at the Society for Mining, Metallurgy and
Exploration (SME) annual conference, Steve Gardner, president of SME, publically
recognized that normalization of deviance is occurring in the mining industry (Gardner
2016).
The integration of safety systems, leadership, and culture is essential to dealing
with the rising problem of normalization of deviance. This research focused on
normalization of deviance in the sub-culture of mining engineers within the mining
culture.

2
There are external and internal factors that may influence a mining engineer's
actions that could allow for the prediction of normalization of deviance. External factors
include regulations, performance standards, mineral assets, and other guidelines
determined by the company. The internal factors are those of morality or a moral code by
which the mining engineer lives.
There are two aspects of the moral code: one is personal while the other is
professional. The personal aspect includes the engineer’s ethics, risk tolerance,
experience, and situational awareness. Professional factors include education, work
ethics, certifications, working experience, and financial rewards for increased production
(compensation). This research will take ethics, compensation, and risk tolerance and test
each of these factors to see if they relate positively or negatively to normalization of
deviance.
1.2 Objectives
This research will attempt to correlate and determine associations between three
of these factors (ethics, compensation, and risk tolerance) and normalization of deviance.
There are three primary objectives. The first objective is to determine if there is a
correlation between ethics, compensation, risk tolerance, and normalization of deviance.
The second objective is to determine an association between each of the independent
variables—ethics, compensation, and risk tolerance—to the dependent variable—
normalization of deviance. The third objective is to determine if there are any unique
associations and variances among all the independent variables and the dependent
variable.

CHAPTER 2
LITERATURE REVIEW
2.1 Systematic Desensitization
Based on “an ever-growing body of experimental evidence … it is becoming
strikingly clear that systematic desensitization is a highly effective procedure for the
reduction of [irrational] fears and phobias” (Goldfried 1971). “[Systematic]
desensitization was developed by Joseph Wolpe in the early 1950s. He arrived at this
method, which may be described as a gradual deconditioning of anxiety responses”
(Rachman 1967). Systematic desensitization helps people in a controlled environment to
overcome their fears or phobias. This “same process seems to occur in the natural
environment, and it works against us with regard to safe work habits” (McSween 2003).
McSween continues with an example of a person who has a fear of heights, but whose
job requires working at heights. In the beginning, fall protection is always worn, but after
a time of working in this environment, the person may have a higher risk tolerance of
heights and thus be less likely to wear fall protection.
2.1.1 Risk Homeostasis
“Risk homeostasis theory [RHT] posits that people at any moment of time
compare the amount of risk they perceive with their target level of risk and will adjust

4
their behavior in an attempt to eliminate any discrepancies between the two” (Wilde
1998). Wilde explains that in 1967, Sweden switched the side of the road on which traffic
passed. After the switch, Sweden experienced a decline in incident rates, which continued
for about a year and a half. Thereafter incident rates returned to their previous levels,
illustrating the idea that without external input, systematic desensitization occurs. In this
case, people overcame their fear of driving on the “other side” of the road and with their
comfort came an increase of incidents.
Similarly, a mining company may expect to see the same trends when
implementing new safety plans or programs to make the mine a safer place. When new
rules or regulations are introduced, the mine will most likely see a decrease in incidents.
However, after time, the incident rate will begin to increase and return to what it was
before the implementation of the new rules. If behavior-based safety is not included in
the safety system, then after the establishment of the safety system, “the results will
basically be normal variation above and below the industry average: some years better
than average, some worse” (McSween 2003). In other words, risk homeostasis will
continue to occur in the mining industry.
2.2 Behavior-Based Safety
Behavior-based safety was created to combat the phenomenon known as
systematic desensitization (McSween 2003). “A number of recent books detail the
principles and procedures of behavior-based safety, and they provide solid evidence for
the success of this approach to injury prevention” (Geller 1996a, 1998a, 1998d; Krause
1995; Krause et al. 1996; McSween 1995; Sulzer-Azaroff 1998, as cited in Geller et al.

5
2001). The acronym “DO IT” introduces the steps of the behavior-based safety process,
which is illustrated in Figure 2.1.
The first step is to define the target behavior, which is an at-risk behavior that
should be avoided or a safe behavior that should be strengthened. The second step is to
observe. Through observations, coworkers or management can better understand the
antecedents and consequences of the target behavior. It is important to remember that the
observations are fact-finding and not fault-finding. The third step is intervention. An
effective intervention can be designed and implemented only if the proper observation
occurs. There are three different types of intervention strategies: instructional, supportive,
and motivational. The final step is to test. This stage is where the intervention is tried,
refined, or replaced. The “DO IT” process is the responsibility of the miners, supervisors,
and management.
2.3 Culture
Culture is a broad term that is used to describe the way a group of people thinks
and behaves. Therefore, a safety culture is the way a group of people think and behave
towards safety. Like many other high-risk industries, the U.S. mining industry has set
forth rules and procedures to ensure compliance with the laws and safety regulations that
have been established by the federal Mine Safety and Health Administration (MSHA).
Many mining companies have embraced such programs as “informal feedback on
complying with safety procedures, safety meetings and training, safety awards, safety
audits, written procedures, and special initiatives” (McSween 2003). But safety is still a
problem.

6
The issue is not whether the rules are practical or not, or whether the rules should be simply followed or not. A more serious issue is that possibly the large majority of employees (including deputies/supervisors) operate dangerous machinery every day in underground mines with a basic disposition that safety rules are ‘irrelevant, superfluous, non-essential or excessive.’ If this is the case, an important resource for limiting the risky behavior of employees is critically deficient. (Pitzer 2000, as cited in Laurence 2011)
The disposition that Pitzer mentions, which consists of the same attitudes that lead to
systematic desensitization and risk homeostasis, is the reason why mining companies are
incorporating behavior-based safety into their safety systems.
2.4 Mining Engineering and Design
The definition of engineering is “the practical study of how to make people and
things work better together” (Davis 1998). The SME Mining Engineering Handbook
provides instruction for a variety of tasks that a mining engineer may be required to
perform. The Handbook includes the following topics:
• Market Economics• Exploration• Deposit Assessment• Management and Administration• Mining Method Selection• Rock Breaking Methods• Ground Mechanics• Infrastructure and Services• Surface Extraction• Hydraulic and Pipeline Mining• Underground Development• Underground Extraction• Mineral Processing• Health and Safety• Environmental Issues• Community and Social Issues
(Darling 2011)

7
A mining engineer may work in one of the areas mentioned above, or may be responsible
for many of the given areas. In any case, it is the mining engineer’s responsibility to
maximize production “as safe as reasonably possible.” The word “reasonably” may be
interpreted in many ways. Therefore, these factors—ethics, compensation, risk tolerance,
and normalization of deviance—will strongly influence how mining companies, mines,
and mining engineers incorporate safety into the mine design, modifications of mine
design, and the operation of a mine.
2.5 Compensation
Leonard states that companies will often offer bonuses to reach certain goals.
“Firms implementing bonus systems have significantly higher performance . . . than firms
without bonus systems” (Leonard 1990, as cited in Bloom and Milkovich 1995).
However, it has been shown that pay incentives can change how employees view risk in
the workplace. Milkovich states that “firms relied on incentive pay to align employee
actions with critical organizational performance objectives” (Milkovich et al. 1991, as
cited in Bloom and Milkovich 1995). Mining companies often offer bonuses to their
employees for either reaching a certain production criterion or for achieving a certain
number of days without a lost-time incident. When safety rules and regulations are
ignored to reach the production quota or when incidents go unreported so that everyone
can receive their bonuses, this is how compensation can negatively affect the safety of the
mine.

8
2.6 Ethics
Professions that require trust—physicians, attorneys, law enforcement, and the
military—are governed by sworn oaths. The oaths for the professions listed are,
respectively, the Hippocratic Oath (North 2002), Attorney’s Oath (Preamble 2016), Law
Enforcement Oath (ICAP 2016), and Oath of Enlistment (U.S. Army Center of Military
History 2016); these oaths enumerate the responsibilities and ethical codes that those
entering these professions swear to uphold. Engineers are responsible for designs that
directly affect the lives of many people. However, engineers in general are not required to
take an oath or swear to uphold any ethical codes upon entering the workforce.
The licensing procedures for most professions, such as physicians (USMLE 2016;
COMLEX-USA 2016) and attorneys (Gillen 2016), include an ethical component. The
licensing procedure for professional engineers (PE) does not include an ethical
component (NCEES 2017; Civil Engineering Academy 2017).
2.7 Risk Tolerance and Acceptable Risk
The terms “risk tolerance” and “acceptable risk” can be used interchangeably;
however, there is a difference between the two. The definition of acceptable risk is a
“level of human and/or material injury or loss from an industrial process that is
considered to be tolerable by a society or authorities in view of the social, political, and
economic cost-benefit analysis” (businessdictionary.com 2015). The Health and Safety
Executive of the United Kingdom (HSE) has defined risk tolerance by stating, “To
tolerate a risk means that we do not regard it as negligible or something we might ignore,
but rather as something we need to keep under review and reduce still further if and when

9
we can” (Stone 1988, as cited in Melchers 2001). The main difference between the two
definitions is scope. For example, in mining, risk tolerance is understood on a large scale,
as the community’s, city’s, or state’s views of risk and how much will be tolerated. In
contrast, acceptable risk is considered on a more local scale, and may be understood
differently from one mine site to another.
2.7.1 Risk Perception
Paul Slovic and Ellen Peters explain that people will perceive risk in two
fundamental ways: risk as feelings and risk as analysis. “Risk as feelings refers to our
instinctive and intuitive reactions to danger. Risk as analysis brings logic, reason, and
scientific deliberation to bear on risk assessment and decision making” (Slovic and Peters
2006).
Humans will make decisions based on their “gut feelings” or “intuition.” These
sensations develop through positive experiences gained by using one’s emotions to make
decisions. However, feelings can also be swayed by beliefs, and social and cultural
influences. Paul Slovic, in 1987, ranked and listed many risks based on people’s
perceptions of those risks; see Figure 2.2.
Displayed at the bottom of Figure 2.2 is a list of 18 risk characteristics. These
characteristics determine how risks are plotted on the figure above. Each hazard is unique
in the effect it has on the population as a whole. It is determined by the combined
influence of risk (how well the risk is known or understood) and dread (how serious the
consequences of the risk are perceived to be). For example, if a person falls off a bicycle
and is injured, there will be no significant impact on how other people view risk as it

10
pertains to bicycles. However, a non-fatal incident with a nuclear reactor will change how
people perceive the risk of nuclear activities. This perception of nuclear activities occurs
when the hazard has a high dread factor and a low risk tolerance.
2.7.2 Financial Risk
Mining is considered a high-litigation-risk industry (Hogan and Jeter 1999). The
definition of litigation risk is “the possibility that legal action will be taken because of an
individual's or corporation's actions, inactions, products, services or other events”
(Investopedia 2016). To minimize negative legal action, the design of the mine is critical.
Not only is mining considered a high-litigation-risk activity, but it also presents
financial and unique risks. The financial risk of mining may include unexpected changes
in the price of the commodity of interest or cost of extraction. Mining risks are unique
because “mining is dynamic, diverse, highly scalable, proximity, three-dimensional, and
there is an imperfect understanding of major hazards” (Hethmon forthcoming).
Litigation, financial, and mining risks drastically and unpredictably threaten mines.
Therefore, it is the responsibility of the mining engineer to understand and mitigate the
different types of risk that occur throughout the life of the mine in response to changing
risks or perception of risks.
2.8 Normalization of Deviance
Jeffrey Pinto states that normalization of deviance is “the gradual process through
which unacceptable project management practices or standards have become acceptable.
As this behavior is repeated without catastrophic results, it has become the social or

11
operating norm of your project group or organization” (Pinto 2014). The difference
between systematic desensitization and normalization of deviance is scope. Systematic
desensitization occurs on a personal level, while when normalization of deviance occurs,
it affects the entire organization. The medical industry, National Aeronautics and Space
Administration (NASA), oil industry, and mining industry each demonstrate cases of
normalization of deviance, which will be described below.
2.8.1 Medicine
The last 15 years have seen an “increased emphasis on economic productivity,
driven in part by concern about the endlessly increasing health care costs” (Prielipp et al.
2010). Because of this increased concern, the prevailing philosophy has become “doing
more with less.” There are three examples in the field of anesthesiology where “doing
more with less” has led to normalization of deviance. In the first example, standard
anesthesia monitors are disconnected before the end of the general endotracheal
anesthesia. It is believed that by removing the monitors prematurely, the job is being
completed more quickly and efficiently. However, “Nothing in the American Society of
Anesthesiologist’s (ASA) or the American Association of Nurse Anesthetists’ guidelines
supports such practice” (Prielipp et al. 2010). The second example is the lack of
determining a neuromuscular response baseline before administering general anesthesia.
In the transition from the long-acting drugs to the intermediate-acting drugs, it was
thought that postoperative residual paralysis would no longer occur. Because of this, the
medical personnel deviated from basic neuromuscular monitoring in favor of completing
the process more quickly. The third example involves the performance of peripheral

12
nerve blocks (PNB). Throughout this procedure, the anesthesiologist will use a pulse
oximeter monitor. When using the pulse oximeter monitor, it is preferable to use four
complementary monitors: ultrasound, nerve stimulation, injection pressure, and
cardiorespiratory (Gadsden 2013; Gadsden, McCally, and Hadzic 2010). Because of
production and economic pressure, anesthesiologists and staff have taken shortcuts or
have deviated from proper procedures to save time and money (Prielipp et al. 2010).
2.8.2 NASA
While NASA was first formed in 1958, the space-shuttle era started in 1981 and
lasted until 2011. During those 30 years, NASA launched 135 missions and had two
disasters, Challenger and Columbia (NASA 2015). These two disasters demonstrate the
normalization of deviance in NASA’s upper management.
2.8.2.1 Challenger
On January 28, 1986, the space shuttle Challenger exploded 73 seconds after lift-
off. The cause of the explosion was failure of the O-rings in the solid rocket booster
(SRB). The classification of O-rings changed to “Criticality 1” in 1982, indicating that
failure of these components would cause the entire rocket to fail (Abramson 1986). When
the O-rings were reclassified, some in NASA were concerned that defective O-rings
could delay or halt future launches. It was thus decided that, until the issue was solved,
secondary seals would be installed as an added level of protection and trips to space
would continue uninterrupted. After the Challenger explosion, NASA stated that it was
aware that lower temperatures could cause the primary O-ring to fail; however, because

13
of multiple successful launches over the intervening years, NASA considered the failure
of the primary O-rings an acceptable risk.
2.8.2.2 Columbia
The physical cause of the loss of Columbia and its crew was a breach in the Thermal Protection System [TPS] on the leading edge of the left wing. The breach was initiated by a piece of insulating foam that separated from the left bipod ramp of the External Tank and struck the wing in the vicinity of the lower half of Reinforced Carbon-Carbon panel 8 at 81.9 seconds after launch. (NASA 2003)
At the time of the Columbia disaster, NASA classified incidents as “In-Family” or
“Out-of-Family.” “In-Family” classification received less attention than the “Out-of-
Family” classification. In the Challenger disaster, the classification of the TPS risk was
downgraded from “Out-of-Family” to “In-Family.” Even before shuttles began
launching, management knew about the fragility of the TPS tiles. It was normal to replace
and repair TPS materials, and, because there had been other launches in which foam
debris fell from the shuttle without incident, management downgraded the importance of
the risk.
2.8.3 Oil Industry
“In 2015, the United States consumed a total of 7.08 billion barrels of petroleum
products, an average of about 19.4 million barrels per day” (EIA 2016). The contribution
of the British company BP for the same year was 3.3 million barrels of oil per day (BP
2015), about 17% of the total oil consumed per day. In 2005, BP’s Texas refinery
exploded. Normalization of deviance may not have been the root cause; however, it did
play a role in the disaster, as will be shown below.

14
2.8.3.1 BP Texas City
Fifteen died and another 180 were injured in the BP Texas City Refinery disaster
that occurred on March 23, 2005. During the start-up of the tower in the refinery’s
isomerization unit, flammable liquid hydrocarbons were pumped into the tower for three
hours and no liquid was removed. The alarm system failed to activate, so personnel were
not alerted of the high level of liquid in the tower. The pressure relief valves did work,
emptying the flammable liquid into the blowdown drum and stack. However, the
blowdown system was old and lacked a flare to burn off the combustible vapor that
accumulated. This vapor cloud reached the ground and was ignited, probably by a diesel
pickup truck that was idling nearby (Merritt et al. 2005).
BP’s investigation report listed nine key organizational findings in relation to the
accident, as listed below:
1. Cost-cutting, failure to invest and production pressures from BP Groupexecutive managers impaired process safety performance at TexasCity.
2. The BP Board of Directors did not provide effective oversight of BP’ssafety culture and major accident prevention programs. The Board didnot have a member responsible for assessing and verifying theperformance of BP’s major accident hazard prevention programs.
3. Reliance on the low personal injury rate at Texas City as a safetyindicator failed to provide a true picture of process safety performanceand the health of the safety culture.
4. Deficiencies in BP’s mechanical integrity program resulted in the “runto failure” of process equipment at Texas City.
5. A “check the box” mentality was prevalent at Texas City, wherepersonnel completed paperwork and checked off on safety policy andprocedural requirements even when those requirements had not beenmet.
6. BP Texas City lacked a reporting and learning culture. Personnel werenot encouraged to report safety problems and some feared retaliationfor doing so. The lessons from incidents and near-misses, therefore,were generally not captured or acted upon. Important relevant safetylessons from a British government investigation of incidents at BP’sGrangemouth, Scotland, refinery were also not incorporated at Texas

15
City. 7. Safety campaigns, goals, and rewards focused on improving personal
safety metrics and worker behaviors rather than on process safety andmanagement safety systems. While compliance with many safetypolicies and procedures was deficient at all levels of the refinery,Texas City managers did not lead by example regarding safety.
8. Numerous surveys, studies, and audits identified deep-seated safetyproblems at Texas City, but the response of BP managers at all levelswas typically ‘too little, too late.’
9. BP Texas City did not effectively assess changes involving people,policies, or the organization that could impact process safety.
(Merritt et al. 2005)
Each of these nine organizational findings shows that at the time of the disaster,
management had deviated from the rules and regulations that were in place to achieve
higher production numbers and increased financial gains.
2.8.4 Mining Industry
Congress passed the first statute governing mine safety in 1891, prohibiting
children under age 12 from working in mining and setting forth basic requirements for
ventilation. It wasn’t until 1977 that Congress passed the Federal Mine Safety and Health
Act (Mine Act), in which the rights of miners were strengthened and enhanced. The Mine
Act also mandated that “all federal health and safety regulations of the mining industry
were consolidated under a single department Mine Safety and Health Administration”
(MSHA 2016).
The scope of this research was limited to the United States. Therefore, the
disasters described below are those that occurred most recently in the United States. In
both cases, management deviated from the rules and regulations that MSHA had set forth
for mining companies.

16
2.8.4.1 Crandall Canyon, Utah
In August 2007, “a catastrophic coal outburst accident occurred during pillar
recovery in the South Barrier . . . within seconds, overstressed pillars failed throughout
the South Barrier section” (Gates et al. 2007). This pillar failure caused the death of six
miners. During the rescue, there was another coal burst, which overwhelmed the ground
support system and killed another three people.
At the time of the incident, Genwall Resources, Inc. (GRI), a subsidiary of
Murray Energy Corp., operated the mine. Before the incident, GRI had hired a consulting
firm, Agapito Associates, Inc. (AAI), to conduct engineering analyses for the mine.
Enforcement actions were issued to both GRI and AAI for the disaster. “Murray Energy
Corp. agreed to pay $950,000 in civil penalties” (Gorrell 2013). GRI plead guilty to two
criminal misdemeanors and was fined $500,000. AAI settled, and agreed to pay $100,000
for a high-negligence violation (Gorrell 2013).
In the investigation of the disaster, AAI showed seven signs of normalization of
deviance. First, AAI had many years of experience working with this mine and was
familiar with the mining conditions. Despite, or perhaps because of, having this
information, AAI conducted engineering analyses that were flawed. Second, AAI did not
consider the barrier pillar stability in any of its analyses. Third, AAI recommended a
pillar design that had a lower calculated pillar stability factor than was recommended by
the National Institute for Occupational Safety and Health (NIOSH). Fourth, AAI did not
verify ground conditions that caused unreliable calibration of the model parameters.
Fifth, AAI did not use realistic mining conditions when modeling the pillars. Instead, it
assumed that the pillar cores would never fail regardless of load. Sixth, AAI management

17
did not review input or output files for accuracy and completeness. Seventh, AAI mine
designs did not account for ground stability or the ventilation system (Gates et al. 2007).
GRI and its management also showed four specific signs of normalization of
deviance: First, GRI regularly used bottom mining methods, even though AAI’s mine
designs did not address this type of mining. Second, GRI did not report to MSHA about
the three coal bursts that occurred a week before the disaster. If these had been reported,
MSHA would have been able to properly investigate the incidents and enforce corrective
actions (Crandall Canyon Investigation). Third, GRI didn’t revise their mining plan after
the three coal bursts. Fourth, GRI accepted the risks of ground movement and air blasts
that frequently destroyed ventilation controls. By following the rules and regulations
concerning design, bursts, and ventilation, GRI could have avoided this disaster.
2.8.4.2 Upper Big Branch, West Virginia
In April 2010, a massive coal dust explosion occurred at the Upper Big Branch
(UBB) mine, injuring two and killing 29 miners. At the time of the disaster, UBB was
operated by Performance Coal Company (PCC), a subsidiary of Massey Energy. The
following discussion shows that normalization of deviance was present in the
management of PCC/Massey.
The physical conditions that led to the explosion were the result of a series of basic safety violations at UBB and were entirely preventable. PCC/Massey disregarded the resulting hazards. While violations of particular safety standards led to the conditions that caused the explosion, the unlawful policies and practices implemented by PCC/Massey were the root cause of this tragedy. The evidence accumulated during the investigation demonstrates that PCC/Massey promoted and enforced a workplace culture that valued production over safety, including practices calculated to allow it to conduct mining operations in violation of the law. The investigation also revealed multiple examples of systematic,

18
intentional, and aggressive efforts by PCC/Massey to avoid compliance with safety and health standards, and to thwart detection of that non-compliance by federal and state regulators. (Page et al. 2010)
The investigation of this disaster found that PCC/Massey willfully and blatantly deviated
from the rules and regulations set forth by MSHA. The investigation found that
PCC/Massey’s only focus was production.

19
Figure 2.1 Illustrative “DO IT” Process
"D"Define
"O"Observe
"I"Intervene
"T"Test

20
Source: Adapted from http://www.scielo.br/img/revistas/sausoc/v19n4/02f02.jpg
Figure 2.2 Activities Ranked by Risk

CHAPTER 3
HYPOTHESIS
3.1 First Hypothesis
The engineer’s view of risks is critical to the design of a mine. The first
hypothesis tests the correlation between mining engineers’ personal perceptions—ethics,
compensation, and risk tolerance—with normalization of deviance.
H1: There is a correlation between ethics, compensation, risk tolerance, and
normalization of deviance.
3.2 Second Hypothesis
The second hypothesis asks if there is evidence supporting the first hypothesis,
are there any associations between the engineers’ personal perceptions and normalization
of deviance.
H2a: There is a negative association between ethical behavior and normalization
of deviance.
H2b: There is a positive association between compensation and normalization of
deviance.
H2c: There is a positive association between risk tolerance and normalization of
deviance.

22
3.3 Third Hypothesis
The third hypothesis asks if, when there is evidence supporting associations
between the engineer’s personal perceptions and normalization of deviance, are any of
those associations unique associations?
H3a: Ethics is significantly, uniquely associated with and accounts for additional
unique variance in normalization of deviance.
H3b: Compensation is significantly, uniquely associated with and accounts for
additional unique variance in normalization of deviance.
H3c: Risk tolerance is significantly, uniquely associated with and accounts for
additional unique variance in normalization of deviance.

CHAPTER 4
RESEARCH DESIGN
4.1 Sample Size
It is important in a survey that the sample size is large enough for the survey to
have significant statistical power. “Statistical power describes the probability that a test
will correctly identify a genuine effect” (Ellis 2010). The rule-of-thumb for calculating
sample size is N ³ 50 + 8(m) (Green 1991) where 50 is the lowest number of participants
allowed, and “m” is the number of variables in the study. This study examined three
different independent variables; therefore, the sample size needed was at least 74
participants.
However, Ellis (2010) states that to run a proper power analysis, four parameters
are essential:
The effect size, the sample size, the alpha significance criterion, and the power of the statistical test.
1. The effect size [f2] describes the degree to which the phenomenon ispresent in the population and therefore “the degree to which the null hypothesis is false” (Cohen 1988, as cited in Ellis 2010).
2. The sample size or number of observations (N) determines theamount of sampling error inherent in a result.
3. The alpha significance criterion (α) defines the risk of committing aType I error or the probability of incorrectly rejecting a null hypothesis. Normally alpha is set at α = .05 or lower and statistical tests are assumed to be nondirectional (two-tailed).
4. Statistical power refers to the chosen or implied Type II error rate (β)of the test. If an acceptable level of β is .20, then desired power

24
= .80 (or 1 – β). The four power parameters are related, meaning the value of any parameter can be determined from the other three. (Ellis 2010)
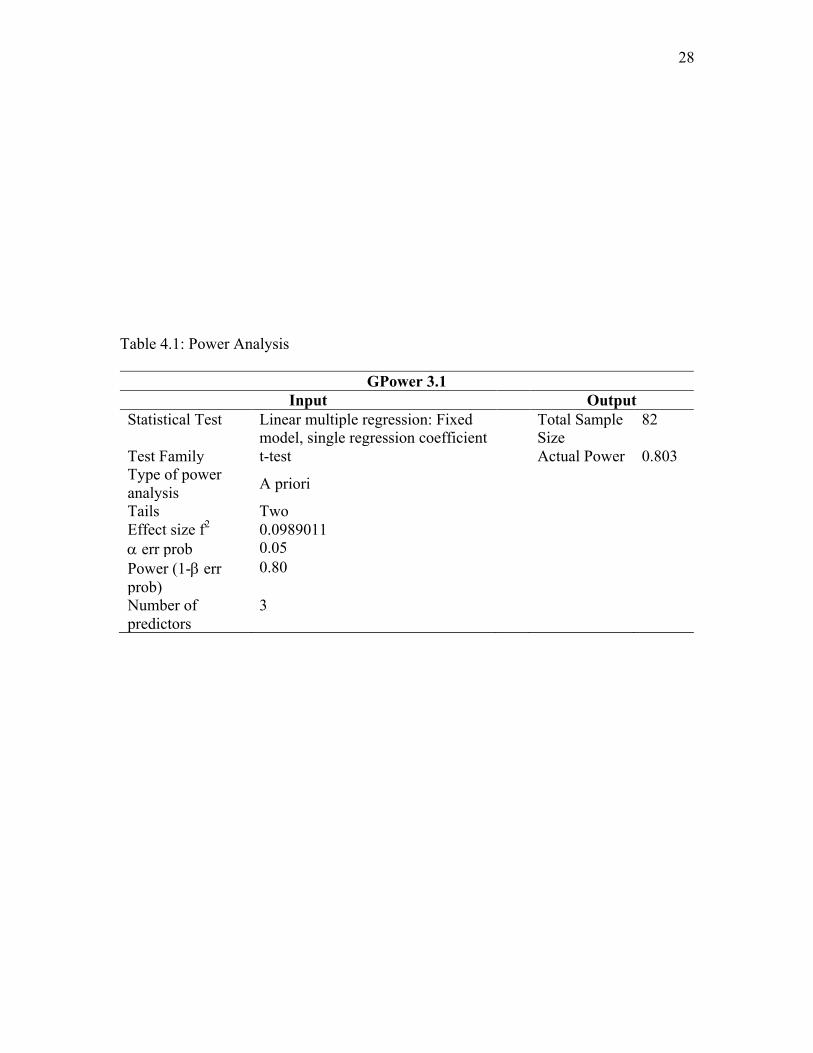
The program GPower 3.1 used the previously stated parameters with five
additional ones—Statistical Test, Test Family, Type of Power, Tails, and Number of
Predictors—to correctly calculate the sample size. See Table 4.1 for the input and output
of GPower 3.1.
There are many statistical tests available to researchers; however, linear multiple
regression was chosen because it “allows the researcher to simultaneously investigate the
role of multiple influences on an outcome variable” (Hayes 2013). When choosing this
regression method, the “Test Family” defaults to t-test. This analysis was completed
before the survey was distributed. Therefore, the option under “Type of Power Analysis”
requires “A Priori,” which means beforehand.
The “Tails” category of the t-test has two options, one-tail or two-tails. Two-tails
was chosen because “when using a two-tailed test, regardless of the direction of the
relationship you hypothesize, you are testing for the possibility of the relationship in both
directions” (UCLA 2016). In other words, “a two-tailed test will test both if the mean is
significantly greater than x and if the mean significantly less than x” (UCLA 2016).
The next three inputs—Effect Size, α err prob, Power (1- β err prob)—are
previously explained by Ellis. To calculate the “Effect Size,” the variance or R2 was
needed for each variable. The lowest R2 was be used in GPower 3.1 to ensure that sample
size will be large enough. The R2 values for each independent variable are as follows;
compensation R2=0.41 (Bloom and Milkovich 1995), ethics R2=0.134 (Singhapakdi
1999), and risk tolerance R2=0.86 (Tulloch et al. 2014). Ethics has the smallest R2;

25
therefore, 0.134 was be used to determine the f2 effect size. Ellis also states acceptable
values for “α err prob” and “Power (1- β err prob)” as 0.05 and 0.8, respectfully. The last
input, “Number of Predictors”, is the number of independent variables in the survey,
which in this case was three. GPower 3.1 calculated the minimum sample size to be 82
participants not the 74 participants that the rule-of-thumb suggested.
4.2 Survey
This research project was based on a cross-sectional surveillance of a group of
mining engineers and consultants. When a survey is used to assess a person’s perception
of risk, assurance of confidentiality is important because the respondent will be more
inclined to give truthful responses.
In designing a survey, it is important to consider how the questions will be
presented, how many questions will relate to each variable, and then to proceed with the
creation of the questions themselves. Because this survey was intended to measure
participants’ perceptions of ethics, compensation, risk tolerance, and normalization of
deviance, the Likert scale was used. The Likert scale that is usually used has five
categories that range from: strongly agree, agree, neither agree nor disagree, disagree, and
strongly disagree.
Research by Shoukri et al. (2004) into the requirements of a reliable study based
on sample size was used to calculate the number of questions needed for each variable.
As mentioned in Section 4.1, Sample Size, the minimum sample size for this study was
82 participants. With help from Professor Brian Baucom in interpreting the tables in
Shoukri et al. (2004), it was determined that each variable needed a minimum of five

26
questions.
A literature search determined that of the four variables being tested, only the
“ethics” variable had been previously assessed by survey. That survey is described by
Singhapakdi et al. (1996), and is the source for the ethics variable questions used in this
study. From the 40 questions in that study, six were chosen and then modified to fit the
mining industry; see Table 4.2.
Five drafts of the survey questions were considered, as shown in Table 4.3. The
first draft was written after reading and becoming familiar with the literature. The second
draft was written after receiving help from Professor Mike Nelson. The last three drafts
were created while receiving help from Professor Tom Hethmon. After each draft,
additional reading and studying occurred. It took almost a year from the time that the first
draft was created to the completion of the final draft. The completed questions can be
found in Appendix A.
4.3 Data Collection
The survey’s distribution and collection was handled by an online service called
“Survey Monkey.” Those who choose to participate were given four weeks to complete
the survey. Information concerning the removal of identifying markers was given at the
beginning of the survey. A copy of the survey as it appeared on Survey Monkey is
included in Appendix B.

27
members of SME. SME is a large organization whose membership exceeds 15,000. Even
though the sample size had the potential of being larger than required, and thus better
reflecting the population of interest, it was difficult to distribute the surveys and achieve a
strong response rate.
4.5 Analysis
The program SPSS was used to run both descriptive and inferential analysis. As
stated in Chapter 3, the dependent variable in this study was normalization of deviance.
The independent variables were compensation, ethics, and risk tolerance.
4.4 Target Group
The target group was the mining engineers and consultants in the U.S. who are
28
Table 4.1: Power Analysis
GPower 3.1 Input Output
Statistical Test Linear multiple regression: Fixed model, single regression coefficient
Total Sample Size
82
Test Family t-test Actual Power 0.803 Type of power analysis A priori
Tails Two Effect size f2 0.0989011 a err prob 0.05 Power (1-b err prob)
0.80
Number of predictors
3

29
Table 4.2: Modified Questions
Original Ethics Questions Modified Ethics Questions to Fit Mining 1. Being ethical and social responsible is the most important
thing a firm can do.1. Being ethical (compliance with rules, regulations,
etc.) is important to operating a successful mine.2. While output quality is essential to corporate success, ethics
and social responsibility is not.2. Productivity is essential to a mine’s success, but ethics
are not.3. A person should make certain that their actions never
intentionally harm another even to a small degree.3. Mining risks that negatively impact miners should not
be tolerated, regardless of magnitude of the impact.4. Risks to another should never be tolerated, irrespective of
how small the risks might be.4. What is ethical in one mining company may not be in
another.5. The dignity and welfare of people should be the most
important concern in any society.5. If pressured to make a change in a mine design that
would result in an unacceptable level of risk, I wouldrather resign than compromise my professional ethics.
6. What is ethical varies from one situation and society toanother.
6. Mining engineers should verify that their designs donot result in harm to others working in the mine.

30
Table 4.3: Creating Risk Tolerance Questions
First Attempt My company/mine has a level for acceptable risk. I have a set limit of acceptable risk. My company’s level of acceptable risk conflicts with my personal level of acceptable risk. I have ignored my level of acceptable risk to proceed with my company’s acceptable risk limit. I find that safety factors are the most important element of acceptable risk. My company believes that safety factors are the most important element of acceptable risk.
Second Attempt My company/mine has a level for acceptable risk. I have a set limit of acceptable risk. My company’s level of acceptable risk conflicts with my personal level of acceptable risk. I have ignored my level of acceptable risk to proceed with my company’s acceptable risk limit. I find that safety factors are the most important element of acceptable risk. My company believes that safety factors are the most important element of acceptable risk.
Third Attempt My company/mine has a defined level of acceptable risk. Personally, or professionally I have clear understanding of acceptable risk. My company’s level of acceptable risk conflicts with my personal level of acceptable risk. My company’s level of acceptable risk conflicts with my professional level of acceptable risk. I find that factors of safety (e.g. pit design) are the most important element of acceptable risk. My company believes that factors of safety (e.g. pit design) are the most important element of acceptable risk.
Fourth Attempt My corporation has a defined level of acceptable risk for mining engineering. My mine has a defined level of acceptable risk for mining engineering. Professionally, I have a clear understanding of acceptable risk in mining. My company’s level of acceptable risk conflicts with my personal level of acceptable risk. My company’s level of acceptable risk conflicts with my professional level of acceptable risk. Factor of safety is the most important parameter of acceptable risk for pit design.
Finished set of questions My mine has a defined level of acceptable risk for mining engineering. My company has a defined level of acceptable risk for mining engineering. Professionally, I have a clear understanding of acceptable risk in mining. My company’s level of acceptable risk conflicts with my personal level of acceptable risk. My company’s level of acceptable risk conflicts with my professional level of acceptable risk. Factor of safety is the most important parameter of acceptable risk for pit design, tunnel design, or roof control.

CHAPTER 5
RESULTS
5.1 Demographics
The responses to the demographic questions in this study were useful in two
ways. First, they were an easy way to group participants based on gender, experience, and
so on. Second, they were used to perform a t-test comparison that determined if the
participants responded differently depending on a certain demographic criterion.
An overview of the demographic questions and responses follows. Although the
following data can be seen in Table 5.1, individual demographics are best depicted in
Figures 5.1-5.8. The first question elicited the participant’s gender as shown in Figure
5.1, 78 males and 10 Females. The second inquired if the participant earned a
professional engineering certificate (PE). As shown in Figure 5.2, 38 participants had a
PE and 50 did not. Because there are many different fields in which a person can obtain a
PE, question three elicited in which field the PEs were obtained. However, this study was
to compare the differences in responses from those who had the PE certification and
those who did not. Therefore, the responses to question three was not used in this
analysis. The fourth question elicited how many years of experience the participant had
as an engineer. As shown in Figure 5.3, most of the participants had 20 or more years of
experience. The fifth question inquired if the participants were or had been operations

32
managers. As shown in Figure 5.4, 15 participants had not been operations managers,
while most of those who were operations managers had 10 years or less of experience,
and two-thirds of those had held the position for five years or less. The sixth question
drew a distinction between surface and underground mining. As shown in Figure 5.5,
surface mining had 36 responses, underground 26 responses, and 24 worked in both
surface and underground mines. The seventh and eighth questions elicited which type of
mineral was mined. Most of the engineers that responded mined metals, as shown in
Figure 5.6. Because of the variety of answers for question eight, no significant analytical
work could be conducted. Questions nine, ten, and eleven inquired about the education of
the participant. Question nine was not analyzed because all the participants had a
bachelor’s degree. Of the 88 participants, 38 had master’s degrees and 11 had doctorate
degrees, as seen in Figure 5.7. The last question asked about the participants’ physical
work locations, with options being corporate offices, division offices, or mine site, or if
they were consultants. Most of participants said they worked at mine sites or as
consultants, as seen in Figure 5.8.
The t-test was used to determine if one demographic responded differently than
another demographic for a given question. The t-test compared the mean of each variable
to each participant’s responses to the demographic questions. For example, the analysis
showed how each gender perceive ethics: For males the mean score for ethics was 4.26,
while for females it was 4.33, as seen in Table 5.1. Unfortunately, the difference between
these scores was not statistically significant, so correlations or associations cannot be
confidently stated. The data in Table 5.1, which relate the demographic variables to the
study’s independent variables, show little if any statistically significant variation in the

33
effects of demographics. It was thus concluded that none of the demographic variables
effected how the participants viewed each individual variable.
5.2 Descriptive Statistics
The descriptive statistics for variables are as follows: risk tolerance mean was
2.22, median was 2.20, and mode was 2.00. Risk tolerance had a standard deviation of
0.594. Compensation had a mean of 2.14, median of 2.00, and mode of 2.00.
Compensation had a standard deviation of 0.830. Ethics had a mean of 4.27, median of
4.33, and mode of 4.33. Ethics has a standard deviation of 0.463. Normalization of
deviance had a mean of 1.82, median of 1.78, and mode of 1.78. Compensation had a
standard deviation of 0.475 These statistics are summarized in Table 5.2.
5.3 Inferential Statistics
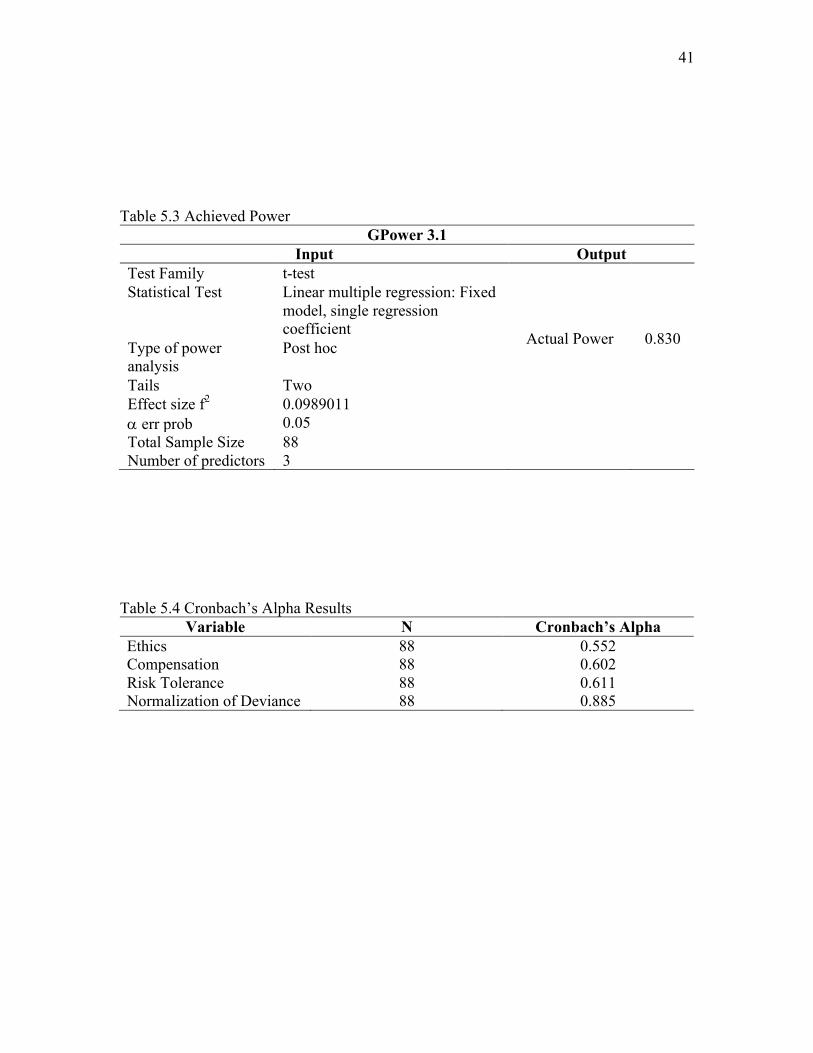
5.3.1 Post Power Analysis
As related in Chapter 4, it was found that this research required a sample size of at
least 82 participants. To calculate the actual power of the survey GPower 3.1 was again
used. That analysis is summarized in Table 5.3. The information from Table 4.1 stayed
the same, with the exception of “Type of Power Analysis.” Instead of using “A Priori,”
the option “Post Hoc,” which means afterwards, was chosen. By choosing “Post Hoc,”
the input “Power (1-b err prob)” changed to “Total Sample Size.” At the end of the
allotted time, 88 people had participated in the survey. Therefore, for this study, the
actual power was 0.83, as seen in Table 5.3.

34
5.3.2 Cronbach’s Alpha
Lee Cronbach developed the Alpha test, which assigns a number between zero
and one to characterize internal consistency or reliability of the test or scale (Tavakol and
Dennick 2011). The number that is assigned to the test or scale is called the reliability
coefficient. The closer the reliability coefficient is to one, the stronger the reliability of
the test, as shown in Figure 5.9. Comparison of Table 5.4 with Figure 5.9 shows that the
data for this study were mostly poor and questionable, with only one factor
(normalization of deviance) being consistent and reliable.
Increasing the number of questions in a group will increase the Alpha coefficient,
while decreasing that number will decrease it (Tavakol and Dennick 2011). This is why it
was important to know how many questions are needed for each variable, as discussed in
Section 4.2. Each of the independent variables—ethics, compensation, and risk
tolerance—had five or six questions. The dependent variable—normalization of
deviance—had 18 questions, three times the number of the questions for independent
variables. Therefore, a high reliability coefficient for normalization of deviance is
probably the result of the fact that it was measured with more questions than were the
other variables.
5.3.3 Correlation
The first hypothesis was to test the correlation between the independent variables
and the dependent variable.
Correlation is a statistical technique that can show whether and how strongly pairs of variables are related… Although this correlation is fairly obvious your data may contain unsuspected correlations. You may also suspect there are correlations, but don't know which are the strongest… A

35
key thing to remember when working with correlations is never to assume a correlation means that a change in one variable causes a change in another. (The Survey System 2017)
There are five levels at which variables can correlate with each other: perfect 1.0, high
1.0 > 0.75, moderate 0.75 ≥ 0.50, low 0.50 ≥ 0.25, and absence of correlation 0.25 > 0.0
(Statistics Solutions 2016). The data in Table 5.5 show that both “ethics” and
“compensation” have a moderate degree of correlation with “normalization of deviance,”
while “risk tolerance” has a low degree of correlation with “normalization of deviance.”
It is important to note that all correlations were significant, meaning that these
correlations did not occur by happenstance.
5.3.4 Linear Regression
The second hypothesis was to test if there were any significant associations
between the independent variables and dependent variable. Single linear regression was
used to test this hypothesis. The third hypothesis test was to determine any significant,
unique associations between the independent variables and dependent variable.
Hierarchical multiple regression was used to test this third hypothesis.
5.3.4.1 Single Linear Regression
Linear regression assesses the linear relationship between two variables, the
independent variables against the dependent variable separately.
A linear regression was run to understand the effect of participants’ valuation of
ethics on normalization of deviance. To visually assess the linearity, a scatterplot of
normalization of deviance against ethics with a regression line superimposed was

36
prepared. There was a negative linear relationship between the two variables: as ethics
increased, normalization decreased. As shown in Figure 5.10, valuation of ethics was
significantly related to normalization of deviance (B=-0.579, β=-0.564, p<0.001)†. For
every standard deviation unit increase in that valuation, it is expected from the regression
that normalization of deviance will decrease by 0.564 units. Valuation of ethics explained
31.8% of variance in normalization of deviance, as seen in Table 5.6.
A linear regression was also run to understand the effect of level of compensation
on normalization of deviance. To visually assess the linearity, a scatterplot of
normalization of deviance against compensation with a regression line superimposed was
prepared. There was a positive linear relationship between the two variables: as
compensation increased, normalization also increased. As shown in Figure 5.11,
compensation was significantly related to normalization of deviance (B=0.296, β=0.518,
p<0.001). For every standard deviation unit increase in level of compensation, it is
expected from the regression analysis that normalization of deviance will increase by
0.518 units. Level of compensation explained 26.9% of variance in normalization of
deviance; see Table 5.7.
Finally, a linear regression was run to understand the effect of risk tolerance on
normalization of deviance. To visually assess the linearity, a scatterplot of normalization
of deviance against risk tolerance with a regression line superimposed was prepared.
There was a positive linear relationship between the two variables: as risk tolerance
increased, normalization also increased. As shown in Figure 5.12, risk tolerance was
† The difference between “B” and “β”, is “B” denotes the same units of the study, whereas “β” denotes standard deviation units. The symbol “p” denotes the level of significance.

37
significantly related to normalization of deviance (B=0.366, β=0.458, p<0.001). For
every standard deviation unit increase in risk tolerance, it is expected that normalization
of deviance will increase by 0.458 units. Risk tolerance explained 21% of variance in
normalization of deviance; see Table 5.8.
5.3.4.2 Hierarchical Regression
Hierarchical and multiple regression are much alike, because both can explain
significant, unique associations and variations in the data. However, hierarchical multiple
regression “has a number of advantages, such as allowing you to: (a) control for the
effects of covariates on your results; and (b) take into account the possible causal effects
of independent variables when predicting a dependent variable” (Laerd 2017). The
following discussion explains the results that are shown in Tables 5.9 and 5.10.
In model one, normalization of deviance was regressed onto risk tolerance. Risk
tolerance was significantly related to normalization of deviance (B=0.366, β=0.458,
p<0.001). For every standard deviation unit increase in risk tolerance, the regression
indicated that normalization of deviance will increase by 0.458 units. Risk tolerance
explained 21% of the variance in normalization of deviance.
In model two, normalization of deviance was regressed onto both risk tolerance
and compensation. Risk tolerance (B=0.286, β=0.358, p<0.001) was significantly related
to normalization of deviance. For every standard deviation unit increase in risk tolerance,
the regression indicated that normalization of deviance will increase by 0.358.
Compensation was also significantly related to normalization of deviance (B=0.249,
β=0.436, p<0.001). For every standard deviation unit increase in compensation, the

38
regression indicated that normalization of deviance will increase by 0.436. In model two,
risk tolerance and compensation are both uniquely associated with normalization of
deviance and explain 37.6% of its variance. The addition of compensation in the
regression explained unique variance in normalization of deviance above and beyond the
level of risk tolerance, F-change (1, 85) = 25.11, R-Square Change = 18%, p<0.001.
In model three, normalization of deviance was regressed onto all three
independent variables—risk tolerance, compensation, and ethics. Risk tolerance was
related to normalization of deviance (B=0.226, β=0.283, p<0.001). For every standard
deviation unit increase in risk tolerance, the regression indicated that normalization of
deviance will increase by 0.283. Compensation was related to normalization of deviance.
(B=0.178, β=0.312, p<0.001). For every standard deviation unit increase in
compensation, the regression indicated that normalization of deviance will increase by
0.312. Ethics was also significantly related to normalization of deviance (B=-0.369, β=-
0.360, p<0.001). For every standard deviation unit increase in ethics, the regression
indicated that normalization of deviance will decrease by 0.360. All three independent
variables are uniquely associated with normalization of deviance and explain 49.9% of its
variance. However, the addition of ethics explained unique variance in normalization of
deviance above and beyond the level of risk tolerance and compensation, F-change‡ (1,
84) = 17.22, R-Square Change§ = 10.4%, p<0.001**.
‡ F-change statistic is a test of whether that amount of additional variance explained is significantly different from zero or not. § R-square change explains how much additional variance is accounted for by thevariables added in the model relative to a model that doesn't include it/them.** p<0.001 shows F-change to be significant.

39
Table 5.1 T-test
Questions
Response
N Ethics Mean
Comp. Mean
Risk Mean
N_D Mean
D1 Male 78 4.260 2.411 2.202 1.809 Female 10 4.333 2.150 2.360 1.905
D2 PE 38 4.311 2.236 2.268 1.824 No PE 50 4.236 2.070 2.184 1.816
D4.1 0-5 18 4.213 2.000 2.144 1.885 D4.2 6-10 11 4.015 2.772 2.636 2.080 D4.3 11-15 8 4.333 2.062 2.175 1.750 D4.4 16-20 4 4.125 1.875 2.550 1.722 D4.5 20+ 47 4.351 2.085 2.131 1.754
D5.1 0-5 33 4.171 2.121 2.393 1.862 D5.2 6-10 17 4.323 2.235 2.129 1.800 D5.3 11-15 6 4.694 1.416 1.800 1.472 D5.4 16-20 3 4.333 2.166 2.333 1.777 D5.5 20+ 14 4.238 2.035 2.128 1.750 D5.6 N/A 15 4.266 2.467 2.173 1.963
D6.1 Surface 36 4.231 2.097 2.138 1.756 D6.2 Underground 26 4.205 2.173 2.292 1.914 D6.3 Both 24 4.354 2.145 2.250 1.812
D7.1 Coal 23 4.217 2.239 2.339 1.869 D7.2 Metal 40 4.204 2.162 2.165 1.818 D7.3 Non-Metal 14 4.392 1.928 2.157 1.769 D7.4 Coal and Metal 1 4.000 3.500 3.800 2.944 D7.5 Metal and Non-Metal 1 4.333 2.000 1.600 1.611 D7.6 Coal and Non-Metal 4 4.541 1.750 2.550 1.625 D7.7 Coal and Metal and Non-Metal 5 4.500 2.200 1.840 1.722
D10 M.S. 38 4.193 2.210 2.342 1.915 No M.S. 50 4.326 2.138 2.128 1.747
D11 Ph.D. 11 4.333 2.181 2.527 1.853 No Ph.D. 77 4.259 2.136 2.176 1.815
D12.1 Corporate 9 4.481 1.889 2.111 1.697 D12.2 Division 7 4.619 1.500 1.971 1.452 D12.3 Mine 34 4.137 2.235 2.329 1.937 D12.4 Consultant/Contractor 38 4.271 2.236 2.194 1.811

40
Table 5.2 Descriptive Statistics Variable Mean Median Mode Std. Deviation N
Ethics 4.27 4.33 4.33 0.463 88 Compensation 2.14 2.00 2.00 0.830 88 Risk Tolerance 2.22 2.20 2.00 0.594 88 Normalization of Deviance 1.82 1.78 1.78 0.475 88
41
Table 5.3 Achieved Power
GPower 3.1 Input Output
Test Family t-test
Actual Power 0.830
Statistical Test Linear multiple regression: Fixed model, single regression coefficient
Type of power analysis
Post hoc
Tails Two Effect size f2 0.0989011 a err prob 0.05 Total Sample Size 88 Number of predictors 3
Table 5.4 Cronbach’s Alpha Results
Variable N Cronbach’s Alpha Ethics 88 0.552 Compensation 88 0.602 Risk Tolerance 88 0.611 Normalization of Deviance 88 0.885

42
Table 5.5 Correlation
**Correlation is significant at p<0.01 *Correlation is significant at p<0.05
Ethics C2/C3 Risk Tolerance
Normalization of Deviance
Ethics Pearson Correlation 1 0.395** 0.289** 0.564** Sig. (2-tailed) 0.000 0.006 0.000
Compensation Question 2 and 3 (C2/C3)
Pearson Correlation 0.395** 1 0.229* 0.518** Sig. (2-tailed) 0.000 0.032 0.000
Risk Tolerance Pearson Correlation 0.289** 0.229* 1 0.458** Sig. (2-tailed) 0.006 0.032 0.000
Normalization of Deviance
Pearson Correlation 0.564** 0.518** 0.458** 1 Sig. (2-tailed) 0.000 0.000 0.000

43
Table 5.6 Linear Regression Ethics and Normalization of Deviance Coefficientsa
Model R R2
Unstandardized Coefficients
Standardized Coefficients
t Sig. B Std. Error Beta Ethics 0.564 0.318 -0.579 0.091 -0.564 -6.338 0.000a. Dependent Variable: Normalization of Deviance
Table 5.7 Linear Regression Compensation and Normalization of Deviance Coefficientsa
Model R R2
Unstandardized Coefficients
Standardized Coefficients
t Sig. B Std. Error Beta Compensation 0.518 0.269 0.296 0.053 0.518 5.620 0.000 a. Dependent Variable: Normalization of Deviance
Table 5.8 Linear Regression Risk Tolerance and Normalization of Deviance Coefficientsa
Model R R2
Unstandardized Coefficients
Standardized Coefficients
t Sig. B Std. Error Beta Risk Tolerance 0.458 0.210 0.366 0.077 0.458 4.779 0.000 a. Dependent Variable: Normalization of Deviance

44
Table 5.9 Hierarchical Regression Model Summary
Model R R2 Adjusted R2 Std. Error Change Statistics
∆ R2 F Change df1 df2 ∆ Sig F 1 2 3
0.458a
0.625b
0.703c
0.210 0.390 0.494
0.201 0.376 0.476
0.424 0.375 0.349
0.210 0.180 0.104
22.839 25.115 17.218
1 1 1
86 85 84
0.000 0.000 0.000
a. Predictor: Risk Tolerance b. Predictor: Risk Tolerance, Compensation c. Predictor: Risk Tolerance, Compensation, Ethics
Table 5.10 Hierarchical Regression
Coefficientsa
Model
Unstandardized Coefficients
Standardized Coefficients
t Sig.
Correlations
B Std. Error Beta Zero-order Partial Part 1 Risk Tolerance 0.366 0.077 0.458 4.779 0.000 0.458 0.458 0.458
2 Risk Tolerance 0.286 0.070 0.358 4.114 0.000 0.458 0.408 0.349 Compensation 0.249 0.050 0.436 5.012 0.000 0.518 0.478 0.425
3 Risk Tolerance 0.226 0.065 0.283 3.456 0.001 0.458 0.353 0.268 Compensation 0.178 0.049 0.312 3.655 0.000 0.518 0.370 0.284 Ethics -0.369 0.089 -0.360 -4.149 0.000 -0.564 -0.412 -0.322
a. Dependent Variable: Normalization of Deviance

45
Figure 5.1 Gender Distribution in the Survey Population

46
Figure 5.2 PE Certification Distribution in the Survey Population
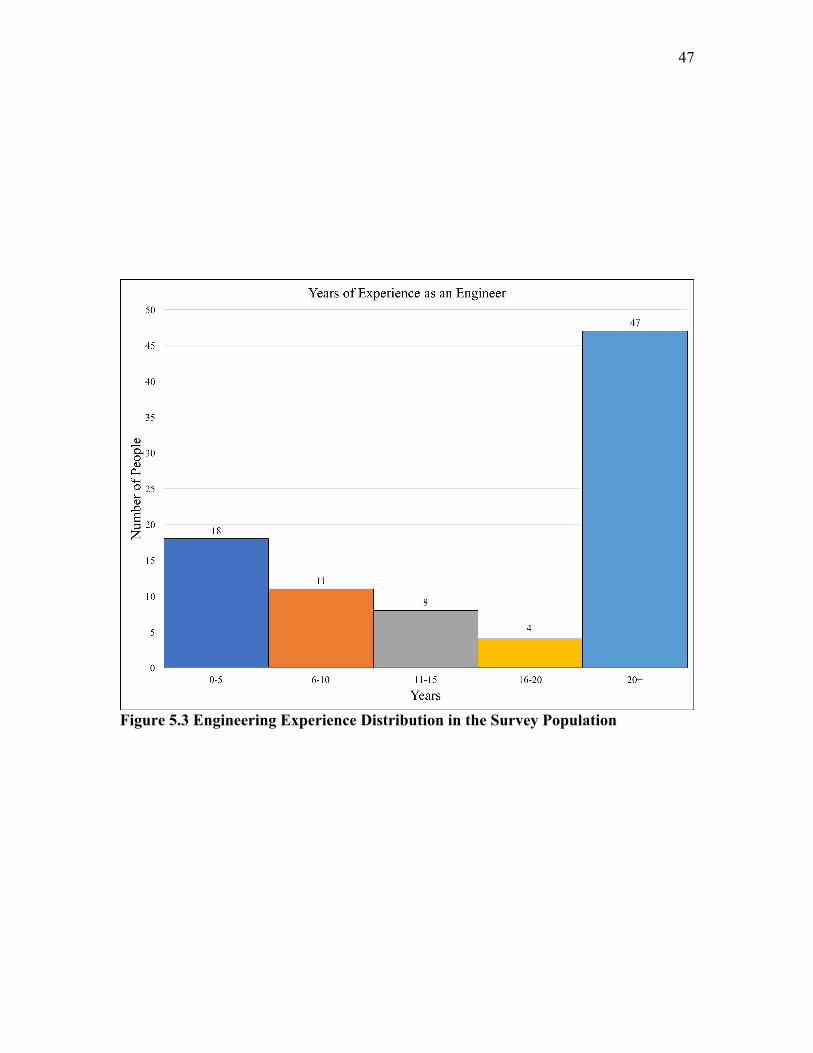
47
Figure 5.3 Engineering Experience Distribution in the Survey Population

48
Figure 5.4 Operation Manager Experience Distribution in the Survey Population

49
Figure 5.5 Type of Mining Distribution in the Survey Population

50
Figure 5.6 Industry Sector Distribution in the Survey Population

51
Figure 5.7 Higher Education Distribution in the Survey Population

52
Figure 5.8 Physical Work Location Distribution in the Survey Population

53
Source: Adapted from www.statisticshowto.com/cronbachs-alpha-spss/ Figure 5.9 Interpreting Cronbach’s Alpha

54
Figure 5.10 Ethics vs. Normalization of Deviance

55
Figure 5.11 Compensation vs. Normalization of Deviance

56
Figure 5.12 Risk Tolerance vs. Normalization of Deviance

CHAPTER 6
DISCUSSION AND CONCLUSIONS
6.1 Discussion
A major goal of this research was obtaining responses from enough participants to
accurately characterize the mining engineering subculture. Section 4.1, Sample Size,
stated that this survey required 82 participants to have significant statistical strength of
0.8. After the appointed time, 88 people had participated in the survey, giving a statistical
strength score of 0.83.
To fully understand the results of the t-test and descriptive statistics, a knowledge
of how the variables were coded was needed. The Likert scale consisted of five
categories and with each response was given a value from one through five, one being the
lowest, and five the highest. The anticipated result for ethics was five, meaning that the
participant had high ethical views. The anticipated result for compensation was one,
meaning that compensation did not affect the decision of the engineer. The anticipated
result for risk tolerance was one, meaning that the participant had low tolerance for risk.
For normalization of deviance, the anticipated result was one, meaning that normalization
of deviance was not occurring.
Figures 5.1 through 5.8 depict how the participants responded to the demographic
questions. The majority of the participants were males working at a mine site or as

58
consultants with 20 plus years of engineering experience. The t-test was used to identify
any differences in how participants viewed the different variables depending on their
demographics, as shown in Table 5.1. The analysis found that no statistically significant
correlation existed between ethics, risk tolerance, or compensation and normalization of
deviance.
Descriptive statistics help present data more efficiently, which simplifies
interpretation. The mean, median, and mode all measure the central tendencies of the
data. However, depending on the data, one may be more useful than the others. The mean
is the average score of all the responses. If there are outliers, then the mean score
becomes an invalid way to depict the central tendency. Listing scores from lowest to
highest, the median is the middle score. This method is good when there is a large spread
of data. The mode is the most widely used descriptive statistic (Laerd 2017). The
standard deviation is also reported to show the spread of the scores. In Table 5.2 it shows
that the mean scores are slightly skewed from the medians and modes. It was expected
that the skew for ethics would have increased the mean score closer to five. Instead, the
outliers decreased the score, meaning that for some participants, the importance of ethics
was exceptionally low. It was expected that for the variables compensation, risk
tolerance, and normalization of deviance, the mean scores would have been skewed
closer to one. Instead, for each of those variables, the score was increased closer to five.
This could indicate that the outliers are really the true responses to the survey; however,
further research is required to understand this effect.
Cronbach’s alpha was used to verify the reliability of the questions. For these
data, the alpha scores for ethics (0.552), compensation (0.602), risk tolerance (0.611), and

59
normalization of deviance (0.885) are all within a range that indicates the questions are
reliable. This meant that the data could be processed further using linear regression.
Once it was established that the variables were reliable, the first hypothesis could
be tested. That hypothesis reads;
H1: There is a correlation between ethics, compensation, acceptable risk, and
normalization of deviance.
There were significant correlations between each independent variable and the dependent
variable. Additionally, there were significant correlations between the respective
independent variables, as seen in Table 5.5. Significant correlations tell the researcher
that the correlations are not occurring by accident. The first hypothesis is accepted as
true, because there were significant correlations between the independent variables and
dependent variable.
After significant correlations were determined, individual linear regressions could
be performed to determine the relation of the independent variables to the dependent
variable. The second hypothesis was separated into three sub-hypotheses, thus:
H2a: There is a negative association between ethical behavior and normalization
of deviance.
H2b: There is a positive association between compensation and normalization of
deviance.
H2c: There is a positive association between risk tolerance and normalization of
deviance.
Hypothesis 2a was found to be true. There was a significant negative association
between ethics and normalization of deviance (B=-0.579, β=-0.564, p<0.001), as shown

60
in Figure 5.10. Hypothesis 2b was also found to be true. There was a significant positive
association between compensation and normalization of deviance (B=0.296, β=0.518,
p<0.001), as shown in Figure 5.11. Lastly, hypothesis 2c was found to be true. There was
a significant positive association between risk tolerance and normalization of deviance
(B=0.366, β=0.458, p<0.001), as shown in Figure 5.12.
Each of the independent variables individually had a significant association with
the dependent variable. The third hypothesis evaluated by testing the independent
variables together against the dependent variable. The third hypothesis was separated into
three sub-hypotheses, to determine if one or more independent variables were
significantly, uniquely associated with the dependent variable.
H3a: Ethics is significantly, uniquely associated with and accounts for additional
unique variance in normalization of deviance.
H3b: Compensation is significantly, uniquely associated with and accounts for
additional unique variance in normalization of deviance.
H3c: Risk tolerance is significantly, uniquely associated with and accounts for
additional unique variance in normalization of deviance.
Hypothesis 3a was found to be true. Ethics had a negative significant, unique
association with normalization of deviance (B=-0.369, β=-0.360, p<0.001) and accounted
for additional unique variance, R-Square Change = 10.4%. As personal ethics increased,
the likelihood for normalization of deviance decreased. Hypothesis 3b was found to be
true. Compensation had a positive significant, unique association with normalization of
deviance (B=0.178, β=0.312, p<0.001) and accounted for additional unique variance, R-
Square Change = 8.1%. As compensation was given contingency on a showing of no

61
safety issues increased, it was more likely for normalization of deviance to also increase.
Hypothesis 3c was found to be true. Risk Tolerance was significantly and uniquely
associated to normalization of deviance (B=0.226, β=0.283, p<0.001) and accounted for
additional unique variance, R-Square Change = 7.1%. The more the participant was
willing to tolerate risk, the more likely normalization of deviance would increase.
6.2 Conclusions
The effects of ethics, compensation, and risk tolerance on normalization of
deviance may have seemed obvious. However, those effects have never been addressed
or tested in the mining industry. Steve Gardner, president of SME, stated in 2016 that the
SME organization recognized that normalization of deviance is occurring in the mining
industry (Gardner 2016). While this research has not shown that normalization of
deviance is occurring within the mining industry, it has confirmed the existence of
normalization of deviance within the subculture of mining engineers. That is why this
research is important: it has exposed normalization of deviance to be a real issue in the
mining industry.
The independent variables studied here, ethics, compensation, and risk tolerance,
do correlate with normalization of deviance. The data reveal that as normalization of
deviance occurs, there are changes in these independent variables and that these changes
are not random occurrences. Just because there is a correlation does not signify that there
is also an association between the independent variables and dependent variable. The
linear regression method was used to test the relationship of each independent variable
separately with the dependent variable to determine if an association existed. The data

62
showed that as ethical behavior decreased, normalization of deviance increased and that
as compensation and risk tolerance increased, normalization of deviance increased. The
last step was to test all variables that had significant associations together against the
dependent variable. By testing all the variables together, it was found that all three of the
independent variables were significantly and uniquely associated with the dependent
variable. Because ethics, compensation, and risk tolerance are each uniquely associated
with normalization of deviance, it is possible to predict normalization of deviance among
mining engineers.
6.3 Limitations and Recommendations
A few limitations were encountered while proceeding with this research. First was
the first public survey measuring the different factors of ethics, compensation, and risk
tolerance and how those factors interacted with normalization of deviance in the mining
industry. Second, after corresponding with Diane Vaughan, who discovered
normalization of deviance, it was discovered that this survey was the first to measure
normalization of deviance (D. Vaughan, personal communication). Previously,
measuring normalization of deviance was evaluated by interpreting interviews. These
first two limitations are important in that there was no previous research or templates to
follow for this study. Third, the expected response rate, 10%, was not as high as
expected. Two separate links to the survey were posted to the SME community website
and the SME LinkedIn. For the SME community, the response rate was 2.9%. For SME
on LinkedIn, a response rate could not be calculated because no one responded to the
request. After posting the links on the websites, it was impossible to ensure that everyone

63
who visited the site saw the post asking for mining engineers to take the survey. Finally, a
basic knowledge and importance of a test group for creating a survey was known, but the
reality of this important step was not fully understood in the beginning. The test group for
this survey consisted of faculty and graduate students in the mining engineering
department at the University of Utah. The test group should have included all the
undergraduates as well, which would have increased and diversified the test group. If the
test group had been larger the issue of dichotomous questions within the variable,
“compensation” would have been recognized and changed to accommodate a continuous
scale.
Further research is needed to understand normalization of deviance. Research
could focus on causation of normalization of deviance in the mining industry. It could
also focus on which training methods or interventions can most effectively counter
normalization of deviance in the mining industry.

APPENDIX A
SURVEY MAP
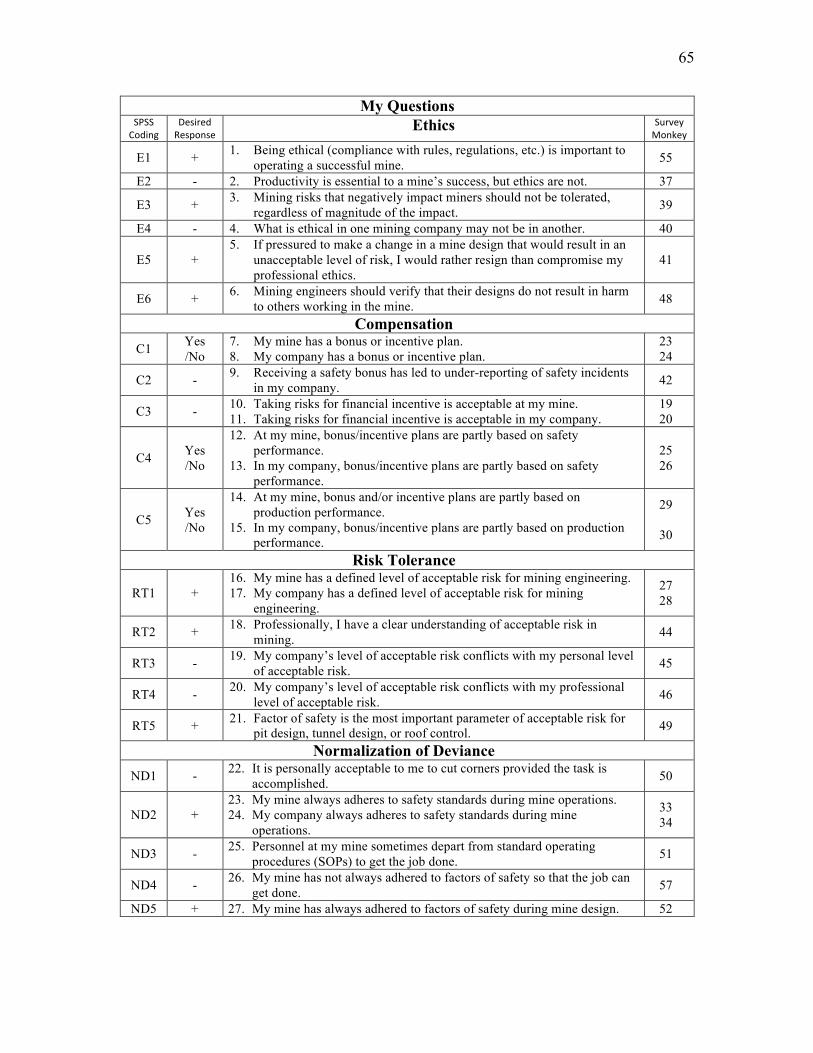
65
My QuestionsSPSSCoding
DesiredResponse Ethics Survey
MonkeyE1 + 1. Being ethical (compliance with rules, regulations, etc.) is important to
operating a successful mine. 55
E2 - 2. Productivity is essential to a mine’s success, but ethics are not. 37
E3 + 3. Mining risks that negatively impact miners should not be tolerated, regardless of magnitude of the impact. 39
E4 - 4. What is ethical in one mining company may not be in another. 40
E5 + 5. If pressured to make a change in a mine design that would result in an
unacceptable level of risk, I would rather resign than compromise my professional ethics.
41
E6 + 6. Mining engineers should verify that their designs do not result in harm to others working in the mine. 48
Compensation
C1 Yes /No
7. My mine has a bonus or incentive plan. 8. My company has a bonus or incentive plan.
23 24
C2 - 9. Receiving a safety bonus has led to under-reporting of safety incidents in my company. 42
C3 - 10. Taking risks for financial incentive is acceptable at my mine. 11. Taking risks for financial incentive is acceptable in my company.
19 20
C4 Yes /No
12. At my mine, bonus/incentive plans are partly based on safety performance.
13. In my company, bonus/incentive plans are partly based on safety performance.
25 26
C5 Yes /No
14. At my mine, bonus and/or incentive plans are partly based on production performance.
15. In my company, bonus/incentive plans are partly based on production performance.
29
30
Risk Tolerance
RT1 + 16. My mine has a defined level of acceptable risk for mining engineering. 17. My company has a defined level of acceptable risk for mining
engineering.
27 28
RT2 + 18. Professionally, I have a clear understanding of acceptable risk in mining. 44
RT3 - 19. My company’s level of acceptable risk conflicts with my personal level of acceptable risk. 45
RT4 - 20. My company’s level of acceptable risk conflicts with my professional level of acceptable risk. 46
RT5 + 21. Factor of safety is the most important parameter of acceptable risk for pit design, tunnel design, or roof control. 49
Normalization of Deviance
ND1 - 22. It is personally acceptable to me to cut corners provided the task is accomplished. 50
ND2 + 23. My mine always adheres to safety standards during mine operations. 24. My company always adheres to safety standards during mine
operations.
33 34
ND3 - 25. Personnel at my mine sometimes depart from standard operating procedures (SOPs) to get the job done. 51
ND4 - 26. My mine has not always adhered to factors of safety so that the job can get done. 57
ND5 + 27. My mine has always adhered to factors of safety during mine design. 52

66
ND6 -
28. My mine has not always complied with regulations so that I can get the job done.
29. My company has not always complied with regulations so that they can get the job done.
31 32
ND7 - 30. I have not always fully completed the designated SOPs so that I can finish a task more efficiently. 53
ND8 -
31. At my mine it is acceptable to lower safety standards to optimize production.
32. At my company it is acceptable to lower safety standards to optimize production.
17 18
ND9 - 33. I have not always complied with regulations so that I can get the job done. 54
ND10 - 34. If there are no negative consequences when I fail to comply with MSHA regulations, my actions are justified. 43
ND11 - 35. If there are no negative consequences for not adhering to good engineering design, my actions are justified. 47
ND12 - 36. If there are no negative consequences for not following SOPs, my actions are justified. 56
ND13 - 37. If there are no related negative consequences, I do not feel a need to comply with regulations. 58
ND14 - 38. If there are no negative consequences, I do not have to follow the designated SOPs. 59
ND15 - 39. If there are no related negative consequences, I do not feel obligated to adhere to good engineering design. 38
ND16 + 40. My mine always complies with MSHA regulations. 41. My company always complies with MSHA regulations.
15 16
ND17 +
42. My mine always applies high safety standards when modifying mine designs for economic or market reasons.
43. My company always applies high safety standards when modifying mine designs for economic or market reasons.
21
22
ND18 +
44. My mine always adheres to good engineering practice when modifying mine designs for economic or market reasons.
45. My company always adheres to good engineering practice when modifying mine designs for economic or market reasons.
35
36
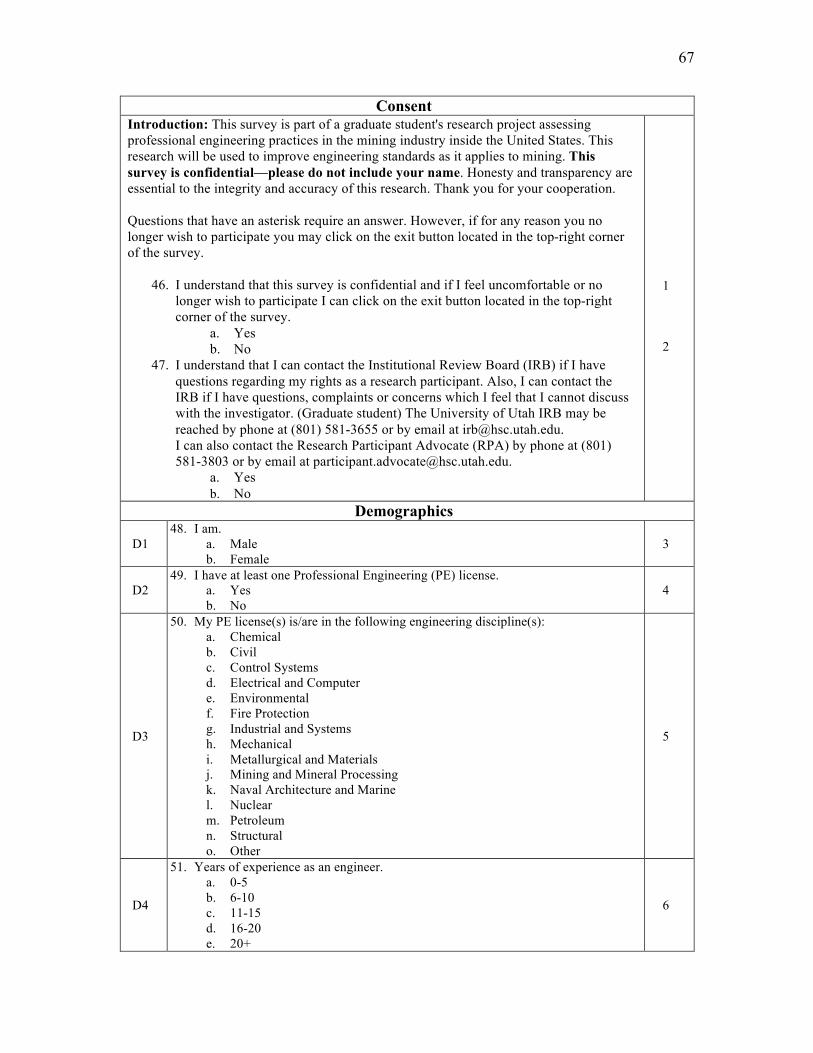
67
Consent Introduction: This survey is part of a graduate student's research project assessing professional engineering practices in the mining industry inside the United States. This research will be used to improve engineering standards as it applies to mining. This survey is confidential—please do not include your name. Honesty and transparency are essential to the integrity and accuracy of this research. Thank you for your cooperation. Questions that have an asterisk require an answer. However, if for any reason you no longer wish to participate you may click on the exit button located in the top-right corner of the survey.
46. I understand that this survey is confidential and if I feel uncomfortable or no longer wish to participate I can click on the exit button located in the top-right corner of the survey.
a. Yes b. No
47. I understand that I can contact the Institutional Review Board (IRB) if I have questions regarding my rights as a research participant. Also, I can contact the IRB if I have questions, complaints or concerns which I feel that I cannot discuss with the investigator. (Graduate student) The University of Utah IRB may be reached by phone at (801) 581-3655 or by email at [email protected]. I can also contact the Research Participant Advocate (RPA) by phone at (801) 581-3803 or by email at [email protected].
a. Yes b. No
1
2
Demographics
D1 48. I am.
a. Male b. Female
3
D2 49. I have at least one Professional Engineering (PE) license.
a. Yes b. No
4
D3
50. My PE license(s) is/are in the following engineering discipline(s): a. Chemical b. Civil c. Control Systems d. Electrical and Computer e. Environmental f. Fire Protection g. Industrial and Systems h. Mechanical i. Metallurgical and Materials j. Mining and Mineral Processing k. Naval Architecture and Marine l. Nuclear m. Petroleum n. Structural o. Other
5
D4
51. Years of experience as an engineer. a. 0-5 b. 6-10 c. 11-15 d. 16-20 e. 20+
6

68
D5
52. Years of experience as an operations manager.a. 0-5b. 6-10c. 11-15d. 16-20e. 20+f. N/A
7
D6
53. The mine in which I work has…a. Surface Operationsb. Underground Operationsc. Both Surface and Underground Operations
8
D7
54. The industry sector I currently work in is…a. Coalb. Metalc. Non-metal
9
D8
55. The primary commodity I associate with in my work is…a. Thermal coalb. Metallurgical coalc. Silverd. Golde. Copperf. Tronag. Phosphateh. Salti. Iron Orej. PGMk. Other__________________
10
D9
56. I have a bachelor’s degree in…a. Mining Engineeringb. Materials Science and Engineeringc. Chemical Engineeringd. Mechanical Engineeringe. Civil Engineeringf. Environmental Engineeringg. Electrical Engineeringh. Petroleum Engineeringi. Geologyj. Geological Engineeringk. Other__________________
11
D10
57. I have a master’s degree in…a. Mining Engineeringb. Materials Science and Engineeringc. Chemical Engineeringd. Mechanical Engineeringe. Civil Engineeringf. Environmental Engineeringg. Electrical Engineeringh. Petroleum Engineeringi. Geologyj. Geological Engineeringk. Other__________________l. N/A
12

69
D11
58. I have a PhD in… a. Mining Engineering b. Materials Science and Engineering c. Chemical Engineering d. Mechanical Engineering e. Civil Engineering f. Environmental Engineering g. Electrical Engineering h. Petroleum Engineering i. Geology j. Geological Engineering k. Other__________________ l. N/A
13
D12
59. My primary work location is at a… a. Cooperate Office b. Division/Regional Office c. Mine d. None of the above, I am currently a consultant and/or contractor
14

APPENDIX B
ONLINE SURVEY

71
On “Survey Monkey” I am able to apply logic to certain answers. This survey contains three such logic chains, the first chain includes the first two questions of the survey. If the participant were to answer no on either of those questions, then they will not be able to continue taking the survey. The second chain is question four, if they answer yes then they can answer question five. However, if they answer no then they will skip question five and go to question six. The last chain is question 14, if they answer “Mine” then follow the asterisk. If they choose any of the other three choices follow the double asterisk. Each chain ends on question 37 where both combine again and the participants can finish completing the survey. The survey takes about 20 minutes to complete.
Introduction: This survey is part of a graduate student's research project assessing professional engineering practices in the mining industry inside the United States. This research will be used to improve engineering standards as it applies to mining. This survey is confidential—please do not include your name. Honesty and transparency are essential to the integrity and accuracy of this research. Thank you for your cooperation.
1. I understand that this survey is confidential and if I feel uncomfortable or no longer wish to participate I can click on the exit button located in the top-right corner of the survey.
� Yes � No
2. I understand that I can contact the Institutional Review Board (IRB) if I have questions regarding my rights as a research participant. Also, I can contact the IRB if I have questions, complaints or concerns which I feel that I cannot discuss with the investigator. (Graduate student) The University of Utah IRB may be reached by phone at (801) 581-3655 or by email at [email protected]. I can also contact the Research Participant Advocate (RPA) by phone at (801) 581-3803 or by email at [email protected].
� Yes � No
Demographics 3. I am…
� Male � Female
4. I have at least one Professional Engineering (PE) license. � Yes � No

72
5. My PE license(s) is/are in the following engineering discipline(s):� Chemical � Civil � Control Systems � Electrical and Computer � Environmental � Fire Protection � Industrial and Systems � Mechanical � Metallurgical and Materials � Mining and Mineral Processing � Nuclear � Petroleum � Structural � Other
6. Years of experience as an engineer� 0-5 � 6-10 � 11-15 � 16-20 � 20+
7. Years of experience as an operations manager� 0-5 � 6-10 � 11-15 � 16-20 � 20+ � N/A
8. The mine in which I work has…� Surface operations � Underground operations � Both surface and underground operations

73
9. The industry sector I currently work in is… � Coal � Metal � Non-metal
10. The primary commodity I associate with in my work is… � Thermal coal � Metallurgical coal � Silver � Gold � Copper � Trona � Phosphate � Salt � Iron ore � Platinum Group Metals (PGM) � Other
11. I have a bachelor’s degree in… � Mining Engineering � Materials Science and Engineering � Chemical Engineering � Mechanical Engineering � Civil Engineering � Environmental Engineering � Electrical Engineering � Petroleum Engineering � Geology � Geological Engineering � Other

74
12. I have a master’s degree in… � Mining Engineering � Materials Science and Engineering � Chemical Engineering � Mechanical Engineering � Civil Engineering � Environmental Engineering � Electrical Engineering � Petroleum Engineering � Geology � Geological Engineering � Other � N/A
13. I have a Ph.D. in… � Mining Engineering � Materials Science and Engineering � Chemical Engineering � Mechanical Engineering � Civil Engineering � Environmental Engineering � Electrical Engineering � Petroleum Engineering � Geology � Geological Engineering � Other � N/A
14. My primary work location is at a… � Corporate office � Division office � Mine � None of the above, I am currently a consultant and/or contractor

75
15. *My mine always complies with MSHA regulations.
� Strongly Agree � Agree � Neither Agree nor Disagree � Disagree � Strongly Disagree
16. **My company always complies with MSHA regulations.
� Strongly Agree � Agree � Neither Agree nor Disagree � Disagree � Strongly Disagree
17. *At my mine it is acceptable to lower factors of safety to optimize production.
� Strongly Agree � Agree � Neither Agree nor Disagree � Disagree � Strongly Disagree
18. **At my company it is acceptable to lower factors of safety to optimize production.
� Strongly Agree � Agree � Neither Agree nor Disagree � Disagree � Strongly Disagree
19. *Taking risks for financial incentive is acceptable at my mine.
� Strongly Agree � Agree � Neither Agree nor Disagree � Disagree � Strongly Disagree
20. **Taking risks for financial incentive is acceptable in my company.
� Strongly Agree � Agree � Neither Agree nor Disagree � Disagree � Strongly Disagree
21. *My mine always applies high safety standards when modifying mine designs for economic or market reasons.
� Strongly Agree � Agree � Neither Agree nor Disagree � Disagree � Strongly Disagree
22. **My company always applies high safety standards when modifying mine designs for economic or market reasons.
� Strongly Agree � Agree � Neither Agree nor Disagree � Disagree � Strongly Disagree
23. *My mine has a bonus or incentive plan.
� Strongly Agree � Agree � Neither Agree nor Disagree � Disagree � Strongly Disagree
24. **My company has a bonus or incentive plan.
� Strongly Agree � Agree � Neither Agree nor Disagree � Disagree � Strongly Disagree
25. *At my mine, bonus/incentive plans are partly based on safety performance.
� Strongly Agree � Agree � Neither Agree nor Disagree � Disagree � Strongly Disagree
26. **In my company, bonus/incentive plans are partly based on safety performance.
� Strongly Agree � Agree � Neither Agree nor Disagree � Disagree � Strongly Disagree

76
27. *My mine has a defined level of acceptable risk for mining engineering.
� Strongly Agree � Agree � Neither Agree nor Disagree � Disagree � Strongly Disagree
28. **My company has a defined level of acceptable risk for mining engineering.
� Strongly Agree � Agree � Neither Agree nor Disagree � Disagree � Strongly Disagree
29. *At my mine, bonus/incentive plans are partly based on production performance.
� Strongly Agree � Agree � Neither Agree nor Disagree � Disagree � Strongly Disagree
30. **In my company, bonus/incentive plans are partly based on production performance.
� Strongly Agree � Agree � Neither Agree nor Disagree � Disagree � Strongly Disagree
31. *My mine has not always complied with regulations so that I can get the job done.
� Strongly Agree � Agree � Neither Agree nor Disagree � Disagree � Strongly Disagree
32. **My company has not always complied with regulations so that they can get the job done.
� Strongly Agree � Agree � Neither Agree nor Disagree � Disagree � Strongly Disagree
33. *My mine always adheres to safety standards during mine operations.
� Strongly Agree � Agree � Neither Agree nor Disagree � Disagree � Strongly Disagree
34. **My company always adheres to safety standards during mine operations.
� Strongly Agree � Agree � Neither Agree nor Disagree � Disagree � Strongly Disagree
35. *My mine always adheres to good engineering practice when modifying mine design for economic or market reasons.
� Strongly Agree � Agree � Neither Agree nor Disagree � Disagree � Strongly Disagree
36. **My company always adheres to good engineering practice when modifying mine design for economic or market reasons.
� Strongly Agree � Agree � Neither Agree nor Disagree � Disagree � Strongly Disagree
37. Productivity is essential to a mine’s success, but ethics are not.
� Strongly Agree � Agree � Neither Agree nor Disagree � Disagree � Strongly Disagree
38. If there are no related negative consequences, I do not feel obligated to adhere to good engineering design.
� Strongly Agree � Agree � Neither Agree nor Disagree � Disagree � Strongly Disagree

77
39. Mining risks that negatively impact miners should not be tolerated, regardless of magnitude of the impact.
� Strongly Agree � Agree � Neither Agree nor Disagree � Disagree � Strongly Disagree
40. What is ethical in one mining company may not be in another.
� Strongly Agree � Agree � Neither Agree nor Disagree � Disagree � Strongly Disagree
41. If pressured to make a change in a mine design that would result in an unacceptable level of risk, I would rather resign than compromise my professional ethics.
� Strongly Agree � Agree � Neither Agree nor Disagree � Disagree � Strongly Disagree
42. Receiving a safety bonus has led to under-reporting of safety incidents in my company.
� Strongly Agree � Agree � Neither Agree nor Disagree � Disagree � Strongly Disagree
43. If there are no negative consequences when I fail to comply with MSHA regulations, my actions are justified.
� Strongly Agree � Agree � Neither Agree nor Disagree � Disagree � Strongly Disagree
44. Professionally, I have a clear understanding of acceptable risk in mining.
� Strongly Agree � Agree � Neither Agree nor Disagree � Disagree � Strongly Disagree
45. My company’s level of acceptable risk conflicts with my personal level of acceptable risk.
� Strongly Agree � Agree � Neither Agree nor Disagree � Disagree � Strongly Disagree
46. My company’s level of acceptable risk conflicts with my professional level of acceptable risk.
� Strongly Agree � Agree � Neither Agree nor Disagree � Disagree � Strongly Disagree
47. If there are no negative consequences for not adhering to good engineering design, my actions are justified.
� Strongly Agree � Agree � Neither Agree nor Disagree � Disagree � Strongly Disagree
48. Mining engineers should verify that their designs do not result in harm to others working in the mine.
� Strongly Agree � Agree � Neither Agree nor Disagree � Disagree � Strongly Disagree
49. Factor of safety is the most important parameter of acceptable risk for pit design, tunnel design, or roof control.
� Strongly Agree � Agree � Neither Agree nor Disagree � Disagree � Strongly Disagree
50. It is personally acceptable to me to cut corners provided the task is accomplished.
� Strongly Agree � Agree � Neither Agree nor Disagree � Disagree � Strongly Disagree

78
51. Personnel at my mine sometimes depart from standard operating procedures (SOPs) to get the job done.
� Strongly Agree � Agree � Neither Agree nor Disagree � Disagree � Strongly Disagree
52. My mine has always adhered to factors of safety during mine design.
� Strongly Agree � Agree � Neither Agree nor Disagree � Disagree � Strongly Disagree
53. I have not always fully completed the designated SOPs so that I can finish a task more efficiently.
� Strongly Agree � Agree � Neither Agree nor Disagree � Disagree � Strongly Disagree
54. I have not always complied with regulations so that I can get the job done.
� Strongly Agree � Agree � Neither Agree nor Disagree � Disagree � Strongly Disagree
55. Being ethical (compliance with rules, regulations, etc.) is important to operating a successful mine.
� Strongly Agree � Agree � Neither Agree nor Disagree � Disagree � Strongly Disagree
56. If there are no negative consequences for not following SOPs, my actions are justified.
� Strongly Agree � Agree � Neither Agree nor Disagree � Disagree � Strongly Disagree
57. My mine has not always adhered to factors of safety so that the job can get done.
� Strongly Agree � Agree � Neither Agree nor Disagree � Disagree � Strongly Disagree
58. If there are no related negative consequences, I do not feel a need to comply with regulations.
� Strongly Agree � Agree � Neither Agree nor Disagree � Disagree � Strongly Disagree
59. If there are no negative consequences, I do not have to follow the designated SOPs.
� Strongly Agree � Agree � Neither Agree nor Disagree � Disagree � Strongly Disagree

REFERENCES
Abramson, R. 1986. NASA to Study 2,000 Safety-Critical Parts: Challenger Had 748 Vital Components With No Backup Systems. LA Times. http://articles.latimes.com/1986-03-18/news/mn-26961_1_safety-critical. Accessed November 2015.
Bloom, M.C., and Milkovich, G.T. 1995. The Relationship Between Risk, Performance-Based Pay, and Organizational Performance. CAHRS Working Paper #95-01. Ithaca, NY: Cornell University, School of Industrial and Labor Relations, Center for Advanced Human Resource Studies.
BP. 2015. Annual Report and Form 20-F 2015. www.bp.com/content/dam/bp/pdf/investors/bp-annual-report-and-form-20f-2015.pdf. Accessed November 2016.
Business Dictionary. 2016. Acceptable Risk. www.businessdictionary.com/definition/ acceptable-risk.html. Accessed August 2016.
Caserta, R.J., and Singer, R.N. 2007. The Effectiveness of Situational Awareness Learning in Response to Video Tennis Match Situations. J. Appl. Sport Psychol. 19(2): 125–141.
COMLEX-USA. 2017. Computer-Based COMLEX-USA Content Outline. www.nbome.org/Dimension_2_outline.asp. Accessed April 2017.
Cohen, J. 1977. Statistical Power for the Behavioral Sciences, Rev. ed. New York: Academic Press.
Civil Engineering Academy. 2017. Is the NCEES Requiring a New Ethics Exam to Get Your PE?. http://civilengineeringacademy.com/ncees-ethics-exam/. Accessed March 2017.
Darling, P., eds. 2011. SME Mining Engineering Handbook, 3rd ed. Englewood, CO: SME.
Davis, M. 1998. Thinking Like an Engineer: Studies in the Ethics of a Profession. Oxford: Oxford U.P.

80
Dym, Clive L., Alice M. Agogino, Ozgur Eris, Daniel D. Frey, and Larry J. Leifer. 2005. Engineering Design Thinking, Teaching, and Learning. J. Eng. Educ. 94(1): 103–120.
EIA. 2016. How much oil is consumed in the United States?. www.eia.gov/tools/faqs/
faq.cfm?id=33&t=6. Accessed November 2016. Gadsden, J. 2013. Monitoring and Documentation. www.nysora.com/mobile/regional- anesthesia/3053-monitoring-and-documentation.html. Accessed November 2016. Gadsdesn, J., McCally, C., and Hadzic, A. 2010. Monitoring During Peripheral Nerve
Blockade. Curr. Opin. Anaesthesiology. 23(5): 656–661. Gardner, S. 2016. Normalization of Deviance. Presented at the 2016 Annual Society for
Mining, Metallurgy and Exploration, Phoenix, AZ, February 21–24. Gates, R.A., Gauna, M., Morley, T.A., O’Donnell Jr., J.R., Smith, G.E., Watkins, T.R.,
Weaver, C.A., and Zelanko, J.C., 2007. Crandall Canyon Mine. www.msha.gov/ Fatals/2007/CrandallCanyon/FTL07CrandallCanyonNoAppendix.pdf. Accessed November 2015.
Geller, S.E., Carter, N., DePasquale, J., Pettinger, C., and Williams, J. 2001 Applications
of Behavioral Science to Improve Mine Safety. In Mine Health and Safety Management, Edited by Michael Karmis. Englewood, CO: SME. pp. 65–82.
Gillen, C. 2016. Should I Study for the MPRE? (Hint: Yes!). www.kaptest.com/ blog/bar-
exam-insider/2016/08/12/should-i-study-for-the-mpre-hint-yes/. Accessed April 2017.
Goldfried, M.R. 1971. Systematic Desensitization as Training in Self-Control. J.
Consulting Clin. Psychol. 37(2): 228–234. Gorrell, M. 2013. Engineering firm fined for role in Crandall Canyon tragedy. Salt Lake
Tribune. http://archive.sltrib.com/story.php?ref=/sltrib/news/56888858-78/msha-mine-canyon-agapito.html.csp. Accessed November 2016.
Green, S.B. 1991. How Many Subjects Does It Take to Do a Regression Analysis?
Multivariate Behav. Res. 26(3): 499–510. Hartman, H. L., and Mutmansky, J.M. 2002. Introductory Mining Engineering. New
Jersey: John Wiley & Sons. Hayes, A.F. 2013. Introduction to Mediation, Moderation, and Conditional Process
Analysis: A Regression-Based Approach. New York: The Guildford Press. p. 59. Hethmon, T. 2017. Safety and Health Management in Mining. (forthcoming)

81
ICAP. 2015. Oath of Honor. http://dnn9ciwm8.azurewebsites.net/What-is-the-Law-Enforcement-Oath-of-Honor. Accessed August 2016.
Investopedia. 2016. Litigation Risk. www.investopedia.com/terms/l/litigation-risk.asp. Accessed August 2016.
Laerd Statistic. 2017. Hierarchical Multiple Regression. https://statistics.laerd.com/ premium/spss/hmr/hierarchical-multiple-regression-in-spss.php. Accessed 2017.
McSween, T.E. 2003. Value-Based Safety Process: Improving Your Safety Culture with Behavior-Based Safety. Hoboken, NJ: Wiley-Interscience.
Melchers, R.E. 2001. On the ALARP Approach to Risk Management. Reliab. Eng. Syst. Saf. 71: 201–208.
Merriam-Webster. 2016. Culture. www.merriam-webster.com/dictionary/culture. Accessed February 2016.
Merritt, C.W., Bresland, J.S., Visscher, G.L., Wark, W.B., and Wright, W.E. 2005. Texas Refinery Investigation Report. www.csb.gov/assets/1/19/csbfinalreportbp.pdf. Accessed November 2015.
NASA. 2015. Space Shuttle Era. www.nasa.gov/mission_pages/shuttle/flyout/index.html. Accessed November 2016.
NASA. 2003. Columbia Accident Investigation Report. www.nasa.gov/columbia/home /CAIB_Vol1.html. Accessed August 2016.
NCEES. 2017. PE Exam. http://ncees.org/engineering/pe/. Accessed March 2017.
North, M. 2002. Greek Medicine. https://www.nlm.nih.gov/hmd/greek/greek_oath.html. Accessed February 2016
Page, N.G., Watkins, T.R., Caudill, S.D., Cripps, D.R., Godsey, J.F., Maggard, C.J., Moore, A.D., Morley, T.A., Phillipson, S.E., Sherer, H.E., Steffey, D.A., Stephan, C.R., Stoltz, R.T., and Vance, J.W. 2010. Upper Big Branch. www.msha.gov/Fatals/2010/UBB/FTL10c0331noappx.pdf. Accessed November 2015.
Pinto, J. K. 2014. Project management, governance, and the normalization of deviance. Int. J. Project Manage. 32(3): 376–387.
Preamble. 2016. Preamble: A Lawyer’s Responsibilities. www.utcourts.gov/resources/rules/ucja/ch13/intro.htm. Accessed July 2016.
Prielipp, R.C., Magro, M., Morell, R.C., and Brull, S.J. 2010. The Normalization of Deviance: Do We (Un) knowingly Accept Doing the Wrong Thing? Anesthesia &

82
Analgesia. 110(5): 1499–1502. Rachman, S. 1967. Systematic Desensitization. Psychol. Bull. 67(2): 93–103. Singhapakdi, A. 1999. Perceived Importance of Ethics and Ethical Decisions in
Marketing. J. Bus. Res. 45(1): 89–99. Singhapakdi. A., Vitell. S.J., Rallapalli. K.C., and Kraft. K.L. 1996. The Perceived Role
of Ethics and Social Responsibility: A Scale Development. J. Bus. Ethics. 15: 1131–1140.
Shoukri, M.M., Asyali. M.H., and Domner, A. 2004. Sample Size Requirements for the
Design of Reliability Study: Review and New Results. Stat. Methods Med. Res. 13: 1–21.
Slovic, P. 1987. Perception of Risk. Am. Assoc. Adv. Sci. 236(4799): 280–85. Slovic, P., and Peters, E. 2006. Risk Perception and Affect. Curr. Directions Psychol.
Sci. 15(6): 322–25. Statistics Solutions. 2016. Correlation in SPSS. www.statisticssolutions.com/correlation-
in-spss. Accessed January 2017. Tavakol, M., and Dennick, R. 2011. Making Sense of Cronbach’s alpha. Int. J. Med.
Educ. 2:53–55. The Survey System. 2017. Correlation. www.surveysystem.com/correlation.htm.
Accessed January 2017. Tulloch, A.I.T., Maloney, R.F., Joseph, L.N., Bennett, J.R., Di Fonzo, M.M.I., Probert,
W.J.M., O’Conner, S.M., Densem, J.P., and Possingham, H.P. 2014. Effect of Risk Aversion on Prioritizing Conservation Projects. Soc. Conserv. Biol. 29(2): 513–524.
UCLA. 2016. FAQ: What Are the Differences Between One-Tailed and Two-Tailed
Tests?. https://stats.idre.ucla.edu/other/mult-pkg/faq/general/faq-what-are-the-differences-between-one-tailed-and-two-tailed-tests/. Accessed December 2016.
U.S. Army Center of Military History. 2016. Oath of Enlistment.
www.history.army.mil/html/faq/oaths.html. Accessed August 2016. USMLE. 2017. Step 3. http://usmle.org/step-3/#outlines. Accessed April 2017. Veatch, R.M. 2000. Cross-Cultural Perspectives in Medical Ethics. Boston: Jones and Bartlett. Wilde, G.J.S. 1998. Risk Homeostasis Theory: An Overview. Inj. Prev. 4:89–91.