normalisation in life-cycle assessment: consequences of
TRANSCRIPT

HAL Id: hal-01787845https://hal.archives-ouvertes.fr/hal-01787845
Submitted on 22 Jun 2018
HAL is a multi-disciplinary open accessarchive for the deposit and dissemination of sci-entific research documents, whether they are pub-lished or not. The documents may come fromteaching and research institutions in France orabroad, or from public or private research centers.
L’archive ouverte pluridisciplinaire HAL, estdestinée au dépôt et à la diffusion de documentsscientifiques de niveau recherche, publiés ou non,émanant des établissements d’enseignement et derecherche français ou étrangers, des laboratoirespublics ou privés.
Normalisation in life-cycle assessment: consequences ofnew European factors on decision-making
Virgile Aymard, Valerie Botta-Genoulaz
To cite this version:Virgile Aymard, Valerie Botta-Genoulaz. Normalisation in life-cycle assessment: consequencesof new European factors on decision-making. Supply Chain Forum: An International Journal,Kedge Business School, 2017, Sustainability trends: metrics and approaches, 18 (2), pp.76-83.�10.1080/16258312.2017.1333385�. �hal-01787845�

Normalization in Life-Cycle Assessment: consequences of new
European factors on decision-making
Virgile AYMARD, Valérie BOTTA-GENOULAZ1
Univ Lyon, INSA-Lyon, UCBL, UL2, DISP EA4570, F-69621 Villeurbanne cedex,
France
1 Corresponding author: [email protected]

Normalization in Life-Cycle Assessment: consequences of new
European factors on decision-making
Abstract. Environmental performance assessment of products is necessary to
improve sustainability in supply chains. Life-Cycle Assessment (LCA) and its
optional normalization step may be used for this purpose. Based on an
illustration, this paper studies the most recent International reference Life-Cycle
Data system (ILCD) normalization factors and compares them with the most
commonly used normalization factors given by CML and ReCiPe H methods.
Normalization with ILCD shows differences in the results, compared to
normalization with older methods, which may have consequences on business
decisions. Indeed some impacts categories are undervalued with old methods
because their factors are not up to date. We conclude on the importance of using
the latest methods to assess environmental impacts, and on the need to link these
approaches or metrics with supply-chain performance evaluation models.
Keywords: Life-Cycle Impact Assessment (LCIA), Normalization, ILCD,
Decision-making, Multi-criteria, Supply chain performance.

Introduction
Performance evaluation of supply-chains has been studied extensively, yet remains a
promising field of research, as the concept of sustainable development has now become
a key element in this area (Botta-Genoulaz et al. 2010; Estampe et al., 2013),. Jaegler
and Sarkis (2014) highlight the difficulty of universal rules when it comes to the
complexities of sustainability in the supply chain. There is a need for new methods in
the field of metrics, for measuring sustainable supply chains, and for new tools to
integrate them into assessment models. Life-Cycle Assessment (LCA) is a powerful
method in environmental performance measurement because it considers the entire life-
cycle of a product or a service, and it measures their impacts by means of multi-
indicators. The ISO standard 14040 (ISO 2006a) specifies that a LCA is carried out in
four distinct phases as illustrated in Figure 1.
< Insert Figure 1 around here >
According to the same ISO standard, LCA is based on principles like
transparency, and it gives priority to a scientific approach – which explains why it is
such a widely used tool. Yet LCA is usually not used to assess the sustainability of
supply-chain management practices (Chardine-Baumann & Botta-Genoulaz 2014), as it
is generally believed to be a complicated method whose results are difficult to
understand.
This paper studies normalization as a way to examine the importance and the
magnitude of the third step of a LCA, the Life-Cycle Impact Assessment (LCIA)
results. The International reference Life-Cycle Data system (ILCD) Handbook produced

by the Institute for Environment and Sustainability at the European Commission’s Joint
Research Centre (2010), defines LCIA as followed: “In a Life Cycle Assessment, the
emissions and resources consumed that are linked to a specific product are compiled
and documented in a Life Cycle Inventory (LCI). An impact assessment is then
performed, considering human health, the natural environment, and issues related to
natural resource use. Impacts considered in a Life Cycle Impact Assessment include
climate change, ozone depletion, eutrophication, acidification, human toxicity (cancer
and non-cancer related) respiratory inorganics, ionizing radiation, ecotoxicity,
photochemical ozone formation, land use, and resource depletion. The emissions and
resources are assigned to each of these impact categories. They are then converted into
indicators using impact assessment models. Emissions and resources consumed, as well
as different product options, can then be cross-compared in terms of the indicators.”
Normalization is then interesting to communicate on these results, and it can be used as
a decision support tool for businesses. Several methods are available to calculate LCIA
and each method has its own normalization factors. It is not always easy to know which
method a LCA-analyst may use to reduce risks and uncertainties.
We focus on the ILCD Handbook, which proposes the most recent method to
perform LCIA and LCIA normalization. Based on an illustration, we show the
consequences on strategic decisions if old normalization methods are used.
The remainder of this paper is organized as follows: The second Section
introduces LCA methods and the normalization concept. The third Section highlights
the difficulties and limits with the normalization of environmental LCA results. In the
fourth Section we propose an approach to reduce uncertainties, based on the ILCD
Handbook. Finally, in the last Section, we conclude on the importance of using the

latest available methods to assess the environmental impacts of a system, and on the
need to link these approaches with supply-chain performance evaluation models.
Normalization for the interpretation of environmental LCA results
LCA, a powerful but complex decision support methodological tool for
companies
Many methodologies and tools are available to perform an environmental analysis of a
product or a service system. Two main groups can be distinguished:
Mono-criteria analyses that focus on one type of environmental impact (e.g. the
Bilan Carbone® tool developed by ADEME2 that looks only at greenhouse gas
emissions);
Multi-criteria analyses that use different environmental impacts (e.g. LCA).
As a multi-criteria quantitative and transparent methodology based on a
scientific approach, LCA is a powerful decision support methodological tool for the
environmental management of industries and of supply chains. According to the ISO
standard 14040 (2006a) introduces previously, there are four phases in an LCA study:
1) the goal and scope definition phase, 2) the inventory analysis phase, 3) the impact
assessment phase, and 4) the interpretation phase. Phases three and four allow us to
identify the hot spots where the product or service system under study can be improved
throughout its life-cycle. These hot spots are identified using impact categories, which
represent environmental issues of concern (e.g. climate change, acidification, human
2 ADEME, French Agency for Environment and Energy Management,
http://www.ademe.fr/ (available online 21/03/2016)
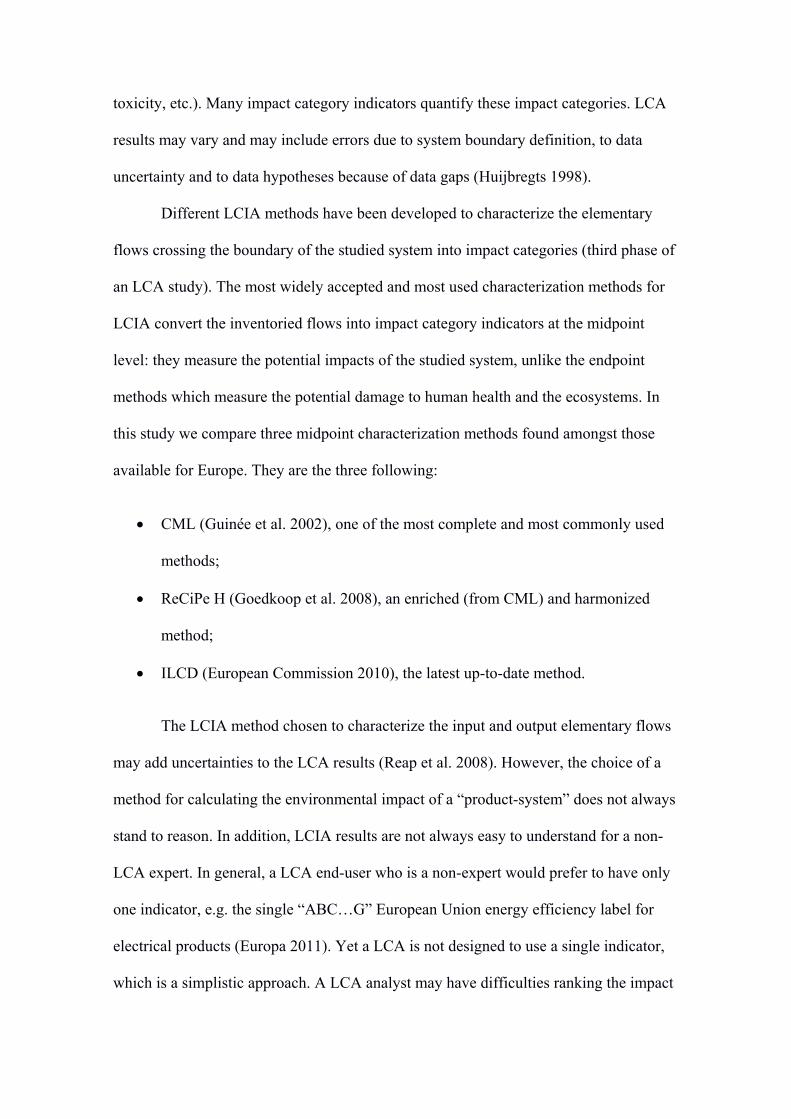
toxicity, etc.). Many impact category indicators quantify these impact categories. LCA
results may vary and may include errors due to system boundary definition, to data
uncertainty and to data hypotheses because of data gaps (Huijbregts 1998).
Different LCIA methods have been developed to characterize the elementary
flows crossing the boundary of the studied system into impact categories (third phase of
an LCA study). The most widely accepted and most used characterization methods for
LCIA convert the inventoried flows into impact category indicators at the midpoint
level: they measure the potential impacts of the studied system, unlike the endpoint
methods which measure the potential damage to human health and the ecosystems. In
this study we compare three midpoint characterization methods found amongst those
available for Europe. They are the three following:
CML (Guinée et al. 2002), one of the most complete and most commonly used
methods;
ReCiPe H (Goedkoop et al. 2008), an enriched (from CML) and harmonized
method;
ILCD (European Commission 2010), the latest up-to-date method.
The LCIA method chosen to characterize the input and output elementary flows
may add uncertainties to the LCA results (Reap et al. 2008). However, the choice of a
method for calculating the environmental impact of a “product-system” does not always
stand to reason. In addition, LCIA results are not always easy to understand for a non-
LCA expert. In general, a LCA end-user who is a non-expert would prefer to have only
one indicator, e.g. the single “ABC…G” European Union energy efficiency label for
electrical products (Europa 2011). Yet a LCA is not designed to use a single indicator,
which is a simplistic approach. A LCA analyst may have difficulties ranking the impact
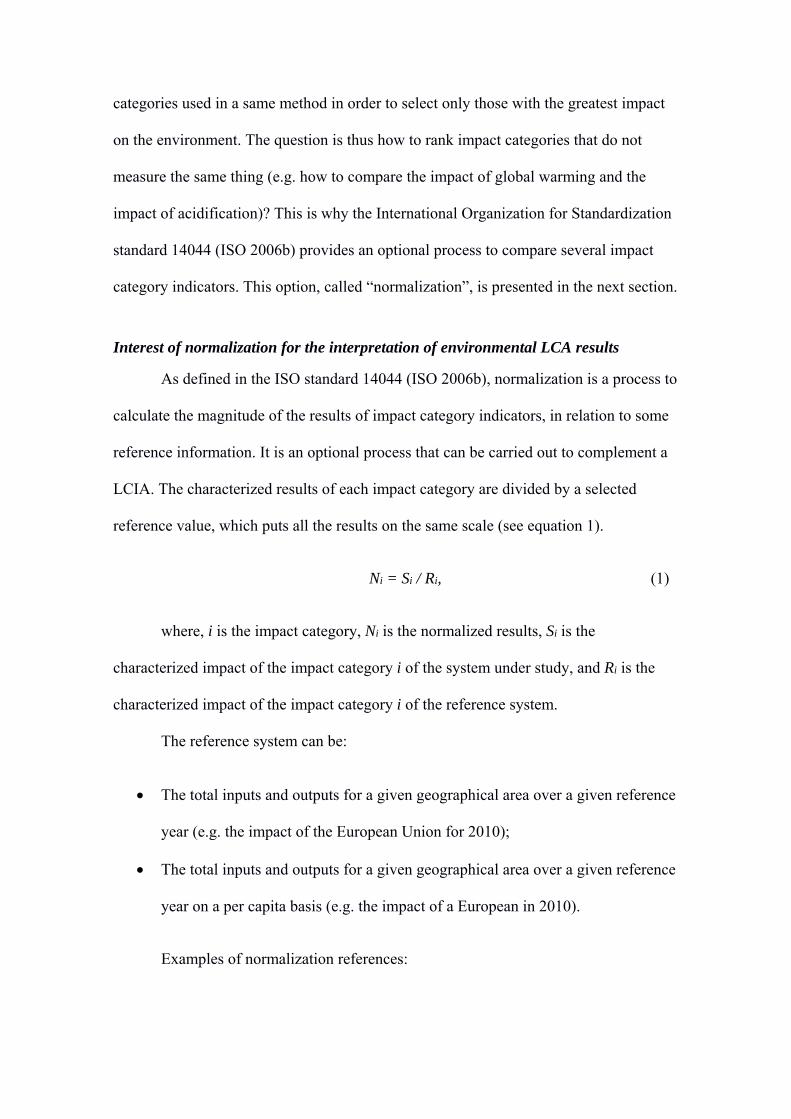
categories used in a same method in order to select only those with the greatest impact
on the environment. The question is thus how to rank impact categories that do not
measure the same thing (e.g. how to compare the impact of global warming and the
impact of acidification)? This is why the International Organization for Standardization
standard 14044 (ISO 2006b) provides an optional process to compare several impact
category indicators. This option, called “normalization”, is presented in the next section.
Interest of normalization for the interpretation of environmental LCA results
As defined in the ISO standard 14044 (ISO 2006b), normalization is a process to
calculate the magnitude of the results of impact category indicators, in relation to some
reference information. It is an optional process that can be carried out to complement a
LCIA. The characterized results of each impact category are divided by a selected
reference value, which puts all the results on the same scale (see equation 1).
Ni = Si / Ri, (1)
where, i is the impact category, Ni is the normalized results, Si is the
characterized impact of the impact category i of the system under study, and Ri is the
characterized impact of the impact category i of the reference system.
The reference system can be:
The total inputs and outputs for a given geographical area over a given reference
year (e.g. the impact of the European Union for 2010);
The total inputs and outputs for a given geographical area over a given reference
year on a per capita basis (e.g. the impact of a European in 2010).
Examples of normalization references:

CML: EU25+3, 2000 which represent the impact in 2000 of the 25 European
Union countries of 2006 + Iceland, Norway and Switzerland (CML2000 2015);
ReCiPe H: Europe ReCiPe H, 2000 which represent the impact of Europe in
2000) (Sleeswijk et al. 2008).
Normalization can be helpful in interpreting LCIA results, and in providing and
communicating information on the relative significance of the impact category indicator
results (Kim et al. 2013; Dahlbo et al. 2013; Van Hoof et al. 2013). The normalization
results will be more understandable for non-LCA experts because they are closer to
their personal preoccupations. The environmental impact of a product is easier to
understand when one can compare it to the environmental impact of a single person
over a full year.
Difficulties and limitations with the normalization of environmental LCA
results
Normalization is an interesting tool, but depending on the chosen characterization
method and reference system, LCIA results may vary widely. As a result, the right
decisions may not be taken when using it. Equation 1 shows that the Normalization is
calculated by dividing the impact of a system under study by the impact of the reference
system. Uncertainties may exist on both the numerator and the denominator due to
incompleteness. They can stem from the category indicator results of the product under
study, or from the reference system (Heijungs et al. 2007); therefore, the results of the
normalization can be too low or too high. Some bias may result from the following:
Uncertainties from the LCIA model (see second Section), and from the number
of considered substances / materials in the model;

The reference geographical area of the reference system that can be consistent or
not with the area of the studied system;
The reference year of the reference system that can be consistent or not with the
study;
The number of considered substances in the reference system.
We have shown in the second Section that it is complex to compare LCIA
characterization methods because they do not always have the same impact categories
and they can use different impact category indicators. The only common impact
category among all methods is “climate change”, for which the Intergovernmental Panel
on Climate Change developed a globally recognized model (IPCC 2007). The model
calculates the radiative forcing of all greenhouse gas, measured using the Global
Warming Potentials (GWP) expressed as a factor of carbon dioxide (CO2). In the
present section we compare two LCIA methods (CML and ReCiPe H) that measure the
GWP of substances for the 100-year time horizon (which is the basis adopted for the
Kyoto Protocol).
The LCA tool used for this study is openLCA3 and includes CML and ReCiPe
H. Both methods calculate climate change based on the GWP factors extracted from the
fourth assessment report of the IPCC (2007). We should have the same LCIA results
regardless of the method. However, LCIA calculation gives different results using CML
or ReCiPe H. These differences are explained by:
A different number of greenhouse gas elementary flows included in the model:
CML (359 elementary flows), ReCiPe H (461 elementary flows);
3 openLCA, GreenDelta, http://www.openlca.org/

A different strategy for the characterization of wood products’ impact: the CML
method uses a negative impact factor (positive impact for global warming) for
agricultural and forestry products (carbon dioxide consumption during the
growth period is greater than carbon dioxide release during the product life-
cycle). By contrast, ReCiPe H does not have any negative impact factors.
Therefore, the Normalization factors for the CML method and the ReCiPe H
method are different (see Table 1).
< Insert Table 1 around here >
This confirms that the LCIA results will differ, depending on the LCIA methods
used for a LCA study (Dreyer et al 2003; Bueno et al. 2016). Consequently, the
normalization calculation will also give different results (see Equation 1). These
differences will even be amplified if each LCIA method uses different normalization
references and normalization factors.
The limits and uncertainties of the normalization process can create different
interpretations of LCA results, which can have serious consequences for the
environmental strategy of a company. The classification of indicators inside the LCA
may give end-users the impression that some environmental impacts are more important
than others. There is a risk of ignoring some environmental impacts and therefore of
planning environmental strategies that lean towards some strategic choices rather than
others. This can go against the interests of the LCA: to use a multi-criteria tool to avoid
impact transfer from one impact category to another.

An approach based on new ILCD normalization factors to reduce
uncertainties
The ILCD Handbook
The ILCD Handbook is a guide produced by the Institute for Environment and
Sustainability at the European Commission’s Joint Research Centre on Best Practices in
LCA (2010). It provides LCA experts with recommendations to make quality LCAs and
to use the best LCIA methods in the European context. It is a combination of different
methods, both for midpoint and endpoint assessments (European Commission 2011).
This handbook actually provides the most up-to-date and the most complete method for
LCIA in Europe, yet until 2014 there were no normalization factors proposed for it.
This is no longer the case since in 2014 the Joint Research Centre from the European
Commission published a document with recommended normalization factors for the
EU-27, related to the domestic inventory in 2010 (European Commission 2014; Sala et
al 2015). See Table 2.
< Insert Table 2 around here >
In Table 2, units are defined as follows: kg CO2 eq. (kg equivalent in CO2), kg
CFC-11 eq. (kg equivalent of trichlorofluoromethane), CTUh (comparative toxic units
for humans), mol H+ eq. (equivalent molar concentration of the hydrogen ion), kg
PM2.5 eq. (kg equivalent of particulate matter with diameter under 2.5 µm), CTUe
(comparative toxic units for ecosystems), kBq U235 eq. to air (equivalent uranium
radiation measured in kilo Becquerel), kg NMVOC eq. (kg equivalent of non-methane
volatile organic compounds), mol N eq. (equivalent molar concentration of the nitrogen
atom), kg P eq. (kg phosphorus equivalent), kg N eq. (kg equivalent nitrogen), kg C

deficit (soil organic carbon deficit in kg), m3 water eq. (equivalent volume of water), kg
Sb eq. (kg equivalent of antimony).
The domestic inventory (third column) represents the total emissions of the EU-
27 countries in 2010. Per person normalization factors (fourth column) have been
calculated using Eurostat data on the EU-27 population in 2010 (domestic inventory
divided by 499 million inhabitants). The robustness inspires confidence in the quality of
the data and methods used to calculate the normalization factors; it is based on the level
of maturity of the scientific approach to measure the environmental impacts, as we have
more perspective on the assessment of global warming than on the assessment of human
toxicity of all chemical substances.
Illustration
In the scientific literature, many European LCA studies have been done using
normalization factors from LCIA methods like ReCiPe H (Van Hoof et al. 2013;
Dahlbo et al. 2013), but this is not the case for the ILCD normalization factors. The
normalization factors for ILCD, given in Table 2, have been calculated recently
(European Commission 2014; Sala et al 2015) with data related to the domestic
inventory in 2010 consistent with the ILCD method. These new normalization factors
have not yet been incorporated into LCA tools.
We conducted our LCA study on an urban furniture product made with
reinforced glass fibre composite materials, using openLCA. The company producing the
urban furniture needed to develop an eco-design tool to perform LCA analysis in order
to communicate with its customers on the product’s environmental impacts. Because of
the high number of existing environmental impact categories, the company did not
know which one to use. In order to select the most critical one, we first updated our
LCA database with the ILCD normalization factors, and then applied them on the LCIA

results of the product. This analysis gave us the opportunity to compare the ILCD
normalization results with the results previously obtained with the ReCiPe H
normalization factors. We set all the LCA parameters and models for both analyses.
With these fixed parameters, variations in the LCIA results can only be explained by the
differences between ReCiPe H and ILCD characterization methods and normalization
methods. The normalization results are presented in Table 3 (the impact categories
description has been harmonized between ReCiPe H and ILCD to help the comparison).
< Insert Table 3 around here >
There are differences between the normalized impacts calculated by the two
methods. Table 4 presents the variations between ReCiPe H results and ILCD results.
< Insert Table 4 around here >
Some differences were already expected due to discrepancies in the
normalization reference year (2000 for ReCiPe H and 2010 for ILCD). Looking at the
details by impact category, differences for the ionizing radiation are given by a different
total impact of domestic inventory (the LCIA results are the same with ILCD or ReCiPe
H). The Joint Research Centre Technical Report (European Commission, 2014) gives
explanations on the fact that the ReCiPe H reference system led to a large
overestimation of radioactive emissions. The same reason explains the ranking
difference for freshwater eutrophication: different choices in the modelling of the
domestic inventory (whereas the LCIA result is the same).
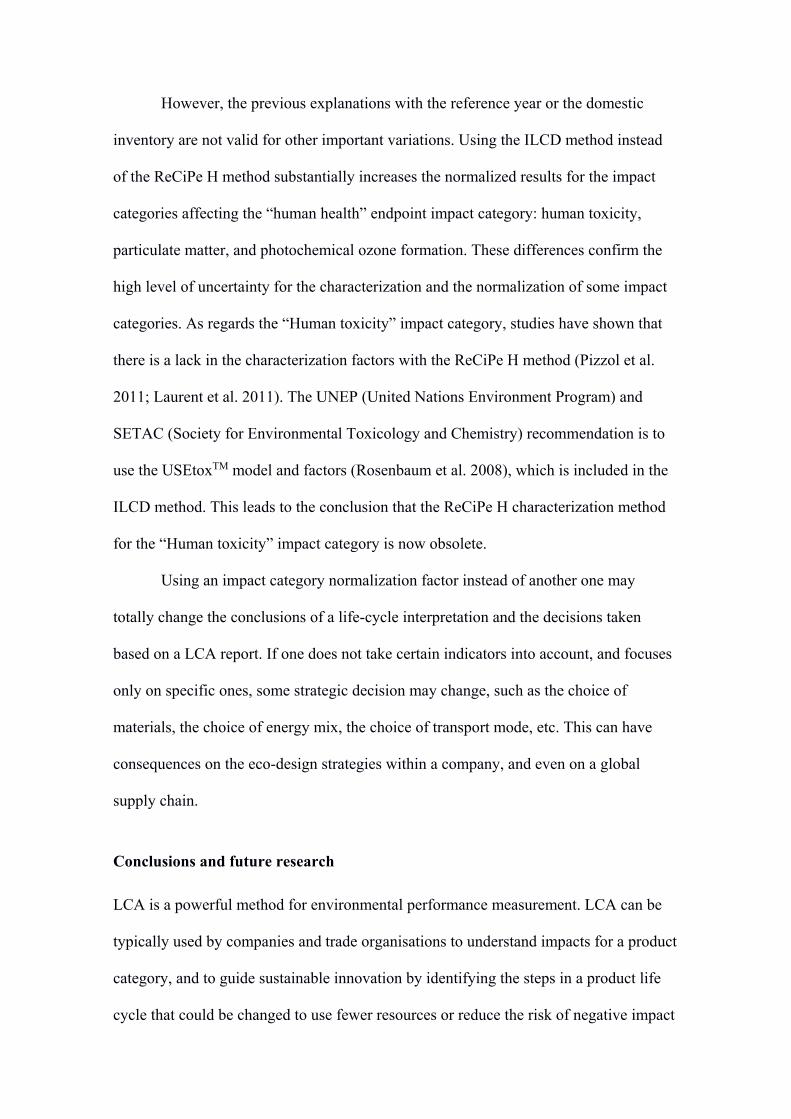
However, the previous explanations with the reference year or the domestic
inventory are not valid for other important variations. Using the ILCD method instead
of the ReCiPe H method substantially increases the normalized results for the impact
categories affecting the “human health” endpoint impact category: human toxicity,
particulate matter, and photochemical ozone formation. These differences confirm the
high level of uncertainty for the characterization and the normalization of some impact
categories. As regards the “Human toxicity” impact category, studies have shown that
there is a lack in the characterization factors with the ReCiPe H method (Pizzol et al.
2011; Laurent et al. 2011). The UNEP (United Nations Environment Program) and
SETAC (Society for Environmental Toxicology and Chemistry) recommendation is to
use the USEtoxTM model and factors (Rosenbaum et al. 2008), which is included in the
ILCD method. This leads to the conclusion that the ReCiPe H characterization method
for the “Human toxicity” impact category is now obsolete.
Using an impact category normalization factor instead of another one may
totally change the conclusions of a life-cycle interpretation and the decisions taken
based on a LCA report. If one does not take certain indicators into account, and focuses
only on specific ones, some strategic decision may change, such as the choice of
materials, the choice of energy mix, the choice of transport mode, etc. This can have
consequences on the eco-design strategies within a company, and even on a global
supply chain.
Conclusions and future research
LCA is a powerful method for environmental performance measurement. LCA can be
typically used by companies and trade organisations to understand impacts for a product
category, and to guide sustainable innovation by identifying the steps in a product life
cycle that could be changed to use fewer resources or reduce the risk of negative impact

on the environment. A reported by Weisbrod et al (2016), it is not enough due to the
complexity of supply chains and their impacts as it: (a) estimates a limited number of
potential environmental impacts, and (b) is a generalised assessment. Normalization is
an interesting optional step for LCIA interpretation. Even if it is optional for the ISO
standard 14044, it is a very interesting tool for studying the relative importance and
magnitude of the results of impact category indicators, and it can be used to present
LCIA results for internal use in a company or a supply chain network. Normalization
must nevertheless be used with awareness of its risks and limits. The analyst must really
understand the chosen LCIA method and its associated normalization factors. He or she
must be able to evaluate its uncertainties and gaps, must use the most appropriate
normalization references for the system under study, and must clearly inform LCA end-
users about the limits of the results and their interpretations. For these reasons, it is
important to use the latest available methods to assess the environmental impacts of a
system. As explained previously with the illustration, we recommend using the ILCD
Handbook for LCA in Europe, which proposes a combination of methods for a LCIA.
The ILCD method and its normalization factors are the most up-to-date, even if the
quality needs to be improved for some impact category indicators. Research has still to
be done to fill in the gaps and improve the models (European Commission, 2014).
Normalization factors for specific areas or countries are also required for more precise
LCIA (Slapnik et al. 2015; Lautier et al. 2010).
Supply-chain performance evaluation models rarely use LCA methods and
indicators. From an experimental point of view, case studies are expected with the
ILCD method and its normalization factors in order to have more examples of LCA
applied to supply chains. Links should be created between these two fields of research –
environmental assessment and supply chain evaluation - in order to improve the

assessment of a supply chain from a sustainability point of view. Consequently, LCA
approaches could be considered as good practices for the improvement of the design or
management of supply chains.
List of acronyms
EU: European Union
GWP: Global Warming Potentials
ILCD: International reference Life-Cycle Data system
IPCC: Intergovernmental Panel on Climate Change
LCA: Life-Cycle Assessment
LCI: Life-Cycle Inventory
LCIA: Life-Cycle Impact Assessment
Acknowledgments:
Funding provided by the Region Rhône-Alpes, France, supported this work.
References
Botta-Genoulaz, V., Campagne, J.-P., Llerena, D., & Pellegrin C. 2010. Supply Chain
Performance: Collaboration, Alignment and Coordination, ISTE Ltd (London,
UK) and John Wiley & Sons, Inc. (Hoboken, NY, USA), 370 p.
Bueno, C., Hauschild, M. Z., Rossignolo, J. A., Ometto, A. R., & Mendes, N. C. 2016.
“Sensitivity analysis of the use of Life-Cycle Impact Assessment methods: a
case study on building materials.” Journal of Cleaner Production, 112: 2208-
2220.
Chardine-Baumann, E., & Botta-Genoulaz, V. 2014. “A framework for sustainable
performance assessment of supply-chain management practices.” Computers &
Industrial Engineering, 76: 138-147.
CML2000 (2015) Normalization factors for the year 2000,
https://www.universiteitleiden.nl/en/research/research-output/science/cml-ia-
characterisation-factors (available online 05/09/2016)
Dahlbo, H., Koskela, S., Pihkola, H., Nors, M., Federley, M., & Seppälä, J. 2013.
“Comparison of different normalised LCIA results and their feasibility in
communication.” The International Journal of Life Cycle Assessment, 18(4):
850-860.
Dreyer, L. C., Niemann, A. L., & Hauschild, M. Z. 2003. “Comparison of three
different LCIA methods: EDIP97, CML2001 and Eco-indicator 99.” The
International Journal of Life Cycle Assessment, 8(4): 191-200.
Estampe, D., Lamouri, S., Paris, J.-L., Brahim-Djelloul, S. 2013. “A framework for
analysing supply chain performance evaluation models.” International Journal of
Production Economics, 142(2): 247-258
Europa 2010, Directive 2010/30/EU of the European Parliament and of the Council of
19 May 2010 on the indication by labelling and standard product information of
the consumption of energy and other resources by energy-related products.
Europa (web portal). Retrieved 24 April 2011, http://eur-lex.europa.eu/legal-
content/EN/ALL/?uri=CELEX:32010L0030, (available online 21/03/2016)
European Commission - Joint Research Center - Institute for Environment and
Sustainability (2014) Normalisation method and data for Environmental
Footprints., Report from Benini L., Mancini L., Sala S., Manfredi S., Schau E.
M., Pant R. Publications Office of the European Union, Luxemburg, ISBN: 978-
92-79-40847-2, 113p.
European Commission - Joint Research Centre - Institute for Environment and
Sustainability (2011): International Reference Life Cycle Data System (ILCD)
Handbook- Recommendations for Life Cycle Impact Assessment in the European
context. First edition November 2011. EUR 24571 EN. Luxemburg. Publications
Office of the European Union. 159 p.
European Commission - Joint Research Centre - Institute for Environment and
Sustainability (2010): International Reference Life Cycle Data System (ILCD)
Handbook - General guide for Life Cycle Assessment - Detailed guidance. First
edition March 2010. EUR 24708 EN. Luxembourg. Publications Office of the
European Union. 417 p.
Goedkoop M.J., Heijungs R, Huijbregts M., De Schryver A.; Struijs J., Van Zelm R,
2009. ReCiPe 2008: A life cycle impact assessment method which comprises
harmonised category indicators at the midpoint and the endpoint level; First
edition Report I: Characterisation; Published by Dutch National Institute for

Public Health and the Environment (RIVM), Netherland, http://www.lcia-
recipe.net (available online 21/03/2016), 132 p.
Guinée, J.B.; Gorrée, M.; Heijungs, R.; Huppes, G.; Kleijn, R.; Koning, A. de; Oers, L.
van; Wegener Sleeswijk, A.; Suh, S.; Udo de Haes, H.A.; Bruijn, H. de; Duin, R.
van; Huijbregts, M.A.J. 2002. Handbook on life cycle assessment. Operational
guide to the ISO standards. I: LCA in perspective. IIa: Guide. IIb: Operational
annex. III: Scientific background. Kluwer Academic Publishers, ISBN 1-4020-
0228-9, Dordrecht, 692 pp.
Heijungs, R., Guinée, J., Kleijn, R., & Rovers, V. 2007. “Bias in normalization: causes,
consequences, detection and remedies.” The International Journal of Life Cycle
Assessment, 12(4): 211-216.
Huijbregts, M. A. 1998. “Application of uncertainty and variability in LCA.” The
International Journal of Life Cycle Assessment, 3(5): 273-280.
IPCC 2007. Climate Change 2007: Synthesis Report: Contribution of Working Groups
I, II and III to the Fourth Assessment Report of the Intergovernmental Panel on
Climate Change [Core Writing Team, Pachauri, R.K and Reisinger, A. (eds.)]. A
report of the Intergovernmental Panel on Climate Change (IPCC), Geneva,
Switzerland, 104 pp.
ISO 2006a. Environmental management - Life cycle assessment - Principles and
framework. International Standard Organisation, ISO14040, Geneva, 20 p.
ISO 2006b. Environmental management - Life cycle assessment - Requirements and
guidelines. International Standard Organisation, ISO14044, Geneva, 46 p.
Jaegler, A., and Sarkis, J., 2014. “The Theory and Practice of Sustainable Supply
Chains”, Supply Chain Forum: An International Journal, 15(1): 2-5.
Kim, J., Yang, Y., Bae, J., & Suh, S. 2013. “The importance of normalization references
in interpreting life cycle assessment results.” Journal of Industrial Ecology,
17(3): 385-395.
Laurent, A., Lautier, A., Rosenbaum, R. K., Olsen, S. I., & Hauschild, M. Z. 2011.
“Normalization references for Europe and North America for application with
USEtox™ characterization factors.” The International Journal of Life Cycle
Assessment, 16(8): 728-738.
Lautier, A., Rosenbaum, R. K., Margni, M., Bare, J., Roy, P. O., & Deschênes, L. 2010.
“Development of normalization factors for Canada and the United States and

comparison with European factors.” Science of the Total Environment, 409(1):
33-42.
Pizzol, M., Christensen, P., Schmidt, J., & Thomsen, M.(2011. “Impacts of “metals” on
human health: a comparison between nine different methodologies for Life
Cycle Impact Assessment (LCIA).” Journal of Cleaner Production, 19(6): 646-
656.
Reap, J., Roman, F., Duncan, S., & Bras, B. 2008. “A survey of unresolved problems in
life cycle assessment.” The International Journal of Life Cycle Assessment,
13(5): 374-388.
Rosenbaum, R. K., Bachmann, T. M., Gold, L. S., Huijbregts, M. A., Jolliet, O.,
Juraske, R., & McKone, T. E. 2008. “USEtox—the UNEP-SETAC toxicity
model: recommended characterisation factors for human toxicity and freshwater
ecotoxicity in life cycle impact assessment.” The International Journal of Life
Cycle Assessment, 13(7): 532-546.
Sala, S., Benini, L., Mancini, L. & Pant, R. 2015. “Integrated assessment of
environmental impact of Europe in 2010: data sources and extrapolation
strategies for calculating normalisation factors.” International Journal of Life
Cycle Assessment 20(11): 1568-1585.
Slapnik, M., Istenič, D., Pintar, M., & Udovč, A. 2015. “Extending life cycle
assessment normalization factors and use of machine learning–A Slovenian case
study.” Ecological Indicators, 50: 161-172.
Sleeswijk, A. W., van Oers, L. F., Guinée, J. B., Struijs, J., & Huijbregts, M. A. 2008.
“Normalisation in product life cycle assessment: An LCA of the global and
European economic systems in the year 2000.” Science of the Total
Environment, 390(1): 227-240.
Van Hoof, G., Vieira, M., Gausman, M., & Weisbrod, A. 2013. “Indicator selection in
life cycle assessment to enable decision making: issues and solutions.” The
International Journal of Life Cycle Assessment, 18(8): 1568-1580.
Weisbrod, A., Bjork, A., McLaughlin, D., Federle, T., McDonough, K., Malcolm, J. &
Cina, R. 2016. “Framework for evaluating sustainably sourced renewable
materials.” Supply Chain Forum: An International Journal, 17(4): 259–272.
Biographical notes:
Virgile Aymard obtained a Master’s Degree in Industrial Engineering at the National Institute of
Applied Sciences of Lyon (INSA-Lyon) in 2003. He worked for 10 years in various industries
as a Supply Chain engineer, in France and Italy. In 2012, he obtained a Specialist Master’s
degree in Eco-design and Environmental Management at Arts et Métiers ParisTech, which gave
him the skills to assess environmental impacts of products or services throughout their life
cycle. He joined the DISP Laboratory in 2014 for 2 years to perform Life-Cycle Assessments
(LCA) within a research project composed of industrials companies and laboratories. He
currently works as a R&D project leader within a cluster for the textile industry, where he
manages collaborative projects with industrial companies and laboratories of the Auvergne-
Rhône-Alpes region.
Valérie Botta-Genoulaz is a full Professor at the National Institute of Applied Sciences of Lyon
(INSA-Lyon) at the University of Lyon, and Head of the DISP Laboratory (Decision and
Information systems for Production Systems). After 6 years of experience in industry, she
obtained a PhD in Production Management (Lyon, France), in 1996, and was certified as an
application consultant in “Production Planning” for SAP ERP, in 2000. Her research interests
include operation planning, supply chain management, the alignment of information systems
(information sharing, ERP systems), and their impacts on enterprise performance, with a
particular emphasis on sustainable development. She is involved in many research networks,
collaborative projects, international conference programme committees, and international
journal editorial boards, as well as providing expertise and co-chairing the steering committee of
the International Conference on Information Systems, Logistics and Supply Chains.

Figure 1: The four phases of LCA (ISO 2006a)

Table 1. CML and ReCiPe H characterization factors and normalization references
"Climate Change" impact category Unit : kg CO2 eq./kg
CML ReCiPe H
Number of characterization factors 359 461
Normalization references EU25+3, 2000 Europe ReCiPe H, 2000
Normalization factors 5,21E+12 8,15E+12

Table 2. ILCD recommended normalization factors for the EU-27 (European
Commission - Joint Research Centre - Institute for Environment and Sustainability,
2014)
Impact category Unit Domestic
Normalization Factor per
Person (domestic)
Overall Robustness
Climate change kg CO2 eq. 4,60E+12 9,22E+03 Very High
Ozone depletion kg CFC-11
eq. 1,08E+07 2,16E-02 Medium
Human toxicity - cancer effect
CTUh 1,84E+04 3,69E-05 Low
Human toxicity - non-cancer effect
CTUh 2,66E+05 5,33E-04 Low
Acidification mol H+ eq. 2,36E+10 4,73E+01 High
Particulate matter/Respiratory Inorganics
kg PM2.5 eq.
1,90E+09 3,80E+00 Very High
Ecotoxicity for aquatic fresh water
CTUe 4,36E+12 8,74E+03 Low
Ionising radiations – human health effects
kBq U235 eq. (to air)
5,64E+11 1,13E+03 Medium
Photochemical ozone formation
kg NMVOC eq.
1,58E+10 3,17E+01 Medium
Eutrophication - terrestrial mol N eq. 8,76E+10 1,76E+02 Medium
Eutrophication - freshwater
kg P eq. 7,41E+08 1,48E+00 Medium to Low
Eutrophication - marine kg N eq. 8,44E+09 1,69E+01 Medium to Low
Land use kg C deficit 3,74E+13 7,48E+04 Medium
Resource depletion - water m3 water eq. 4,06E+10 8,14E+01 Medium to Low
Resource depletion - mineral, fossil & renewable
kg Sb eq. 5,03E+07 1,01E-01 Medium

Table 3. ReCiPe H and ILCD normalization results for the case study
Impact category Amount normalization
Europe 2000 (ReCiPe Midpoint H)
Amount normalization EU27 2010
(ILCD)
Human toxicity 5,69E-11 2,40E-10
Ionizing radiation 6,01E-12 4,84E-11
Freshwater ecotoxicity 2,88E-10 4,14E-11
Marine eutrophication 4,47E-11 3,54E-11
Particulate matter 1,14E-11 2,58E-11
Photochemical ozone formation 8,89E-12 2,53E-11
Climate Change 1,43E-11 2,39E-11
Acidification 1,36E-11 1,89E-11
Freshwater eutrophication 4,31E-11 1,71E-11
Ozone depletion 6,04E-13 8,91E-13

Table 4. Ranking comparison of ILCD and ReCiPe H normalization results
Impact category ILCD
ILCD ranking
ReCiPe H ranking
Indicator variation ILCD vs. ReCiPe
Human toxicity 1 2 322%
Ionizing radiation 2 9 705%
Freshwater ecotoxicity 3 1 -86%
Marine eutrophication 4 3 -21%
Particulate matter 5 7 127%
Photochemical ozone formation 6 8 185%
Climate Change 7 5 67%
Acidification 8 6 39%
Freshwater eutrophication 9 4 -60%
Ozone depletion 10 10 47%