nordic bank seminar roar hoff 2010-06-03
TRANSCRIPT
8/8/2019 Nordic Bank Seminar Roar Hoff 2010-06-03
http://slidepdf.com/reader/full/nordic-bank-seminar-roar-hoff-2010-06-03 1/25
Roar Hoff,
Head of Group Risk Analysis
Nordic Bank Seminar, 3 June 2010, Copenhagen
DnB NOR Group
8/8/2019 Nordic Bank Seminar Roar Hoff 2010-06-03
http://slidepdf.com/reader/full/nordic-bank-seminar-roar-hoff-2010-06-03 2/25
2
Agenda
Actions ahead of Basel III
DnB NOR and the Norwegian economy
Basel III – new regulations
8/8/2019 Nordic Bank Seminar Roar Hoff 2010-06-03
http://slidepdf.com/reader/full/nordic-bank-seminar-roar-hoff-2010-06-03 3/25
3
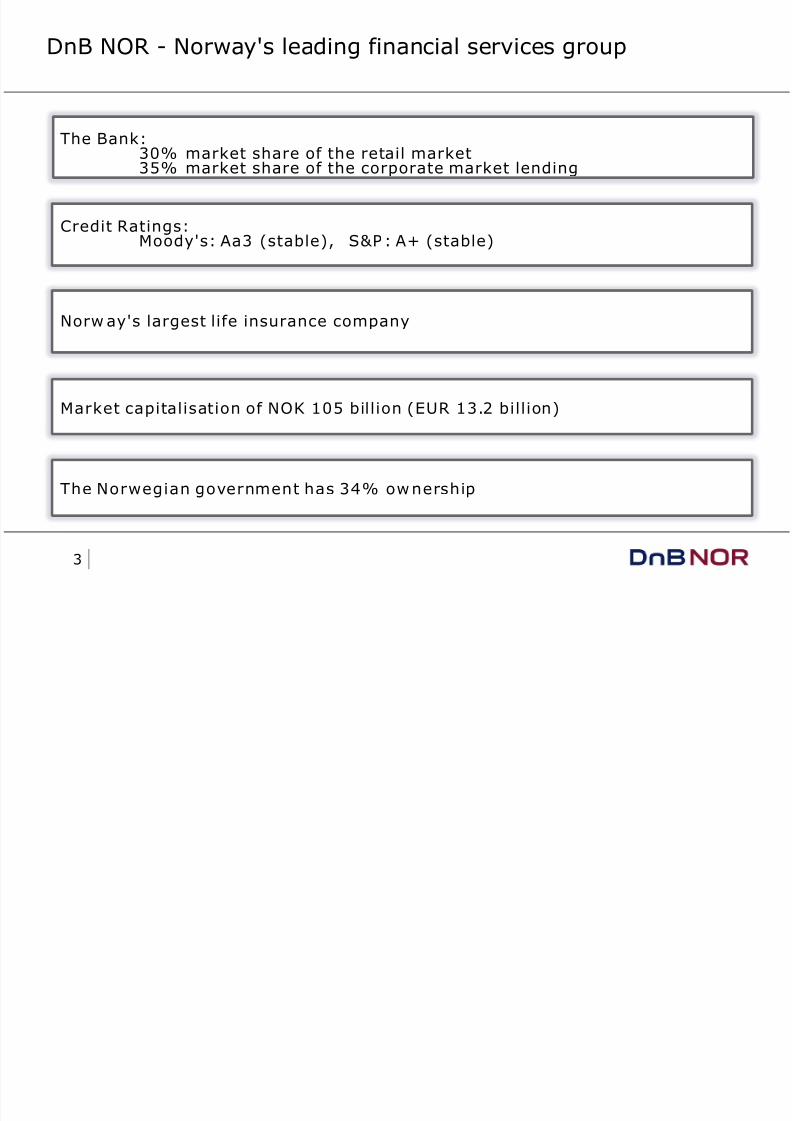
DnB NOR - Norway's leading financial services group
The Bank:30% market share of the retail market35% market share of the corporate market lending
Norw ay's largest life insurance company
Credit Ratings:Moody's: Aa3 (stable), S&P: A+ (stable)
The Norwegian government has 34% ownership
Market capitalisation of NOK 105 billion (EUR 13.2 billion)
8/8/2019 Nordic Bank Seminar Roar Hoff 2010-06-03
http://slidepdf.com/reader/full/nordic-bank-seminar-roar-hoff-2010-06-03 4/25
4
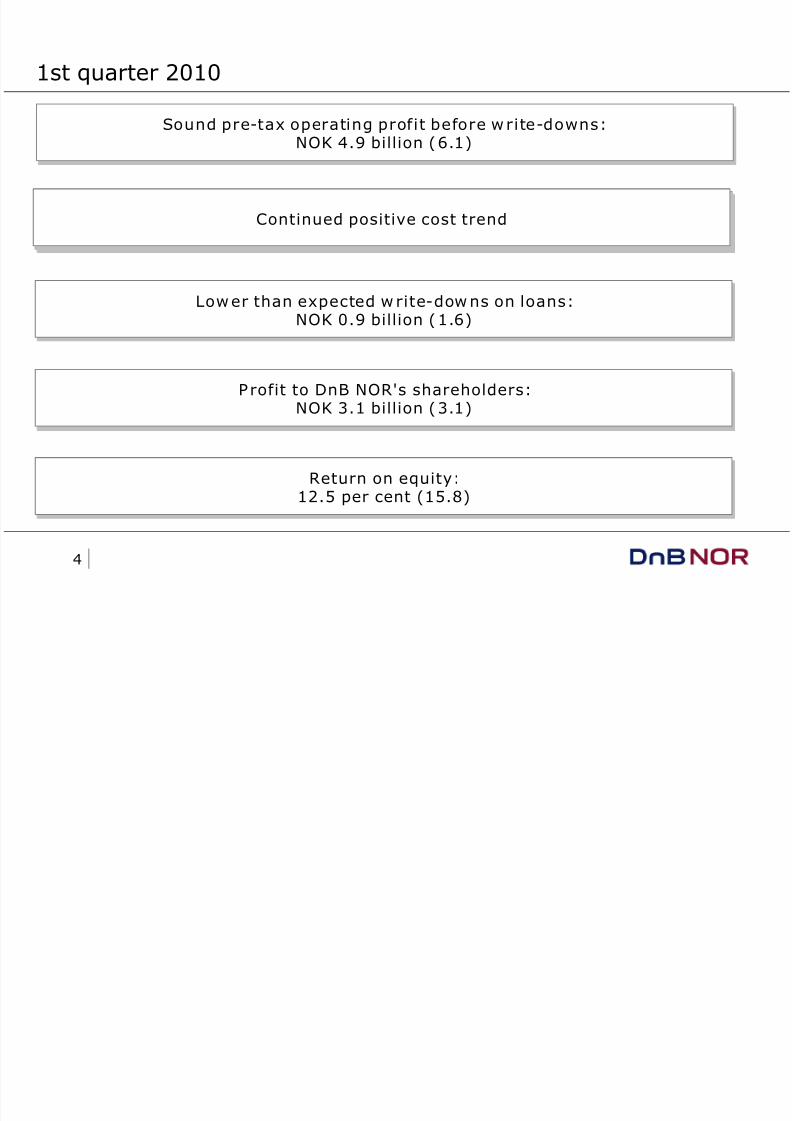
1st quarter 2010
Continued positive cost trend
Profit to DnB NOR's shareholders:
NOK 3.1 billion (3.1)
Sound pre-tax operating profit before write-downs:
NOK 4.9 billion (6.1)
Lower than expected w rite-downs on loans:NOK 0.9 billion (1.6)
Return on equity:12.5 per cent (15.8)
Continued positive cost trend

8/8/2019 Nordic Bank Seminar Roar Hoff 2010-06-03
http://slidepdf.com/reader/full/nordic-bank-seminar-roar-hoff-2010-06-03 5/25
5
Norway's economy less hit than the other Nordics. Why?
GDP, seas. adj.Per cent change since 2008Q1
-9-8
-7-6
-5-4
-3-2
-10
1
Q1 2008 Q3 2008 Q1 2009 Q3 2009 Q1 2010
US Jap. EZ UKDen. Fin. Swe. Nor.
Unemployment rates, %
0
1
2
3
4
56
7
8
9
10
11
Apr-06 Apr-07 Apr-08 Apr-09 Apr-10
EZ Sweden USA
Denmark Finland Norway
8/8/2019 Nordic Bank Seminar Roar Hoff 2010-06-03
http://slidepdf.com/reader/full/nordic-bank-seminar-roar-hoff-2010-06-03 6/25
6
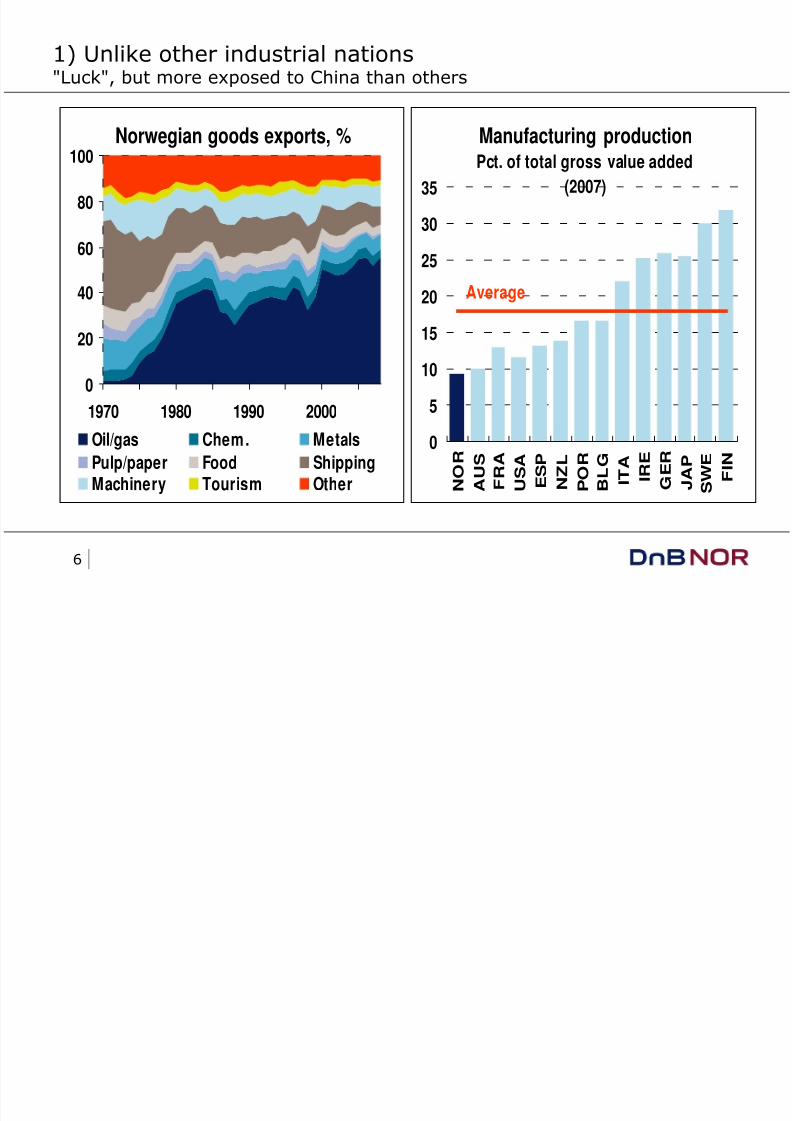
1) Unlike other industrial nations"Luck", but more exposed to China than others
Norwegian goods exports, %
0
20
40
60
80
100
1970 1980 1990 2000Oil/gas Chem. Metals
Pulp/paper Food ShippingMachinery Tourism Other
Manufacturing productionPct. of total gross value added
(2007)
05
10
15
20
25
30
35
N O R
A U S
F R A
U S A
E S P
N Z L
P O R
B L G I T A I R E
G E R
J A P
S W E F I N
Average
8/8/2019 Nordic Bank Seminar Roar Hoff 2010-06-03
http://slidepdf.com/reader/full/nordic-bank-seminar-roar-hoff-2010-06-03 7/25
7
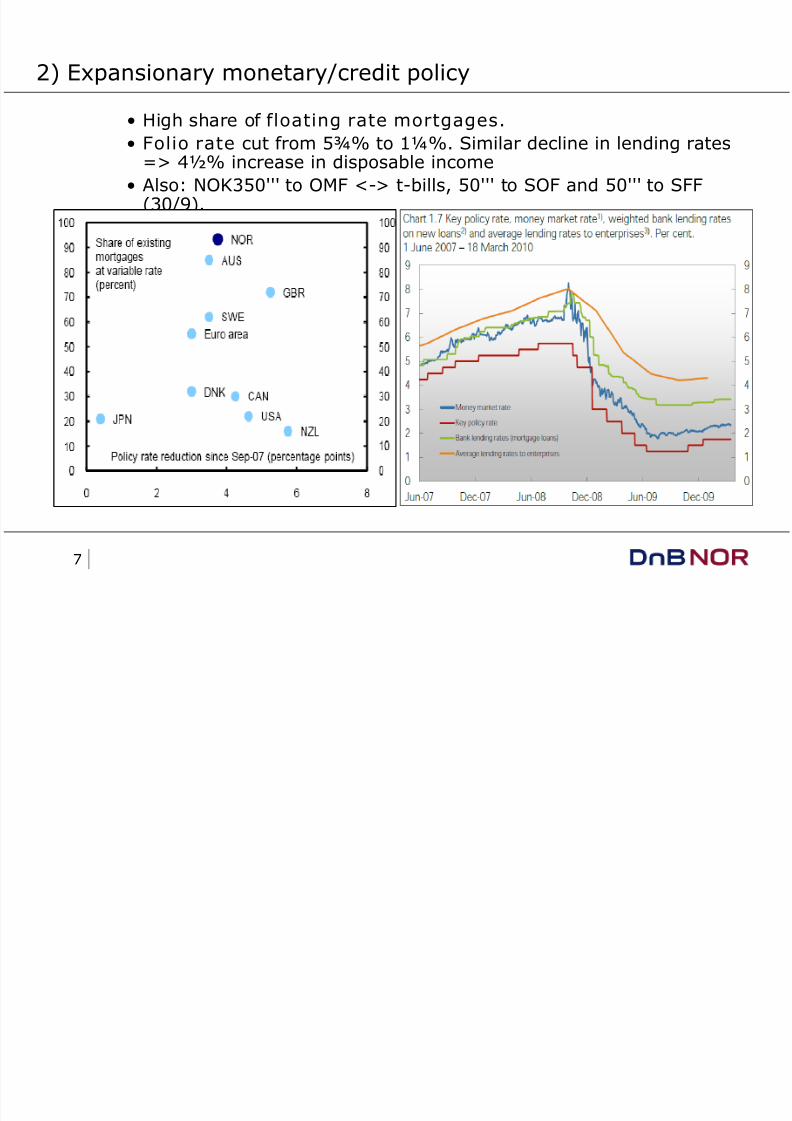
2) Expansionary monetary/credit policy
• High share of floating rate mortgages.
• Folio rate cut from 5¾% to 1¼%. Similar decline in lending rates=> 4½% increase in disposable income
• Also: NOK350''' to OMF <-> t-bills, 50''' to SOF and 50''' to SFF(30/9).
8/8/2019 Nordic Bank Seminar Roar Hoff 2010-06-03
http://slidepdf.com/reader/full/nordic-bank-seminar-roar-hoff-2010-06-03 8/25
8
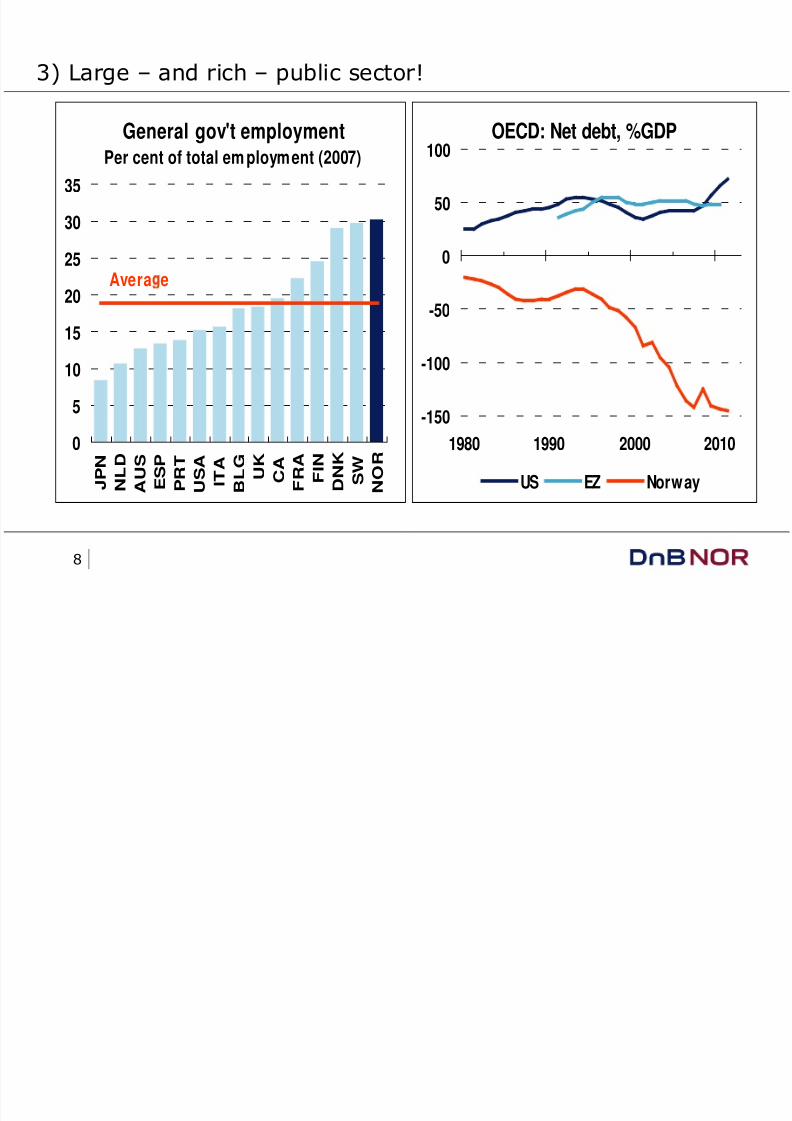
3) Large – and rich – public sector!
OECD: Net debt, %GDP
-150
-100
-50
0
50
100
1980 1990 2000 2010
US EZ Norway
General gov't employmentPer cent of total em ployment (2007)
05
10
15
20
25
30
35
J P N
N L D
A U S
E S P
P R T
U S A I T A
B L G U K C A
F R A F I N
D N K S W N O R
Avera e
8/8/2019 Nordic Bank Seminar Roar Hoff 2010-06-03
http://slidepdf.com/reader/full/nordic-bank-seminar-roar-hoff-2010-06-03 9/25
9
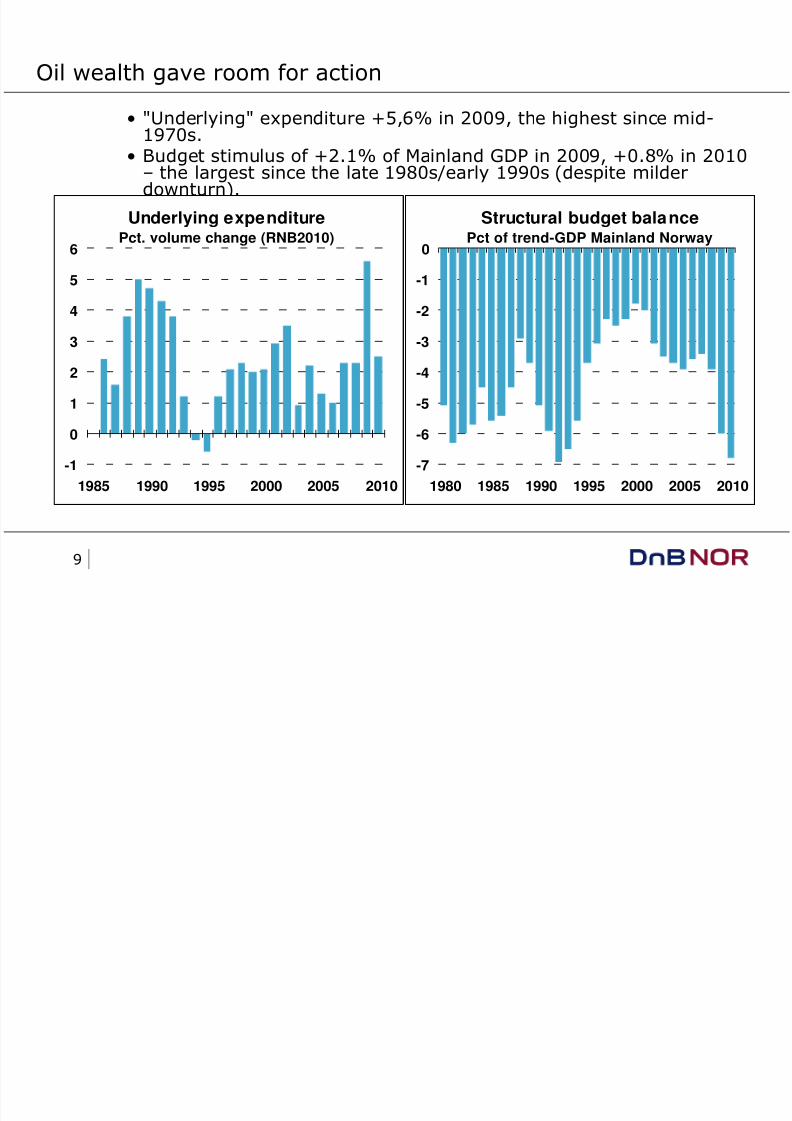
Oil wealth gave room for action
• "Underlying" expenditure +5,6% in 2009, the highest since mid-
1970s.• Budget stimulus of +2.1% of Mainland GDP in 2009, +0.8% in 2010
– the largest since the late 1980s/early 1990s (despite milderdownturn).
Underlying expenditurePct. volume change (RNB2010)
-1
0
1
2
3
4
5
6
1985 1990 1995 2000 2005 2010
Structural budget balancePct of trend-GDP Mainland Norway
-7
-6
-5
-4
-3
-2
-1
0
1980 1985 1990 1995 2000 2005 2010
8/8/2019 Nordic Bank Seminar Roar Hoff 2010-06-03
http://slidepdf.com/reader/full/nordic-bank-seminar-roar-hoff-2010-06-03 10/25
10
Basel III – new regulations
8/8/2019 Nordic Bank Seminar Roar Hoff 2010-06-03
http://slidepdf.com/reader/full/nordic-bank-seminar-roar-hoff-2010-06-03 11/25
11
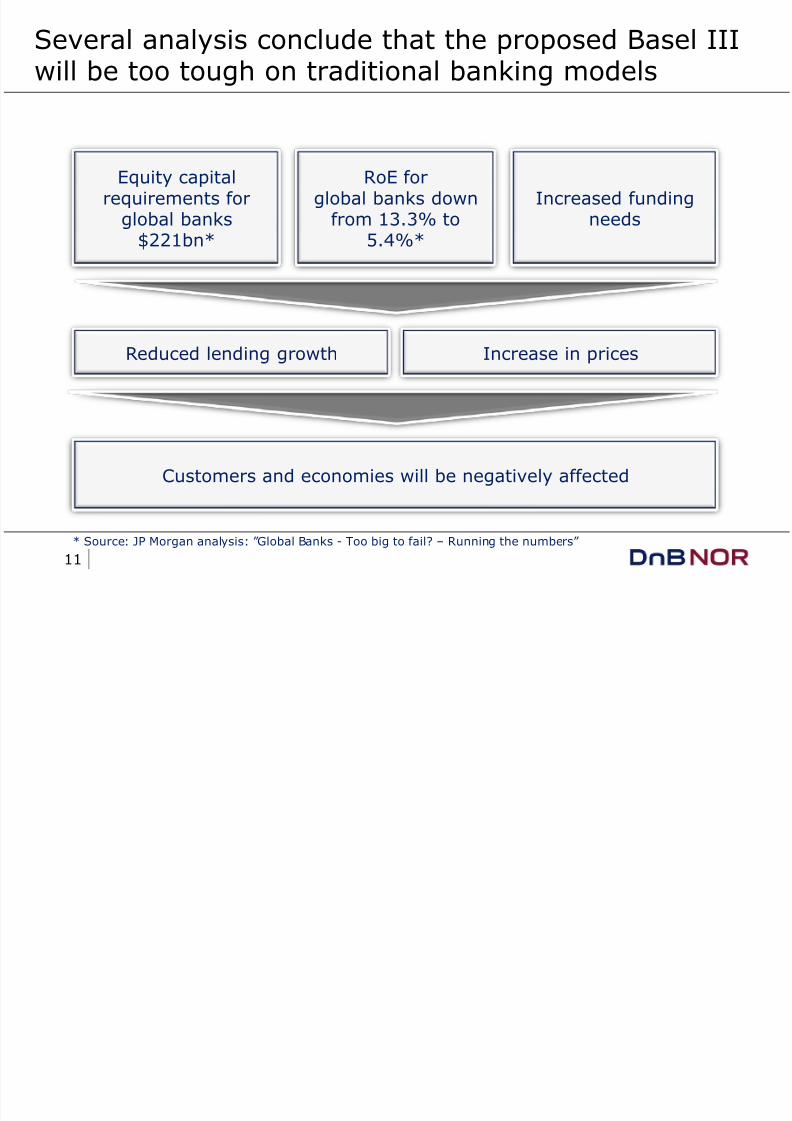
Several analysis conclude that the proposed Basel IIIwill be too tough on traditional banking models
* Source: JP Morgan analysis: ”Global Banks - Too big to fail? – Running the numbers”
Equity capitalrequirements for
global banks$221bn*
RoE forglobal banks down
from 13.3% to5.4%*
Increased fundingneeds
Reduced lending growth Increase in prices
Customers and economies will be negatively affected
8/8/2019 Nordic Bank Seminar Roar Hoff 2010-06-03
http://slidepdf.com/reader/full/nordic-bank-seminar-roar-hoff-2010-06-03 12/25
12
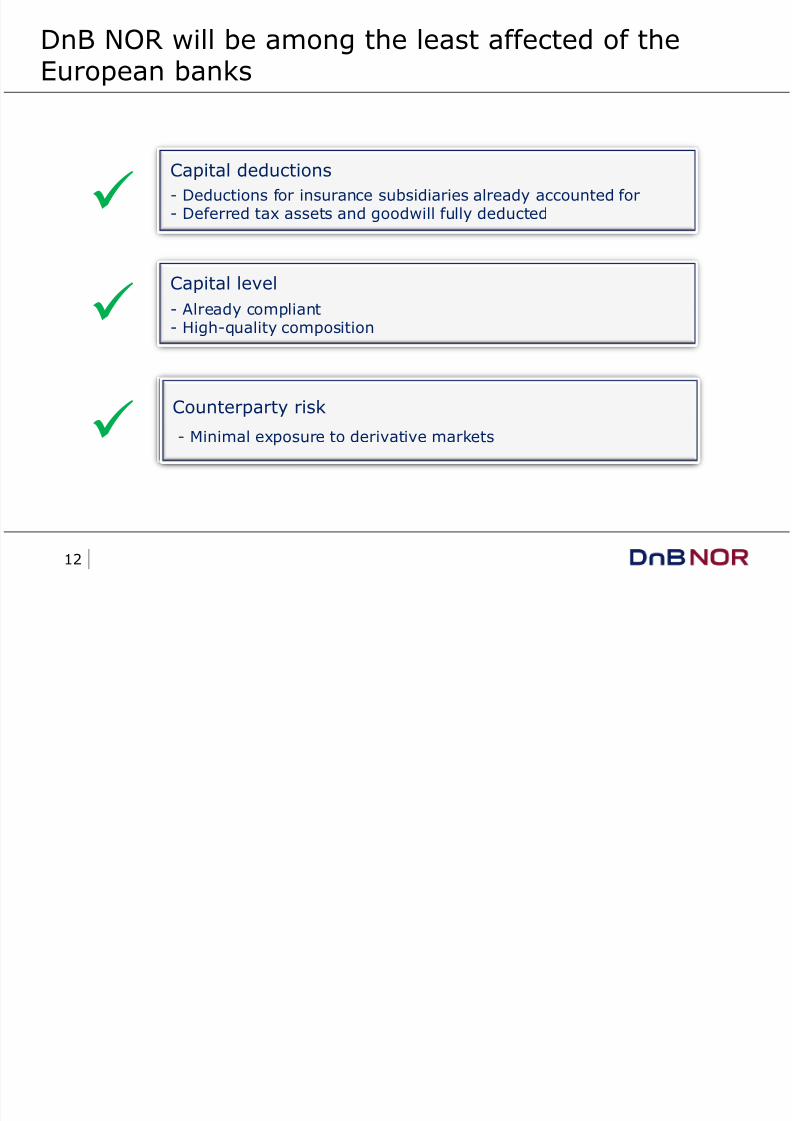
DnB NOR will be among the least affected of theEuropean banks
Capital level
- Already compliant- High-quality composition
Counterparty risk- Minimal exposure to derivative markets
Capital deductions
- Deductions for insurance subsidiaries already accounted for- Deferred tax assets and goodwill fully deducted
Counterparty risk- Minimal exposure to derivative markets
8/8/2019 Nordic Bank Seminar Roar Hoff 2010-06-03
http://slidepdf.com/reader/full/nordic-bank-seminar-roar-hoff-2010-06-03 13/25
13
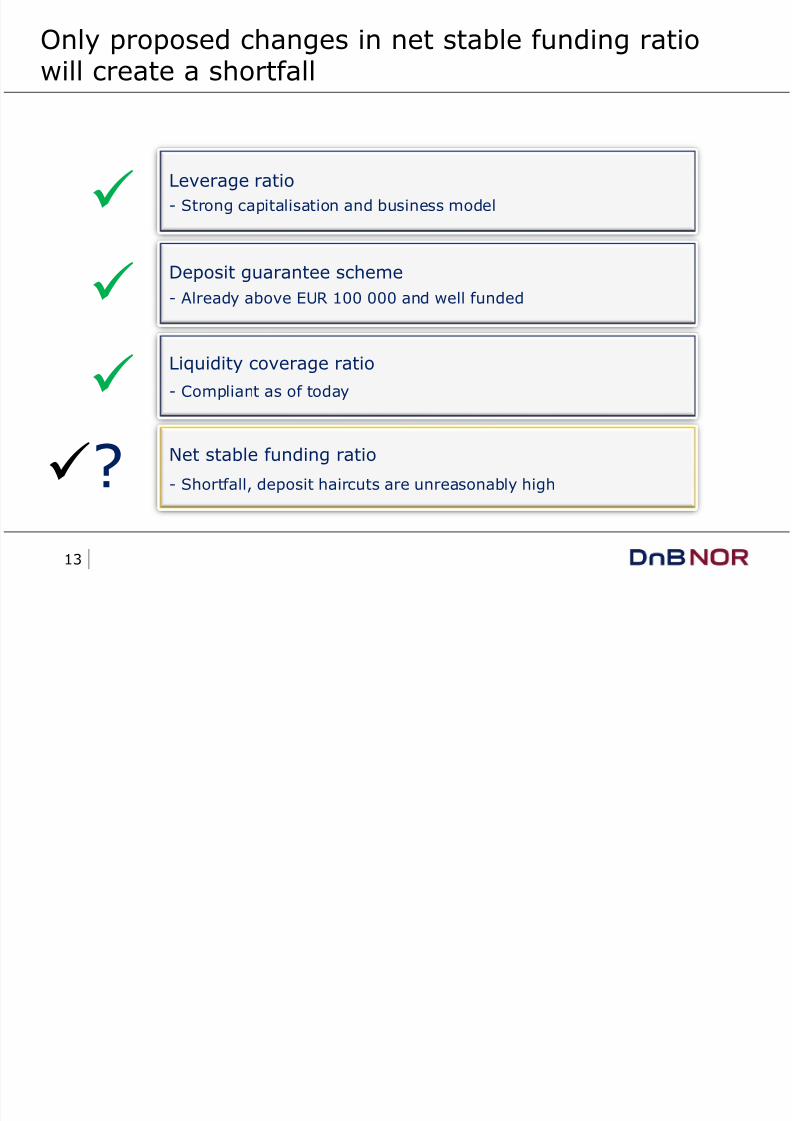
Only proposed changes in net stable funding ratiowill create a shortfall
Leverage ratio
- Strong capitalisation and business model
Deposit guarantee scheme- Already above EUR 100 000 and well funded
Net stable funding ratio
- Shortfall, deposit haircuts are unreasonably high?
Liquidity coverage ratio
- Compliant as of today
8/8/2019 Nordic Bank Seminar Roar Hoff 2010-06-03
http://slidepdf.com/reader/full/nordic-bank-seminar-roar-hoff-2010-06-03 14/25
14
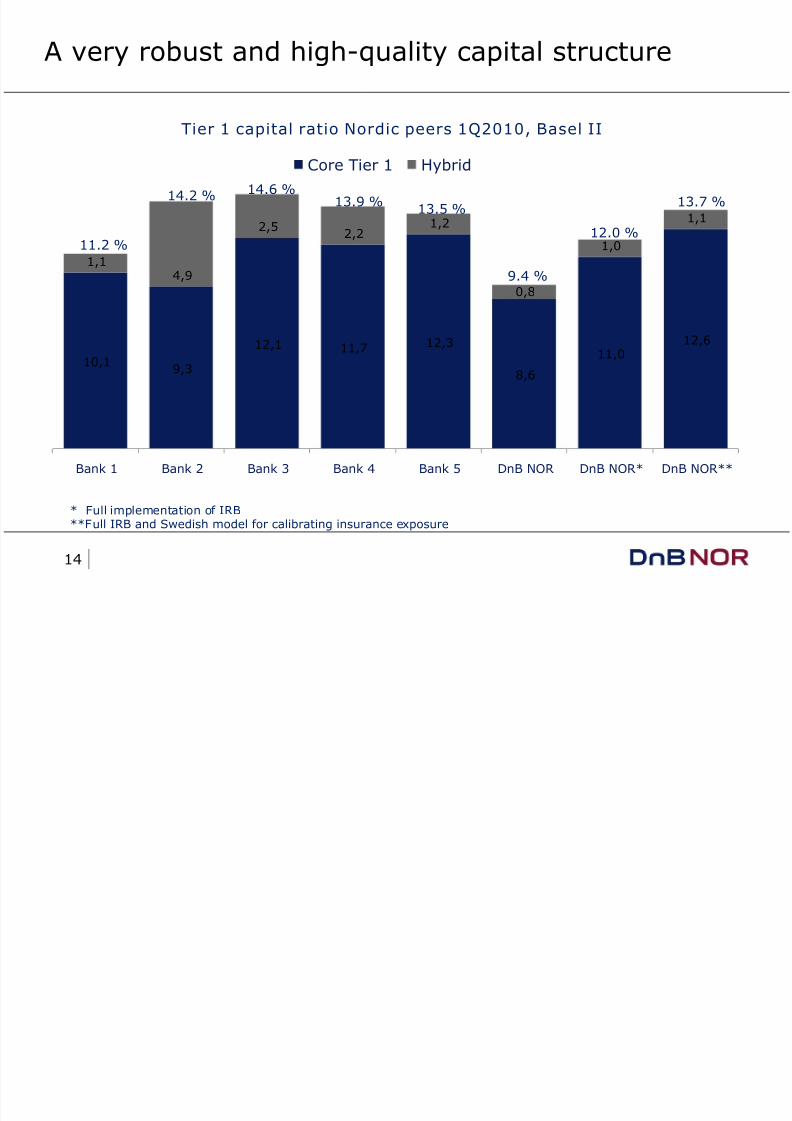
10,19,3
12,1 11,7 12,3
8,6
11,012,6
1,1
4,9
2,52,2
1,2
0,8
1,0
1,1
Bank 1 Bank 2 Bank 3 Bank 4 Bank 5 DnB NOR DnB NOR* DnB NOR**
Core Tier 1 Hybrid
A very robust and high-quality capital structure
* Full implementation of IRB**Full IRB and Swedish model for calibrating insurance exposure
14.2 % 14.6 %13.9 %
13.5 %
9.4 %
12.0 %
13.7 %
11.2 %
Tier 1 capital ratio Nordic peers 1Q2010, Basel II
8/8/2019 Nordic Bank Seminar Roar Hoff 2010-06-03
http://slidepdf.com/reader/full/nordic-bank-seminar-roar-hoff-2010-06-03 15/25
15
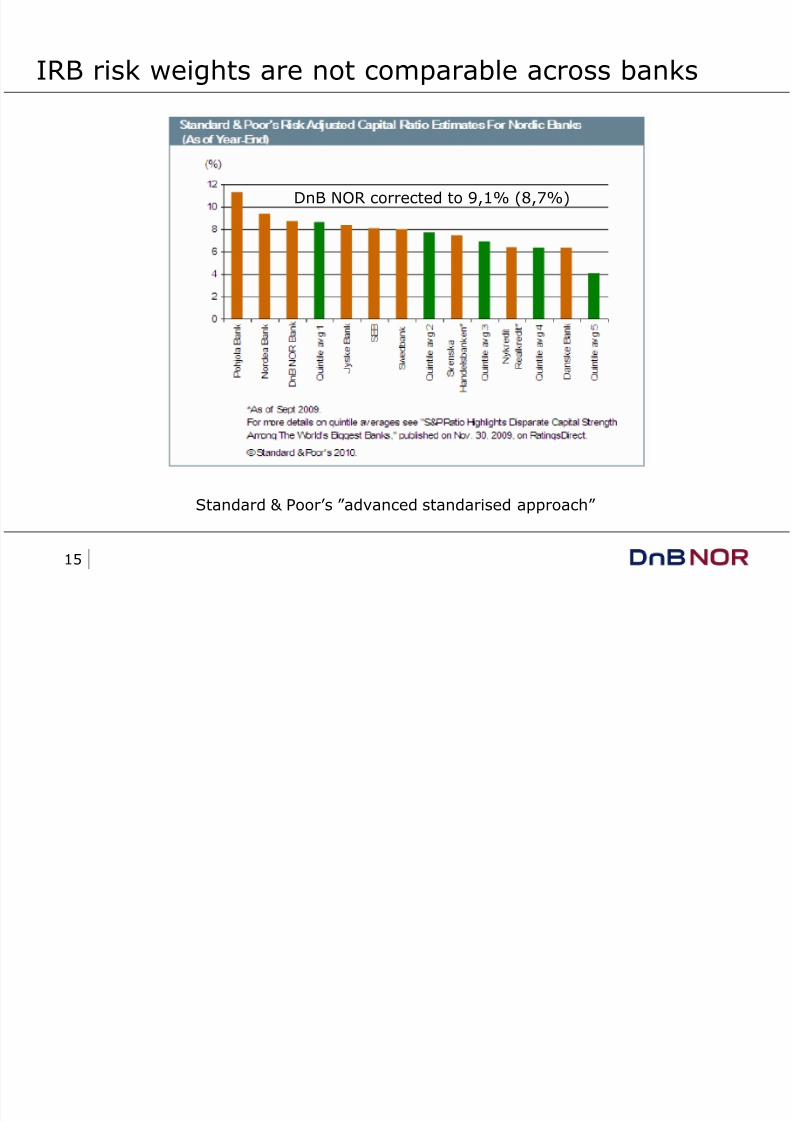
IRB risk weights are not comparable across banks
DnB NOR corrected to 9,1% (8,7%)
Standard & Poor’s ”advanced standarised approach”
8/8/2019 Nordic Bank Seminar Roar Hoff 2010-06-03
http://slidepdf.com/reader/full/nordic-bank-seminar-roar-hoff-2010-06-03 16/25
16
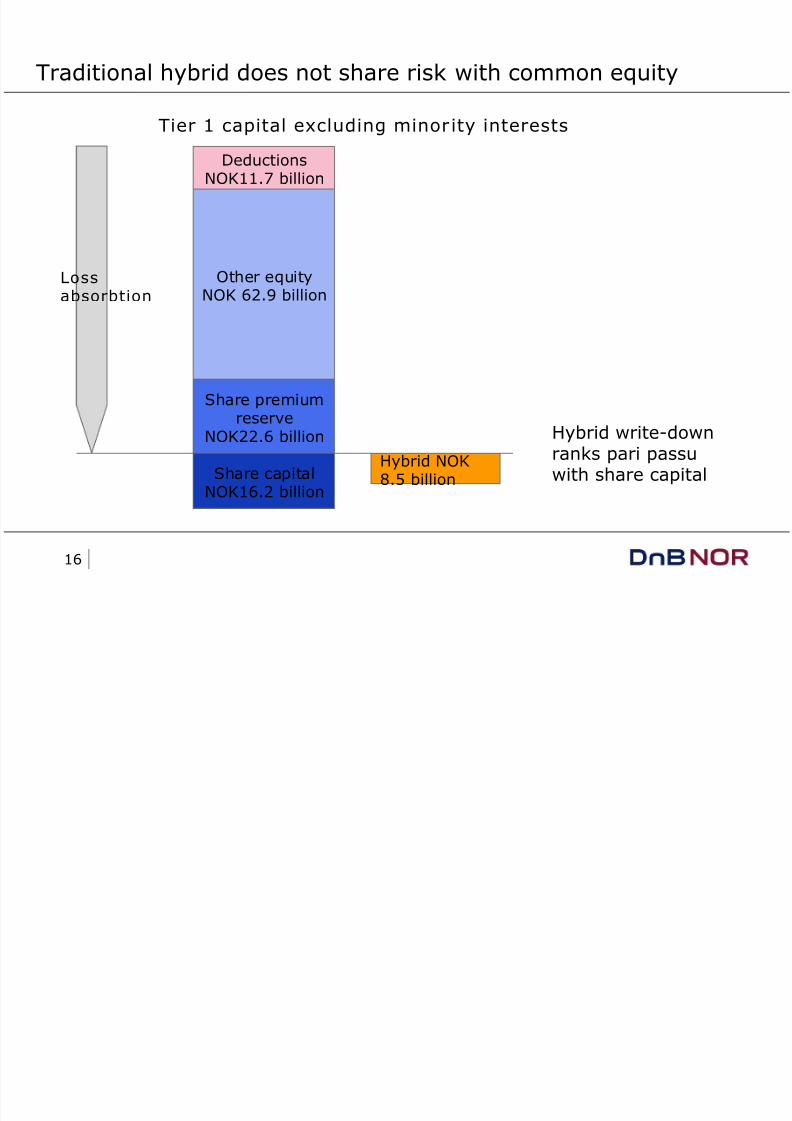
Traditional hybrid does not share risk with common equity
Hybrid write-downranks pari passuwith share capitalShare capital
NOK16.2 billion
Hybrid NOK8.5 billion
Share premium
reserveNOK22.6 billion
Other equityNOK 62.9 billion
DeductionsNOK11.7 billion
Tier 1 capital excluding minor ity interests
Lossabsorbtion
8/8/2019 Nordic Bank Seminar Roar Hoff 2010-06-03
http://slidepdf.com/reader/full/nordic-bank-seminar-roar-hoff-2010-06-03 17/25
17
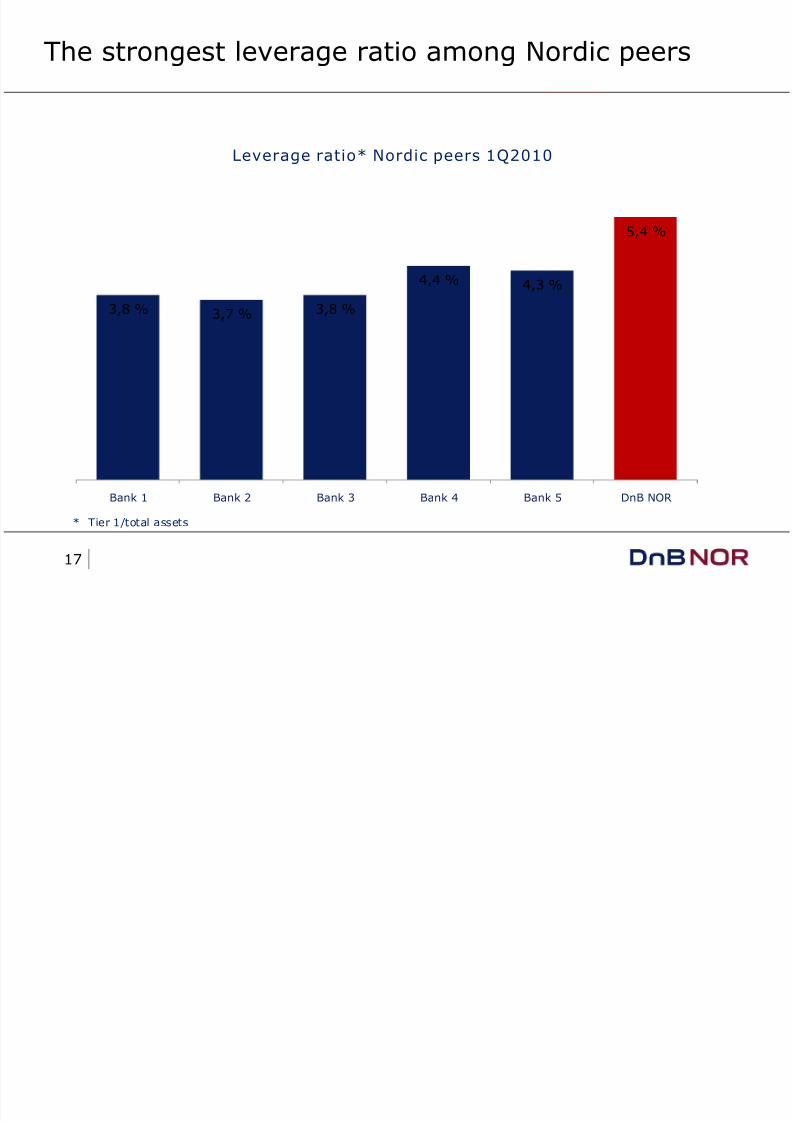
The strongest leverage ratio among Nordic peers
* Tier 1/total assets
Leverage ratio* Nordic peers 1Q2010
3,8 % 3,7 % 3,8 %
4,4 % 4,3 %
5,4 %
Bank 1 Bank 2 Bank 3 Bank 4 Bank 5 DnB NOR
8/8/2019 Nordic Bank Seminar Roar Hoff 2010-06-03
http://slidepdf.com/reader/full/nordic-bank-seminar-roar-hoff-2010-06-03 18/25
18
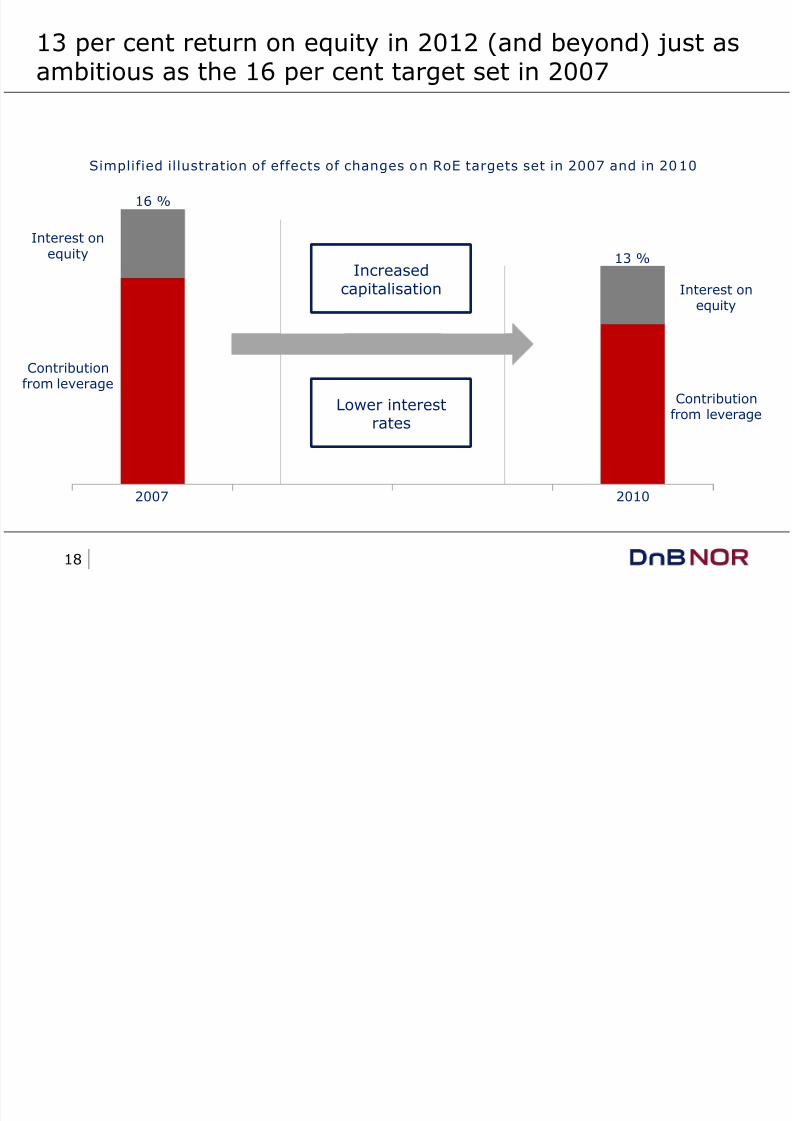
13 per cent return on equity in 2012 (and beyond) just asambitious as the 16 per cent target set in 2007
Interest onequity
Contributionfrom leverage
Interest onequity
Contribution
from leverage
16 %
13 %
Lower interestrates
Increasedcapitalisation
Simplified illustration of effects of changes on RoE targets set in 2007 and in 2010
2007 2010
8/8/2019 Nordic Bank Seminar Roar Hoff 2010-06-03
http://slidepdf.com/reader/full/nordic-bank-seminar-roar-hoff-2010-06-03 19/25
19
Actions ahead of Basel III
8/8/2019 Nordic Bank Seminar Roar Hoff 2010-06-03
http://slidepdf.com/reader/full/nordic-bank-seminar-roar-hoff-2010-06-03 20/25
8/8/2019 Nordic Bank Seminar Roar Hoff 2010-06-03
http://slidepdf.com/reader/full/nordic-bank-seminar-roar-hoff-2010-06-03 21/25
21
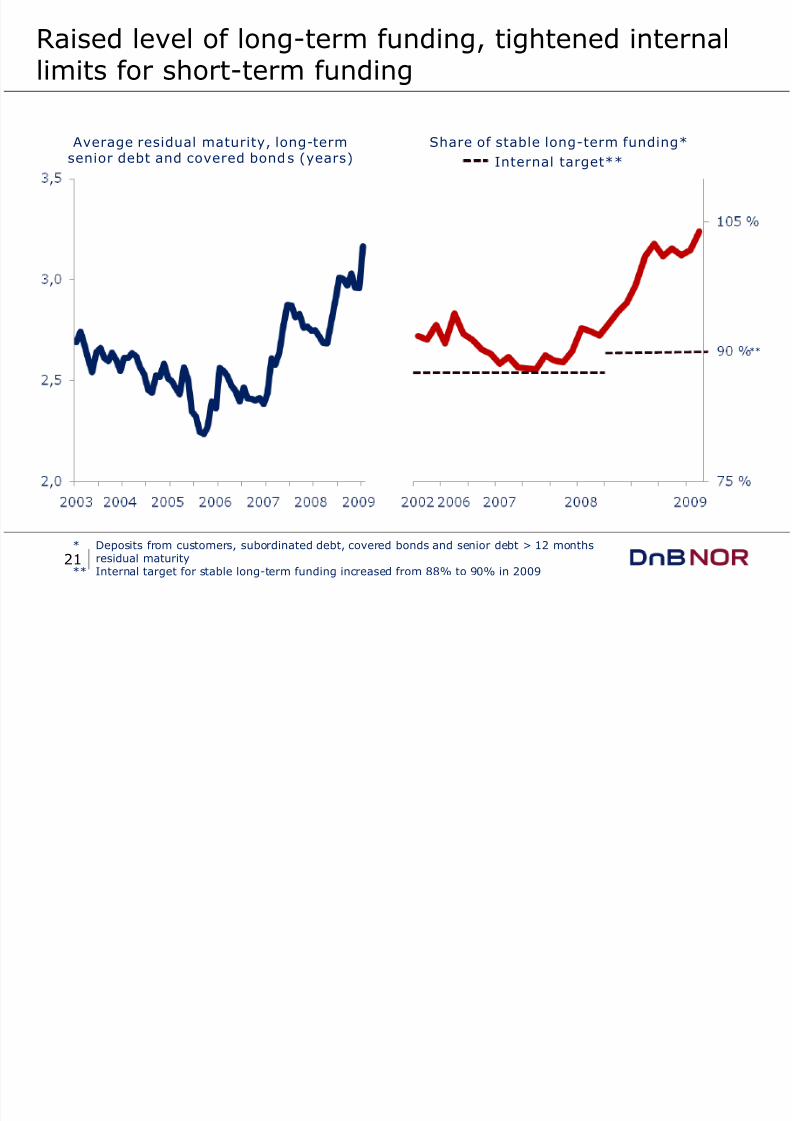
Raised level of long-term funding, tightened internallimits for short-term funding
Share of stable long-term funding*Internal target**
Average residual maturity, long-termsenior debt and covered bonds (years)
* Deposits from customers, subordinated debt, covered bonds and senior debt > 12 months
residual maturity** Internal target for stable long-term funding increased from 88% to 90% in 2009
**
8/8/2019 Nordic Bank Seminar Roar Hoff 2010-06-03
http://slidepdf.com/reader/full/nordic-bank-seminar-roar-hoff-2010-06-03 22/25
22
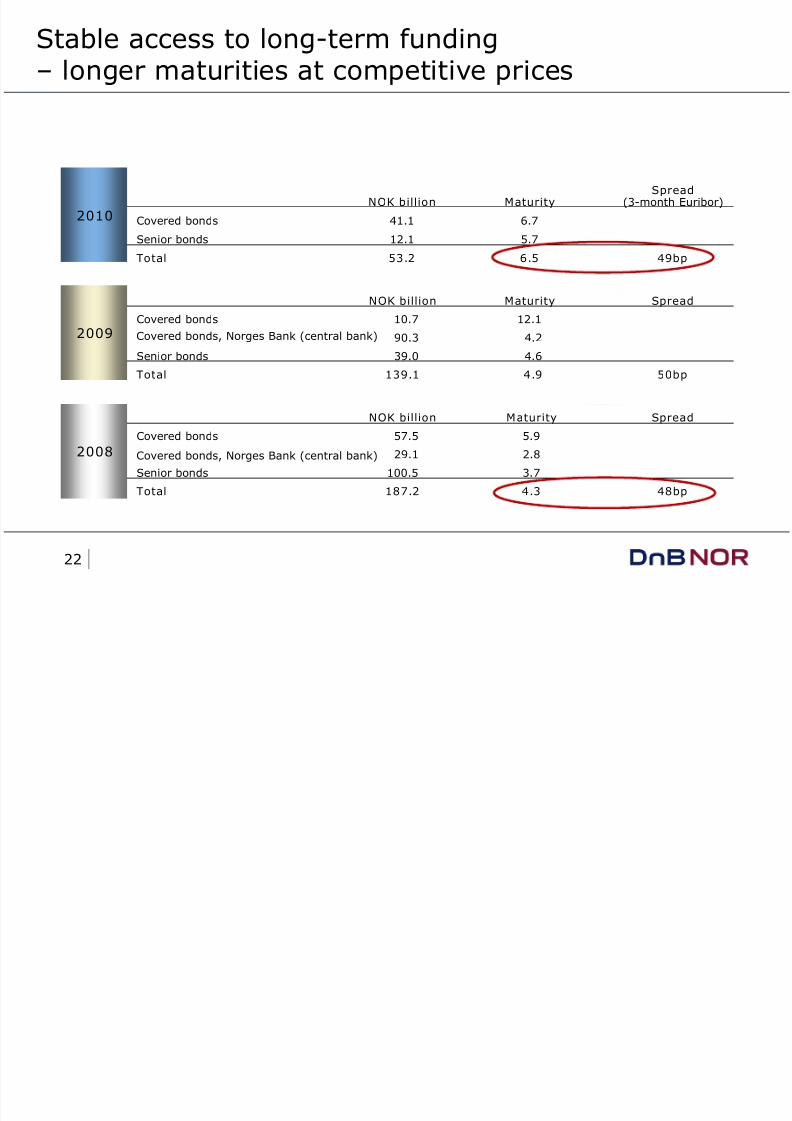
Stable access to long-term funding– longer maturities at competitive prices
NOK billion MaturitySpread
(3-month Euribor)
Covered bonds 41.1 6.7
Senior bonds 12.1 5.7
Total 53.2 6.5 49bp
NOK billion Maturity Spread
Covered bonds 10.7 12.1
Covered bonds, Norges Bank (central bank) 90.3 4.2
Senior bonds 39.0 4.6
Total 139.1 4.9 50bp
NOK billion Maturity Spread
Covered bonds 57.5 5.9
Covered bonds, Norges Bank (central bank) 29.1 2.8
Senior bonds 100.5 3.7
Total 187.2 4.3 48bp
2010
2009
2008

8/8/2019 Nordic Bank Seminar Roar Hoff 2010-06-03
http://slidepdf.com/reader/full/nordic-bank-seminar-roar-hoff-2010-06-03 23/25
23
Further issues
Provide for more selective deposit gathering strategies
Continued focus on long term funding- Increased emphasis on funding diversification by geography and
by instruments (e.g. DnB NOR Næringskreditt)
High attention on Basel III signals- uncertainties on final definitions and calibrations
Controlled balance sheet growth
8/8/2019 Nordic Bank Seminar Roar Hoff 2010-06-03
http://slidepdf.com/reader/full/nordic-bank-seminar-roar-hoff-2010-06-03 24/25
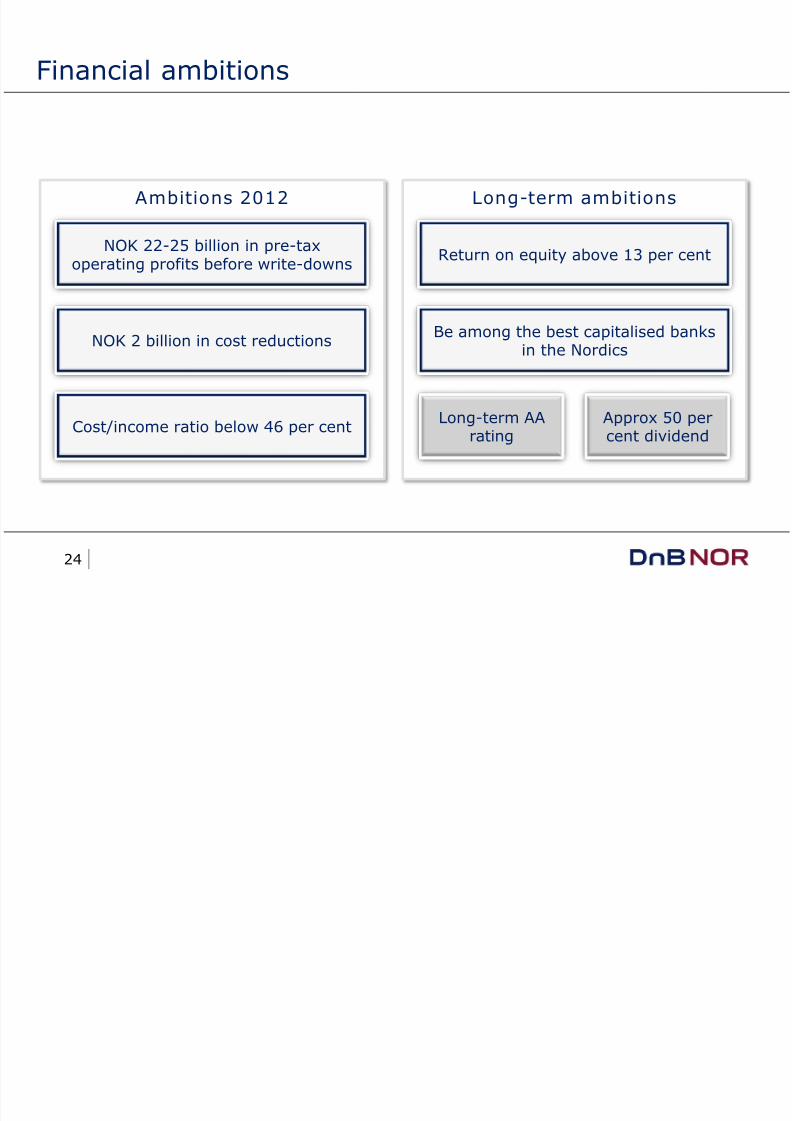
24
Ambitions 2012 Long-term ambitions
Financial ambitions
Be among the best capitalised banksin the Nordics
NOK 2 billion in cost reductions
NOK 22-25 billion in pre-taxoperating profits before write-downs
Cost/income ratio below 46 per cent
Return on equity above 13 per cent
Approx 50 percent dividend
Long-term AArating
8/8/2019 Nordic Bank Seminar Roar Hoff 2010-06-03
http://slidepdf.com/reader/full/nordic-bank-seminar-roar-hoff-2010-06-03 25/25
Thank you