nordex se investor presentation july 2015 · subsidiary established france market share 2014: 10%...
TRANSCRIPT

Hamburg
September, 2015
Nordex SE Investor Presentation

1. Intro and corporate strategy
2. Markets and market success
3. Products and R&D
4. Financials 2014 & outlook
5. Appendix (shareholder structure)
AGENDA
2 Investor Presentation | Nordex SE | September 2015

1. COMPANY PROFILE NORDEX SE
Nordex at a glance Installed capacity (12.1 GW)
Investor Presentation | Nordex SE | September 2015 3
Global manufacturer of wind energy systems
with a focus on turbines in the 2-3 MW class
Most extensive and consistent use of
platform technology in the industry; variants
for different wind and climate conditions
leveraging shared components
Production sites in Germany (Rostock –
blades and nacelles)
Headquartered in Germany (Hamburg) and
USA (Chicago); subsidiaries in more than 20
other countries
Listed company in the German TecDax
Main shareholder Skion/momentum (22.8%),
rest is freefloat
Revenues 2014: EUR 1.74 bn
~3,000 employees as of H1/2015
Track record as of H1/2015:
>6,600 turbines and >12,000 MW in 41
countries worldwide
By region
Germany 23%
Other Europe 60%
Asia 8%
America 7%
Africa 2%
By segment
MMW Class (2.3-3.3 MW)
74%
Mainstream (1.3/1.5 MW) 20%
Small (<1.0 MW) 6%

1. MANAGEMENT STRUCUTURE
4
New structure to increase operational and strategic responsibility of top managers
Lars Bondo Krogsgaard
Bernard Schäferbarthold Board
Executive Committee
Supervisory Board
Board + 7 top managers with ~70
years of experience in wind
Investor Presentation | Nordex SE | September 2015

1. INTRODUCTION TO STRATEGY
5
Strategy implementation: Nearly all targets reached one year earlier
Turnaround (Phase I) successfully managed – “delivered as promised”
Start of Phase II:
Stronger focus on margin improvement
Underlying measures for all main functions defined and partly initiated
Main financial targets 2017:
EBIT 7-8% Positive FCF
Investor Presentation | Nordex SE | September 2015

Phase 1: Reaching critical top-line (Revenues in bn EUR)
Phase 2: Margin improvement (EBIT margin in %)
6
1. CHANGE OF PRIORITIES: FROM STRONG TOP-LINE GROWTH TO FOCUS ON PROFITABILITY
0,9
2012 2014 2011
1.1
1.4
2013
1.7
2015 2017E 2014 2016
1.7
4-5%
7-8% 0.9
Investor Presentation | Nordex SE | September 2015

7
Key strategy areas identified in 2012
Focused sales and service strategy
Improved operational excellence
Reductions in cost of materials
Development of excellent products and launch of Generation Delta
Finalize restructuring
Financial stability
Main Financial targets
CMD 2013
CMD 2014
Current Guidance
Timeframe 2015 2017 2015
Order Intake EUR 1.5bn n/a EUR 2.1 – 2.3bn
Sales EUR 1.5bn EUR 2.0bn EUR 2.0 – 2.2bn
Gross margin 25% 25% 22%-23%
EBIT margin 5% 7-8% 5-6%
CAPEX EUR 60-70m
EUR 50-60m
EUR 60 -65m
W/C ratio <10% <5% <5%
FCF neutral FCF positive FCF positive
1. PHASE I (2012 -2014): OVERVIEW
Investor Presentation | Nordex SE | September 2015
1. MAIN FOCUS AREAS OF THE NEW STRATEGY (PHASE 2)
8
PROFITABLE GROWTH
HIGH VALUE PRODUCTS
PROJECT DRIVEN COMPANY
BUSINESS MODEL EXPANSION
Investor Presentation | Nordex SE | September 2015

1. Corporate Strategy
2. Markets and market success
3. Products and R&D
4. Financials 2014 & outlook
5. Appendix (Shareholder structure)
AGENDA
Investor Presentation | Nordex SE | September 2015 9

2. DIFFERENTIATION PAYS OFF
Doing Things Differently
Broad global market approach
Strong focus on utilities/big IPPs
Onshore and offshore
Narrow scope
Low complexity
Different WTG platforms
~20 focus markets
Strong focus on small/midsized customers
Onshore only
Broad scope
Accept complexity
One competitive product for each wind class
Competitor´s developments
Investor Presentation | Nordex SE | September 2015 10

2. FOCUSED SALES APPROACH LEAD TO DOUBLE DIGIT MARKET SHARES IN MANY FOCUS MARKETS
Currently focused on ~20 countries – onshore market position 2014
Pakistan Market share 2014: 66%
South Africa Market share 2014: 20%
Qualified for 111 MW round 3 Uruguay Market share 2014: 14% Major order of 142 MW
received
Turkey Market share 2014: 20%
Order intake: +67%
Germany Market share 2014: 9%
Order intake:+ 28%
Sweden Market share 2014: 10%
UK Market share 2014: 10%
Order intake: +58%
Ireland Market share 2014: 47%
Chile Subsidiary established
France Market share 2014: 10%
Order intake: +200%
Finland Market share 2014: 40%
Order intake: +52%
EUROPE Market share 2014: 10%
10% 10% GLOBAL Market share 2014: 3%
Order intake: + 17%
Investor Presentation | Nordex SE | September 2015 11

2. ORDER INTAKE
Order intake H1/15 vs. H1/14
(in EUR mn) Order intake by areas H1/15
12
Generation Delta accounts for ~20% of new orders; bestselling WTG N117/2400 (~ 40%)
One third of the OI stems from emerging markets like South Africa, Uruguay and Pakistan
>90% contracted in EUR or USD, rest of projects hedged (natural, forwards/ derivatives)
Investor Presentation | Nordex SE | September 2015
GER
RSA FR
TRK
FIN 909
H1 2015
1,354
H1 2014
+49%
8%
RoW other
25%
6%
Germany
30%
France
EMEA other
Americas
19%
Turkey
12%

2. GROWTH IN NORDEX MARKETS EXPECTED
Order intake 2013 and 2014 by markets (in EUR)
13
Germany Turkey France UK/IRL Finland Lithuania
+28%
+67% +200% +61% +52%
>100%
Highly competitive N117/2400 for low-wind sites
– turbine of the year Focus on small and medium-sized customers;
comprehensive sales and service support Focus on increasing sales in Germany
Past Success Factors
N131/3000 (and N131/3300 for German market) next stage of evolution – turbine of the year
Expand business with existing (loyal) customer base Exploit opportunities with big IPPs / utilities Ability to serve new markets profitably
Future Success Factors
2013
2014
Investor Presentation | Nordex SE | September 2015

2. ORDER BOOK
Development of the firm order book* 2013 – H1 2015 (in EUR mn)
14
EMEA currently accounts for 78% of the firm order book, Americas 15% and Asia 7%
Book-to-bill ratio* improvement to 1.34 (H1 2014: 1.17)
Conditional order back-log at EUR 664 mn (H1 2014: EUR 720 mn; -7.7%)
Investor Presentation | Nordex SE | September 2015
* Turbine business, excluding service
1.769
1.462
1.259
+16%
+21%
H1 2015 FY 2014 FY 2013
1.13 1.17
1.34
Book-to-bill ratio*

4. A CLOSER LOOK AT FRANCE AND GERMANY
Installations France H1:
524 MW onshore
Installations Germany H1:
~1,200 MW onshore
Investor Presentation | Nordex SE | September 2015 15
French market picking up – on the way back to a solid GW market
Market leadership with 28 % in H1 2015 (based on grid-connections; FY 2015: 9.1%)
Strong development pipeline
Gains in market share: 11.8 % (H1 2014: 8.1%; FY 2014: 8.4 %)
German market intact for 2015-17; EEG amendment and details on tender regime expected for late summer
Current focus on selling N131/3000 – ongoing modification of WTG
28%
Nordex
18%
OEM 1
26% OEM 2
6% 6%
OEM 3
OEM 4
16%
OEM 5
12%
Nordex
Others (not discolsed)
88%
Sources: FEE, VDMA
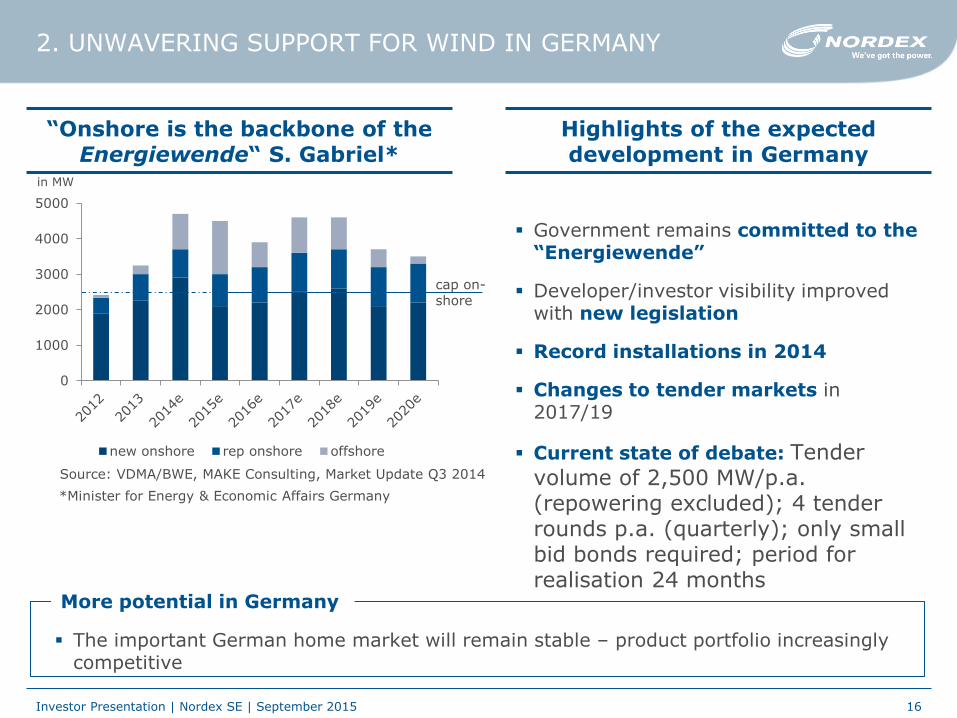
Government remains committed to the “Energiewende”
Developer/investor visibility improved with new legislation
Record installations in 2014
Changes to tender markets in 2017/19
Current state of debate: Tender volume of 2,500 MW/p.a. (repowering excluded); 4 tender rounds p.a. (quarterly); only small bid bonds required; period for realisation 24 months
“Onshore is the backbone of the Energiewende“ S. Gabriel*
Highlights of the expected development in Germany
2. UNWAVERING SUPPORT FOR WIND IN GERMANY
0
1000
2000
3000
4000
5000
new onshore rep onshore offshore
Source: VDMA/BWE, MAKE Consulting, Market Update Q3 2014
More potential in Germany
The important German home market will remain stable – product portfolio increasingly competitive
*Minister for Energy & Economic Affairs Germany
in MW
cap on-shore
Investor Presentation | Nordex SE | September 2015 16

4. DEMAND OUTLOOK IN GW PER REGION
17
Source: MAKE Q3 outlook as of 9/2015
Investor Presentation | Nordex SE | September 2015
2015/2016:
Global onshore growth of ~16 %
expected in 2015. Clean energy
spending still at a high level
2016 dip mainly caused by China
and the US
Through 2020:
Germany: continues on a high level
(~3 GW p.a.)
Northern Europe: Nordex core
markets provide stable foundation
for our business - gains in market
share targeted in various focus
markets
Southern Europe: High demand
for volume in Turkey and France
Eastern Europe: Some recovery in
EMEA East due to new regulations in
Poland
Emerging Markets: Ongoing
growth opportunities in Africa (RSA,
Egypt), Latin America (URU, Chile)
and smaller markets in Asia (PAK
etc.)
611
24
2825
27 28 27
26
11
14
138
9 10
1113
12
12 1313 14
14
544
58
62
2018e
57
2020e
52
2017e
55
52
2016e 2019e
Offshore 2 2
50
EMEA
APAC
2014 2015e
Americas
+4%
1. Corporate Strategy
2. Markets and market success
3. Products and R&D
4. Financials 2014 & Outlook
5. Appendix (Shareholder structure)
AGENDA
18 Investor Presentation | Nordex SE | September 2015

3. HIGHLY COMPETITIVE PRODUCT PORTFOLIO FOR ALL WIND CLASSES
117 m
100 m
90 m
6,0 6,5 7,0 7,5 8,0 8,5 9,0 9,5 10,0
Wind speed [m/s]
IEC 3a IEC 2a IEC 1a
N117/3000
N100/3300
N117/2400
N100/2500
N90/2500
N131/3000*
Rotor-diameter
131 m
Investor Presentation | Nordex SE | September 2015 19
*Introduction of N131/3300 (for German market) on HUSUM Wind fair

3. STATUS N131/3000
20
Update
Installation of the first turbine completed in Janneby, Germany
30 WTGs on order for 2015 projects in Germany and Finland
Successful completion of IEC design evaluation conformity statements (DECS) and DIBt type approvals
Awarded Windpower Monthly‘s „Turbine of the Year“ Award in 3MW+ segment
Hollich Sellen
Wettringen I & II
Kooninkallio-Kankaanpää
Myllykangas II
Janneby
Investor Presentation | Nordex SE | September 2015

1. Corporate Strategy
2. Markets and market success
3. Products and R&D
4. Financials 2014 & Outlook
5. Appendix (Shareholder structure)
AGENDA
21 Investor Presentation | Nordex SE | September 2015

4. HIGHLIGHTS ON FY 2014 …
22
2014 was a very good year
Strong demand in focus markets
Sales + 21%, EBIT + 1.4 ppt to 4.5%, free cash flow of EUR 89m
Order intake + 17%
Successful market launch of the new Generation Delta N131/3000
Implementation of medium-term strategy going according to plan
2015 has started well, positive order momentum continues
2017 sales target may be achieved earlier than previously expected
Investor Presentation | Nordex SE | September 2015

4. ... AND ON H1 2015
23
Nordex in good shape
Good H1 results
Strong increase in revenues and order intake
EBIT margin up to 5.6%
Positive free cash flow
Largest single order in Nordex history so far (Pampa, Uruguay)
Strategic projects on track
Guidance for FY 2015 raised for sales and order intake
Update on strategy and medium-term targets during Capital Markets Day
on 15 October
Investor Presentation | Nordex SE | September 2015

4. BUSINESS PERFORMANCE ALONG THE VALUE CHAIN
Production – Installations - Service
24
Turbine assembly: 1.013 MW (+ 75% yoy) – assembly of turbines for installations in H2
Blade production: 165 blades (- 29% yoy) – extension of facility in Rostock, ramp-up of NR 65.5
Installations: 611.2 MW (-8% yoy) – phasing of projects with a focus in H2
235 turbines installed in 12 countries – main markets Germany, Turkey and France
Service sales: EUR 92 mn (+24% yoy)
Renewal rate: 87% (-10 ppt)
Investor Presentation | Nordex SE | September 2015

4. GROUP INCOME STATEMENT H1 2015
25
In EUR millions
H1 2015 H1 2014 ∆ in %
Sales 1,100.3 815.4 34.9
Total revenues 1,083.8 774.5 39.9
Cost of materials (847.9) (597.7) 41.9
Gross profit 235.9 176.8 33.4
Personnel costs (93.4) (81.0) 15.3
Other operating (expenses)/income (54.6) (40.0) 36.5
EBITDA 87.9 55.8 57.5
Depreciation (26.4) (18.7) 41.2
EBIT 61.5 37.1 65.8
Net financial result (10.3) (12.9) (20.2)
EBT 51.3 24.2 >100
Tax (14.4) (7.7) 87.0
Net profit 36.9 16.5 >100
Sales increase reflects high order backlog and order intake as well as sales of large projects and increased production volume
Net profit increase by 123 % due to higher volume and as a result of lower structural costs, relative to total revenues and optimized financial result
H1 EBIT margin of 5.6 % well in the target range; EBIT margin in Q2 at 6.1 %
Investor Presentation | Nordex SE | September 2015

4. DEVELOPMENT OF GROSS MARGIN AND PRODUCTIVITY
Development of gross margin
Q1 2014 – H1 2015 (in %) Gross profit per employee (in TEUR)
26
Some volatility of gross margin during the year, with 22 – 23 % expected for the full year
Value added measured as gross profit/employee above last year
Investor Presentation | Nordex SE | September 2015
H1 2015
21.8
Q4 2014
27.2
Q3 2014
20.4
Q2 2014
19.8
Q1 2014
24.0
21.5
Q1 2015
Q2 2015
22.8 8481
H1 2015
+5%
H1 2014
Based on sales
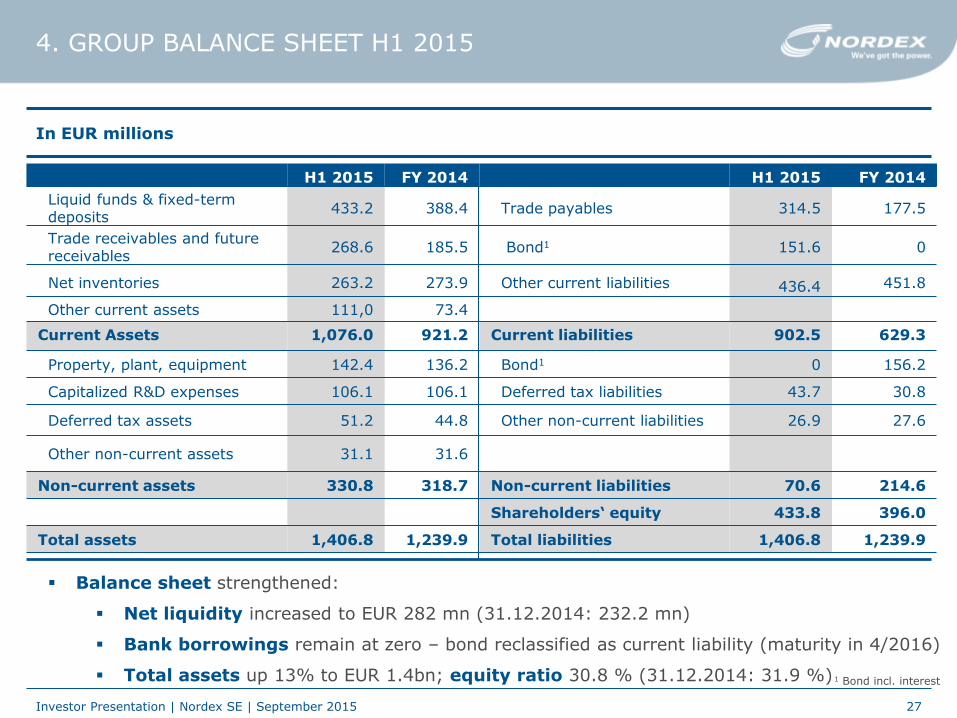
4. GROUP BALANCE SHEET H1 2015
In EUR millions
27
H1 2015 FY 2014 H1 2015 FY 2014
Liquid funds & fixed-term deposits
433.2 388.4 Trade payables 314.5 177.5
Trade receivables and future receivables
268.6 185.5 Bond1 151.6 0
Net inventories 263.2 273.9 Other current liabilities 436.4 451.8
Other current assets 111,0 73.4
Current Assets 1,076.0 921.2 Current liabilities 902.5 629.3
Property, plant, equipment 142.4 136.2 Bond1 0 156.2
Capitalized R&D expenses 106.1 106.1 Deferred tax liabilities 43.7 30.8
Deferred tax assets 51.2 44.8 Other non-current liabilities 26.9 27.6
Other non-current assets 31.1 31.6
Non-current assets 330.8 318.7 Non-current liabilities 70.6 214.6
Shareholders‘ equity 433.8 396.0
Total assets 1,406.8 1,239.9 Total liabilities 1,406.8 1,239.9
Balance sheet strengthened:
Net liquidity increased to EUR 282 mn (31.12.2014: 232.2 mn)
Bank borrowings remain at zero – bond reclassified as current liability (maturity in 4/2016)
Total assets up 13% to EUR 1.4bn; equity ratio 30.8 % (31.12.2014: 31.9 %)
1 Bond incl. interest
Investor Presentation | Nordex SE | September 2015

4. WORKING CAPITAL
Development of working capital 2013 – H1 2015
28
Working capital ratio well below the target (<5%)
Volatility reflects production and installation activity
Continuing stringent working capital management with:
Optimised turnaround and order times
High customer prepayments
Investor Presentation | Nordex SE | September 2015
-2,1
2,2
-4,8
1,0
-3,4 -2,3
-100
-80
-60
-40
-20
0
20
40
-5
-4
-3
-2
-1
0
1
2
3
H1 2015
FY 2013 Q1 2014 H1 2014 Q1 2015 Q3 2014
-1,4
FY 2014
W/C (EUR mn)
W/C ratio

4. OPERATING CASH FLOW AND FREE CASH FLOW
Key figures cash flow statement H1 2015 Key figures cash flow statement H1 2014
Investor Presentation | Nordex SE | September 2015 29
Decreased operating cash flow because of higher operational performance and corresponding increase in trade payables/receivables
Investing activities in H1 2015 mainly for capitalized product development and expansion of the blade center in Rostock – project almost completed
Cash flow from financing activities results from investment in fixed-term deposits
in EUR mn
Cash flow from operating activities
73.4
Cash flow from investing activities
(31.5)
Free cash flow 41.9
Cash flow from financing activities
(-35.0)
in EUR mn
Cash flow from operating activities
91.2
Cash flow from investing activities
(21.2)
Free cash flow 70.0
Cash flow from financing activities
(-152.2)

2014A 2015 old 2015 update
Order intake EUR 1.75 bn EUR 1.8 – 2.0 bn EUR 2.1 – 2.3 bn
Sales EUR 1.73 bn EUR 1.9 – 2.1 bn EUR 2.0 – 2.2 bn
EBIT margin 4.5 % 5 – 6 % 5 – 6 %
Working capital ratio
- 2.3% < 5% <5 %
Investment EUR 76.3 m ~ EUR 50 - 60 m ~EUR 60 – 65 m
4. GUIDANCE 2015
30 Investor Presentation | Nordex SE | September 2015
Guidance update triggered by strong order momentum and increase in activity level
Large installation volume in H2

4. MEDIUM-TERM DIRECTION 2017
31 Investor Presentation | Nordex SE | September 2015
Strong demand
Positive momentum
Solid order book for Nordex
Measures to improve operating efficiency
High growth brings its own challenges
Implementation of operational improvement according to plan, impact not
yet fully reflected in financial results
Strong product pipeline and focused sales strategy to secure future development

1. Corporate Strategy
2. Markets and market success
3. Products and R&D
4. Financials 2014 & outlook
5. Appendix (Shareholder structure)
AGENDA
32 Investor Presentation | Nordex SE | September 2015

5. APPENDIX: SHAREHOLDER STRUCTURE NORDEX SE
33
Based on 80.882.447 shares, as of September 2015
Free float 64.13%
SKion/momentum capital 22.79 %
Investor Presentation | Nordex SE | September 2015
DWS 5,04 %
JPMorgan 5.02 %
Old Mutual 3.02 %

5. APPENDIX: FINANCIAL CALENDAR 2015 AS OF SEPTEMBER 2015
Investor Presentation | Nordex SE | September 2015 34
Date Event
10 September Commerzbank Sector Conference (Frankfurt)
21-22 September Goldman Sachs & Berenberg German Corporate Conference (Munich)
15 October Capital Markets Day (Frankfurt)
31 October Börsentag (retail investors; Hamburg)
12 November Q3 2015 results and analyst call
17-20 November EWEA fair (Paris)
23 November Goldman Sachs Renewables Conference (London)
3 December HSBC Luxembourg Conference
5. DISCLAIMER
35 Investor Presentation | Nordex SE | September 2015
This presentation was produced in August 2015 by Nordex SE solely for use as a source of general information regarding the economic circumstances and status of Nordex SE. It does not constitute an offer for the sale of securities or an invitation to buy or otherwise acquire securities in the Federal Republic of Germany or any other jurisdiction. In particular it is not intended to be an offer, an investment recommendation or a solicitation of an offer to anyone in the U.S., Canada, Japan and Australia or any other jurisdiction. This presentation is confidential. Any reproduction or distribution of this presentation, in whole or in part, without Nordex SE’s prior written consent is expressly prohibited. This presentation contains certain forward-looking statements relating to the business, financial performance and results of Nordex SE and/or the industry in which Nordex SE operates, these statements are generally identified by using phrases such “aim”, “anticipate”, “believe”, “estimate”, “expect”, “forecast”, “guidance”, “intend”, “objective”, “plan”, “predict”, “project”, and “will be” and similar expressions. Although we believe the expectations reflected in such forward-looking statements are based upon reliable assumptions, they are prepared as up-to-date and are subject to revision in the future. We undertake no responsibility to update any forward-looking statement. There is no assurance that our expectations will be attained or that any deviations may not be material. No representation or warranty can be given that the estimates, opinions or assumptions made in, or referenced by, this presentation will prove to be accurate.
THANK YOU FOR YOUR ATTENTION.
36
Nordex SE
Ralf Peters Head of Corporate Communications
Oliver Kayser Senior Manager Investor Relations
Langenhorner Chaussee 600, 22419 Hamburg, Germany
Phone: +49 (0)40 30030 1000
Fax: +49 (0)40 30030 1333
eMail: [email protected]
NDX1
ISIN: DE000A0D6554
WKN: A0D655
www.nordex-online.com
Investor Presentation | Nordex SE | September 2015