investor presentation nordex ag 2 disclaimer this document is made by nordex ag solely for use at...
TRANSCRIPT

Investor PresentationNordex AG
May 2006

Page 2
Disclaimer
This document is made by Nordex AG solely for use at the presentation held to you by Nordex AG in April/May, 2006. It is furnished toyou solely for your information, should not be treated as giving investment advice and may not be copied, distributed or otherwise madeavailable to any other person by any recipient.
The facts and information contained herein are as up to date as is reasonably possible and is subject to revision in the future. NeitherNordex AG nor any of its directors, officers, employees or advisors nor any other person makes any representation or warranty, express orimplied, as to the accuracy or completeness of the information contained in this presentation. Neither Nordex AG nor any of its directors,officers, employees and advisors nor any other person shall have any liability whatsoever for loss howsoever arising, directly or indirectly,from any use of this presentation.
Whilst all reasonable care has been taken to ensure the facts stated herein are accurate and that the opinions contained herein are fairand reasonable, this document is selective in nature and is intended to provide an introduction to, and overview of, the business of NordexAG. Any opinions expressed in this document are subject to change without notice and neither Nordex AG nor any other person is underany obligation to update or keep current the information contained herein. Where any information and statistics are quoted from anyexternal source, such information or statistics should not be interpreted as having been adopted or endorsed by Nordex AG as beingaccurate.
This presentation contains forward-looking statements, which involve risks and uncertainties. These statements may be identified bywords such as “expectation” or “target” or “forecast” and similar expressions, or by their context. These statements are made on the basisof current knowledge and assumptions. Various factors could cause actual future results, performance or events to differ materially fromthose described in these statements. No obligation is assumed to update any forward-looking statements. This presentation does notconstitute an offer or invitation to subscribe for, or purchase, any shares of Nordex AG and neither this document nor anything containedherein shall form the basis of, or be relied upon in connection with, any contract or commitment whatsoever.
This document is not an offer for sale of securities. Securities may not be offered or sold in the United States absent registration or anexemption from registration under the U.S. Securities Act of 1933, as amended. Nordex AG does not intend to register any securities inthe United States or to conduct any public offering of securities in the United States.
Page 3
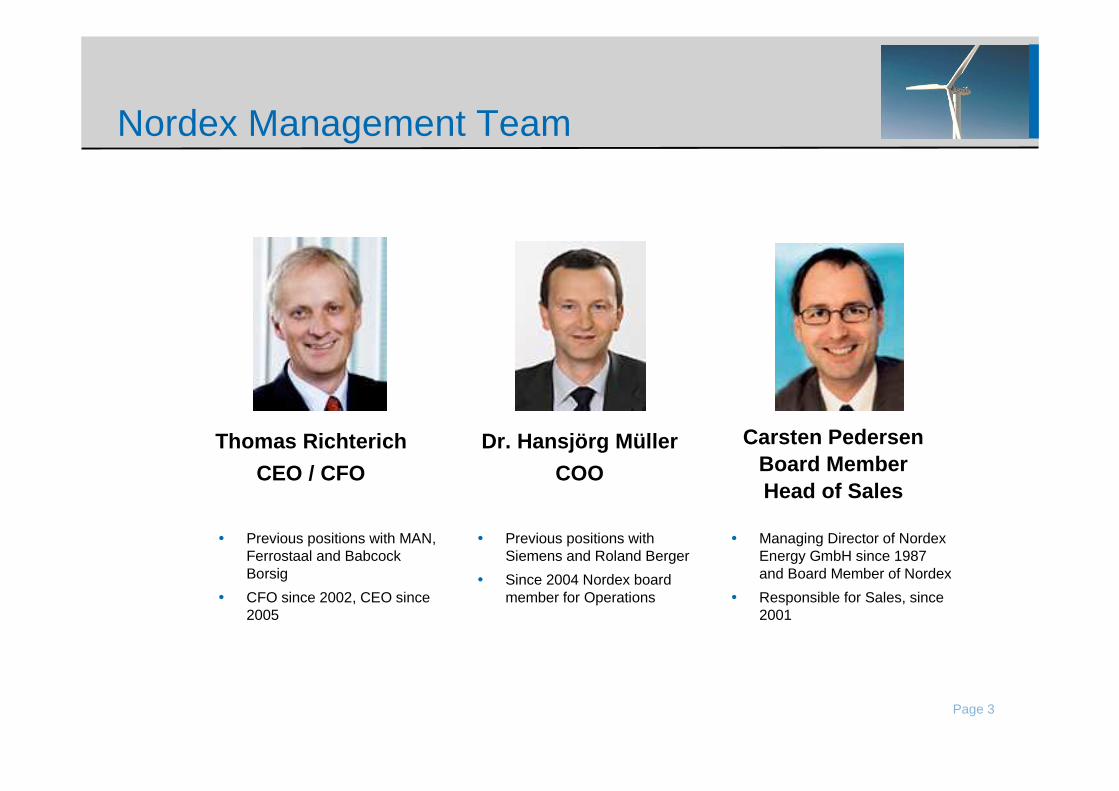
Nordex Management Team
Thomas Richterich
CEO / CFO
Carsten PedersenBoard MemberHead of Sales
Dr. Hansjörg Müller
COO
� Previous positions with MAN,Ferrostaal and BabcockBorsig
� CFO since 2002, CEO since2005
� Managing Director of NordexEnergy GmbH since 1987and Board Member of Nordex
� Responsible for Sales, since2001
� Previous positions withSiemens and Roland Berger
� Since 2004 Nordex boardmember for Operations

Page 4
Nordex at a Glance
� Headquarter: Norderstedt, Germany
� Founded in 1985 in Denmark
� Establishment of production operationsin Germany (1992) and China (1998)
� IPO in 2001
� Global manufacturer of wind energysystems with a focus on turbines in the“MW class”
� 2005 Sales of €309m
� 721 employees
� Main production sites in Rostock (Germany)and Baoding (China)
Installed Base by Geography
Installed Base by Segment
Germany44%
Asia 20%
Africa 4%
America 2%
Other Europe30%
Mainstream(0.75-1.5MW)
51%
“MW Class”(1.5-2.5MW)
43%
Small WTG (<750 kW)6%
Total Base (as of Mar-2006): 2,738

Page 5
Investment Highlights
� Attractive fast growing end-markets
� Well positioned for strong growth
� Technology leader
� Well-positioned across the value chain
� Positioned in high-growth product segments
� International expansion
� Successful completion of turnaround
� Momentum generation & further upside potential
� Strong management team with proven track record

Page 6
Attractive Fast Growing End-Markets:Growing Importance of Wind Energy
4.8 6.1 7.6 10.2 13.9 18.424.9
32.040.3
47.959.3
72.687.6
104.2
124.4
148.8
170.4
193.9
219.5
246.9
276.6
0.1% 0.1% 0.2% 0.2% 0.3% 0.3% 0.4% 0.5% 0.6% 0.7%0.9%
1.1%1.2%
1.4%1.6%
1.9%2.1%
2.4%2.7%
2.9%
0.0
50.0
100.0
150.0
200.0
250.0
300.0
350.0
1995 1996 1997 1998 1999 2000 2001 2002 2003 2004 2005 2006 2007 2008 2009 2010 2011 2012 2013 2014 2015
Tot
al In
stal
led
GW
Europe The Americas Asia-Pacific RoW Wind Powers' Share of Total Power Market
CAGR 1995-2005: 28.6%CAGR 2006E – 2015E: 15.8%
12.012.513.213.814.619.619.419.020.722.423.718.925.828.535.132.437.233.025.827.0% Increase
CAGR
‘05 – ‘10 ‘10 – ‘15
53% 17%
29% 17%
24% 16%
16% 11%
13%20%
Source: BTM

Page 7
Attractive Fast Growing End-Markets:Key Growth Drivers
GrowingEnergy
Consumption
RisingEnergyCosts
FavourableRegulatory
Environment
� World demand for primary energy increased byover 4% in 2004, world petrol demand by 1.5% in2005
� Economic growth in 2006 expected to support oildemand further (+2.2% vs. 2005 in volumeterms)
� IEA estimates worldwide energy demand maydouble from 2002 to 2030
� Oil price more than tripled since 2001, reachingall-time high in spring 2006 with in excess ofUS$70/barrel
� Market forward curve for oil swaps implies pricesat a level of US$70-75 for next three years
� Kyoto protocol supports renewable energy tohelp countries achieve their targets
� Regulatory outlook worldwide positive:
� PTC in US extended until end of 2007; widelyexpected to be extended again
� Supportive new renewable energy law inChina
� European Parliament reiterates position onrenewable energy targets (20% by 2020)
Source: Goldman Sachs Commodity Research, Bundesverband Wind Energie, Merrill Lynch Commodities Research
Demand for wind energy driven by renewables regulat ions, pricecompetitiveness of wind energy and strong worldwide energy demand
Generation Cost in €/MWh
0 50 100 150 200 250
Advanced Nuclear
Conv. Hydro
Geothermal
IGCC - Coal
Wind
Advanced Gas/Oil CC
Biomass
Conv. Gas/Oil CC
Solar Thermal
Photovoltaic
€/MWh

Page 8
Well Positioned for Strong Growth:Technology Leader
Nordex track record of technological innovation
Production ofthe world’s
largest serieswind turbine
(250 kW)
Constructionof the world’s
first seriesMW windturbine
Completion ofthe world’s firstseries of 80mclass 2.5 MWwind turbine
Installation of1st Nordexoffshoreturbine
Launch of serialproduction of90m class 2.5
MW windturbine
Current R&D Initiatives
� New drive train concept withdifferential gearbox(N90/2500)
� Upgrade yaw system
� Upgrade pitch system
� New platform generation
� Modular tower concept incl.standardized mounting parts(S70 & N90)
� Advanced control system(reduced-load operation)
� Redesign of rotor blade NR45(until maturity phase)
� Adoption to international gridcodes
� Development of 100m classturbine
1987 1995 2000 2003 2005

Page 9
Well Positioned for Strong Growth:Well Positioned Across the Value Chain
Wind farm systemplanning
Technicalrealisation
Wind farmoperation
Service andmaintenance
Projectdevelopment
marketingfinancing
� Micrositing of 100%of signed projectsto review customerlayout
� Supportingcustomers (co-development) toreceive necessaryapprovals and tooptimize the parklayout
� Core business:WTG assembly,production ofselected
components, installation on
site, initial operation
� 2200 turbines arecurrently underNordex service
� Full servicecontract offering upto 9+3 yearsduration
� Market leader inFrance (highmargin potential)
� Development offirst commerciallyfinanced project inChina
� Additional serviceoffering:
increasing demanddue to newwind farm investors, which
are only interested in stablecash flow

Page 10
Well Positioned for Strong Growth:Positioned in High-Growth Product Segments
MW-Class (1500 – 2500 kW) is by far the fastest gro wing segment and will bethe market mainstream in the next 5 years
Newly installed MW p.a.11,203
8,1538,3057,417
7,057
0
2,000
4,000
6,000
8,000
10,000
12,000
2001A 2002A 2003A 2004A 2005A
< 750 750 - 1500 1500 - 2500 > 2500
CAGR: 12.2%
CAGR ‘01-’05 by MW class
NM
+39.9%
+13.6%
(35.2)%
Nordex is growing faster than the market and has es tablished a proven technological position in theMW turbine class

Page 11
Nordex Has Grown Faster Than the MarketLeading to Recovery of Market Share
0%
9%
12%
15%
17%
24%
60%
117%
120%
30%
Gamesa
Mitsubishi
Ecotécnia
Vestas
Enercon
Siemens
Repower
Nordex
Suzlon
GE
Market Growth in 2005 Nordex’ World Market Share Recovery in 2005
70
230
500
250
190
300
2002 2003 2004 2005
7% 3% 2% 3% MarketShare
2H
1HWorld Market
Growth40%
Source: BTM 2006
60%
Nor
dex’
New
ly In
stal
led
Cap
acity
in M
W

Page 12
Well Positioned for Strong Growth:International Expansion
China: � Foundation of rotor blade production (4,000 sqm) for N60/1,300 kW in spring 2005
� Foundation of production JV for S70/77 (1,500 kW) in spring 2006
� Foundation of rotor blade production for S70/77 planned for 2006
� Market re-entry in 2006/7
� Upgrading capacities for project development
� 17 new projects developed, construction expected in 2006/7 (total capacity: ~240MW)
� Successful re-entry achieved in 2006 (first major orders signed)
� Successful entry achieved in 2006 (first major order signed)
Country Activity
As of Mar-2006 Nordex has installed 1,543 turbines outside Germany (56% of total installed base)and is further expanding its international operatio ns.
UK:
USA:
France:
Italy:

Page 13
Successful Completion of TurnaroundMonthly Performance Since 2005
(0.9) (0.9)
(1.6) (1.5)
3.1
1.3
1.9
3.1
7.0
1.7
2.6
(0.9)
2.3
0.2
2.2
5.0%5.1%6.1%
11.2%
8.8%6.1%4.8%
(6.3)%
(15.8)%
(6.3)%
(10.5)%
(6.6)%
7.4%1.0%
7.9%
Jan Feb Mar Apr May Jun Jul Aug Sep Oct Nov Dec Jan Feb Mar
EBITDA Margin
Revenues (in €m) EBITDA (in €m)
12.4 12.410.1
14.3 13.7
41.9
19.5
27.023.9
35.9 35.2
62.7
27.8
44.9
52.1
Jan Feb Mar Apr May Jun Jul Aug Sep Oct Nov Dec Jan Feb Mar
May-2005Financial
RestructuringCompleted
2005 2006 2005 2006
May-2005Financial
RestructuringCompleted

Page 14
0
50
100
150
200
250
300
350
400
450
Jan Feb Mar Apr May Jun Jul Aug Sep Oct Nov Dec
Momentum Generation: ContinuouslyIncreasing Order Intake
Order Intake Above Budget in 2005 and 1Q 2006
Q1:€35m
Q1-2:€158m
Q1-3:€280m
Q1-4:€395m
Q1/2006:€263m
20052006
+67%
Germany16%
Order Intake byRegion in 1Q-2006
Rest ofEurope
83%
Asia 1%
Total: €263m
Order Intake byProduct in 1Q-2006
Total: €263m
N80/N9084%
N60/N62 4% Sub-MW 0%
S70/S7712%
2004

Page 15
Further Upside PotentialEBIT Improvement Plan
2%
2%
~10%
1.5-2%
2-3%
1.5-2%
Pos
tR
estr
uctu
ring
Ser
vice
Per
form
ance
Pro
cure
men
t&
Log
istic
s
Tec
hnol
ogy
Oth
ers
Tar
get
EBIT Improvement Plan TargetsEBIT Improvement Plan
� Operative restructuring completed in Mar-2005
� Subsequently EBIT Improvement Planlaunched with a focus on
� Service Performance
� Procurement & Logistics
� Technology
� Aim of the plan is to enable Nordex to achievean attractive sustainable level of profitability inorder to reduce the exposure to externalinfluences, e.g. change of market demand,supply situation, raw material pricing etc.

Page 16
Increase of EBIT Margin Expected Due toImplementation of Improvement Plan
22.8
12.17.7
3.0
70.0
38.6
May
-200
5
Sep
-200
5
Dec
-200
5
Mar
-200
6
Dec
-200
6E
Dec
-200
7E
Examples of Measures
� Development of lighter tower for weak windsites� Steps of implementation:
– Specification– Prototyping– Certification– Implementation in series production
� Duration: approx. 18 months� New supplier for casting parts in China
� Steps of implementation:– Pre-selection– Qualification– Certification– Audit
� Duration: approx. 18 months
Proven track record in implementation of extensive plans
Cumulative Sustainable Cost Savings(in €m)

Page 17
Further Upside Potential:Enhanced Outlook 2006
� Projected revenues secured by order volume:
� 100% of 2006 revenues secured by unconditional orde rs
� Unconditional and conditional orders (> €1bn) secur e workload until end of 2007
� Mid-term annual growth target of 50%
2006E (old) 2006E (new)
Order Intake >€450m ≥€600m
(Y-on-Y) +14% +50%
Revenues >€400m ≥€460m
(Y-on-Y) 30% +50%
EBIT Margin 2.5% ≥3.0%

Page 18
Opportunities for and Limitations of GrowthBeyond Plan
1. Markets � Recovery of market share,target > 5%
� New set-up in 1-2 markets p.a.
� Cautious towards offshore
2. Core components � International supply
� 2-3 supplier strategy
� Production capacity gear boxesand blades
3. Product development capabilities
� Solid 2.5 MW technology
� Scaling up to 4.0 MW
� Above 4.0 MW completelynew design required
4. Production capacities
� Europe: expandable to750 (turbines) / 400 (blades) MW
� Asia: expandable to250 (turbines) / 300 (blades) MW
� North America
� Further investments in Europe andAsia
5. Management & organisation
� Restructuring completed
� Basis for furtherimprovements
� Max. growth path +50% p.a.
6. Financial capabilities
� Set-up for businessvolume with a target of €500-600m
� Working capital requirements
� Investment requirements
LimitationsOpportunities

Page 19
Investment Highlights
� Attractive fast growing end-markets
� Well positioned for strong growth
� Technology leader
� Well-positioned across the value chain
� Positioned in high-growth product segments
� International expansion
� Successful completion of turnaround
� Momentum generation & further upside potential
� Strong management team with proven track record

Page 20
Appendix

Page 21
in %
Source: ARA, WTI, Datastream
Increasing prices of fossil fuels have made wind mo re competitive
Price Development of Fossil Fuels
50
100
150
200
250
Q1/2004 Q2/2004 Q3/2004 Q4/2004 Q1/2005 Q2/2005 Q3/2005 Q4/2005 Q1/2006
Steam Coal ARA $/MT Natural Gas $/MMBTU Crude Oil WTI Spot U$/BBL

Page 22
Market power price was considerably in excess of th e EEG tariff
Spot Market Price in 2005 (EEX)
Jan-2005 Feb-2005 Mar-2005 Apr-2005 May-2005 Jun-2005 Jul-2005 Aug-2005 Sep-2005 Oct-2005 Nov-2005 Dec-2005
Peakload
Baseload
Euro/MWh
EEG max. remuneration (85.9 EUR/MWh)
EEG basic remuneration (53.9 EUR/MWh)
Source: EEX

Page 23
The Nordex Group’s Restructuring Conceptwas based on Five Core Elements
Elements ofrestructuring atNordex Group
Focus on attractive core markets� Concentration on foreign growth
markets
� Improved marketing efficiency
Regaining technical position inupper market segment� Elimination of existing deficiencies
and lowering production costs
� Priority: N80/N90
Elimination of previous organizationalshortcomings� Pragmatic approach to optimize business
processes with immediate activities
� Avoidance of inventory losses andguarantee expenditure
Radical cost-cutting by means ofoperative and structural measures� Creation of a reasonable cost
structure to regain competitiveness
Harnessing liquidity potential byreducing working capital� Creation of a reasonable cost
structure to regain competitiveness
1 2
3
4
5

Page 24
2005 Recapitalisation and CurrentShareholder Structure of Nordex
• Reduction in bank liabilities of €28m
• Issue of 12m new shares
Debt-to-Equity Swap
• Renewal for a further four years in theexisting credit facilities
• €60 million in additional credit facilities
CreditFacilities
• €41.6m
• Capital increase with pre-emptive rightsfor existing shareholders
• All shares from rights not taken up byexisting shareholders purchased byCMP and Goldman Sachs
Cash CapitalIncrease
• Reverse split 10 : 1ShareCapital
CMP35.2%
GoldmanSachs23.1%HypoVereinsbank
5.7%
HSH Nordbank5.0%
Morgan Stanley4.8%
Nordvest4.8%
Freefloat21.4%
Recapitalisation Completed in May 2005 Current Shareholder Structure

Page 25
Product Overview
Nordex N60 1,300kW stall GL1/GL2
Nordex S70/77 1,500kW pitch GL2/IEC 3a
Nordex N80 2,500kW pitch IEC 1a
Nordex N90 2,300kW pitch GL2
Nordex N90 2,500kW pitch IEC 1b (HS)
IEC 2a (LS)
Type Capacity Regulation Certification

Page 26
Production Facilities
8-10 WTG MW-class/week
2 WTG 600 kW-class/week
99 blades/yearYinchuan:S70/77 JV
NR-34/37 120 blades/year
NR-40/45 180 blades/year

Page 27
Income Statement (IFRS)
01-Oct-2003-30-Sep-2004€m
Sales
Total Revenues
Cost of materialsas a percentage of total revenues
Personnel costsas a percentage of total revenues
Depreciation/amortisationas a percentage of total revenues
Other operating income/expensesas a percentage of total revenues
EBIT (operational)
One-off items
Financial result
Tax
Net income/loss
221.6
218.8
(173.3) 79.2%
(34.5)15.8%
(12.1) 5.5%
(24.0)11.0%
(25.5)
(2.5)
(5.1)
0.4
(33.5)
01-Jan-2005-31-Dec-2005
309.0
319.4
(251.3) 78.6%
(34.1) 10.7%
(11.7) 3.7%
(22.1) 6.9%
0.3
(5.4)
(3.0)
0.1
(8.2)
∆∆∆∆
39.4%
46.0%
45.0%
(1.3)%
(3.3)%
(7.9)%
101.2%
(116.0)%
41.4%
75.4%
87.4
100.6
78.0
(0.4)
(0.4)
(1.9)
25.8
(2.9)
2.1
0.3
25.3

Page 28
Balance Sheet (IFRS)
€m 31-Dec-2004 31-Dec-2005 31-Dec-2004 31-Dec-2005
Fixed assets
Current assets
Net inventories
Receivablesand other assets
Liquid funds
Other assets
Total Assets
54.2
106.1
47.5
49.2
9.4
26.1
186.4
Shareholder‘s equity
Provisions
Liabilities
Banks
Trade payables
Other liabilities
Others
Total liabilitiesand equity
2.5
62.1
115.3
37.6
39.8
37.9
6.5
186.4
55.4
150.0
71.1
59.4
19.5
26.0
231.4
63.5
55.8
105.2
7.1
64.1
34.0
6.9
231.4

Page 29
Cash Flow Statement (IFRS)
01-Oct-2003-30-Sep-2004
Net income/loss
Depreciation
Change in provisions
Change in inventories
Change in trade receivables and other assets
Change in trade payables and other liabilities
Other changes from operating activities
Cash flow from operating activities
Cash flow from investing activities
Cash flow from financing activities
Change in liquidity
01-Jan-2005-31-Dec-2005
(8.2)
11.7
(6.3)
(23.5)
(12.6)
18.6
(0.3)
(20.6)
(8.6)
39.0
9.9
(33.5)
12.2
(4.6)
41.8
(6.6)
(8.6)
0.1
0.8
(3.3)
(0.4)
(2.9)
€m

Page 30
Contact
Ralf Peters
Head of Corporate Communication/ InvestorRelations
Phone: +49 (0)40/500 98 522
Fax: +49 (0)40/500 98 333
eMail: [email protected]
Nordex AG
Bornbarch 2
22848 Norderstedt
Germany
www.nordex-online.com

Page 31
Financial Calendar
� Annual general meeting in Rostock May 15, 2006
� Report on the first quarter of 2006 May 30, 2006
� Report on the first half of 2006 August 25, 2006
� Report on the third quarter of 2006 November 23, 2006
� Report on fiscal 2006 April 26, 2007