nonpoint source news-notes - united states … · notes from the states, ... ment that details how...
TRANSCRIPT

Nonpoint Source
News-NotesSeptember 2014, #96
The Condition of the Water-Related Environment The Control of Nonpoint Sources of Water Pollution The Ecological Management & Restoration of Watersheds
Inside this IssueIs this mess considered good news for water quality? Find out on page 10.
Phot
o: J
oey
Hul
ett,
Nat
iona
l Wea
ther
Ser
vice
Special Focus Issue: The Role of Forests in Environmental Protection .................................1Increasing Sustainability through Agroforestry ......................................................... 1Investing in Forests as a Low-Cost Option to Ensure Clean Water ........................... 3Reducing Sediment in Runoff through Reforestation ............................................... 5Forest Service Rule Ensures Efficient Restoration Efforts .......................................... 6Clean Air Act Improves Water Quality in Forested Watersheds ................................. 6
Notes From The States, Tribes and Localities ........................................7Water Quality Trading Project Underway in the Ohio River Basin ........................... 7A Tale of Two Watersheds: the Good, the Bad, and the Ugly .................................. 10Regional Turf Fertilizer Guidelines Encourage Efficiency and Effectiveness ............ 12
Notes On Green Stormwater Infrastructure .........................................14Guide Helps Communities Manage Stormwater and Wastewater with Green
Infrastructure ..................................................................................................... 14Study Quantifies Green Infrastructure Benefits for Stormwater Control ................. 15
Notes On Agriculture .............................................................................17Using Cover Crops in a System of Conservation Practices Improves Water
Quality ............................................................................................................... 17
Reviews and Announcements ...............................................................18Agricultural Nonpoint Source Pollution ................................................................. 18
Collaboration Toolkit Helps You Work with Conservation Districts ................. 18Climate Change ..................................................................................................... 19
Gulf Coast Community Handbook Released .................................................... 19Handbook on Legal Tools to Limit Risks of Climate Change for Coastal
Communities Available .................................................................................. 19
USDA Hubs Help Address the Impacts of a Changing Climate ........................ 19Data Resources ....................................................................................................... 19
“How’s My Waterway” App Now More User-Friendly ...................................... 19NASA Brings Earth Science Data to the Cloud with Amazon Web Services ...... 20New USGS Resources Support the Development of Nutrient Policies .............. 20
Forestry .................................................................................................................. 20Global Forest Watch: Dynamic New Platform to Protect Forests Worldwide .... 20
Stormwater ............................................................................................................. 20Fact Sheet Highlights Green Infrastructure and Community Resiliency ........... 20NEMO Offers Guide for Impervious Cover-Based Total Maximum Daily Loads ... 21Paper Offers Lessons Learned for Sustainable Small Communities ................... 21
Wetlands ................................................................................................................ 21Paper Provides Guidance on Wetland Mitigation Banking Risks ....................... 21Proposed Rule Clarifies Federal Protection for Nation’s Streams and Wetlands .. 21Report Shows Wetlands Restoration Benefits Climate ....................................... 22Wetlands One-Stop Mapping Tool Available ..................................................... 22
Other ..................................................................................................................... 22Catalog of Federal Funding Sources for Watershed Protection Updated ............ 22Ecosystem Valuation Toolkit Available Online ................................................. 22EPA Finalizes Rule to Protect Aquatic Life from Cooling Water Intakes .......... 23EPA Recognizes Seven Communities for Smart Growth Achievement .............. 23Report Explores Riparian Buffer Success Stories ................................................ 23USGS Report Reveals Gaps in Streamflow Information .................................... 23
Recent and Relevant Periodical Articles ..............................................24
Websites Worth A Bookmark .................................................................24
Calendar ..................................................................................................25
Subscribe to the News-Notes electronic notification service and we will notify you by email when each new issue (in PDF format) becomes available. Instructions are available at www.epa.gov/newsnotes.
Special Focus Issue: The Role of Forests in Environmental Protection
Increasing Sustainability through AgroforestryThe U.S. Department of Agriculture (USDA) is reaching out to producers and the public in an effort to raise awareness of agroforestry, a management approach that intentionally com-bines agriculture and forestry to create more sustainable land use systems. In 2011 USDA issued an Agroforestry Strategic Framework for fiscal years 2011–2016, which outlines the agency’s plans to increase awareness and support for agrofor-estry, identify research needs, expand on-the-ground applica-tion of agroforestry practices, and establish a USDA agrofor-estry steering committee to coordinate activities of the Forest Service, Natural Resources Conservation Service, Agricultural Research Service, National Institute of Food and Agriculture, and Farm Service Agency.

2 NONPOINT SOURCE NEWS-NOTES SEPTEMBER 2014, ISSUE #96
What is Agroforestry?Agroforestry is the intentional mixing of trees and shrubs into crop and animal production systems to create environmental, economic, and social benefits. Examples include:
• Silvopasture combines trees with livestock and their pasture. The trees provide timber, fruit, or nuts, as well as shade and shelter for livestock. Silvopastures reduce stress on the animals from the hot summer sun, cold winter winds, or drenching downpours, and increase produc-tion of grasses and other forage for the animals.
• Alley cropping is the process of planting crops between rows of trees to provide income while the trees mature. The system can be designed to produce fruits, vegetables, grains, flow-ers, herbs, bioenergy feedstocks, and more.
• Forest farming occurs where producers grow food, botanical, or decorative crops under a forest canopy that is managed to provide ideal shade levels, and perhaps nuts or timber products. Forest farming is also called multistory cropping.
• Windbreaks shelter crops, animals, buildings, and soil from wind, snow, dust, and odors. These areas can also support wildlife and provide another source of income. They are also known as shelterbelts, hedgerows, or living snow fences.
• Riparian forest buf-fers are natural or re-established areas of trees, shrubs, and grasses that grow along rivers and streams. These buffers can help filter farm runoff while the roots stabilize the banks of streams, rivers, lakes, and ponds to prevent erosion. These areas can also support wildlife habitat connectivity and potentially provide additional income if planted with food, bioenergy, or other crops.
A multi-row windbreak in central Iowa protects the farmstead from wind and dust while offering wildlife habitat and potential economic benefits from nut trees and berry bushes. Photo by USDA
The Untapped Potential of AgroforestryBetween 2008 and 2012, USDA assisted landowners financially and with technical guidance to establish roughly 336,000 acres of windbreaks, riparian forest buffers, and alley cropping; about 2,000 acres of silvopasture; and about 500 acres of forest farming. Those acres represent less than 1 percent of the potentially suitable land for applying those practices, suggesting there is an oppor-tunity to significantly expand the application of agroforestry in the United States. Because many farmers likely implement agroforestry practices without assistance, the USDA added a question in the 2012 Census of Agriculture about whether producers practice alley cropping or silvopasture. The final results of the survey showed that 2,725 farmers reported engaging in one or both of these practices. The census information will help the USDA and its state and local partners identify potential barriers to adoption, benchmark progress, and focus resources over the years to come.
As part of its ongoing effort to educate others about the untapped potential of agroforestry, eight departments within USDA collaborated to publish Agroforestry: USDA Reports to America, a docu-ment that details how the agency is leading the effort to expand the adoption of agroforestry across the country. This 20-page, color report describes agroforestry in an easy-to-understand format and offers detailed case studies of American agroforestry in action from coast to coast. In one example, a Georgia landowner who incorporated livestock grazing around his loblolly pine trees was able
Increasing Sustainability
through Agroforestry(continued)

SEPTEMBER 2014, ISSUE #96 NONPOINT SOURCE NEWS-NOTES 3
to reduce the need for chemical weed control while providing free fertilizer for the trees. In Washington State a landowner worked with the nonprofit Northwest Natural Resource Group to restore a riparian buffer using trees and shrubs that could be harvested for nuts, berries, and garland-quality greenery.
“Our goal is and always has been to help landowners understand that trees—and other permanent vegetation—planted in the right place for the right reason, will add value to their lands,” said Wayne Honeycutt, USDA Natural Resources Conservation Service Deputy Chief for Science and Technology, who chairs USDA’s Agroforestry Executive Steering Committee. “Through the report, we are able to show landowner successes. In some cases, family farms have been saved and woodlands spared from development. We hope by showing these stories, more landowners will see the potential for their operations.”
A new USDA report highlights agroforestry and its beneficial application across the nation.
More information about agroforestry is available from the USDA National Agroforestry Center and the University of Missouri’s Center for Agroforestry.
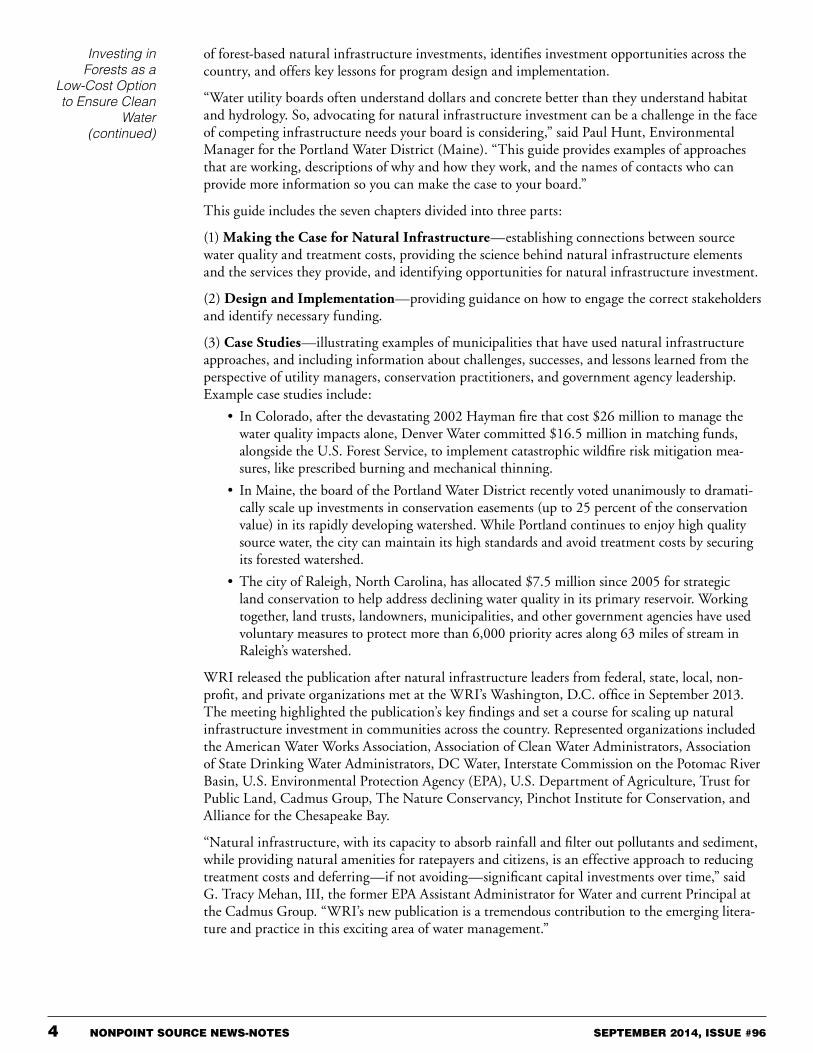
Investing in Forests as a Low-Cost Option to Ensure Clean WaterCities and towns across the United States are facing growing water challenges. Aging water infra-structure, increasing water demand, continued land use change, and extreme weather events are driving up the costs of water management. Water challenges strain public budgets, limit produc-tive economic development, and threaten public health. Resolving these issues is essential for community health and well-being across the United States. To that end, a group of 56 water experts col-laborated on a new guidance document to help U.S. water resource managers expand the availability of clean water through the conservation and restoration of forests and other natural infrastructure. The 2013 publication, Natural Infrastructure: Investing in Forested Landscapes for Source Water Protection in the United States, builds on several innovative efforts across the United States and provides real world examples where water managers are saving money by investing in natural infrastructure.
“Natural infrastructure has long been recognized by state drinking water administrators as a powerful and sustainable approach for protecting sources of drink-ing water and thereby, public health,” said Jim Taft, Executive Director of the Association of State Drinking Water Administrators. “This guide will be of consider-able value to states by providing comprehensive infor-mation about innovative tools that will help bring the use of natural infrastructure approaches to scale.”
Water experts across the United States collaborated to develop this document, which promotes investment in forested landscape as a means to protect source water supplies.
Promoting Forest-Based Natural Infrastructure to Save Water Costs Developed by the World Resources Institute (WRI), in collaboration with Earth Economics and Manomet Center for Conservation Sciences, the publication outlines the economics and science
Increasing Sustainability
through Agroforestry(continued)
4 NONPOINT SOURCE NEWS-NOTES SEPTEMBER 2014, ISSUE #96
of forest-based natural infrastructure investments, identifies investment opportunities across the country, and offers key lessons for program design and implementation.
“Water utility boards often understand dollars and concrete better than they understand habitat and hydrology. So, advocating for natural infrastructure investment can be a challenge in the face of competing infrastructure needs your board is considering,” said Paul Hunt, Environmental Manager for the Portland Water District (Maine). “This guide provides examples of approaches that are working, descriptions of why and how they work, and the names of contacts who can provide more information so you can make the case to your board.”
This guide includes the seven chapters divided into three parts:
(1) Making the Case for Natural Infrastructure—establishing connections between source water quality and treatment costs, providing the science behind natural infrastructure elements and the services they provide, and identifying opportunities for natural infrastructure investment.
(2) Design and Implementation—providing guidance on how to engage the correct stakeholders and identify necessary funding.
(3) Case Studies—illustrating examples of municipalities that have used natural infrastructure approaches, and including information about challenges, successes, and lessons learned from the perspective of utility managers, conservation practitioners, and government agency leadership. Example case studies include:
• In Colorado, after the devastating 2002 Hayman fire that cost $26 million to manage the water quality impacts alone, Denver Water committed $16.5 million in matching funds, alongside the U.S. Forest Service, to implement catastrophic wildfire risk mitigation mea-sures, like prescribed burning and mechanical thinning.
• In Maine, the board of the Portland Water District recently voted unanimously to dramati-cally scale up investments in conservation easements (up to 25 percent of the conservation value) in its rapidly developing watershed. While Portland continues to enjoy high quality source water, the city can maintain its high standards and avoid treatment costs by securing its forested watershed.
• The city of Raleigh, North Carolina, has allocated $7.5 million since 2005 for strategic land conservation to help address declining water quality in its primary reservoir. Working together, land trusts, landowners, municipalities, and other government agencies have used voluntary measures to protect more than 6,000 priority acres along 63 miles of stream in Raleigh’s watershed.
WRI released the publication after natural infrastructure leaders from federal, state, local, non-profit, and private organizations met at the WRI’s Washington, D.C. office in September 2013. The meeting highlighted the publication’s key findings and set a course for scaling up natural infrastructure investment in communities across the country. Represented organizations included the American Water Works Association, Association of Clean Water Administrators, Association of State Drinking Water Administrators, DC Water, Interstate Commission on the Potomac River Basin, U.S. Environmental Protection Agency (EPA), U.S. Department of Agriculture, Trust for Public Land, Cadmus Group, The Nature Conservancy, Pinchot Institute for Conservation, and Alliance for the Chesapeake Bay.
“Natural infrastructure, with its capacity to absorb rainfall and filter out pollutants and sediment, while providing natural amenities for ratepayers and citizens, is an effective approach to reducing treatment costs and deferring—if not avoiding—significant capital investments over time,” said G. Tracy Mehan, III, the former EPA Assistant Administrator for Water and current Principal at the Cadmus Group. “WRI’s new publication is a tremendous contribution to the emerging litera-ture and practice in this exciting area of water management.”
Investing in Forests as a
Low-Cost Option to Ensure Clean
Water (continued)
SEPTEMBER 2014, ISSUE #96 NONPOINT SOURCE NEWS-NOTES 5
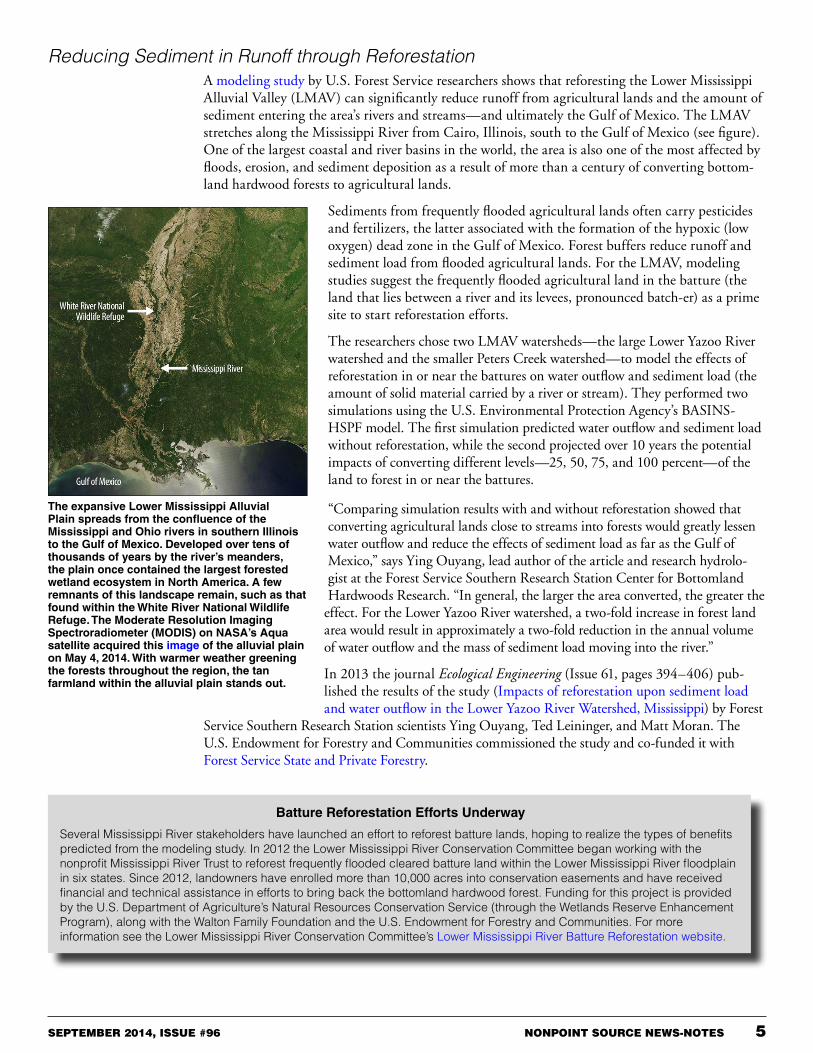
Reducing Sediment in Runoff through ReforestationA modeling study by U.S. Forest Service researchers shows that reforesting the Lower Mississippi Alluvial Valley (LMAV) can significantly reduce runoff from agricultural lands and the amount of sediment entering the area’s rivers and streams—and ultimately the Gulf of Mexico. The LMAV stretches along the Mississippi River from Cairo, Illinois, south to the Gulf of Mexico (see figure). One of the largest coastal and river basins in the world, the area is also one of the most affected by floods, erosion, and sediment deposition as a result of more than a century of converting bottom-land hardwood forests to agricultural lands.
Sediments from frequently flooded agricultural lands often carry pesticides and fertilizers, the latter associated with the formation of the hypoxic (low oxygen) dead zone in the Gulf of Mexico. Forest buffers reduce runoff and sediment load from flooded agricultural lands. For the LMAV, modeling studies suggest the frequently flooded agricultural land in the batture (the land that lies between a river and its levees, pronounced batch-er) as a prime site to start reforestation efforts.
The researchers chose two LMAV watersheds—the large Lower Yazoo River watershed and the smaller Peters Creek watershed—to model the effects of reforestation in or near the battures on water outflow and sediment load (the amount of solid material carried by a river or stream). They performed two simulations using the U.S. Environmental Protection Agency’s BASINS-HSPF model. The first simulation predicted water outflow and sediment load without reforestation, while the second projected over 10 years the potential impacts of converting different levels—25, 50, 75, and 100 percent—of the land to forest in or near the battures.
“Comparing simulation results with and without reforestation showed that converting agricultural lands close to streams into forests would greatly lessen water outflow and reduce the effects of sediment load as far as the Gulf of Mexico,” says Ying Ouyang, lead author of the article and research hydrolo-gist at the Forest Service Southern Research Station Center for Bottomland Hardwoods Research. “In general, the larger the area converted, the greater the
effect. For the Lower Yazoo River watershed, a two-fold increase in forest land area would result in approximately a two-fold reduction in the annual volume of water outflow and the mass of sediment load moving into the river.”
In 2013 the journal Ecological Engineering (Issue 61, pages 394–406) pub-lished the results of the study (Impacts of reforestation upon sediment load and water outflow in the Lower Yazoo River Watershed, Mississippi) by Forest
Service Southern Research Station scientists Ying Ouyang, Ted Leininger, and Matt Moran. The U.S. Endowment for Forestry and Communities commissioned the study and co-funded it with Forest Service State and Private Forestry.
The expansive Lower Mississippi Alluvial Plain spreads from the confluence of the Mississippi and Ohio rivers in southern Illinois to the Gulf of Mexico. Developed over tens of thousands of years by the river’s meanders, the plain once contained the largest forested wetland ecosystem in North America. A few remnants of this landscape remain, such as that found within the White River National Wildlife Refuge. The Moderate Resolution Imaging Spectroradiometer (MODIS) on NASA’s Aqua satellite acquired this image of the alluvial plain on May 4, 2014. With warmer weather greening the forests throughout the region, the tan farmland within the alluvial plain stands out.
Batture Reforestation Efforts Underway
Several Mississippi River stakeholders have launched an effort to reforest batture lands, hoping to realize the types of benefits predicted from the modeling study. In 2012 the Lower Mississippi River Conservation Committee began working with the nonprofit Mississippi River Trust to reforest frequently flooded cleared batture land within the Lower Mississippi River floodplain in six states. Since 2012, landowners have enrolled more than 10,000 acres into conservation easements and have received financial and technical assistance in efforts to bring back the bottomland hardwood forest. Funding for this project is provided by the U.S. Department of Agriculture’s Natural Resources Conservation Service (through the Wetlands Reserve Enhancement Program), along with the Walton Family Foundation and the U.S. Endowment for Forestry and Communities. For more information see the Lower Mississippi River Conservation Committee’s Lower Mississippi River Batture Reforestation website.

6 NONPOINT SOURCE NEWS-NOTES SEPTEMBER 2014, ISSUE #96
Forest Service Rule Ensures Efficient Restoration EffortsIn September 2013 the U.S. Forest Service published a final rule aimed at speeding the pace of restoration efforts and stimulating rural economies by creating jobs. The rule accomplishes this by establishing more efficient processes and revising its procedures regarding categorical exclusions for soil and water restoration activities under the National Environmental Policy Act (NEPA). The rule creates three NEPA categorical exclusions that will be used when restoring uplands, wetlands, floodplains, and riparian systems to their natural conditions by removing levees and other struc-tures, removing debris and sediment following disturbance events, and restoring lands occupied by roads and trails.
“This rule will help us improve the resiliency, health, and diversity of our forests and grasslands,” said U.S. Forest Service Chief Tom Tidwell. “We will now be able to move forward with our part-ners to focus more energy on action, and less on paperwork, to restore more acres in less time.”
Why is the Rule Needed?The Forest Service prepares approximately 2,000 to 2,500 categorical exclusions and 400 environ-mental assessments each year. Document preparation and review for categorical exclusions nor-mally take one-third less time than for a typical environmental assessment, which can be hundreds of pages long. The use of categorical exclusions allows the Forest Service to reduce the resources spent analyzing proposals for projects that will not have potentially significant environmental impacts, and instead focus its resources on proposals that might.
The Forest Service establishes categorical exclusions based, in part, on its experience implementing similar actions, the experience of other agencies, and information provided by the public. By using these categorical exclusions, the Forest Service will be able to move more efficiently through the environmental review process—analyzing and documenting the potential environmental effects of soil and water restoration projects—without reducing public involvement or sacrificing environ-mental protection. The three new categorical exclusions provided under NEPA are:
• Category 18 allows the restoration of wetlands, streams, and riparian areas by removing, replacing, or modifying water control structures (e.g., dams, levees, dikes, drainage tiles, ditches, culverts, pipes, valves, gates, and fencing) to allow waters to flow into natural chan-nels and floodplains.
• Category 19 allows for the removal of debris and sediment following disturbance events (e.g., floods, hurricanes, tornados, or mechanical or engineering failures) to restore uplands, wetlands, or riparian systems to pre-disturbance conditions, to the extent practicable (i.e., where site conditions will not impede or negatively alter natural processes).
• Category 20 allows for implementing restoration activities that restore, rehabilitate, or stabilize lands occupied by roads and trails (excluding National Forest System roads and trails) to a more natural condition by removing, replacing, or modifying drainage structures and ditches, reestablishing vegetation, reshaping natural contours and slopes, reestablishing drainageways, or other activities that will restore site productivity and reduce environmental impacts.
For more information about the categorical exclusions for soil and water resources and the imple-mentation of NEPA on national forest lands, see the Forest Service’s NEPA website.
Clean Air Act Improves Water Quality in Forested WatershedsA 23-year-long study shows that the reduction of pollution emissions from power plants in the mid-Atlantic is improving water quality in the Chesapeake Bay watershed. The study by scientists at the University of Maryland Center for Environmental Science confirms that as the amount of emissions of nitrogen oxide from coal-fired power plants declined in response to the Clean Air Act, the amount of nitrogen pollution found in the waterways of forested areas in Pennsylvania, Maryland, and Virginia fell as well.
SEPTEMBER 2014, ISSUE #96 NONPOINT SOURCE NEWS-NOTES 7
“When we set out to reduce nitrogen pollution to the Chesapeake Bay, deposition of nitrogen resulting from air pollution on the watershed was considered uncontrollable,” said Donald Boesch, president of the University of Maryland Center for Environmental Science. “This study shows that improvements in air quality provided benefits to water quality that we were not counting on.”
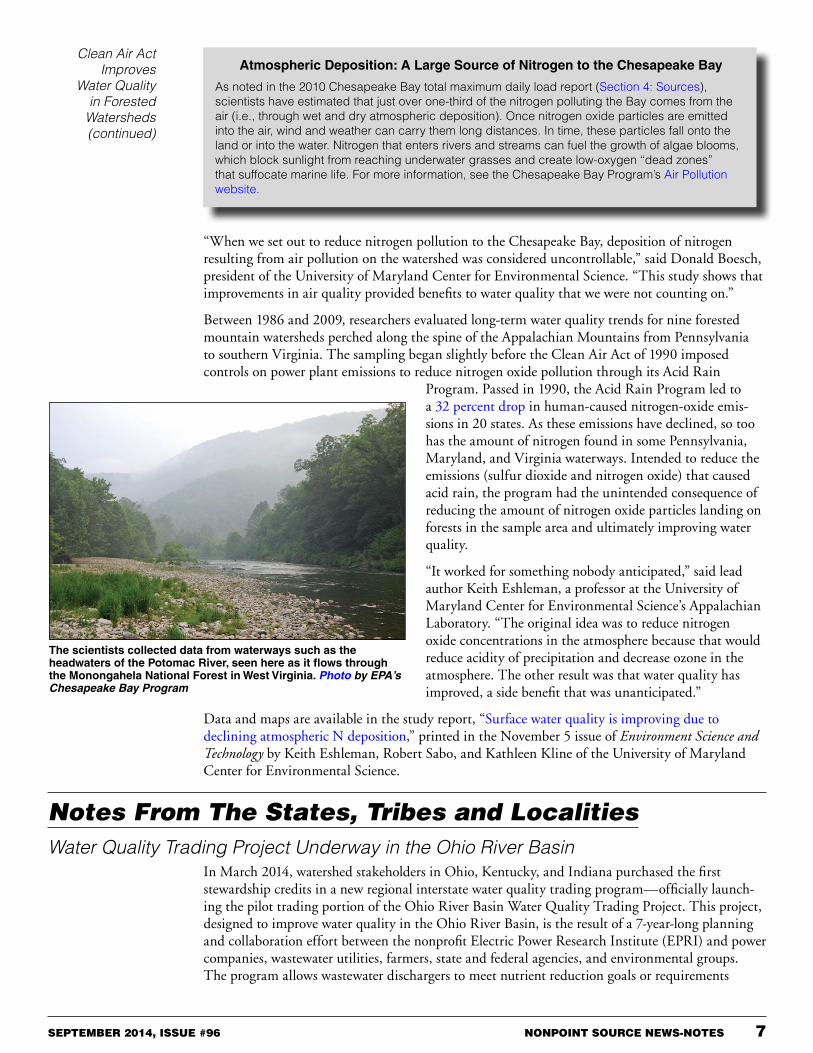
Between 1986 and 2009, researchers evaluated long-term water quality trends for nine forested mountain watersheds perched along the spine of the Appalachian Mountains from Pennsylvania to southern Virginia. The sampling began slightly before the Clean Air Act of 1990 imposed controls on power plant emissions to reduce nitrogen oxide pollution through its Acid Rain
Program. Passed in 1990, the Acid Rain Program led to a 32 percent drop in human-caused nitrogen-oxide emis-sions in 20 states. As these emissions have declined, so too has the amount of nitrogen found in some Pennsylvania, Maryland, and Virginia waterways. Intended to reduce the emissions (sulfur dioxide and nitrogen oxide) that caused acid rain, the program had the unintended consequence of reducing the amount of nitrogen oxide particles landing on forests in the sample area and ultimately improving water quality.
“It worked for something nobody anticipated,” said lead author Keith Eshleman, a professor at the University of Maryland Center for Environmental Science’s Appalachian Laboratory. “The original idea was to reduce nitrogen oxide concentrations in the atmosphere because that would reduce acidity of precipitation and decrease ozone in the atmosphere. The other result was that water quality has improved, a side benefit that was unanticipated.”
Data and maps are available in the study report, “Surface water quality is improving due to declining atmospheric N deposition,” printed in the November 5 issue of Environment Science and Technology by Keith Eshleman, Robert Sabo, and Kathleen Kline of the University of Maryland Center for Environmental Science.
Clean Air Act Improves
Water Quality in Forested
Watersheds (continued)
The scientists collected data from waterways such as the headwaters of the Potomac River, seen here as it flows through the Monongahela National Forest in West Virginia. Photo by EPA’s Chesapeake Bay Program
Atmospheric Deposition: A Large Source of Nitrogen to the Chesapeake Bay
As noted in the 2010 Chesapeake Bay total maximum daily load report (Section 4: Sources), scientists have estimated that just over one-third of the nitrogen polluting the Bay comes from the air (i.e., through wet and dry atmospheric deposition). Once nitrogen oxide particles are emitted into the air, wind and weather can carry them long distances. In time, these particles fall onto the land or into the water. Nitrogen that enters rivers and streams can fuel the growth of algae blooms, which block sunlight from reaching underwater grasses and create low-oxygen “dead zones” that suffocate marine life. For more information, see the Chesapeake Bay Program’s Air Pollution website.
Notes From The States, Tribes and LocalitiesWater Quality Trading Project Underway in the Ohio River Basin
In March 2014, watershed stakeholders in Ohio, Kentucky, and Indiana purchased the first stewardship credits in a new regional interstate water quality trading program—officially launch-ing the pilot trading portion of the Ohio River Basin Water Quality Trading Project. This project, designed to improve water quality in the Ohio River Basin, is the result of a 7-year-long planning and collaboration effort between the nonprofit Electric Power Research Institute (EPRI) and power companies, wastewater utilities, farmers, state and federal agencies, and environmental groups. The program allows wastewater dischargers to meet nutrient reduction goals or requirements

8 NONPOINT SOURCE NEWS-NOTES SEPTEMBER 2014, ISSUE #96
Water Quality Trading Project
Underway in the Ohio River Basin
(continued)
by purchasing equivalent nutrient reduction credits from agriculture producers who implement conservation practices.
What is Water Quality Trading?
Water quality trading can be a cost-effective, environmentally sound solution to improving water quality. Generally, trading allows a facility that is facing relatively high pollutant-reduction costs (such as a permitted point source facility) to purchase equivalent pollution-reduction credits from another party (either a point or nonpoint source pollution discharger). The second party can achieve the same amount of pollution reduction at a lower cost, while providing the same or greater water quality benefit. A credit is a unit of pollutant reduction usually measured in pounds equivalent (i.e., the number of pounds of a particular pollutant expected to be reduced). Credits can be generated by a point source over-controlling its discharge or by a nonpoint source (e.g., agricultural operations) installing additional best management practices to reduce polluted runoff. For more information about water quality trading and Web-based training opportunities, see EPA’s Water Quality Trading website.
Pilot Project UnderwayThe first stewardship credit transactions under the 3-year pilot program in the Ohio River Basin (2013–2015) took place on March 11, 2014, with the transfer of 9,000 credits at $10 each to three utilities: American Electric Power, Duke Energy, and Hoosier Energy. Each credit represents roughly a pound’s worth of quantifiable nitrogen and phosphorus reductions achieved by imple-menting certain conservation practices. Each credit also represents other ancillary environmental benefits such as improved soil health, habitat enhancement, and reduced greenhouse gas emissions.
The credits were generated by farmers who implemented conservation practices on their land that reduce nonpoint source contributions of nutrients into local water bodies (Figure 1). Initial funds for the practices were provided by EPRI using private money. EPRI entered into 5-year and 10-year contracts with approximately 30 farmers initially and transferred the funds to them via the soil and water conservation districts. Another 20 farmers are expected to join the project by the end of 2014.
Figure 1. Farmers generated stewardship credits by implementing conservation practices to reduce nutrient nonpoint source pollution in four Ohio River sub-regional watersheds (four-digit hydrologic unit code-level, represented by the colored areas). The pilot trades occurred within these same sub-regional watersheds. Areas outlined in turquoise represent the original counties where farmers signed onto the program. Black boxes represent counties in which farmers joined more recently.
The participating farmers use the funds to offset costs to plant cover crops, install heavy-use area protection practices, and implement milk house waste management and other conserva-tion projects designed to reduce nitrogen and phosphorous loading into surface waters (Figure 2). The farmers are required to maintain these practices for the 5 or 10 years of the contract period, with options to renew after that time. For seasonal projects such as cover crops, the annual costs are outlined in the original application for funding and the farmer is reim-bursed every year after the cover crop is planted. For structural projects (e.g., heavy-use area protection), 100 percent of the costs occur in the first year.
To ensure that the conservation projects achieve their estimated annual reductions, the state agriculture agency inspects and verifies each practice at least annually. Each credit is then certified via desk audit by the state permitting authority before being offered for sale.
The money generated by the initial credit sale allowed EPRI to recoup the funds it provided to help farmers implement conser-vation practices in the first portion of the pilot project. “As the credit market gets going, the funds generated by transactions are expected to directly support ongoing conservation project implementation,” explained Jessica Fox, EPRI’s Water Quality

SEPTEMBER 2014, ISSUE #96 NONPOINT SOURCE NEWS-NOTES 9
Trading Program manager. The project’s ultimate goal is to develop a self-sustaining, nutrient management program that is less reliant on state and federal funding sources.
Each credit sold in March 2014 was for a 3-year period, so the buyer was guaranteed nutrient reduction credits for 3 years in a row. “The initial sale was a demonstration. It allowed us to
analyze every aspect of the water quality trading system’s operation and see what needs to be improved,” explained Fox. “The companies that purchased the initial credits are using them to make progress toward sustainability goals, rather than to meet permit requirements.”
In fall 2014, project collaborators will conduct an online credit auction, which will allow the traditional supply-and-demand market forces to determine the costs of the credits. “Our goal is to sell an additional 80,000 credits this fall,” added Fox. The fall auction will again be offering only “stewardship” credits, meaning that buyers must retire them for the pub-lic benefit and can apply them to manage supply chain impacts or meet sustainability objectives. EPRI will assess the success of the fall auction to determine whether to hold another auction within the pilot project time-frame. If EPRI meets its goal of 80,000 additional credits sold throughout the Ohio River Basin, the 3-year-long pilot project will prevent an estimated 66,000 pounds of nitrogen and 30,000 pounds of phosphorus (equivalent to almost 3,000 50-pound bags of fertilizer) from entering the Ohio River.
Depending on the success of the pilot project, EPRI might seek to expand the program over a larger geographic area. At full-scale (operating across the entire Ohio River basin), the water quality trading program could encom-pass up to eight states and potentially create a market for 46 power plants, thousands of wastewater utilities, and approximately 230,000 farmers to exchange water quality credits for nitrogen and phosphorus.
Figure 2. A farm’s livestock loafing area, before (top) and after (bottom) a heavy-use area protection practice was installed. Photo by EPRI.
Trading TransparencyThe water quality trading program includes a publicly accessible credit registry—a secure, online tracking system that follows a credit from creation to sale and provides the status of the credit over time. The registry allows interested parties to review information about the credits sold, includ-ing the type of conservation practice implemented to generate the credit, the 10-digit hydrologic unit code-level watershed in which the practice was implemented, the practice installation date, an estimate of the total number of credits generated for the site, all inspection and verification paper-work, and pictures of each completed practice. “We tried to find a middle ground where the public has access to information about the generation and sale of credits but the landowners can maintain their privacy,” explained Fox.
Want More Information?EPRI offers several valuable education resources on its Ohio River Basin Water Quality Trading Project website, including a nine-minute video about the project, a detailed infographic, and resources describing project elements (e.g., credit definitions and pricing, project templates). The site also offers links to numerous technical reports describing the development and implementation of water quality trading, such as Case Studies of Water Quality Trading Being Used for Compliance with Nutrient NPDES Permit Limits and Use of Models to Reduce Uncertainty and Improve Ecological Effectiveness of Water Quality Trading Programs, among others. Finally, EPRI publishes occasional fact sheets that provide updated information on the progress of the pilot program.
[For more information, contact Jessica Fox, Electric Power Research Institute, 3420 Hillview Avenue, Palo Alto, CA 94304; Phone: 650-855-2138; Email: [email protected]]
Water Quality Trading Project
Underway in the Ohio River Basin
(continued)

10 NONPOINT SOURCE NEWS-NOTES SEPTEMBER 2014, ISSUE #96
A Tale of Two Watersheds: the Good, the Bad, and the UglyTwo water-related events made the news headlines this summer, and if you were to ask people on the street, both of the events were unpleasant. One, a massive algae bloom in Lake Erie, turned the lake bright green and created elevated levels of an algal toxin that shut down the city of Toledo’s water system for three days. Another, a massive swarm of hatching mayflies emerging from the Upper Mississippi River, left behind piles of dead mayflies so enormous that snow shovels and plows had to be used to clear the mess. While the Lake Erie event created a water quality crisis for Toledo residents, the mayfly swarm a few states away tells a much better water quality story.
As our regular News-Notes readers will know, the first event reminds us that the Lake Erie ecosys-tem is still receiving high levels of nutrients (i.e., nitrogen and phosphorous) from its watershed. The algae bloom and subsequent water use ban in Toledo is a wake-up call, prompting those who normally don’t think about the land-water connection to consider how their actions might affect their drinking water. The second event, an unusually large, but increasingly common, emergence of hatching mayflies heralds water quality improvement in the headwaters of one of the world’s largest river systems.
Dead and dying adult mayflies coat cars and sidewalks in La Crosse, Wisconsin at the end of July 2014. Although repulsive, the large numbers of mayflies indicate improved water quality along the Mississippi River. Photo by Joey Hulett, NWS
Lake Erie is a Vulnerable EcosystemOn Saturday, August 2, 2014, chemists analyzing water at the Collins Park Water Treatment Plant in Toledo, Ohio, found two sample readings that revealed microcystin toxin levels that exceeded the recommended 1.0 microgram per liter water quality standard for drinking water. The city issued an immediate “Do Not Drink” warning to its customers, urging them to not consume the water, use it to make food, or give it to pets. The city noted that that Lake Erie, which is a source of drinking water for the Toledo water system, might have been affected by a harmful algal bloom (HAB). Algae blooms can occur when nitrogen and phosphorus are present at high levels that sup-
port algae overgrowth. At concentrated levels, these algae produce toxins that can pose a risk to human and animal health. Toledo’s water remained off-limits for three days, requiring the city to coordinate distribution of potable water for almost a half-million customers.
A HAB had been predicted a mere three weeks earlier by the National Oceanic and Atmospheric Administration (NOAA) and its research partners. On July 10, 2014, NOAA had issued a press release warning that its models showed western Lake Erie would have a significant bloom of cyanobacteria, a toxic blue-green algae, during late summer. Since 2008, NOAA has issued weekly HAB bulletins for western Lake Erie to warn residents of bloom development.
According to NOAA data, HABs were common in western Lake Erie between the 1960s and 1980s but had declined between the 1980s and early 2000s. After a lapse of nearly 20 years, blooms have been steadily increasing over the past decade. Why? The National Wildlife Federation recently teamed up with researchers from the University of Michigan to study the reasons why HABs are on the rise in Lake Erie. Their 2013 report, TAKEN BY STORM: How Heavy Rain is Worsening Algal Blooms in Lake Erie, blames changing climate and nonpoint source pollution. To combat HABs, the study’s authors recommend working to incorporate climate change information into land management decisions, further reducing nutrients in runoff from agricultural lands,
The Cyanobacterial Index from NASA’s MODIS-Aqua data collected on August 3, 2014 shows a cyanobacteria bloom in progress in western Lake Erie. Grey indicates clouds or missing data. Black represents no cyanobacteria detected. Colored pixels indicate the presence of cyanobacteria. Cooler colors (blue and purple) indicate low concentrations and warmer colors (red, orange, and yellow) indicate high concentrations of cyanobacteria.

SEPTEMBER 2014, ISSUE #96 NONPOINT SOURCE NEWS-NOTES 11
increasing emphasis on state laws that regulate nonpoint source pollution, expanding research of watershed nutrient sources, and emphasizing public education. Although unintentional, the recent public drinking water scare is putting Lake Erie’s water woes under the spotlight and should add new energy to the efforts to control nutrient nonpoint source pollution.
Mayflies in the Mississippi A bloom of a different type occurred on the evening of July 20, 2014, along the Mississippi River around the city of La Crosse, Wisconsin. That night, National Weather Service (NWS) radar picked up a large disturbance centered over the Upper Mississippi River. Although the image on the radar looked like a rain event, it wasn’t. In this case, the radar was capturing a massive swarm of hatching mayflies erupting almost synchronously from the river.
Mayflies are invertebrates that inhabit the Upper Mississippi River and many of its tributaries, as well as other large rivers and lakes in North America. As nymphs, these aquatic insects burrow into the river’s substrate and feed on decay-ing organic matter for a year or two. In the summer, large numbers of nymphs emerge at the same time from the water at dusk and take flight as subadults. Within 36 hours of emerging, the subadults metamorphose into adults that swarm in the air to mate before returning to the water surface to lay their eggs and die.
As explained in a news release from the Minnesota Pollution Control Agency (MPCA), mayfly swarms such as the one in La Crosse indicate the rebirth of the Mississippi River. During the 1960s and 1970s, little or no treatment of sewage existed, meaning that cities essentially flushed their toilets down the Mississippi River. For the delicate mayfly, which is sensitive to chemical pollutants, the increasing water pollution caused their populations to collapse.
MPCA water quality expert Will Bouchard explains, “The larvae or nymphs spend a year burrowed in the sediments of the river and during this relatively long larval cycle they can be exposed to toxic chemicals in the sediment or low levels of dissolved oxygen. As a result, this mayfly can be a good indicator of water quality because these forms of pollution can kill the larvae.”
By the 1980s, high pollution levels had caused mayflies to virtually disappear from rivers and streams in the Upper Mississippi River Basin. Because adult may-flies spend 99 percent of their lives as nymphs on the water—being fed upon by other invertebrates, amphibians, reptiles, fish, birds and mammals—the removal of the mayflies from the aquatic food chain also meant the disappearance of other invertebrates and even some species of fish from the Mississippi River.
Today, point and nonpoint source pollution control efforts have allowed water quality to improve, and have, in turn, allowed mayfly populations to rebound. “The large swarms of mayflies emerging from the Mississippi River are an indica-tion that the river has recovered considerably since the days when it was essen-tially an open sewer,” says Bouchard.
Large mayfly hatches have been on the rise in recent years. To help track the mayfly emergences, the NWS has partnered with federal, state, and local partners
to develop and maintain an Upper Mississippi River Valley Mayfly Tracking website that pro-vides information about emergences of the mayfly along the Upper Mississippi River Valley from Davenport, Iowa, through St. Paul, Minnesota.
Although this summer’s periodic swarms of adult mayflies emerging along the Upper Mississippi River might seem repulsive and unsettling to some, many people recognize the swarms for the good news they represent—the water quality in the Mississippi River ecosystem is improving.
A Tale of Two Watersheds: the
Good, the Bad, and the Ugly
(continued)
The National Weather Service radar detected a mayfly swarm about 8:45 p.m. on July 20, 2014. The flies emanated from the Mississippi River (visible as a white line in the radar image) and produced echo values similar to that of light-moderate rain. As the flies dispersed moving north-northeast, they also gained altitude with some of the echo being detected as high as 2,500 feet above the ground.

12 NONPOINT SOURCE NEWS-NOTES SEPTEMBER 2014, ISSUE #96
Regional Turf Fertilizer Guidelines Encourage Efficiency and EffectivenessThe New England Interstate Water Pollution Control Commission (NEIWPCC) is making it easier for urban turf fertilizer users and manufacturers to protect water quality. In early 2014, NEIWPCC released a set of regional voluntary guidelines for turf fertilization. The guidelines
were developed over a two-year period with the input and expertise of many stake-holders: turf fertilizer manufacturers; lawn care professionals; state, federal, and local environmental and land care agencies; academic researchers and university extension specialists; and regional watershed and environmental advocacy groups. The guide-lines are designed to help reduce nutrient losses and protect water quality through Connecticut, Maine, Massachusetts, New Hampshire, New York, Rhode Island, and Vermont. They can also provide useful information and might possibly serve as a model for guidelines in other regions where cool season turf grass is grown, includ-ing the mid-Atlantic, the Great Lakes region, the northern Midwest, and the Pacific Northwest.
Although the original goal was to produce a one-size-fits-all set of guidelines that would reduce nutrient impacts to water quality while growing healthy turf, NEIWPCC discovered during the development process that this approach was not practical. Turf that is subject to intensive use must be specially managed according to its use, such as that grown for sports use (e.g., soccer fields and golf greens) or subject to high foot traffic (e.g., public parks). As a result, the NEIWPCC guidelines address only urban turf (also known as nonperformance turf), which includes residential lawns, commercial landscaped turf areas, low-traffic public areas, and even out-of-bounds and rough areas of golf courses. Urban turf accounts for most of the turf coverage in the region.
The New England Interstate Water Pollution Control Commission and stakeholders developed regional guidelines for urban turf fertilization in the Northeast.
Guidelines Developed to Promote EfficiencySeveral states around the nation have recently passed laws to restrict the nutrient content of turf fertilizer and, in some cases, regulate the amount of fertilizer that users may apply (see the article “State Restrictions on Non-Agricultural Fertilizer Use on the Rise,” published in News-Notes Issue #91). While most of these state laws are similar, no two laws are exactly the same, meaning turf fertilizer manufacturers and applicators face requirements that can differ between states. By devel-oping guidelines that apply to all of New York and New England, manufacturers can more easily provide products that meet nutrient content requirements throughout the region. In addition, the guidelines apply to a wide range of fertilizer users, allowing environmental outreach specialists across the region to convey a more unified message about turf fertilizer and the environment. The voluntary guidelines do not replace existing state laws related to nutrients in turf fertilizer, nor do they prevent states from passing new laws in the future. However, NEIWPCC hopes that achiev-ing stakeholder agreement on regional guidelines will save states time and money by avoiding a piecemeal legislative approach—while also helping to protect water resources.
The full report, Regional Clean Water Guidelines for the Fertilization of Urban Turf, contains 33 guidelines for urban turf. At the suggestion of stakeholders, the guidelines are organized around the “five Rs.” The first four—right formulation, right rate, right time, right place—are the tenets espoused by fertilizer professionals and agronomists who advocate that fertilizer can improve turf health while also reducing negative environmental impacts if turf managers select the right prod-ucts with the right nutrient composition, apply it at the “right” (correct) rate according to soil con-ditions, and do so at the right time and in the right place. The fifth R, right supporting practices, refers to the notion that fertilization is one practice under a broader umbrella of lawn care practices that can affect turf ’s ability to absorb nutrients and prevent erosion losses.
A sample of the types of guidelines within each section is presented below. For the full list and accompanying explanations, consult the main document. NEIWPCC also developed a stand-alone list for quick reference.
SEPTEMBER 2014, ISSUE #96 NONPOINT SOURCE NEWS-NOTES 13
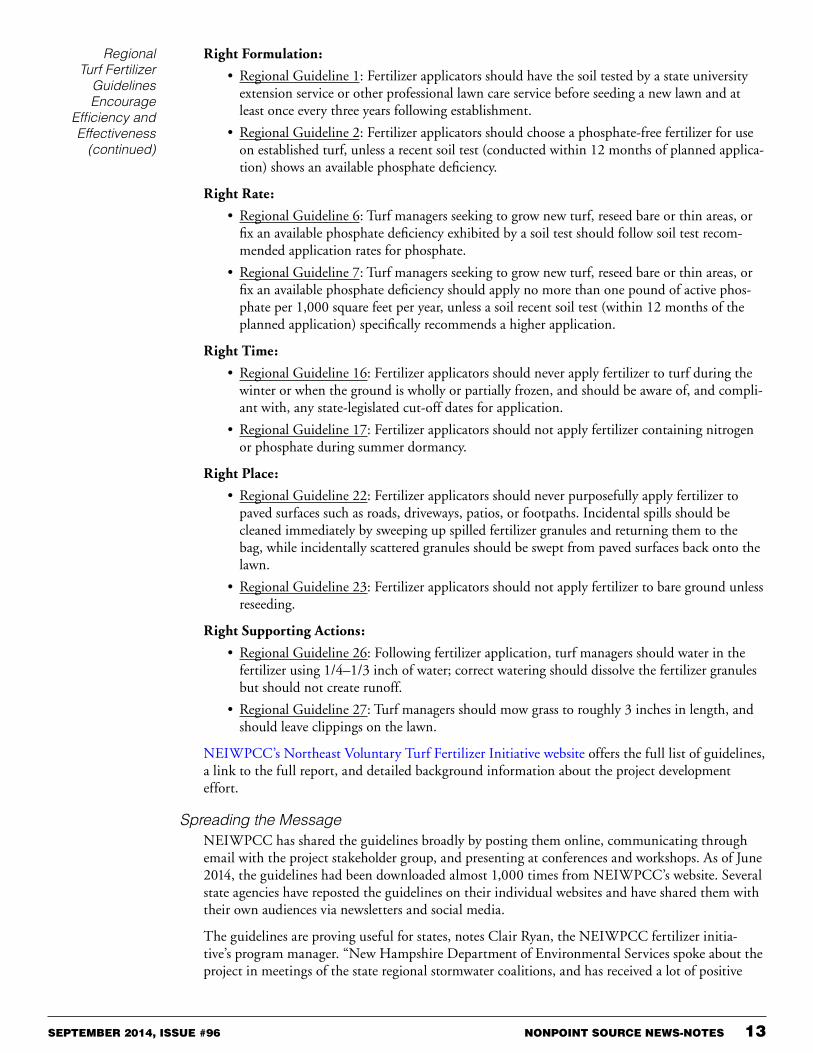
Right Formulation:
• Regional Guideline 1: Fertilizer applicators should have the soil tested by a state university extension service or other professional lawn care service before seeding a new lawn and at least once every three years following establishment.
• Regional Guideline 2: Fertilizer applicators should choose a phosphate-free fertilizer for use on established turf, unless a recent soil test (conducted within 12 months of planned applica-tion) shows an available phosphate deficiency.
Right Rate:
• Regional Guideline 6: Turf managers seeking to grow new turf, reseed bare or thin areas, or fix an available phosphate deficiency exhibited by a soil test should follow soil test recom-mended application rates for phosphate.
• Regional Guideline 7: Turf managers seeking to grow new turf, reseed bare or thin areas, or fix an available phosphate deficiency should apply no more than one pound of active phos-phate per 1,000 square feet per year, unless a soil recent soil test (within 12 months of the planned application) specifically recommends a higher application.
Right Time:
• Regional Guideline 16: Fertilizer applicators should never apply fertilizer to turf during the winter or when the ground is wholly or partially frozen, and should be aware of, and compli-ant with, any state-legislated cut-off dates for application.
• Regional Guideline 17: Fertilizer applicators should not apply fertilizer containing nitrogen or phosphate during summer dormancy.
Right Place:
• Regional Guideline 22: Fertilizer applicators should never purposefully apply fertilizer to paved surfaces such as roads, driveways, patios, or footpaths. Incidental spills should be cleaned immediately by sweeping up spilled fertilizer granules and returning them to the bag, while incidentally scattered granules should be swept from paved surfaces back onto the lawn.
• Regional Guideline 23: Fertilizer applicators should not apply fertilizer to bare ground unless reseeding.
Right Supporting Actions:
• Regional Guideline 26: Following fertilizer application, turf managers should water in the fertilizer using 1/4–1/3 inch of water; correct watering should dissolve the fertilizer granules but should not create runoff.
• Regional Guideline 27: Turf managers should mow grass to roughly 3 inches in length, and should leave clippings on the lawn.
NEIWPCC’s Northeast Voluntary Turf Fertilizer Initiative website offers the full list of guidelines, a link to the full report, and detailed background information about the project development effort.
Spreading the MessageNEIWPCC has shared the guidelines broadly by posting them online, communicating through email with the project stakeholder group, and presenting at conferences and workshops. As of June 2014, the guidelines had been downloaded almost 1,000 times from NEIWPCC’s website. Several state agencies have reposted the guidelines on their individual websites and have shared them with their own audiences via newsletters and social media.
The guidelines are proving useful for states, notes Clair Ryan, the NEIWPCC fertilizer initia-tive’s program manager. “New Hampshire Department of Environmental Services spoke about the project in meetings of the state regional stormwater coalitions, and has received a lot of positive
Regional Turf Fertilizer
Guidelines Encourage
Efficiency and Effectiveness
(continued)

14 NONPOINT SOURCE NEWS-NOTES SEPTEMBER 2014, ISSUE #96
feedback that the guidelines are useful both for application to town-owned land and for sharing with residents. The states in the Long Island watershed are also looking at how the guidelines can be integrated into their efforts to implement the Long Island Sound total maximum daily load for nitrogen.” Ryan adds that people involved in point source pollution control efforts have been “excited to see a new project aimed at making meaningful reductions in nonpoint sources.”
[For more information contact Clair Ryan, Program Manager, NEIWPCC, 650 Suffolk Street, Suite 410, Lowell, MA 01854; Phone: 978-349-2519; Email: [email protected]]
Notes On Green Stormwater InfrastructureGuide Helps Communities Manage Stormwater and Wastewater with Green Infrastructure
The U.S. Environmental Protection Agency (EPA) has released a new technical guide to help communities develop, evaluate, and quantify combined sewer overflow (CSO) control alternatives that include green infrastructure. Communities with combined sewers often view green infrastruc-ture as an attractive way to reduce stormwater flows going into their sewer system, thus helping to reduce capital and operational costs at publicly owned treatment works. The new document, Greening CSO Plans: Planning and Modeling Green Infrastructure for Combined Sewer Overflow (CSO) Control, will help communities make cost-effective decisions to maximize water quality benefits. The resource explains how to use modeling tools such as EPA’s Storm Water Management Model (SWMM) to optimize different combinations of gray and green infrastructure to reduce both sewer overflow volume and number of overflow events.
Jointly developed by EPA’s Office of Water and Office of Research and Development, Greening CSO Plans is intended for use by both policy-oriented as well as technical professionals working to incorporate green infrastructure into a community’s CSO long-term control plans. This resource contains three main parts:
1. A general overview of the regulatory and policy context for incorporating green infrastruc-ture into CSO control programs.
2. A discussion about how municipalities can develop and assess control alternatives that include green infrastructure.
3. A demonstration of a modeling tool, SWMM Version 5.0 (SWMM5), that can help quan-tify green infrastructure contributions to an overall CSO control plan (see graph, next page).
Under the National Pollutant Discharge Elimination System permit program, communities are required to implement nine minimum control measures and to develop and implement CSO long-term control plans. Many communities are still searching for cost-effective ways to do this. Despite the progress achieved to date, significant infrastructure investments are still needed to address CSOs.
Options for Controlling CSOsThe document reviews the four main categories of CSO controls available to communities: operation and mainte-nance practices, collection system controls, storage facilities, and treatment technologies. Historically, most efforts to control CSOs emphasized what is known as gray infra-structure—stormwater management practices that relied on pipes, sewers, and other structures made of concrete and steel. In contrast, green infrastructure practices mimic natural hydrologic processes to reduce the quantity and rate of stormwater flows into the combined sewer system.
Regional Turf Fertilizer
Guidelines Encourage
Efficiency and Effectiveness
(continued)
The CSO Challenge
Across the United States, more than 700 cities rely on combined sewer systems to collect and convey both sanitary sewage and stormwater to wastewater treatment facilities. Most of these communities are older cities in the Northeast, the Great Lakes region, and the Pacific Northwest. When wet weather flows exceed the capacity of combined sewer systems and treatment facilities, the waste stream (i.e., stormwater; untreated human, commercial, and industrial waste; toxic materials; and debris) is diverted to CSO outfalls and discharged directly into surface waters. These CSOs carry microbial pathogens, suspended solids, floatables, and other pollutants, and can lead to beach and shellfish bed closures, contamination of drinking water supplies, and other environmental and human health impacts. For many cities with combined sewer systems, CSOs remain one of the greatest challenges to meeting water quality standards.

SEPTEMBER 2014, ISSUE #96 NONPOINT SOURCE NEWS-NOTES 15
By controlling stormwater runoff through the processes of infiltration, evapotranspiration, and capture and use (rainwater harvesting), green infrastructure can help prevent stormwater from entering the combined sewer system.
The document explains that green practices must be planned and scheduled, and implementation efforts must be tracked and evaluated, similar in concept to how gray infrastructure projects are planned and tracked. Because CSO long-term control plans will include gray infrastructure as well, both green and gray infrastructure should be planned with the other in mind.
The document emphasizes that when implementing green infrastructure, communities must account for key sewershed characteristics, such as land use, soil types, topography, and the expected degree of buy-in from local stakeholders. Care must be taken in pro-jecting green infrastructure implementation based on these varying factors, so that model outputs provide a strong, realistic basis for future decision making around green infrastructure investments.
Finally, the document describes ways that hydrologic and hydraulic (H&H) models are particularly useful tools to help evaluate combinations of gray and green infrastructure. H&H models can also help assess whether planned level of technologies will meet estab-lished CSO control objectives. While larger green infrastructure practices that fulfill a storage function can be modeled in the hydraulic component of an H&H model, smaller green infrastructure practices are typically modeled in the hydrologic component. Several techniques can make the model reflect both reduction of flow into the system, as well as simply slowing down the runoff. Chapter 4 of the docu-ment provides a detailed case study that illustrates how changing hydrology parameters within a model (e.g., the conversion of impervious area to pervious
area, conversion of directly connected impervious areas to disconnected impervious areas, and modifying depression storage value parameters) can all be used to account for the effects of green infrastructure. Using modeling tools such as EPA’s SWMM5 can help simplify and standardize the impacts of green infrastructure practices within combined sewer systems. In addition, EPA’s Green Infrastructure website offers numerous educational resources and planning tools for communities.
No GI Public GI Public + Private GI 85% Target
Gray Storage Volume (MG)
% R
educ
tion
in O
verfl
ow V
olum
e
3.5 432.521.510.50
100
90
80
70
60
50
40
30
20
10
0
EPA used the SWMM5 modeling tool to estimate overflow volume that would occur if the example municipality were to apply varying levels of gray infrastructure (GI) storage volumes and green infrastructure practices. “Public GI” refers to permeable pavement and street planters applied to public land. “Public + Private GI” refers to the use of rain gardens on private land in addition to the public green elements. This model shows that meeting an overflow volume reduction target of 85% (5 million gallons [MG]) would require a 2.5 MG storage unit without any green infrastructure. This system can be reduced to store 1.3 MG if public green infrastructure controls are used and reduced further down to 1 MG (a 60% reduction) if both public and private controls are used.
Study Quantifies Green Infrastructure Benefits for Stormwater ControlGreen infrastructure can be a cost-effective solution for controlling stormwater while providing numerous economic benefits, according to a new U.S. Environmental Protection Agency (EPA) report. In 2011 the city of Lancaster, Pennsylvania, released a comprehensive Green Infrastructure Plan (GI Plan) articulating a set of goals, opportunities, and recommendations for implementing green infrastructure in Lancaster. Although Lancaster’s GI Plan estimated water quality benefits associated with the plan’s implementation, it did not estimate the environmental, social, and eco-nomic benefits. Because city leaders were interested in understanding the added benefits of green infrastructure, EPA selected Lancaster as a case study and completed a screening-level analysis that quantified this so-called “triple bottom line.”
Lancaster’s GI PlanThe city of Lancaster (population 60,000) is one of more than 700 cities nationwide with a combined sewer system (CSS) that collects and conveys both stormwater runoff and sewage to
Guide Helps Communities
Manage Stormwater and
Wastewater with Green
Infrastructure(continued)
16 NONPOINT SOURCE NEWS-NOTES SEPTEMBER 2014, ISSUE #96
a wastewater treatment plant. Most of the time, the city’s wastewater treatment facility is able to manage and treat the volume of wastewater flowing through the CSS. During intense precipita-tion events, however, the system becomes overwhelmed and a mixture of sewage and stormwater is discharged directly into area streams and rivers. Each year, these combined sewer overflows (CSOs) discharge approximately 750 million gallons of untreated wastewater and stormwater into the Conestoga River. Despite significant progress in recent years through investments in gray infrastructure (e.g., increasing the capacity of conveyance and treatment infrastructure), the city estimated that the price tag to manage the remaining CSOs with gray infrastructure would be more than $250 million.
To link the significant investment required to meet water quality goals to a broader set of com-munity improvements, the city opted for a strategy involving both gray and green infrastructure. Developed with the assistance of city, county, and state agencies, the GI Plan identified opportuni-ties for adding green infrastructure throughout the city within 5-year and 25-year timeframes; estimated the water quality benefits of 5-year and 25-year implementation scenarios; and articu-lated a series of policy, outreach, and technical recommendations to institutionalize green infra-structure in Lancaster. Based on the assumed implementation level for the 25-year scenario, the GI Plan estimated that long-term implementation of green infrastructure could reduce the average annual stormwater runoff in the study area by 1.053 billion gallons per year. The plan estimated the total and marginal costs of the 25-year scenario to be $141 million and $77 million, respec-tively. The marginal (or incremental) cost refers to the additional cost of adding green infrastruc-ture to a planned improvement project (e.g., the additional cost of repaving a parking lot with permeable pavement instead of conventional pavement). As noted in the GI Plan, leveraging other projects is generally more cost effective than undertaking stand-alone green infrastructure projects, and can result in more widespread implementation.
EPA’s Benefits AnalysisDuring its analysis, EPA applied the methodology discussed in The Value of Green Infrastructure: A Guide to Recognizing Its Economic, Environmental and Social Benefits (Guide), a guidance docu-ment developed by American Rivers and the Center for Neighborhood Technology in 2010. The Guide provides information on the benefits that five green infrastructure practices provide across eight benefit categories, which allowed the development of a generalized methodology for valuing the additional benefits of green infrastructure. EPA’s analysis applied the Guide’s methodology to estimate the value of Lancaster’s proposed long-term green infrastructure investments in four benefits categories: water, energy, air quality, and climate change.
EPA conducted a screening-level analysis that indicated green infrastructure can be a cost-effective solution to stormwater management while also providing multiple environmental benefits. Within the CSS drainage area, implementation of Lancaster’s GI Plan will reduce gray infrastructure capital costs by $121.7 million and reduce wastewater pumping and treatment costs by $661,000
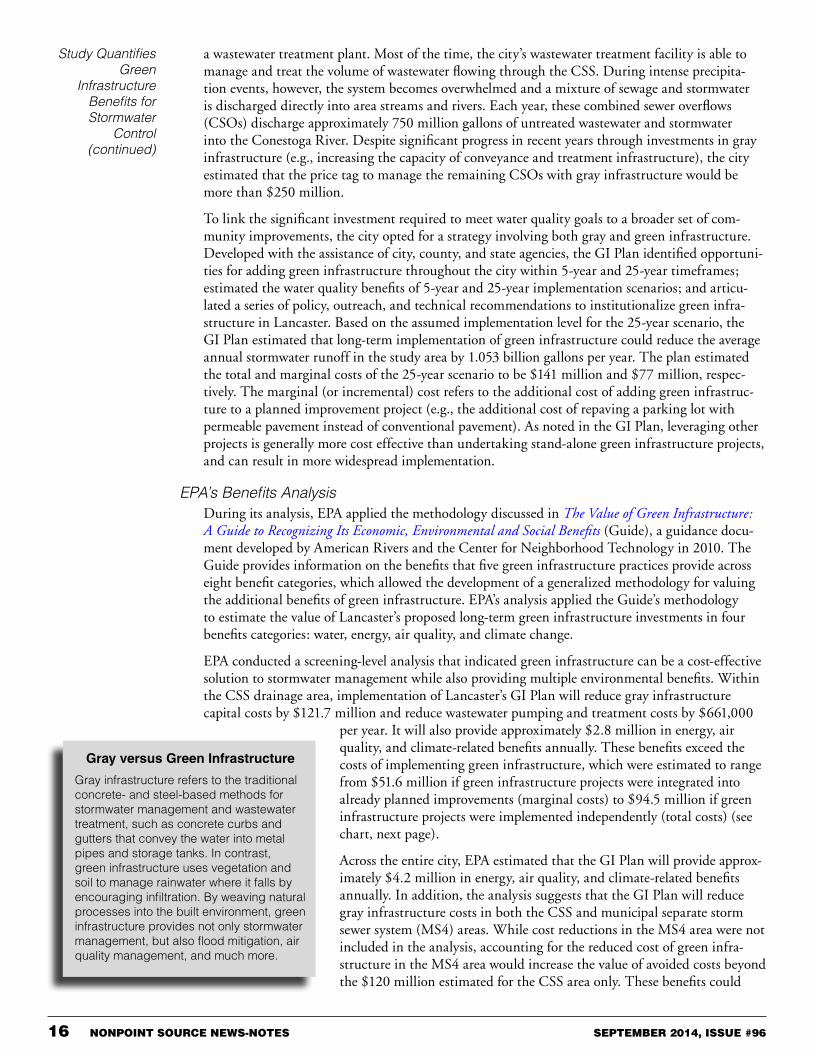
per year. It will also provide approximately $2.8 million in energy, air quality, and climate-related benefits annually. These benefits exceed the costs of implementing green infrastructure, which were estimated to range from $51.6 million if green infrastructure projects were integrated into already planned improvements (marginal costs) to $94.5 million if green infrastructure projects were implemented independently (total costs) (see chart, next page).
Study Quantifies Green
Infrastructure Benefits for Stormwater
Control(continued)
Gray versus Green Infrastructure
Gray infrastructure refers to the traditional concrete- and steel-based methods for stormwater management and wastewater treatment, such as concrete curbs and gutters that convey the water into metal pipes and storage tanks. In contrast, green infrastructure uses vegetation and soil to manage rainwater where it falls by encouraging infiltration. By weaving natural processes into the built environment, green infrastructure provides not only stormwater management, but also flood mitigation, air quality management, and much more.
Across the entire city, EPA estimated that the GI Plan will provide approx-imately $4.2 million in energy, air quality, and climate-related benefits annually. In addition, the analysis suggests that the GI Plan will reduce gray infrastructure costs in both the CSS and municipal separate storm sewer system (MS4) areas. While cost reductions in the MS4 area were not included in the analysis, accounting for the reduced cost of green infra-structure in the MS4 area would increase the value of avoided costs beyond the $120 million estimated for the CSS area only. These benefits could
SEPTEMBER 2014, ISSUE #96 NONPOINT SOURCE NEWS-NOTES 17
be achieved for a minimum investment of $77 million if green infrastructure is inte-grated into planned improve-ment projects. Costs would be higher—up to $141 mil-lion—if green infrastructure practices are implemented as stand-alone projects. In both the CSS and MS4 areas, the environmental and economic benefits provided by green infrastructure would con-tinue to accrue annually.
EPA’s final report, The Economic Benefits of Green Infrastructure: A Case Study of Lancaster, PA, summarizes the screening-level analysis performed for each of the four benefit categories. The Lancaster case study shows how conducting a comprehensive analysis of benefits can help commu-nities identify appropriate infrastructure investments that can achieve a broad array of community development objectives.
This analysis also highlights the role that green infrastructure can play in augmenting an existing gray infrastructure network, as well as the importance of incorporating green infrastructure into planned capital improvement projects. The opportunity to integrate green infrastructure broadly across a number of infrastructure improvements provides an opportunity to reduce overall imple-mentation costs and promote more cost-effective stormwater management solutions. To see similar case study analyses, see EPA’s Green Infrastructure Northeast Case Studies website.
Green vs. Gray Infrastructure within Lancaster’s CSS Area$125,000,000
$100,000,000
$75,000,000
$50,000,000
$25,000,000
$-Green Infrastructure
Capital Cost (Marginal)Green InfrastructureCapital Cost (Total)
Avoided GrayInfrastructure Capital Cost
This chart compares the costs incurred when implementing green infrastructure (marginal and total) versus gray infrastructure within the portion of Lancaster that is served by a combined sewer system.
Notes On AgricultureUsing Cover Crops in a System of Conservation Practices Improves Water Quality
Many farmers use cover crops to improve the soil on their fields and prevent it from washing away during runoff events, especially when cash crops such as corn, wheat, and soybeans are not being grown. Cover crops can be grasses and grains (such as cereal rye and winter wheat), legumes (such as crimson clover and hairy vetch), or broadleaf plants (such as mustard and radishes). Planting cover crops is one conservation practice that should be used within a system of conservation prac-tices to improve water quality.
Cover crops provide many benefits, including:
• Reducing nutrient losses to waterbodies by scavenging nitrate from the soil that would other-wise be lost through leaching when no crop is growing.
• Reducing sediment and phosphorus losses to nearby waterways by acting as a vegetative buf-fer to slow down surface erosion and increase water infiltration.
• Improving air quality by reducing wind erosion.
Cover crops reduce nitrogen losses from farm fields from 13 to 94 percent and phosphorus losses from 54 to 92 percent (Kaspar and Singer, 2011). Iowa’s Nutrient Reduction Strategy reported that cover crops can reduce nitrate-nitrogen losses in Iowa or similar landscapes by an average of 28 percent and 32 percent for oat and rye cover crops, respectively, and can reduce phosphorus losses by an average of 29 percent for winter rye.
By implementing cover crops, farmers can create environmental benefits while providing other on-farm benefits, including increased organic matter and soil health, greater water retention, and potentially increased yields. Results from a 2012–2013 Cover Crop Survey conducted by the Conservation Technology Information Center reported that corn planted after cover crops had
Study Quantifies Green
Infrastructure Benefits for Stormwater
Control(continued)

18 NONPOINT SOURCE NEWS-NOTES SEPTEMBER 2014, ISSUE #96
almost a 10 percent increase in yield compared to adjacent fields with no cover crops; soybean yields increased by more than 11 percent, likely because of increased organic matter and associated water retention. When used in a system of practices that avoid, control, and trap (ACT) nutrients, such as continuous no-tillage, cover crops have an even greater potential to reduce nutrient losses.
Despite the environmental and agronomic benefits associated with cover crops, the implementa-tion of cover crops is still low, particularly in the Midwest where it can have significant positive impacts on water quality. The U.S. Department of Agriculture’s (USDA’s) Conservation Effects
Assessment Project (CEAP) cropland reports estimated that in 2003–2006, farmers planted cover crops in 1 percent or less of the available acreage in the Lower Mississippi River Basin, Upper Mississippi River Basin, Missouri River Basin, and Great Lakes Region. Research from the National Wildlife Federation’s Clean Water Grows report estimates that in 2011 between 1.8 and 4.3 million acres of cover crops were planted in the Mississippi River Basin—less than 2 percent of total cropland area. However, cover crop acreage has been increasing over the past few years in some areas. USDA’s 2013 CEAP report on the Chesapeake Bay estimated that the acreage of cover crops planted every year more than tripled in 2011 as compared to 2003–2006, from 5 percent to 18 percent of cropped acres in the Bay basin.
A few states, such as Iowa and Maryland, have developed incentive pro-grams to boost cover crop implementation across the landscape. In August 2013, the Iowa Water Quality Initiative provided $2.8 million to implement
four key conservation practices, including cover crops. The 2014 Legislative Report indicates that this new program, along with federal cost-share programs, more than tripled cover crop implemen-tation—from 64,700 acres in 2012 to 230,000 acres in 2013. Similarly, Maryland’s Agriculture Water Quality Cost-Share Program provides grants to producers to cover 87.5 percent of the cost to install conservation practices, including cover crops and other practices that help reduce nutri-ent losses. Maryland surpassed its goal of 355,000 acres of cover crops in the 2011–2012 planting season by 21 percent, preventing an estimated 2.5 million pounds of nitrogen and 86,000 pounds of phosphorus from entering Maryland water bodies.
Significant opportunities exist in agricultural landscapes across the Midwest and the Mississippi River Basin to use conservation practice systems with cover crops to reduce nutrient losses from agricultural areas and improve water quality. More information can be found on EPA’s Cover Crop website and the USDA Natural Resources Conservation Service website.
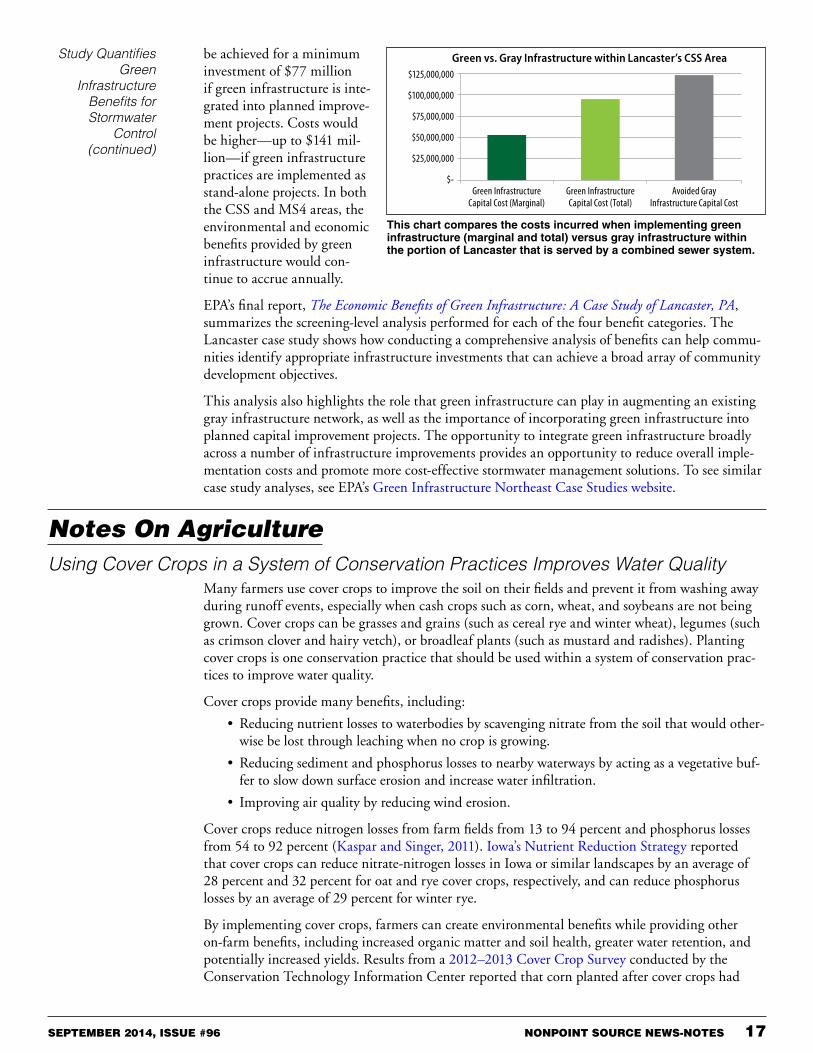
Crimson clover is one type of cover crop that can be used to reduce soil erosion and improve water quality. Photo by USDA NRCS
Reviews and AnnouncementsAgricultural Nonpoint Source Pollution
Collaboration Toolkit Helps You Work with Conservation DistrictsThe Source Water Collaborative recently released an online Collaboration Toolkit to help cre-ate partnerships to protect drinking water sources through agriculture conservation practices, stormwater, and forest management. The toolkit offers effective steps that source water protection professionals working at the local or state level can take to build partnerships with conservation district staff. The toolkit is designed for a variety of audiences, including those who have never worked with their conservation district, those who have attempted to work with a district but achieved little success, and those who would like to enhance their current efforts. This toolkit was developed through extensive collaboration between members of the Source Water Collaborative, National Association of Conservation Districts, and the U.S. Department of Agriculture’s (USDA) Natural Resource Conservation Service.
Using Cover Crops in a System
of Conservation Practices
Improves Water Quality
(continued)

SEPTEMBER 2014, ISSUE #96 NONPOINT SOURCE NEWS-NOTES 19
Climate ChangeGulf Coast Community Handbook Released
With funding from the U.S. Environmental Protection Agency (EPA) Climate Ready Estuaries Program, the Tampa Bay Estuary Program recently completed the Gulf Coast Community Handbook: Case Studies from Gulf of Mexico Communities for Incorporating Climate Change Resiliency into Habitat Planning and Protection. The handbook provides a review of the latest climate change science, with a focus on impacts to habitats such as marshes and mangroves in the Gulf of Mexico region. It features 21 case studies from Gulf Coast National Estuary Programs and National Estuarine Research Reserves that showcase effective ways to incorporate climate change into habitat restoration and planning efforts. The document also contains interactive links to climate change resources, such as online mapping tools and scientific publications, and step-by-step recommendations to assist communities in assessing their vulnerabilities and developing response and resiliency strategies. The handbook is intended for environmental managers and community leaders in the Gulf Coast states.
Handbook on Legal Tools to Limit Risks of Climate Change for Coastal Communities Available
Columbia University’s Center for Climate Change Law has published Managed Coastal Retreat: A Legal Handbook on Shifting Development Away from Vulnerable Areas, which examines the legal tools available to state and local governments to discourage or prevent development or redevel-opment along high-risk coastal areas and other areas susceptible to natural hazards. Managed retreat—the planned process of moving development away from vulnerable areas—is a controver-sial concept because homeowners would prefer to take their chances and rebuild after a destructive storm. The handbook describes legal principles and precedents that can serve as useful guides for new policies. It also examines case studies, reviews lessons learned, and makes recommendations on the basis of the experiences of states and municipalities that have implemented managed retreat to protect against storms and natural disasters.
USDA Hubs Help Address the Impacts of a Changing ClimateThe USDA has published the Regional Hubs for Risk Adaptation and Mitigation to Climate Change website, which addresses environmental risks (e.g., fires, invasive pests, floods, and droughts) that might increase because of climate change. The site aims to disseminate science and research to farmers, ranchers, and forest landowners on ways to adapt and adjust their resource management to the aforementioned climate change risks. This information is area-specific, with the nation partitioned into seven regional hubs. The development of regional climate hubs is part of the President’s Climate Action Plan to responsibly cut carbon pollution, slow the effects of climate change, and help achieve a cleaner environment. In addition to the seven Hubs, the USDA is designating three Subsidiary Hubs (“Sub Hubs”) that will function within the Southeast, Midwest, and Southwest. The Sub Hubs will support the Hub within their region and focus on a narrow and unique set of issues relative to what will be going on in the rest of the Hub. The Southwest Sub Hub will focus on specialty crops and Southwest forests. The Southeast Sub Hub will address issues important to the Caribbean. Finally, the Midwest Sub Hub will address climate change and Great Lake state forests.
Data Resources
“How’s My Waterway” App Now More User-FriendlyEPA released an enhanced version of How’s My Waterway, an app and website to help people find information on the condition of thousands of lakes, rivers, and streams across the United States from their smart phone, tablet, or desktop computer. How’s My Waterway uses GPS technology or a user-entered zip code or city name to provide information about the quality of local water bodies. The new version of the site includes data on local drinking water sources, information on water-sheds, and examples of efforts to protect waterways. The site also provides a map-oriented version of How’s My Waterway designed for museum kiosks, displays, and touch screens.
20 NONPOINT SOURCE NEWS-NOTES SEPTEMBER 2014, ISSUE #96
NASA Brings Earth Science Data to the Cloud with Amazon Web ServicesThe National Aeronautics and Space Administration (NASA) and Amazon Web Services (AWS) of Seattle, Washington, are making a large collection of NASA climate and Earth science satel-lite data available to researchers and educational users through the AWS cloud. The selected data sets include temperature, precipitation, and forest cover, as well as data processing tools from the NASA Earth Exchange, a research platform of the NASA Advanced Supercomputer Facility at the agency’s Ames Research Center in Moffett Field, California. The NASA datasets will be available through the Amazon Public Data Sets.
New USGS Resources Support the Development of Nutrient PoliciesNew maps and data tables that describe nutrient loading to major estuaries throughout the con-terminous United States are now available online on the U.S. Geological Survey (USGS) National Water-Quality Assessment (NAWQA) Program’s Tracking the Source and Quantity of Nutrients to the Nation’s Estuaries website. This site describes the major sources and contributing areas of nutrients to 115 estuaries along the Atlantic Coast, Gulf of Mexico, and the Pacific Northwest coast and from 160 watersheds draining into the Great Lakes. In addition to the new Web pages, water resource managers interested in a particular stream, reservoir, or estuary can use the online, interactive SPARROW model Decision Support System (DSS) to estimate how reductions in nutrient sources affect downstream nutrient loads at a stream outlet. A new reporting feature within the DSS provides summary information on the amounts and sources of nutrients from upstream states or major hydrologic regions. For instance, output from the new reporting feature shows the amount of nitrogen contributed from each of the 31 states that drain into the Gulf of Mexico from the Mississippi River watershed. This combination of national maps and an online DSS are provided to improve access to water quality modeling information that can be used to develop nutrient reduction strategies and to inform nutrient policies across the United States.
Forestry
Global Forest Watch: Dynamic New Platform to Protect Forests WorldwideWorld Resources Institute (WRI), Google, and a group of more than 40 partners recently launched Global Forest Watch (GFW), a dynamic online forest monitoring and alert system that empowers people everywhere to better manage forests. For the first time, Global Forest Watch unites the latest satellite technology, open data, and crowd-sourcing to guarantee access to timely and reliable information about forests. According to data from the University of Maryland and Google, the world lost 2.3 million square kilometers of tree cover from 2000 to 2012—equivalent to 50 soccer fields of forest lost every minute of every day for 12 years. The countries with the highest tree cover loss are Russia, Brazil, Canada, United States, and Indonesia. Global Forest Watch offers numerous tools, including: (1) data showing annual tree cover loss and gain data for the entire globe at a resolution of 30 meters; (2) monthly tree cover loss data for the humid tropics at a resolution of 500 meters; and (3) data layers showing boundaries of protected areas worldwide, daily forest fire alerts from NASA, agricultural commodities, intact forest landscapes, biodiversity hotspots, and forest-removal activities (e.g., logging, mining, palm oil).
Stormwater
Fact Sheet Highlights Green Infrastructure and Community Resiliency EPA’s new fact sheet, Improving Community Resiliency with Green Infrastructure, highlights ways that interconnected networks of green infrastructure can enhance the resiliency of gray infrastruc-ture and communities by increasing water supplies, reducing flooding, providing climate adaptabil-ity, and improving water quality. Examples are provided from Milwaukee, Wisconsin; Nashville, Tennessee; and Pima County, Arizona.

SEPTEMBER 2014, ISSUE #96 NONPOINT SOURCE NEWS-NOTES 21
NEMO Offers Guide for Impervious Cover-Based Total Maximum Daily LoadsIn 2009 and 2010, the Nonpoint Education for Municipal Officials (NEMO) Program of the University of Connecticut’s Center for Land Use Education and Research (CLEAR) led a team of partners in an effort to develop a practical response to the first impervious cover-based total maxi-mum daily load (TMDL) in the nation. This TMDL was issued for Eagleville Brook in Mansfield Connecticut in 2007 by the Connecticut Department of Energy and Environmental Protection (CT DEEP). The project team included CT DEEP, several units of the University of Connecticut, the Town of Mansfield, and experts from the Center for Watershed Protection and the Horsley Witten Group. The partners created a guidebook based on the Eagleville Brook project that builds on NEMO’s more than 20 years of experience working with communities on stormwater and land use issues. This guidebook provides succinct, step-by-step instructions for communities required to use an impervious cover-based framework for protecting and restoring their water resources. As a supplement to the guidebook, the partners have also developed a Do-It Yourself Community Response to an Impervious Cover TMDL website to guide stakeholders through the steps needed to use impervious cover as a water resource protection framework.
Paper Offers Lessons Learned for Sustainable Small Communities In October 2013 the International City/County Management Association Center for Sustainable Communities released Defying the Odds: Sustainability in Small and Rural Places, a briefing paper offering lessons learned from small communities that are protecting the environment and enacting sustainability policies. Seven case studies are presented, including the motivations and actions local leaders took to make their projects successful. Examples are provided from Columbus, Wisconsin; Kearney, Nebraska; South Daytona, Florida; Homer, Alaska; Sleepy Eye, Minnesota; West Liberty, Iowa; and Hurricane, Utah.
Wetlands
Paper Provides Guidance on Wetland Mitigation Banking RisksWetland mitigation banking is the largest ecosystem services market in the United States, but it still comes with risks. A December 2013 report entitled Navigating Wetland Mitigation Markets: A Study of Risks Facing Entrepreneurs and Regulators, notes the market lacks transparency as well as efficiency and is relatively unknown to investors. The paper, written by two recent joint-degree graduates of Yale’s School of Forestry and Environmental Studies and School of Management, is intended as a comprehensive reference to wetland mitigation banking for newcomers from the business, financial, and regulatory sectors. The report highlights the most critical risks inherent in wetland mitigation banking and offers strategies to manage these risks. The study is based on information from existing literature in addition to interviews with industry participants.
Proposed Rule Clarifies Federal Protection for Nation’s Streams and WetlandsIn March 2014 EPA and U.S. Army Corps of Engineers (Army Corps) released a proposed rule to clarify protection under the Clean Water Act for streams and wetlands that form the foundation of the nation’s water resources. The proposed rule clarifies protection for streams and wetlands—it does not protect any new types of waters that have not historically been covered under the Clean Water Act and is consistent with the Supreme Court’s more narrow reading of Clean Water Act jurisdiction. Specifically, the proposed rule clarifies that most seasonal and rain-dependent streams are protected under the Clean Water Act, as are wetlands near rivers and streams. Other types of waters that have less straightforward connections with downstream waters will be evaluated through a case-specific analysis of whether the connection is protecting similarly situated waters in certain geographic areas. Note that the proposed rule preserves the Clean Water Act exemp-tions and exclusions for agriculture. EPA and the Army Corps have coordinated with the USDA to develop an interpretive rule to ensure that 56 specific conservation practices that protect or improve water quality will not be subject to Clean Water Act section 404 dredged or fill permitting requirements. Public comments on the new rule will be accepted until October 20, 2014.

22 NONPOINT SOURCE NEWS-NOTES SEPTEMBER 2014, ISSUE #96
Report Shows Wetlands Restoration Benefits ClimateRestore America’s Estuaries (a national nonprofit organization) worked with several partners on a study that confirmed the climate change mitigation benefits of restoring tidal wetland habitat in the Snohomish Estuary, part of the larger Puget Sound. The study identified major climate change mitigation benefits from wetland restoration and provided a much-needed approach for assess-ing carbon fluxes in drained and restored wetlands that can be applied to other places. The study report, Coastal Blue Carbon Opportunity Assessment for Snohomish Estuary: The Climate Benefits of Estuary Restoration, notes that currently planned and in-construction restoration projects in the Snohomish estuary will result in at least 2.55 million tons of carbon dioxide sequestered from the atmosphere over the next 100 years (equivalent to a year’s worth of emissions for 500,000 average passenger cars). If the Snohomish Estuary were to be fully restored, the sequestration potential jumps to 8.8 million tons of carbon dioxide (one year’s emissions from about 1.7 million passenger cars).
Wetlands One-Stop Mapping Tool AvailableThe Association of State Wetland Managers, in collaboration with Virginia Tech’s Conservation Management Institute and the U.S. Fish and Wildlife Service’s Northeast Region, have created Wetlands One-Stop Mapping to provide easy online access to geospatial data on wetlands and soils produced by federal and state agencies. Wetlands One-Stop Mapping provides links to data provided by multiple separate agencies. It provides online access to classification tools for adding hydrogeomorphic-type to wetland inventory data and the results of National Wetlands Inventory (NWI) projects (maps and reports). The geospatial information is linked to aerial imagery (and topographic maps) for easy viewing of wetlands, their characteristics, and functions for areas where NWI data are available. Among the national datasets accessible via Wetlands One-Stop Mapping are the NWI’s wetlands mapper, USDA’s soil survey data, and USGS’s national hydrography and hydrologic unit data. Links are also provided to NatureServe Explorer and the U.S. National Vegetation Classification Hierarchy Explorer, along with guidance on how to extract descriptions of wetland plant communities from those sites for specific areas of interest. The site also provides information about the activities of the Wetland Mapping Consortium, including future and past recorded webinars, coastal mapping resources, a summary of the status of state wetland mapping, and links to federal and state wetland resources (e.g., delineation manuals, wetland publications, and federal agency wetland program websites).
Other
Catalog of Federal Funding Sources for Watershed Protection UpdatedEPA’s online Catalog of Federal Funding Sources for Watershed Protection was updated in spring 2014 to include the latest information about fiscal year 2014 federal funding allocations for pro-grams focusing on watershed protection and restoration. The site houses an easy-to-use, searchable database of 85 grant, loan, and cost-sharing programs that are available to fund a variety of water-shed activities. Information about each funding source includes a program description, details on program contacts, funding history, typical past award amounts, eligibility requirements, applica-tion deadlines, and matching fund requirements. Users can search by keyword, type of assistance, match requirement, and more.
Ecosystem Valuation Toolkit Available Online The nonprofit group Earth Economics developed The Ecosystem Valuation Toolkit, a comprehen-sive collection of online tools and resources designed to help planners, watershed managers, forest owners, natural resource agencies, scholars, and businesses research and communicate the value of ecosystem services. The Ecosystem Valuation Toolkit offers (1) SERVES, a self-service tool for ecosystem service valuation and natural capital appraisal; (2) a Researcher’s Library, with a com-munity research platform for ecosystem service valuation studies; (3) the Repository, the world’s largest database of published valuation data; and (4) the Resource Library, materials for education, best practices, communication, policy, and more.
SEPTEMBER 2014, ISSUE #96 NONPOINT SOURCE NEWS-NOTES 23
EPA Finalizes Rule to Protect Aquatic Life from Cooling Water Intakes In May 2014 EPA finalized standards to protect fish and other aquatic life from being drawn into cooling water systems at large power plants and factories. The final rule establishes requirements under the Clean Water Act for all existing power generating facilities and manufacturing and industrial facilities that withdraw more than 2 million gallons of water per day and use at least 25 percent of the water they withdraw exclusively for cooling purposes. This rule covers roughly 1,065 existing facilities: 521 of these facilities are factories and the other 544 are power plants. The technologies required under the rule are well-understood, have been in use for several decades, and are in use at over 40 percent of facilities. The national requirements, which will be implemented through National Pollutant Discharge Elimination System (NPDES) permits, are applicable to the location, design, construction, and capacity of cooling water intake structures at these facilities and are based on the best technology available for minimizing environmental impact. The rule estab-lishes a strong baseline level of protection and then allows additional safeguards for aquatic life to be developed through site-specific analyses, an approach that ensures the best technology available is used. It puts implementation analysis in the hands of the permit writers so that requirements can be tailored to the particular facility.
EPA Recognizes Seven Communities for Smart Growth AchievementIn January 2014 EPA recognized projects in seven communities as winners of the 2013 National Award for Smart Growth Achievement for their creative, sustainable initiatives that better protect the health and the environment while strengthening local economies. Among the winners are an expansive greenway in Atlanta, Georgia; a downtown whitewater rafting park in rural Iowa; and a regional development plan for metropolitan Chicago, Illinois. Other winners include the revital-ized Historic Millwork District in Dubuque, Iowa, and an innovative, affordable infill housing development near public transit in Sacramento, California. The 2013 award winners were judged in five categories: overall excellence; corridor or neighborhood revitalization; plazas, parks, and public places; policies, programs, and plans; and built projects. Specific initiatives include cleaning up and reusing brownfields; using green infrastructure to manage stormwater runoff and improve water quality; providing transportation options; and providing green, energy-efficient housing in low-income areas.
Report Explores Riparian Buffer Success StoriesIn fall 2013 the River Network released the second report in its “snapshot” series. Restoring Riparian Buffers: A What Works Snapshot provides two types of information: (1) a summary of the results of a national survey of organizations involved in riparian buffer restorations, and (2) a selec-tion of case studies documenting riparian restoration projects in various watersheds. The goal of the report is to share lessons learned, creative ideas, successes, challenges, and failures experienced by watershed groups across the country.
USGS Report Reveals Gaps in Streamflow InformationThe USGS recently conducted an assessment of the ability of its stream gauge network to ade-quately calculate streamflow statistics at locations that have stream gauges in place (gauged) and that do not have stream gauges (ungauged). The results are highlighted in a new USGS report, A National Streamflow Network Gap Analysis, which identifies where gaps exist in the network of gauged locations, examines how accurately streamflow statistics can be calculated for given lengths of record, and assesses the ability to extrapolate these streamflow statistics from gauged to ungauged locations. The results of the assessment indicate that coverage provided by the stream-flow data-collection network varies both spatially and temporally. The goal of this study was to help the USGS identify and strategically address the existing gaps in its streamflow monitoring network.

24 NONPOINT SOURCE NEWS-NOTES SEPTEMBER 2014, ISSUE #96
Recent and Relevant Periodical ArticlesDevelopers Go Green for Suburban Stormwater Management
This article, on page 24 of the journal Stormwater, highlights examples in which developers of residential sites saved money and increased profits by using green infrastructure. Example sites featured include Illinois’ Prairie Crossing, Arkansas’ Gap Creek, Maryland’s Somerset, and Oregon’s Pringle Creek.
Engineering Ecosystem Restoration: A Partnership ApproachThis article, published in the summer 2014 issue of the U.S. Army Corps of Engineers’ quarterly Our Mississippi magazine, explores the Army Corps’ partnership with several key stakeholders in the Lower Mississippi River watershed to restore hydrologic connectivity between the river and its floodplain.
Scientists Enlist Border Collies to Chase off Beach-Polluting GullsThis article, published in the May 19, 2014 issue of the Los Angeles Times, highlights an experiment conducted by Central Michigan University researchers. Increasing gull populations had led to increased levels of bacteria in recreational waters in Lake Michigan, threatening swimmers’ health and leading to beach closures. The researchers used border collies to scare the gulls away from designated beach areas and found that both gull counts and bacteria levels declined as a result.
Social Marketing Campaign in Saipan Targets Litter in Laolao BayThis article, presented on page 8 in the July/August/September 2014 edition of NOAA’s Coastal Services newsletter, discusses a successful anti-litter social marketing campaign implemented to protect Saipan’s Laolao Bay and watershed in the Commonwealth of the Northern Mariana Islands. The year-long campaign, Our Laolao, included activities such as video testimonials about Laolao Bay, personal “anti-litter” pledges posted on social media, story and photo contests, a student-hosted radio show, beach cleanups, a flash mob, and billboard, radio, and newspaper announcements.
Websites Worth A BookmarkDigital Coast
The National Oceanic and Atmospheric Administration’s (NOAA’s) Digital Coast website pro-vides data, tools, and training for coastal managers, planners, decision makers, and technical users to help coastal communities manage issues of concern. This centralized, user-friendly, and cost-effective information repository was developed by the NOAA Coastal Services Center.
Natural Solutions for Reducing Flood RiskThis website highlights The Nature Conservancy’s ongoing efforts to promote natural methods of flood protection such as protecting and restoring wetlands and forests. The site offers videos of past floods and examples of how The Nature Conservancy is reaching across local, state, provincial, and federal lines to make watershed-level conservation and management strategies a reality.
Water Blues Green Solutions Produced by Penn State Public Media, this interactive documentary Web project is designed to promote awareness of the role that green infrastructure can play in creating a sustainable water future. Water Blues Green Solutions tells stories from across the country of communities that are adopting new ways of thinking about how to protect, restore, and preserve our rivers and drinking water sources.

SEPTEMBER 2014, ISSUE #96 NONPOINT SOURCE NEWS-NOTES 25
Calendar For an updated events calendar, see http://water.epa.gov/polwaste/nps/outreach/calendar.cfm.
September 2014 9/15–17 California Stormwater Quality Association: 10th Annual Conference, Orange County, CA
9/15–17 5th Annual One Water Leadership (OWL) Summit, Kansas City, MO
9/19 Webinar: What is Stormwater Master Planning?
9/24–25 Mid-Atlantic Regional Water Conference, Shepherdstown, WV
9/26–28 Chesapeake Watershed Forum, Shepherdstown, WV
9/27–10/1 WEFTEC, New Orleans, LA
9/30–10/2 2014 America’s Watershed Initiative Summit, Louisville, KY
October 2014 10/5–11 Society of American Foresters National Convention/International Union of Forest Research Organizations
World Congress, Salt Lake City, UT
10/6–8 WaterPro Conference, Seattle, WA
10/8–10 Southeast Stormwater Association’s Ninth Annual Regional Stormwater Conference, Charleston, SC
10/8–10 Coastal Resilience Conference 2014, Galveston, TX
10/15–17 American Shore and Beach Preservation Association 2014 National Coastal Conference: Promoting Healthy Coasts, Virginia Beach, VA
10/21 Gulf of Mexico Hypoxia Task Force Fall 2014 Public Meeting, Godfrey, IL
10/21–23 The Columbia River Basin 2014 Conference: Learning From Our Past to Shape Our Future, Spokane, WA
10/23–24 National Workshop on Large Landscape Conservation, Washington, DC
November 2014 11/1–6 7th National Summit on Coastal and Estuarine Restoration: Inspiring Action, Creating Resilience,
Washington, DC
11/3–6 2014 American Water Resources Association (AWRA) Annual Water Resources Conference, Tysons Corner, VA
11/5–6 2014 Partners in Community Forestry Conference, Charlotte, NC
11/4 EPA Webcast: Innovative Financing for Green Infrastructure
11/9–12 National Onsite Wastewater Recycling Association: Strengthening the Industry’s Voice, Denver, CO
11/12–14 North American Lake Management Society 34th International Symposium, Tampa, FL
11/12–15 CitiesAlive: Annual Green Roof and Wall Conference, Nashville, TN
11/16–29 American Water Works Association: 2014 Water Quality Technology Conference, New Orleans, LA
11/17–20 2014 Stream Restoration Conference, Charlotte, NC
December 2014 12/2 EPA Webcast: Green Infrastructure & Flood Mitigation
12/8–12 ACES: A Community on Ecosystem Service 2014 Conference: Linking Science, Practice, and Decision Making, Washington, DC
12/11–14 IAHS/ICCE International Symposium on Sediment Dynamics: From the Summit to the Sea, New Orleans, LA
Contribute to Nonpoint Source News-Notes
Do you have an article or idea to share? Want to ask a question or need more information? Please contact NPS News-Notes, c/o Don Waye, by mail at U.S. EPA, Mail Code 4503-T, 1200 Pennsylvania Ave., NW, Washington, DC 20460, or by email at waye.don <at> epa.gov.
Disclaimer of Endorsement
Nonpoint Source News-Notes is produced by the U.S. Environmental Protection Agency, with support from Tetra Tech, Inc. Mention of commercial products, publications, or websites does not constitute endorsement or recommendation for use by EPA or its contractors, and shall not be used for advertising or product endorsement purposes.