nonlinear behavior - transportation research board
TRANSCRIPT
Transportation Research Record 810
strain, the effective in situ modulus is much larger than at higher levels of shear strain.
4. The amount of shear-strain development in the granular layer appears to be related to the overall pavement strength in addition to loading magnitude, which is intuitively correct.
5, Since shear strain cannot be measured easily in the field, a provisional procedure was developed and outlined for estimating the granular base modulus adjustment factor (K1 ) directly from fieldmeasured deflection results by using an empirically derived relationship from this study.
6. With the bituminous surface and granular base layers of a conventional asphalt pavement accurately characterized, elastic-layered theory can be used to compute the subgrade modulus by matching surface deflections.
From the results of this study, the possibility of the behavior of granular material being related to mobilized shear strain seems entirely plausible. We recommend that this connection be further investigated over a broader range of pavement sections to incorporate different material types and climate conditions. In recognition of all the possible sources of error that could enter into the product ion of the data used in this study (e.g., field deflection measurement, laboratory material testing, mathematical manipulation, and existing natural variation), the amount of scatter exhibited in the relationships involving the proposed adjustment factor is simply too small to forego additional exploration.
ACKNOWLEDGMENT
We are indebted to the Maryland State Highway Administration for providing traffic control to assist the field testing performed under this study.
REFERENCES
1. B.S. Coffman. Pavement Deflections from Laboratory Tests and Layer Theory. Pree. , 2nd International Conference on the Structural Design of Asphalt Pavements, Univ. of Michigan, Ann Arbor, Aug. 1967.
2. C.L. Monismith, H.B. Seed, F.G. Mitry, and C.K. Chan. Prediction of Pavement Deflections from Laboratory Tests. Proc., 2nd International Conference on the Structural Design of Asphalt Pavements, Univ. of Michigan, Ann Arbor, Aug. 1967.
9
3. L.H. Irwin. Determination of Pavement Layer Moduli from Surface Deflection Data for Pavement Performance Evaluation. Proc., 4th International Conference on the Structural Design of Asphalt Pavements, Univ. of Michigan, Ann Arbor, Vol. 1, Aug. 1977.
4. H.B. Seed, F.G. Mitry, C.L. Monismith, and C.K. Chan; University of California. Prediction of Flexible Pavement Deflections from Laboratory Repeated-Load Tests. National Cooperative Highway Research Program, Rept. 35, 1967, 117 pp.
5. R.W. May. Interpreting Dynamic Surface Deflections in the Granular Base Layer of the Pavement Structure. FHWA, Staff Study Rept. FHWA/ RD-80/149, Feb. 1981.
6. P.A. D'Arnato and M.W. Witczak. Analysis of In Situ Granular-Layer Modulus from Dynamic RoadRater Deflections. TRB, Transportation Research Record 755, 1980, pp. 20-30.
7. M.W. Witczak and K.R. Bell. Remaining-Life Analysis of Flexible Pavements. Proc., Assn. of Asphalt Paving Technologists, Lake Buena Vista, FL, Vol. 47, 1978.
8. H.F. Southgate. An Evaluation of Temperature Distribution Within Asphalt Pavements and Its Relationship to Pavement Deflections. Kentucky Department of Highways, Frankfort, Rept. KYHPR-64-20, 1968.
9. M.W. Witczak. A Study of the Deflection Be-havior of the Ikalanian Sand Winchendon Test Section. U.S. Army Cold Regions Research and Engineering Laboratory, Hanover, NH, Jan. 1980.
10. M.P. Jones and M.w. Witczak. Subgrade Modulus on the San Diego Test Road. TRB, Transporta-tion Research Record 641, 1977, pp. 1-6.
11. S.F. Brown. Repeated Load Testing of a Granular Material. Geotechnical Engineering Journal of ASCE, Vol. 100, No. GT7, July 1974, pp. 825-841.
12. Bechtel Power Corporation. Seismic Analysis of Structures and Equipment for Nuclear Power Plants. Bechtel Power Corporation, San Francisco, CA, Rept. BC-TOP-4-A, Rev. 3, Nov. 1974.
13. R.G. Hicks and C.L. Monismith. Factors Influ-encing the Resilient Response of Granular Materials. HRB, Highway Research Record 345, 1971, pp. 15-31.
Publication of this paper sponsored by Committee on Flexible Pavement Design.
Prediction of Subgrade Moduli for Soil that Exhibits
Nonlinear Behavior
JAN MOOSSAZADEH AND MATTHEW W. WITCZAK
The main objective of this report is to develop a simple and accurate procedure to predict an equivalent one-layer subgrade modulus for a soil that exhibits nonlinear behavior in a flexible highway pavement system. The analysis is predicated on developing such a modulus that would yield identical values of either vertical strain or deflection at the top of the subgrade compared with results obtained from a stress-dependent iteration technique that accounts for the stress·depan· dent (nonlinear I behavior of the subgrade. Use of a modified elastic layered computer program was made to determine equivalent subgrade modulus values
for nearly 3900 separate layered pavement problems. By using the results obtained, multiple regression techniques were used to determine predictive equations for the equivalent subgrade modulus values as a function of the nonlinear subgrade and layered pavement properties. Use of partial model regressions techniques allowed predictive equations to be obtained that had correlation coefficients In excess of 0.95 and residual errors less than 10 percent. Both analytical and nomographic solutions are presented to demonstrate the simplicity of the approach. It was found that values of deflection-based equivalent mod-
10
ulus are larger than or equal to values of strain-derived modulus for a given set of load, pavement, and nonlinear subgrade properties. Although the vertical subgrade·strain-derived subgrade moduli are generally independent of the in· corporation of overburden stresses, equivalent subgrade moduli based on de· flection criteria, without overburden considered, were almost always larger 1han equivalent deflection based moduli developed with overburden incorporated into the analysis.
Until recently, the moduli of unbound flexible pavement layer materials have been treated as parameters of constant magnitude. However, recent research in dynamic materials characterization has indicated that many pavement materials are stress dependent. Due to the importance of the subgrade modulus i n the overall performance of the flexible pavement, the most accurate assessment of modulus is essential to the successful design of a pavement system. Such assessment is also required in calculation of any stress, strain, or deflection in the pavement system.
Several mathematical forms have been researchers to model the nonlinear fine-grained subgrade soil. One such simple, model is
where
resilient modulus,
suggested by behavior of useful, but
(1)
constants dependent on material type and physical soil properties, and
0d = deviator stress.
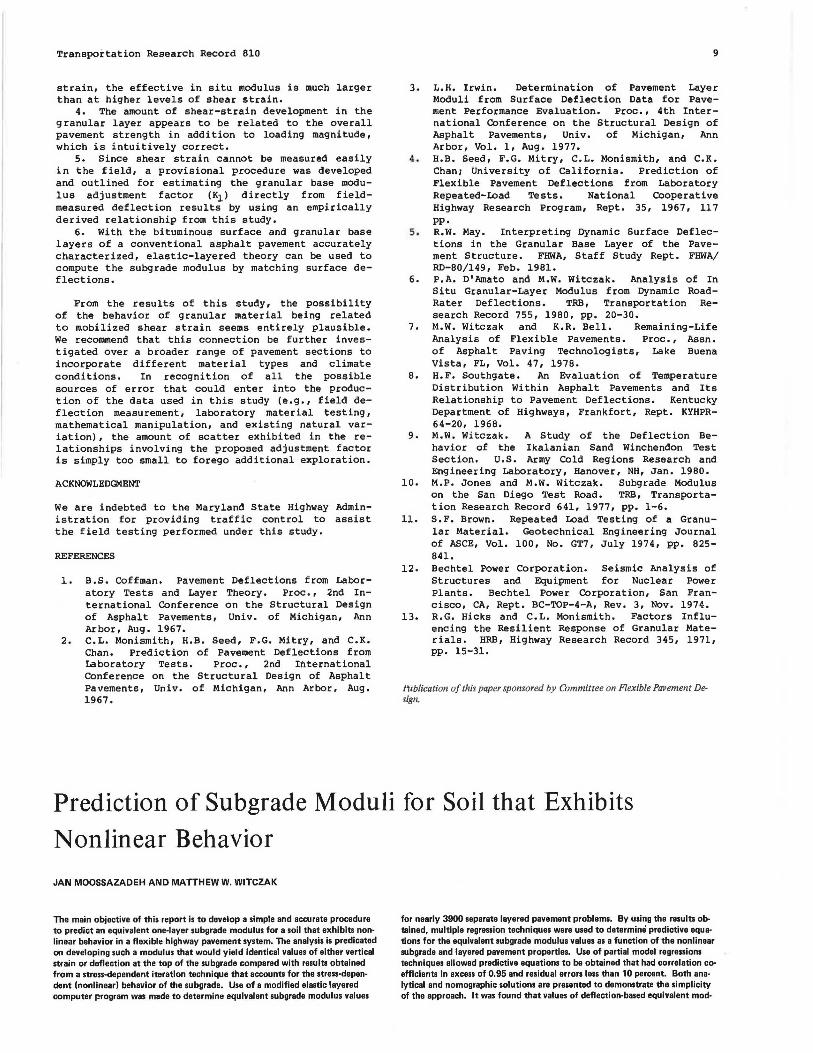
This relation is illustrated in Figure 1 for two different soils that show marked differences in nonlinear behavior. The most important aspect illustrated in Figure l is that, since the deviator stress varies with depth in the subgrade, the modulus must likewise change with depth. Clearly, the magnitude of this change is most significantly affected by changes i n the slope or Krvalue . This parameter indicates, to a large degree, the nonlinearity of a given material.
STUDY OBJECTIVE
The general purpose of this research was to develop a simple and accurate method of evaluating a single (one-layer) modulus value for the entire subgrade layer that would yield identical values of selected critical parameters to those found by using an iterative multilayer systems approach to account for the nonlinear behavior. The critical parameters selected for this study were the vertical strain (£) and deflection (6) at the top of the subgrade layer. Both of these parameters are performance indicators of the pavement system. The two resulting moduli will be referred to as the equivalent strain [E(£)] and equivalent deflection moduli [E(6)], respectively.
This study follows a similar research effort by Smith <!l on the stress-dependent modulus of granular base material. However, there are few, if any, studies on the stress-dependent solutions for the subgrade modulus value. The closest technique is the one developed by Treybig and others (~l • However, this method is only applicable for overlay analysis. Furthermore, the method mentioned only accounts for adjustments in the state of stress at the top of subgrade layer, and, therefore, the change with depth of these parameters is neglected.
In a layered pavement system, there are three major parameter groups that affect the deviator stress in the subgrade, and hence the variation of moduli with i n thi s layer. They are as fo11ows:
Transportation Research Record 810
1. Nonlinear subgrade properties (K1 and K2), 2. Pavement laye r propertie s (Ei, hi, and
µilr and 3. Vehicle load properties (P, p, and spacing).
Study on Values of K1 and K2
In o rder to arrive at typical values for K1 and K2, available test data in the literature were used. Three sets of data were used in this study: the results of the San Diego County Test Road (3), the results of a subgrade study by the Illinois Department of Transportation (4-6), and the data from a study conducted for the Ma-;yland State Highway Administration (7). Altogether, 137 sets of nonlinear moduli resuits were analyzed.
Through linear regression techniques, values of Ki and K2 were determined for each set of data. A summary of these values is shown in Table 1. This table shows that the majority of K1 values fall between 0 and 200 kips/in 2 , and K2 ranges from 0 to -1.0.
The above study also afforded some insight into the effect of soil parameters on K1 and K2 values. Although very general, the important findings of this study were as follows:
1. K1 increases and K2 decreases as the dry density increases or t he moisture content decreases1
2. The value of Ki is directly proportional to the liquid limit and plasticity index, but inversely proportional to the plastic limit; K2 is relatively insensitive to the Atterberg limits; and
3. Ki and K2 are relatively independent of each other.
Arrangeme nt of Factorial Ma t rix
In order to relate the equivalent subgrade modulus values to other pavement system parameters, a factorial study was conducted. A selected number of each parameter was chosen to encompass the whole range of values of such parameters encountered in design. Use was made of available data concerning the ranges of each variable, as well as the Ki -K2 study mentioned above. Thickness values for the asphalt and base layers (h1 and h2 ) were selected from an examination of typical highway pavement sections encountered in practice. The load used in this study was a 9-kip single wheel load and a tire pressure of 70 lbf/in2 to approximately model the effects of an 18-kip single-axle load. Because of this load selection, the results of this study are considered applicable only for typical highway pavements. Table 2 illustrates the values of each variable used in the factorial study. As observed, a matrix of 972 combinations was evaluated.
METHOD ANALYSIS
Eguivalent ~loduli
As mentioned earlier, determination of a stress- dependent subgrade modulus value with elastic layered theory involves an iterative procedure. In this study the subgrade was subdivided into four 12-in sublayers and a semi-infinite lower layer. The values of the deviator st r ess at the t op of eac h sublayer were calculated by the Chevron N-layer computer program (~). The predicted values of ad found were then substituted in Equation l and a new value was calculated for each sublayer modulus. This new value of the sublayer modulus was then compared with the original value and the iteration procedure continued until a difference of ±5

Transportation Research Record 810
Figure 1. Typical nonlinear modulus results for subgrade soils.
200
100
£ 80
11
Note: 1 kPa ~ 0.145 lbf/in2.
60 -··---.. ----.. .. _ __ ____
. ··-.. -~ 40 .... VI
~ Cl) Indonesian Soil
w=27 . 2\ yd=95.6 "l=41\ wp=25%
e Maryland Route 97 Soil w=l7.6\ Yd•I06 . 2 pcf
"' :E A-7-6 CL
WL=30\ wp=27\ lp•3\
A-4 (0) SM
20 MR=63l ,877od-.506(Met r i c )
- 506 (34,SOOod . )(U. S . Units)
MR=76, 042od - · 099
(Metric)
( - .099 .
9110 od ) (U. S. Units)
od - Deviator Stress (kPa)
Table 1. Summary of nonlinear soil parameters.
San Diego Study Illinois Study Maryland Study
Parameter K1 K1 K1 K1 K1 K1
Mean 60.6 ldps/!n2 -0.37 16.5 kips/in2 -0.42 47 .7 kips/in2 -0.51 SD 89.3 kips/!n2 0.264 8.3 kips/in2 0.156 3 7 .8 kips/in 2 0.290 Coefficient of variance 147 71 51 37 79 57
(%) Range 5.0 to 684 -1.17 to 3.0 to 34.0 -0.74 to 8.0 to 125.0 -1.13 to
kips/in2 3.93 kips/in2 -0.17 kips/in2 -0.04 Total no. of samples 79 39 19 No. of samples that have 76a 39b 19b
K 1 between 0 and 200 kips/in2
39b 18d No. of samples that have 75c K2 between 0 and -1. 0
~Thjs represents 96.2 percent of the tta rnples. This represents 100 (ll:lrcCn l or the n mples.
~This represents 94.9 percent of the samples. This represents 94. 7 percent of the samples.
percent occurred between the two values. Because of the large size of the factorial matrix analyzed, we modified the Chevron N-layer program to perform this iterative sequence internally.
After the stress-dependent sublayer moduli were found, the multilayer pavement system was reduced to a three-layer system. This three-layer system had the same top two layers as did the original multilayer pavement but one subgrade layer was added that had a unique modulus value. The end product of this analysis was to determine what one- layer subgrade modulus would yield the same critical parameters as the stress-dependent sublayer moduli system.
As mentioned before, the two selected parameters. (critical criteria) used in this s tudy were the values of vertical strain and deflection at the top of the base-subgrade interface. These two parameters would, as expected, result in two different EJ values [E(E) and E(o) J. In addition, the effects of both ignoring and including the pavement overburden stresses on t he Ee values were also studied. Thus , four sepa rate ieq parameters were investigated .
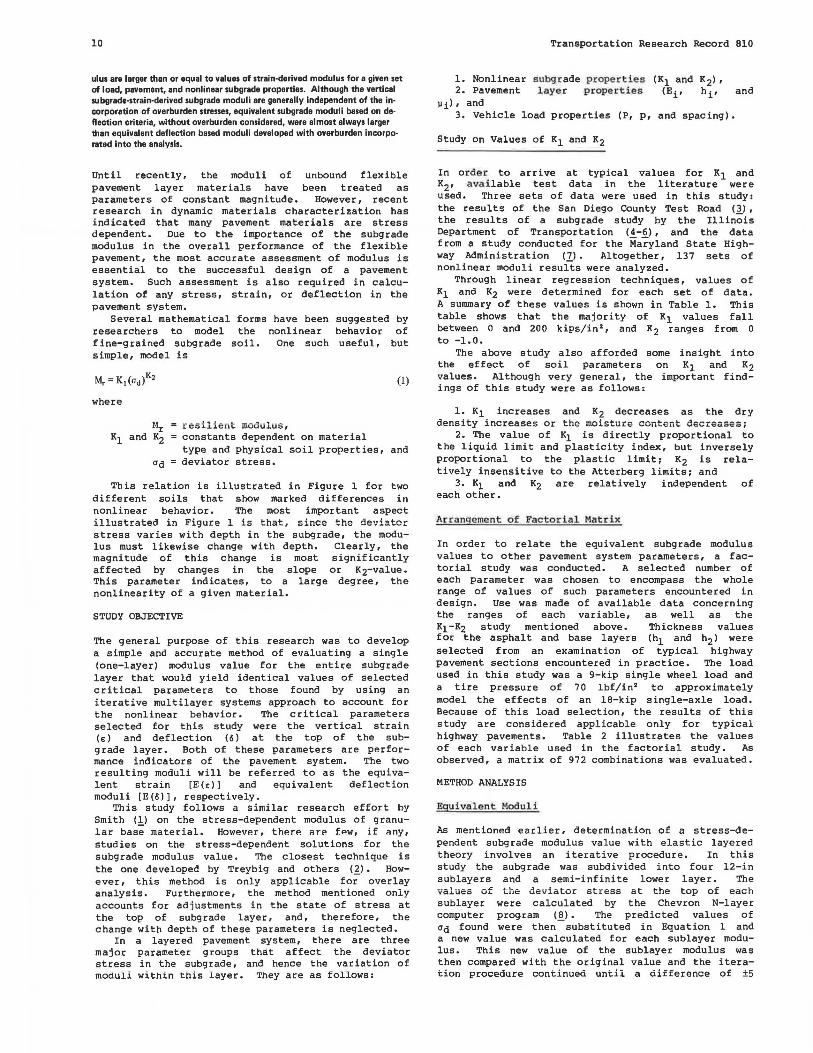
The procedure used to determine the Beg value consisted of examining the effect of subg rade modulus on the desired parameter (& or o) for a particular three-layer pavement system. As it turned out, these relations were virtually linear on a log-log scale. The value of the equivalent subgrade modulus was then determined as that modulus yielding the same strain (or deflection) as that found from the multilayer stress-dependent iteration study. Figure 2 depicts one such solution for the Eeq< E) and Eeq ( o) val ue . Although the figure denotes a graphical solut ion, the above s teps in the equivalent subgrade study were computerized to save time and increase the accuracy of the solution.
Statistical Data Analysis
For each combination of pavement and soil parameters examined (i.e., hi, Eir h2, E.2• Ki, and K2) a unique Eeg value for a given critical criterion was obtained. The next study step was to examine whether a relation existed between the
12
mentioned varia bles and F.eq. The use of multiple regression techniques was employed to determine the best model (highest correlation coefficients). In this phase of the study, 10 different model combinations were analyzed. The best model (highest R2 )
form was found to be a total log model. In order to reduce the number of independent variables in the prediction equations, the individual thickness and moduli parameters were combined into one unique parameter by the concept of equivalent layers. One such equivalent layer technique is that recommended by Palmer and Barber (9). In this method, it is assumed that the upper- layer of thickness (h1) , modulus (E1), and Poisson's ratio (v1), may be replaced by an equivalent thickness (h1l of the base material, with E2 and v2, as follows:
Table 2. Summary of study parameters.
Parameter
Tire load, single wheel Tire pressure Asphalt layer
Thickness (h1) Modulus (E1)
Density ( 'Y 1) Poisson's ratio (µ1)
Granular base layer Thickness (h2 )
Modulus (E2) Density (-y2 )
Poisson's ratio (µ2) Subgrade layer Thickness K, K2 Density ( -y3 )
Poisson's ratio (µ3)
Value Used
9 kips 70 lbf/in2
4, 8, and 12 in 50, l 00, 500, and 1000 ki~lln2
145 lb/ft3
0.3
4, 10, and 16 in 20, 50, nnd 80 kips/in2
130 lb/ fL 3
0.4
Semi-infinite I 0, 50, and 200 kips/in 2
-0.1,-0,3, and-1.0 110 lb/fl3
0.45
Note: Total matrix size is 972 combinations.
Figure 2. Determination of E0 q (o) and E0 q (e I for specific problem input.
-;;;-.~ §
~
.~ .. .. .. Ul
" "' .. .. 00
"'
10, 000
8000
6000
4000
2000
Levels
3 4
3 3 I I
I 3 3 I l
(2)
:J 1000 Ul £ = 811 µunits -.. • '.:! .. .. " >
00 .. t.J
800
600
400
200
100
10
Note: 1 cm = 0.393 in 1mm=0.39 in 1 MPa = 0.145 kip/in2
Transportation Research Record 810
Thus, the new equivalent layer has a modulus (E2) , Poisson's ratio (v 2l, and thickness of he h1 ' + h 2. A relative stiffness value for the equivalent layer was defined as follows:
(3)
where D is termed the equivalent pavement stiffness value.
Thus, the entire pavement system could now be identified by only three parameters: D, Ki, and K2• Further multiple regressions proved that virtually the same predictive values of Eeq were obtained from expressions of the following form:
(4)
compared with the use of log h1, log E1, log h2, and log E2 individually. The correlation coefficients of the predictive models stayed almost the same with R2 values that ranged between O. 906 and 0.938. Finally, although not discussed in this report, the equivalent layer approach developed by Barros (equivalent moduli) (~) was also analyzed and found to yield identical solutions.
Partial Models
The regression models developed resulted in very uJ.y11 correlation coefficients~ however, a study of residuals from Equation 4 showed some large numerical differences between the actual and regressionpredicted Eeq values. In order to overcome this problem, separate predictive models were developed by holding constant the least-significant parameter (i.e., the variable that had the smallest correlation value). This parameter turned out to be K2. The results were improved correlations and lower residuals. The models were of the general form:
log E0 or log E0 q = f(log D, log K1 )
where K2 is a constant.
P~oblem Input
E1=690 MPa
E2
=138 MPa
h1=h2
=10 cm
K1=418,160 MPa
K2=-0.l
6• 0.28 mm
4.0
2.0
1.0
0.8
0.6
0.4
0.2
0.1
.oa
.06
.2 .. u I> -... I>
Q
" ~ ~ "' ~
(5)
E9
'1(£) • 172.4 MPa .04
100 1000
~3 - Layer Modulus (MPa)

Tra nsportat i on Research Record 810
Table 3. Summary of regression models.
Total Model (K2 included) log Eeq(or o) =Ao+ A1 log D + A2 log K1 +Al log IK2 I
Equation Ao A, A1 A3 R2
E0 q(o) -1.3262 +0.2011 +0.8316 -0.3211 0.9350
E0 (o) -0.9897 +0.1029 +0.9012 -0.5035 0.9723
Eeq(E) -1.3058 +0.1563 +0.8224 -0.6111 0.9074
E0 (e) -1.2189 +0.1372 +0.8437 -0.5955 0.9129
DEVELOPMENT OF PREDICTIVE MODELS
Table 3 summarizes the regression models developed for p r ed iction of E'.eq (witho ut overburden) or Eo (with overburden). Both t o tal and partial regression equations for Eeq<d and Eeq(6) parameters, with and wi thout overburden stress, are shown. An examination of the tabulated R2 values in the table clearly supports the accuracy of all model combinations--the lowest R2 value found was 0.9074.
The increase in accuracy provided by using the partial models (k2 = constant) can be observed to yield regression equations that have R2 values of 0.96-0 . 99 . A study of the residual errors between the total and partial models also greatly supports the partial model approach. The total models resulted in residuals in excess of 100 percent of the actual values for some cases, and the partial models reduced the maximum residuals to l ess than 20 percent; the majority of points were within the 1-10 percent limit.
Example Solut i on
The mechanics of using any of the models in Table 3 is quite direct. Units for the input values are as follows:
D in inch-pounds (he = inches and E2 = pounds per square inch),
K1 in pounds per square inch, and K2 is dimensionless.
The resul ting E'.eq value is then expressed directly in units of pounds per square inch. For example, consider if the Eeq value is desired for the condit ions noted below.
For the total model with overburden, equivalent deflection criteria are as follows:
h1 4 in, E1 100 000 lbf/in2 , and Vl 0.3;
h2 B in, E2 40 000 lbf/in2 , and v2 0.4; and
h3 = "' and E3 (Mr) .. 25 000 "d -o. If
From Table 3, the appropriate Ai coefficients for the total model -E0 (o) are shown. Thus,
E0 (0) = -0.9897 + 0.1029 +log D + 0.9012 log K1 - 0.5035 log I K2 I
h~ = h 1 [E1 (l-v22)/£i(l -v12)]1/3
= 4[(100 000/40 000) (1 - 0.16)/(1-0.09)]113 = 5.29 in
h. = h; + h2 = 5.29 + 8 = 13.29 in
Partial Model (K2 =constant) log Eeq(or o) =Bo + B1 log D + B1 log K1
K1 Bo B1 B2
-0.1 -0.4986 +0.0592 +0.9823 -0.3 -1.0069 -0.1543 +0.8965 -1.0 -1.9840 +0.3897 +0.6160 -0.l -0.3944 +0.0373 +0.9955 -0.3 -0.7043 +0.0887 +0.9389 -1.0 -1.1036 +0.1827 +0.7692 -0.1 -0.9361 +0.0464 +1.0708 -0.3 -1.1224 +o.1373 +0.9026 -1.0 -0.9284 +0.285 2 +0.4937
-0.l -0.9447 +0.0423 +1.0816 -0.3 -1.0862 +0.1213 +0.9267 - 1.0 -0.7188 +0.2479 +0.5229
D = E2 h. 3 = 40 000(13 .29)3 = 9.38x10⁷ in· lb for
D = 9.38xl07 , K 1 = 25 000, and K2 = -0.4
log E0 (0) = -0.9897 + 0.8203 + 3.9634 + 0.2004 = 3.9944
E0 (0) = 9872 lbf/in2
Nomographic Solutions
13
R2
0.9971 0.9967 0.9941 0.9977 0.9974 0.9853 0.9841 0.9794 0.9702 0.9842 0.9779 0.9592
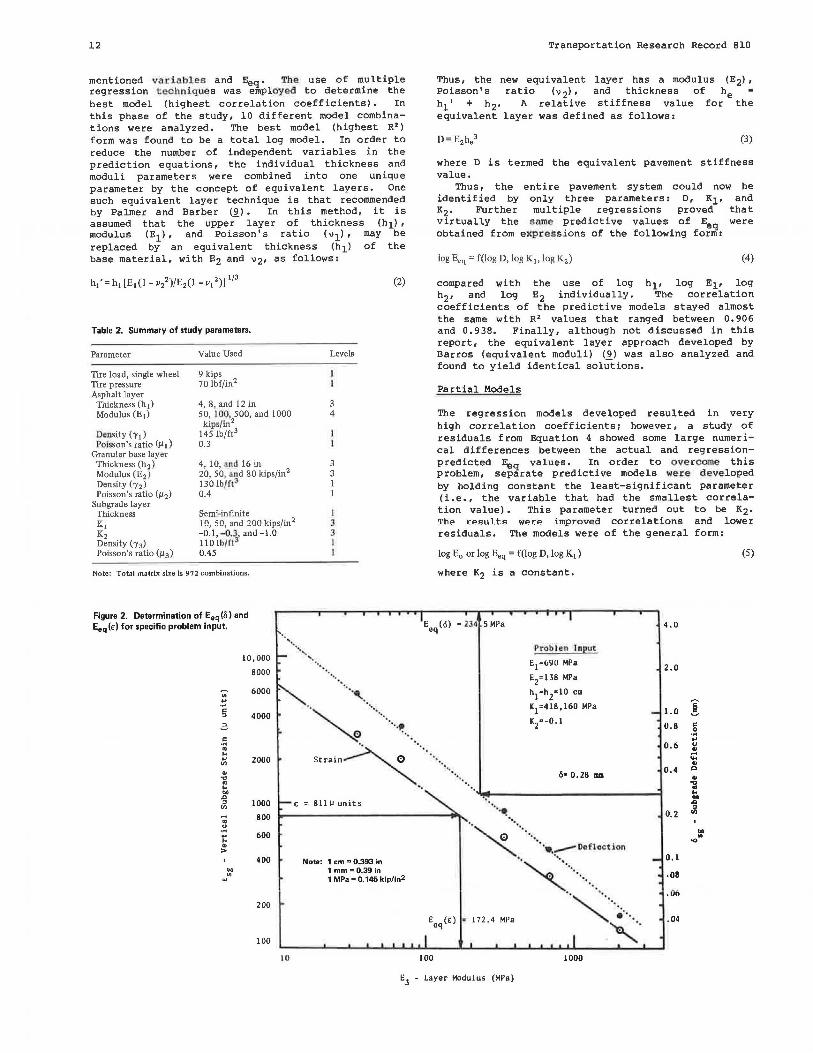
The simplicity afforded by nomographic solutions in practical analysis p r oblems is appealing. Moossazadeh (10) , presents nomographs (and their specificationsfor construction) for solutions of D as well as all 16 equations shown in Table 3. Figures 3 and 4 are solutions for the total model equations, with and without overburden effects considered for both deflection and strain-based equivalent modulus. If the more accurate partial model solutions are desired, refer to Moossazadeh (10) • The use of the partial model equations or nomographs requires that an interpolation procedure be employed for the actual 1 K21 value of the subgrade soil. The accuracy of the nomograph can be easily verified with the example problem previously presented.
DISCUSSION OF RESULTS
Effect of Parameters
.An examination of the equations in Table 3 indicates that the va lue of Eeq is di rectly dependent on all pertinent parameters. These parameters , in order of impo rtance , were Ki , K2 r h1r E1 , and h2• The value of Eeq was almost independent of E2• The result s confirm the logic that, as the value of h1 , h2, E1, or E2 increases (an increase in D), the pavement system approaches the condition of a rigid slab, which in turn, results in a decrease of "d due to the external loads within the subgrade layer. Th i s decrease, in turn, results in an increase in Eeq·
The value of Kl' howe ver , had the strongest e f£ect on Eeq · In almost all cases , the variation i n K1 contributed to more than 8 0 percent of the variation in Eeq' as measured by the correlation coefficient .
Coll!Parison of Eguivalent Subgrade Modulus Types
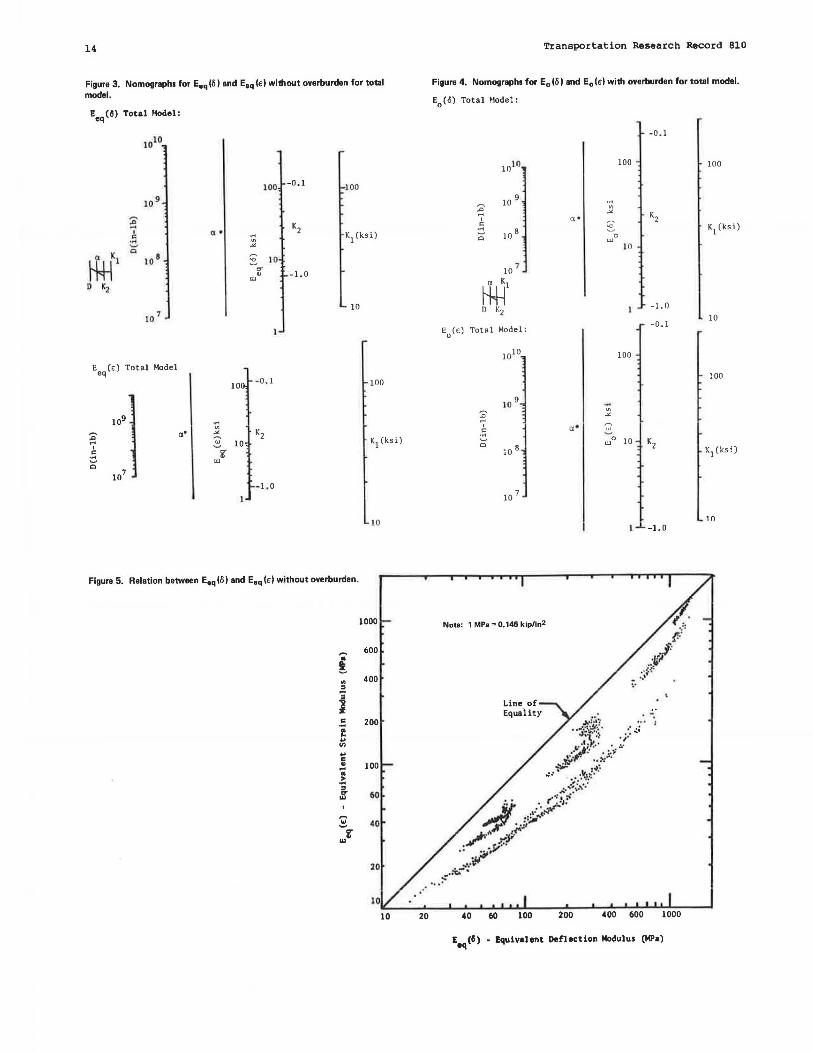
The values of Eeq <d versus Eeq(o) are presented in Figure S. As seen, all values of Eeq(o) are larger than or equal to the corresponding values of Eeq<d. The influence of
14
Figure 3. Nomograph1 for E8 q(6) and E8 q(E) without overburden for total model.
E8
q (~) Total Hodel :
100 -0.l 100
10 9
:ii' K2
' (I • .... r:: ... Vl ~ ""
K1
(ksi)
~Kl "' 10
8 ~
10 ~ .,. -1. 0 ..
w D Ki
10
10 7
E8q(E) Total Model
10 -0.1 100
109 .... Vl
K2 ~
a ' "" ~ '
~ 10 r:: g' ~ w
K1
(ksi)
"' 107
- 1.0
10
Figure 5. Relation between E8 q (I)) and E8 q (e) without overburden.
1000
~ 600
.. 400
i " 200 ·2 ..
Cl) .. " .. 100 .. .. > ... " $ 60
,.... ~
i ...
10 20
Transportation Research Record 810
Figure 4. Nomograph1 for E0 (.S) and E0(E) with overburden for total model.
E0
(6) 'i'otal Hode l :
-0, J
1010 JOO JOO
:;;' 10
9
' .~ 10 B 0
KJ(ksi)
.... Vl
"" K2 () .
~ w
0
10
10 7
a Kl
~ D K2
E0
(E) Total Model:
-l. 0
-0, J 10
1010 JOO
100
10 9
~ -Vl
"' ' ~ 0
;o B
a • .!:!. Ul
0 10 K2 Kl (ksi)
10 7
JO -1. 0
Noto: 1 MPa ~ 0.145 kip/in2
40 60 100 200 400 600 1000
E941
(a) - Equivalent Deflection Modulus (MPa)
Transportation Research Record 810 15
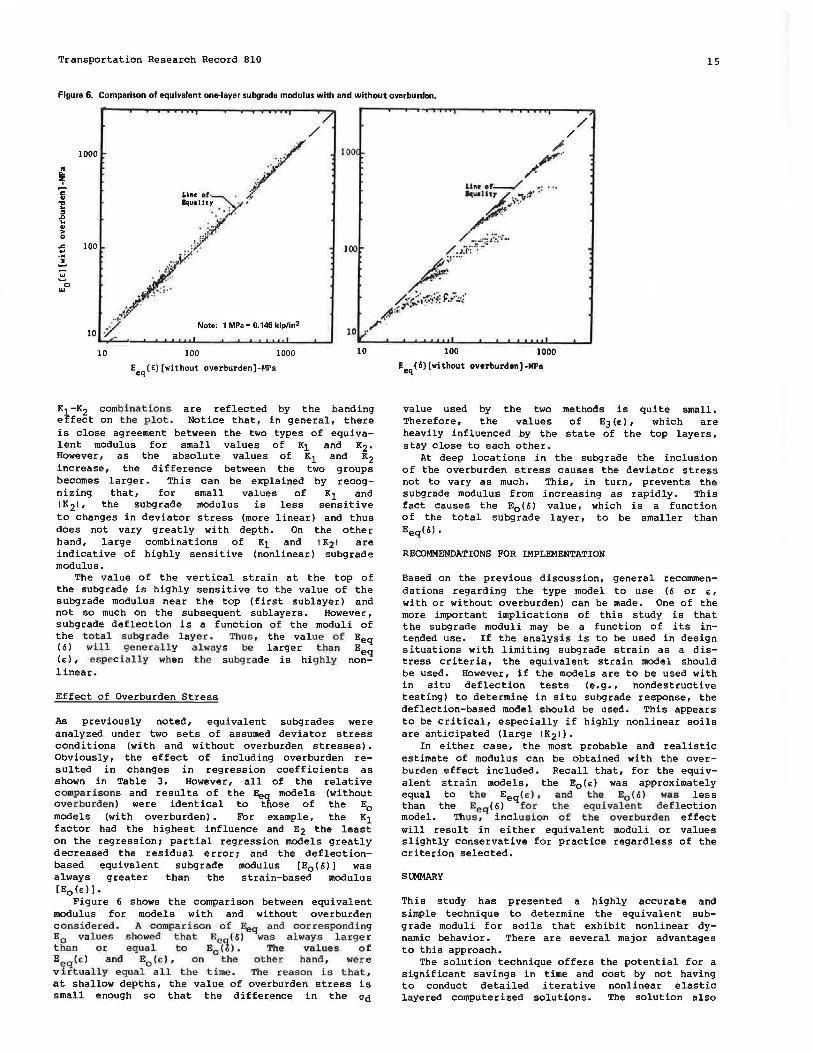
Figure 6. Comparison of equivalent one-layer subgrade modulus with and without overburden.
1000
.. ~ 'i" ... .. " .0 .. ., > 0
.r:. 100 ., ..... :!. ~
C> w
10
/ ""' ";-, .... / lqu1Ut~ .
1
~Y ,,,
·=·;· ;/' /;)
.//'·'' :;( Note: 1 MPa = 0.145 kip'.in2
10 100 1000
Eeq (£)(without overburden]-MPa
/ /
IOOC
10
K1 -K2 combinations are reflected by the banding effect on the plot . Notice that, in general, there is close agreement between the two types of equivalent modulus for small values of K1 and K2. However, as the absolute values of K1 and K2 increase, the difference between the two groups becomes larger. This can be explained by recognizing that, for small values of Ki and 1K 2 1, the subgrade modulus is less sensitive to changes in deviator stress (more linear) and thus does not vary greatly with depth. On the other hand, large combinations of K1 and I K21 are indicative of highly sensitive (nonlinear) subgrade modulus.
The value of the vertical strain at the top of the subgrade is highly sensitive to the value of the subgrade modulus near the top (first sublayer) and not so much on the subsequent sublayers. However, subgrade deflection is a function of the moduli of the ·total sobg rade layer . Thus, the value of Eeq ( 6) will generally always be larger than Eeq (£), espec ially when t he s ubgtade is highly nonlinear.
Effect of Overburden Stress
As previously noted, equivalent subgrades were analyzed under two sets of assumed deviator stress conditions (with and without overburden stresses). Obviously, the effect of including overburden resulted in changes in regression coefficients as shown in Table 3. However, all of the relative c ompa r isons and results of the E'.eq models (without overburden ) were identical to those of the E
0 models (with overburden). For example, the Ki factor had the highest influence and E2 the least on the regression; partial regression models greatly decreased the residual error; and the deflectionbased equivalent subgrade modulus [E0 (6)] was always greater than the strain-based modulus [Eo(E)].
Figure 6 shows the comparison between equivalent modulus for models with and without overburden c onsidered . A c omparison of Eeq and corresponding E0 va l ues showed that E·eq f6) was always large r t han or equal to E0 (6). The vaiues o f Eeq<d and E0 (t), on the other ha·nd , wer e v irtua lly equal all the time . The mason is that , at shallow depths, the value of overburden stress is small enough so that the difference in the od
100
/ , ..
/
1000
Eeq(6)[without overburden]-MPa
/ /
value used by the two methods is quite small. Therefore, the values of EJ(£), which are heavily influenced by the state of the top layers, stay close to each other.
At deep locations in the subgrade the inclusion of the overburden stress causes the deviator stress not to vary as much. This, in turn, prevents the subgrade modulus from increasing as rapidly. This fact causes the E0 ( 6) value, which is a function of the total subgrade layer, to be smaller than Eeq(6).
RECOMMENDATIONS FOR IMPLEMENTATION
Based on the previous discussion, general recommendations regarding the type model to use (6 or £, with or without overburden) can be made. One of the more important implications of this study is that the subgrade moduli may be a function of its intended use. If the analysis is to be used in design situations with limiting subgrade strain as a distress criteria, the equivalent strain model should be used. However, if the models are to be used with in situ deflection tests (e.g., nondestructive testing) to determine in situ subgrade response, the deflection-based model should be used. This appears to be critical, especially if highly nonlinear soils are anticipated (large 1K21).
In either case, the most probable and realistic estimate of modulus can be obtained with the overburden effect included. Recall that, for the equivalent strain models, the E0 (£) was approximately equal to the Eeq ( e) , and the E0 ( 6 ) was less than the Eeq < 6) for the equiva lent deflection model. Thos , inclusion of the o verbu r den effect will result in either equivalent moduli or values slightly conservative for practice regardless of the criterion selected.
SUMMARY
This study has presented a highly accurate and simple technique to determine the equivalent subg rade moduli for soils that exhibit nonlinear dynamic behavior. There are several major advantages to this approach.
The solution technique offers the potential for a significant savings in time and cost by not having to conduct detailed iterative nonlinear elastic layered computerized solutions. The solution also

16
Figure 7. Summary of equivalent granular base and subgrade modulus as functions of asphalt concrete surface thickness and modulus.
.... "' "' I
"' " s "C
~ .. " >-"' _, ... " " ~ "' .;: g. "'
60
so
40
30
20
Transportation Research Record 810
llJ'( var inbJ e) , E1 (var iable ) } I r I
h2=8" ; Ez(MR)=l0,000 90.S
~;"
Legend : E1= 100 ksi ---
E1 • 500 ksi
E1=1000 ksi
·······"*""} if!.·······:;.:.::.::: .. ___._ Subgrnd<' .... ;:;::::..-·· 10 ••• - .........0--~-·-· · ·· .. --<>-t==•::· .
0
provides a basis for quick determination of single subgrade modulus values for nonlinear soils for use in pavement design charts such as found in the Shell Oil, the Asphalt Institute, or even American Association of State Highway and Transportation Officials (AASHTO) design schemes. The results of this study can also be used to evaluate the influence of various layer pavement parameters (hi and Ei) on the equivalent subgrade modulus.
This study on nonlinear subgrade soils followed the study concepts used by Smith <.!> to predict equivalent granular base moduli. The results of the two studies were intended to allow the combination of their predictive equations to quickly and accurately determine the simultaneous solution of both unbound granular and subgrade soil nonlinear moduli problems. Figure 7 shows the results of such a sample solution by using nonlinear moduli properties for both the granular base and subgrade from predictive equations developed in this study and Smith's work (1). Note that the values shown in the figure were computed manually for the sample pavement cross section noted.
Finally, the solution presented allows examin.:i.tion of the probable levels of the subgrade deviatoric stress for any given pavement structure. The technique for this is best illustrated by referring to the example problem previously worked. For a K1 25 000 and K2 -0 . 4, the E0 (6) was found to be 9872 lbf/in 2 • Because
(6)
the deviator stress (ad) can be easily computed to be aa = 10.2 lbf/in 2 •
3 4 6 9 10 11 12 13 14 15
h1 (A.c. Surface Thickness ) - inches
ACKNOWLEDGMENT
We are indebted to the Asphalt Institute, through the B. Gray grant, for making this research study possible. In addition, a generous grant provided by the University of Maryland Computer Science Center, which allowed the computer study to be conducted, is greatly appreciated.
REFERENCES
1. B.E. Smith. Prediction of Equivalent Granular Base Moduli Incorporating Stress Dependent Behavior in Flexible Parameters. Univ. of Maryland, College Park, M.S. thesis, 1970.
2. H.J. Treybig, B.F. McCullough, F.N. Finn, R. McComb, and W.R. Hudson. Design of Asphalt Concrete Overlays Using Layer Theory. Proc., 4th International Conference on Structural Design of Asphalt Pavements, Univ. of Michigan, Ann Arbor, Vol. 1, 1977.
3. M.P. Jones. Analysis of and Pavement Fatigue on Road. Univ. of Maryland, thesis, 1975.
the Subgrade Modulus the San Diego Test
College Park, M.C.
4. M. R. Thompson and Q. L. Robnett. Final Report-Data Summary: Resilient Properties of Subgrade Soils. Univ. of Illinois, Urbana, Rept. UILU-ENG-76-2009, 1976 .
5. M.R. Thompson and Q.L. Robnett. Final Report: Resilient Properties of Subgrade Soils. Univ. of Illinois, Urbana, Rept. UILU-ENG-76-2009, 1976.
6. M.R. Thompson and Q.L. Robnett. Interim Re~
port: Resilient Properties of Subgrade Soils, Phase !--Development of Testing Procedure.

Transportation Research Record 810
Univ. of Illinois, Urbana, Rept. UILU-ENG-73-2010, 1973.
7. K.R. Bell. Predicted Flexible Pavement Remaining Life Interpreted from Various Analytical Procedures. Univ. of Maryland, College Park, M.S. thesis, 1976.
8. J. Michelow. Analysis of Stresses and Displacements in an N-Layered Elastic System Under a Load Uniformly Distributed on a Circular Area. California Research Corp., Richmond, CA, 1963.
17
9. H.G. Poulos and E.H. David. Elastic Solutions for Soil and Rock Mechanics. Wiley, New York, 1972.
10. J. Moossazadeh. Determination of F.quivalent Subgrade Moduli for Soil Exhibiting Non-Linear Dynamic Behavior. Univ. of Maryland, College Park, M.S. thesis, 1978.
Publication of this paper sponsored by Committee on Flexible Pavement Design.
Analysis of Pavements with Granular Bases S.F. BROWN ANDJ.W. PAPPIN
The nonlinear stress-strain response of unbound granular materials has to be modeled satisfactorily when numerical analysis is used for pavement structures that contain significant quantities of such material. The simple model, which has been used widely for the purpose of relating resilient modulus to the sum of the principal stresses, has serious limitations. This is because the triaxial tests used in its development do not cover an adequate range of stress paths when compared with the situation in the pavement. A more complex and accurate model is described that has been developed from extensive laboratory repeated load testing. It is expressed in terms of shear and volumetric stress-strain relationships. The need for better modeling of cohesive soils for analysis is also discussed and the importance of the principle of effective stress is emphasized. A new finite-element program is described and its main features are explained. It uses a secant modulus approach, has been specifically developed to deal with nonlinear materials, and is called SENOL for secant modulus nonlinear. The use of the new granular material models for the threedimensional stress system in a pavement is discussed and results from analyses with SENOL are compared with in situ measurements from a test pavement.
Most of the development work concerned with the use of theoretical analysis in flexible pavement design has concentrated on accurate modeling of the asphalt layer. Simplifying assumptions are often made concerning the mechanical properties of the unbound granular layer and the subgrade soil. This situation is a reflection of the relative states of knowledge concerning the various materials together with a need to produce design methods that are not unduly complex.
The existence of nonlinear stress-strain characteristics for granular materials and soils has been well known for many years, and numerous papers have reported experimental data, mainly from laboratory repeated load tests (e.g., 1,2). The increasing use of finite-element analysis -h;s provided a means of more accurate modeling of nonlinear materials within pavement structures, but the full potential of the method has often not been realized. Recent work at the University of Illinois (}) represents an improvement to the finite-element approach since the analysis considers failure conditions and has been used to generate data for use in simplified design charts (4). However, the nonlinear stress-strain relation;- that have been used are not really adequate for analysis of a three-dimensional system, even an axisymmetric one. The approach reported here describes a more-detailed method of characterizing granular materials and discusses the use of this in a finite-element, secant modulus nonlinear (SENOL) program, which has been recently developed.
CHARACTERIZATION OF GRANULAR MATERIALS
In general, an element of material in the granular
layer of a pavement is subjected to three principal stresses: 011 02• and 031 where o1 > 02 > a 3• Each stress consists of two components, a constant value due to overburden and a transient value due to the passing wheel load.
Use of the repeated load triaxial test to obtain data on the resilient characteristics of granular materials implies that two of the stresses are equal because of axial symmetry. If, however, the stresses are expressed in invariant form, this difficulty can be partly overcome (5).
Most research in this field h;s involved tests with a constant confining stress and a deviator stress applied repeatedly by pneumatic or servohydraulic actuators between zero and a peak value. Various peak values have been used at a range of confining stresses and a well-established relationship has emerged to relate resilient modulus (Mrl to stress level:
in which
M, =q,/e3 ,
where qr is oc and ear strain.
where
a repeated stress given by is resilient (recoverable)
peak axial stress, constant confining stress, and material constants.
(!)
(2)
0 ar -axial
(3)
Confusion has often arisen over the use of F.quation 1 because the factor K1 is not dimensionless. Furthermore, distinction is rarely made between total stress and effective stress. Al though this is of no consequence for dry materials, it is of fundamental importance when pore water is present.
Figure 1 shows a typical stress path in triaxial stress space for a test of the type described above. The parameters used are mean normal effective stress [p' = (l/3)(oa' +2oc'll and the deviator stress (q). The tests are assumed to have been carried out on dry material, so that no pore pressures are generated and, hence, the path in Figure 1 represents effective stress.