nonincome welfare and inclusive growth in south …
TRANSCRIPT

AFRICA GROWTH INITIATIVE
WORKING PAPER 18 | MARCH 2015
NONINCOME WELFARE AND INCLUSIVE GROWTH IN SOUTH AFRICA
Haroon Bhorat, Benjamin Stanwix and Derek Yu


NONINCOME WELFARE AND INCLUSIVE GROWTH IN SOUTH AFRICA iii
Haroon Bhorat is the director of the Development Policy
Research Unit (DPRU) at the University of Cape Town
and a nonresident senior fellow at the Africa Growth
Initiative at the Brookings Institution.
Benjamin Stanwix is a researcher at the DPRU.
Derek Yu is a researcher at the DPRU.
Authors’ Note:
The Africa Growth Initiative (AGI) at the Brookings Institution engages in quality policy analysis with six leading
African think tanks. With the help of these partner think tanks, AGI and Brookings tap into the latest trends and data
from the region, access local expertise and knowledge, and work to elevate the voice of African scholars in policy
discussions in Washington and across the globe.
This working paper is authored by scholars from AGI’s partner think tank, the Development Policy Research Unit
(DPRU) at the University of Cape Town.
The Development Policy Research Unit is a university-recognized research unit within the School of Economics
at the University of Cape Town. The DPRU has been actively engaged in policy-relevant socio-economic research
since 1990, establishing itself as one of South Africa’s premier research institutions in the fields of labor markets,
poverty and inequality. http://www.dpru.uct.ac.za

iv GLOBAL ECONOMY AND DEVELOPMENT PROGRAM
CONTENTS
Introduction . . . . . . . . . . . . . . . . . . . . . . . . . . . . . . . . . . . . . . . . . . . . . . . . . . . . . . . . . . . . . . . . . . . . . . . . . . .1
Data and Methodology . . . . . . . . . . . . . . . . . . . . . . . . . . . . . . . . . . . . . . . . . . . . . . . . . . . . . . . . . . . . . . . . . 3
Descriptive Overview of Changes in Access to Services and Assets . . . . . . . . . . . . . . . . . . . . . . . . . . 7
Derivation of the Asset Index . . . . . . . . . . . . . . . . . . . . . . . . . . . . . . . . . . . . . . . . . . . . . . . . . . . . . . . . . . 10
Changes in Nonincome Welfare, 1993–2010/11 . . . . . . . . . . . . . . . . . . . . . . . . . . . . . . . . . . . . . . . . . . . . 12
Conclusion . . . . . . . . . . . . . . . . . . . . . . . . . . . . . . . . . . . . . . . . . . . . . . . . . . . . . . . . . . . . . . . . . . . . . . . . . . . .17
Appendix . . . . . . . . . . . . . . . . . . . . . . . . . . . . . . . . . . . . . . . . . . . . . . . . . . . . . . . . . . . . . . . . . . . . . . . . . . . . 18
References . . . . . . . . . . . . . . . . . . . . . . . . . . . . . . . . . . . . . . . . . . . . . . . . . . . . . . . . . . . . . . . . . . . . . . . . . . 30
Endnotes . . . . . . . . . . . . . . . . . . . . . . . . . . . . . . . . . . . . . . . . . . . . . . . . . . . . . . . . . . . . . . . . . . . . . . . . . . . . 32

NONINCOME WELFARE AND INCLUSIVE GROWTH IN SOUTH AFRICA v
LIST OF TABLES
Table 1 . Proportional Changes in Ownership of Private Assets by Quintile, 1993–2010/11 . . . . . . . . . 8
Table 2 . Proportional Changes in Ownership of Household Services by Quintile, 1993–2010/11 . . . . .9
Table 3 . Mean Value of the Nonincome Welfare Index by Income Quintile . . . . . . . . . . . . . . . . . . . . . . .11
Table 4 . Overlap between Nonincome Welfare Index Quintiles and Real Per Capita Income Quintiles (percent) . . . . . . . . . . . . . . . . . . . . . . . . . . . . . . . . . . . . . . . . . . . . . . . . . .11
Table 5 . Nonincome Poverty Shifts by Race, Gender of Household Head and Geographic Region, 1993–2010/11 . . . . . . . . . . . . . . . . . . . . . . . . . . . . . . . . . . . . . . . . . . . . . . . . . . . . . . . . . . 13
Table A1 . Mean Real Per Capita Monthly Income in Rand (2010 prices), by Quintile . . . . . . . . . . . . . 18
Table A2 . Number of Households Owning Each Private Asset, 1993–20/11 . . . . . . . . . . . . . . . . . . . . . . 19
Table A3 . Number of Households in Each Household Asset Category by Quintile, 1993–2010/11 . . . . . . . . . . . . . . . . . . . . . . . . . . . . . . . . . . . . . . . . . . . . . . . . . . .20
Table A4 . Proportional Changes in Highest Educational Attainment of Household Heads by Quintile, 1993–2010/11 . . . . . . . . . . . . . . . . . . . . . . . . . . . . . . . . . . . . . . . . . . .24
Table A5 . Number of Households in Each Educational Attainment Category, 1993–2010/11 . . . . . . 25
Table A6 . Scoring Coefficients and Summary Statistics for Variables included in the Nonincome Welfare Index . . . . . . . . . . . . . . . . . . . . . . . . . . . . . . . . . . . . . . . . . 26
Table A7 . Share of the Poor by Race, Gender of Household Head, Area Type of Residence and Income Quintile, 1993–2010/11 . . . . . . . . . . . . . . . . . . . . . . . . . . . . . . . . . . . . . . . 27
LIST OF FIGURES
Figure 1 . Cumulative Distribution Functions for All Households, Using Real Per Capita Income . . . . . . . . . . . . . . . . . . . . . . . . . . . . . . . . . . . . . . . . . . . . . . . . . . . . . . . . . 14
Figure 2 . Cumulative Distribution Functions for All Households, Using Nonincome Welfare . . . . . . . 15
Figure 3 . Cumulative Distribution Functions by Per Capita Income Household Quintile . . . . . . . . . . . 16
Figure A1 . Cumulative Distribution Functions by Gender of Household Head . . . . . . . . . . . . . . . . . . . 28
Figure A2 . Cumulative Distribution Functions for African and Coloured Households . . . . . . . . . . . . 29


NONINCOME WELFARE AND INCLUSIVE GROWTH IN SOUTH AFRICA 1
NONINCOME WELFARE AND INCLUSIVE GROWTH IN SOUTH AFRICA
Haroon Bhorat, Benjamin Stanwix and Derek Yu
INTRODUCTION
A number of wide-ranging economic reforms were in-
troduced in South Africa after the demise of apartheid.
These reforms aimed at, among other things, macro-
economic stability, economic growth, job creation and
poverty reduction. The new democratic government
repeatedly emphasized that the provision of free basic
services—such as water, electricity, sanitation and hous-
ing—to previously disadvantaged groups was a key
policy objective. In addition, Section 2 of the country’s
constitution identifies a set of socioeconomic rights that
include housing, water and education. Nonetheless,
most of the attempts to measure broad changes in the
welfare of South Africans since 1994 have understand-
ably focused on the private returns to economic growth,
and in doing so attention remains primarily on income- or
expenditure-based measures of well-being. Studies fo-
cused on these money-metric measures find that income
poverty worsened over the period between South Africa’s
transition to democracy until about 2000 and 2001, and
that since then a continuous but slow downward trend
has been observed. Such findings are consistent regard-
less of the datasets used (Ardington, Leibbrandt, and
Welch 2005; Hoogeveen and Özler 2006; Leibbrandt et
al. 2006; Van der Berg, Louw, and Du Toit 2008).
In contrast to the valuable work on money-metric mea-
sures of economic progress, only a limited number of
studies have focused on well-being in terms of access
to assets and services over a similar period. Yet this is
an important component in understanding the extent
to which economic growth in South Africa has been
inclusive, or pro-poor. Burger and colleagues (2004),
Bhorat, Naidoo, and Van der Westhuizen (2006), and
Bhorat and Van der Westhuizen (2009) attempted the
first non-money-metric assessments of welfare for the
post-apartheid period. Using a variety of empirical ap-
proaches, these researchers find significant declines in
the levels of nonincome poverty. Two recent additions
to the South African literature are Schiel (2012) and
Finn, Leibbrandt, and Woolard (2013). Schiel (2012),
in a dissertation, examines poverty levels using both
money-metric and non-money-metric techniques to
assess welfare gains, while Finn, Leibbrandt, and
Woolard (2013) construct a measure of multidimen-
sional poverty, based on the work of Alkire and Foster
(2011) and Alkire and Santos (2011), and analyze
changes between 1993 and 2010. Their index includes
information on health, education and a variety of mea-
sures of living standards, and they find strong declines
in multidimensional poverty.

2 GLOBAL ECONOMY AND DEVELOPMENT PROGRAM
Building on previous work, this paper seeks to con-
tribute to a more comprehensive understanding of
changes in nonincome welfare over an 18-year pe-
riod in South Africa, from 1993 to 2010. While the
existing literature reveals increased delivery of basic
services by the government since 1994, there has
been a fairly narrow focus on so-called public as-
sets, such as the state’s provision of housing, water
and electricity. Most studies exclude information on
private assets, such as whether a household has a
stove, a refrigerator, a television set, a vehicle and
so on. We believe that these are relevant indicators
of economic welfare. In addition, most of the stud-
ies mentioned here do not address the contribution
that increased access to education makes to overall
well-being. Hence, in an attempt to extend the reach
of existing research, this paper seeks to offer a more
nuanced understanding of the role that assets—both
public and private—and services have played in
postapartheid welfare in South Africa. Specifically,
using information on both public and private assets,
as well as education, we create a welfare measure
to investigate shifts in nonincome poverty between
1993 and 2010. In addition to analyzing aggregate
shifts, we examine changes across different income
quintiles in the distribution. To construct a nonin-
come welfare index, we use the technique of princi-
pal components analysis (PCA), which allows us to
aggregate over our set of chosen variables.
The paper is structured as follows. The second sec-
tion provides a brief overview of the data we use and
the PCA methodology. The third section presents a
descriptive summary of the various changes in ac-
cess to assets and services during the period being
considered. The fourth section explains the results of
the PCA that was undertaken. The fifth section then
examines the major changes in nonincome welfare
that have taken place, and finally the sixth section of-
fers brief conclusions.

NONINCOME WELFARE AND INCLUSIVE GROWTH IN SOUTH AFRICA 3
DATA AND METHODOLOGY
Data
Two sources of data were used in the analysis: the 1993 South African Integrated Household Survey, from the
Project for Statistics on Living Standards and Development (PSLSD), and the 2008 and 2010/11 reports from
the National Income Dynamics Study (NIDS). Both surveys were conducted by the Southern Africa Labour and
Development Research Unit (SALDRU), based at the University of Cape Town’s School of Economics.
The PSLSD collected information on the conditions under which South Africans lived in 1993 and was intended to
provide policymakers with the data required for planning strategies to implement the goals outlined in the govern-
ment’s Reconstruction and Development Programme. The survey data, which were released in 1994, cover a wide
range of indicators on standards of living. Households taking part in the survey submitted detailed information on
demographics, employment status, income (from employment and nonemployment sources), spending (food and
nonfood), health and perceived quality of life. In addition, a community questionnaire was run in each geographical
cluster of the sample to capture information on the availability of facilities to the community in each cluster, such as
infrastructure, education, health and recreational amenities. A total of 8,809 households took part in the PSLSD,
and when the survey weights are applied, this amounts to approximately 7.82 million households. All the data pre-
sented in this paper are weighted at the household level.
The NIDS is South Africa’s first national panel study of individuals across all ages. The main objective of NIDS is to
measure and understand who is getting ahead and who is falling behind in South Africa, and to do this, the survey
has five main focus areas: the incomes and expenditures of households and individuals, the assets owned by the
household and the household’s access to services, individual educational attainment and health status, labor mar-
ket status, and membership of community groups. In terms of coverage, 7,301 and 6,809 households, respectively,
took part in NIDS 2008 and NIDS 2010/11. When weighted, these numbers are 12.80 million (2008) and 13.26
million (2010/11), and again, the weighted numbers are used in this analysis.
There are several reasons for using these two surveys in order to analyze nonincome poverty, as opposed to sur-
veys such as the General Household Surveys, the Income and Expenditure Surveys, and the National Censuses.
The first reason is that both the PSLSD and the NIDS include comprehensive questions on public assets and
private asset ownership, which are critical for our paper. Second, these surveys contain detailed asset informa-
tion that goes beyond a simple summation of public and household assets—extending to, for example, the type
of material used for housing, the kind of toilet to which household members have access and the source of fuel
used for cooking. Third, the 18-year gap that these surveys allow us to analyze is a sufficiently lengthy time frame
within which to explore whether there have been substantial changes in economic welfare. Finally, in the case of
South Africa, the 1993 PSLSD serves as a snapshot of the nonincome welfare of South African households just
before the democratic transition, while the 2008 and 2010/11 NIDS are fairly reliable benchmarks for contemporary
households after almost two decades of democracy.

4 GLOBAL ECONOMY AND DEVELOPMENT PROGRAM
As in any empirical inquiry of this nature, potential data problems must be noted at the outset. In our case, in the
NIDS 2010/11 data, there is a problem of racial representativeness due to a significantly decreased sample of
white-headed households, which fell from 550 in the 2008 survey to 300 in 2010/11. While we rely on the house-
hold weights to adjust for this, it does decrease the precision of our estimates for this group.
Methodology
There are several possible approaches that allow one to aggregate over a range of different variables and derive
a unidimensional measure of socioeconomic welfare. When dealing with asset ownership, one such approach—
and the most basic one—is to simply add up the number of assets that a household owns by giving equal weight
to each asset. However, despite its simplicity, this method masks the fact that the imposition of equal weights for
each asset is completely arbitrary. For example, should having a car be comparable to having electricity? Equal
weighting also makes it more difficult to include measures of quality, for assets or services, when there are more
than two quality options (McKenzie 2005). Therefore, more complex statistical approaches are usually adopted to
determine the most appropriate weight for each variable, the most common being PCA, factor analysis and mul-
tiple correspondence analysis.
Among these options, PCA is an appealing method—for several reasons. First, it is relatively intuitive as a way to
extract shared information from a set of variables that are interrelated. As Filmer and Pritchett (2001, 116) explain,
“The first principal component of a set of variables is the linear index of all the variables that captures the largest
amount of information that is common to all the variables.” The technique used is, in fact, similar to a regression
analysis in terms of “minimizing residuals”; but in the case of PCA, the residuals are measured against all the vari-
ables instead of just one dependent variable. Second, the weights assigned to each component in the analysis
have a fairly simple interpretation, since the weight given to any variable is related to how much information it pro-
vides about the other variables. For example, if ownership of one type of asset is highly indicative of ownership of
other assets for a given population, these assets receive a positive weight and vice versa. Moreover, assets that
are more unequally distributed across households would be given greater weight in PCA. An asset that all house-
holds own or no households own (i.e., zero standard deviations) would be given zero weight when deriving the
index, since it explains none of the variation across households. Finally, in terms of interpretation, a variable with
a positive weight is associated with higher socioeconomic status (SES).
Our choice of PCA also follows from the fact that this method has been used in numerous South African and
international studies. Van der Berg, Nieftagodien, and Burger (2003) construct an index using PCA from the
2000 Income and Expenditure Survey to investigate whether consumption in black households was systemati-
cally different from consumption in white households due to an asset deficit. As noted, Schiel (2012) use PCA
to create a non-money-metric index from the 1993 PSLSD and 2008 NIDS data. In the international literature,
the PCA approach has often been used to create a proxy for the level of SES based on access to, or owner-
ship of, various public and private assets (Schroeder, Kaplowitz, and Martorell 1992; Pollitt et al. 1993). PCA
has also been used by Filmer and Pritchett (2001) and McKenzie (2005) to examine the relationship between

NONINCOME WELFARE AND INCLUSIVE GROWTH IN SOUTH AFRICA 5
household wealth and children’s school enrollment, while Paxson and Schady (2005) use PCA to derive an
SES index to investigate the relationship between a household’s socioeconomic status and language ability
of children in Ecuador. Vyas and Kumaranayake (2006) also adopt PCA to investigate nonincome welfare dif-
ferences across geographic regions in Brazil and Ethiopia.
Specifically, PCA is a multivariate technique first used by Karl Pearson in 1901 and can be explained as follows:1
Let )',...,,( 21 nxxxx = be a vector of asset indicators. It is expected that ownership of different assets or ac-
cess to various services will be highly correlated across households, so that a single summary measure should
account for a reasonable amount of the cross-household variation in nonincome welfare. Hence, PCA solicits a
linear combination of variables such that the maximum variance is extracted from these variables. This method is
applied several times, with each application extracting variation from the data that were unexplained by the previ-
ous application, and forming the eigenvectors of the covariance matrix, or principal components. The components
are ordered so that the first component explains the largest possible amount of variation in the data, subject to
the constraint that the sum of the squared weights is equal to 1. The second component, being completely uncor-
related with the first component, explains additional but smaller variation than the first component, subject to the
same constraint. This is repeated until all the variation is explained by the “principal components.” The higher the
degree of correlation among the variables, the fewer the components required to explain the variation.
In equation terms, the first principal component, , stands for the linear combination of the asset vector, such that
+++=n
nnn s
xxxxxx ...2
222
1
111
,
subject to the constraint that 1' = , where i is a vector of scoring coefficients or weights, and i
is the
sample standard deviation of the asset ix with mean of .ix Furthermore, data in categorical form are not
suitable for PCA, as “the categories are converted into a quantitative scale which does not have any meaning,”
(Vyas and Kumaranayake 2006, 463). Hence, qualitative categorical variables are recoded into binary vari-
ables, before PCA is conducted to derive an asset index. As a result of the standardization of the variable, has a 0 mean and a variance of 2, which is the largest eigenvalue of the correlation matrix between the
various assets. In case the assets are indicated in the form of a dummy variable, ii / captures the effect
of ownership of asset ix on the asset index .
In this study, three categories of variables were used to construct the nonincome welfare index: household char-
acteristics and access to services, household private assets and the educational attainment of household head.
Regarding access to service, there are seven household characteristics variables: 1. Type of dwelling (formal,
traditional, informal), 2. Type of roof material (bricks, tile, asbestos, corrugated, thatch, other inferior-quality ma-
terial2), 3. Type of wall material (high-quality,3 medium-quality,4 and low-quality materials5), 4. Source of water
(piped water, public tap, borehole, and surface water), 5. Sanitation facility (flush or chemical toilet, pit latrine
with ven tilation, pit latrine without ventilation, bucket latrine, none), 6. Fuel source for cooking (electricity, gas,
paraffin or coal, wood or dung), and 7. Fuel source for lighting (electricity, paraffin, candles, other). The house-

6 GLOBAL ECONOMY AND DEVELOPMENT PROGRAM
hold private asset variables consist of a vehicle (including a car, bakkie [light delivery vehicle], truck, motorcycle
and scooter), radio (including a hi-fi stereo, CD player and MP3 player), television, telecommunications (includ-
ing both landline telephones and cellular phones), refrigerator (including a freezer) and stoves (including an
electric stove, gas stove, primus cooker and paraffin stove). The educational attainment of the household head
is simply measured by the years of schooling completed.
One common drawback of using asset measures is that the ownership of assets, or access to the services men-
tioned, does not always accurately indicate quality. For example, public access to piped water that only runs for
a few hours a day is appreciably different from consistent access to water in a private home. The data we have
do not capture these differences. However, the variation in each type of asset/service that we do have does al-
low for some measure of quality, albeit a cruder one than we would like. Moreover, Falkingham and Namazie
(2002) point out that in many countries the problem of quality does not significantly alter the overall picture of
wealth, which is our overarching focus here. A related concern in this paper is the classification of dwelling cat-
egories from the survey data into three distinct dimensions: formal, traditional and informal. In some cases, for
example, dwellings were classified into a category called “combination of buildings,” which makes it difficult to
assign a measure of quality. Here we decided that households staying in combination buildings that had high-
quality or medium-quality wall materials were most likely formal and traditional dwellings, respectively; the re-
maining households (made from low-quality materials) were assumed to be informal dwellings.

NONINCOME WELFARE AND INCLUSIVE GROWTH IN SOUTH AFRICA 7
DESCRIPTIVE OVERVIEW OF CHANGES IN ACCESS TO SERVICES AND ASSETS
Changes in the Ownership of Private Assets
For our analysis, households have been divided into five
quintiles based on their per capita income in each sur-
vey; table A1 in the appendix shows the currency values
(in 2010 prices) for these quintile boundaries in all three
survey years. Before discussing the results of the PCA,
we examine how access to various assets and services
has changed between the surveys.6 First, the propor-
tion of households with access to each private asset is
presented in table 1 (the absolute numbers are shown
in table A2 in the appendix). This table reveals some
large and important shifts over time; and when reading
the percentage changes in the table, it is also crucial to
note that in absolute terms, there was an increase in the
number of households with access to all private assets.
Put differently, in the years 2010/11, for each private as-
set, access increased in absolute terms.
Table 1 reveals that the most common asset owned
among all households in the 1993 PSLSD was a
stove (over 80 percent of households had a stove,
even in quintile 5, the poorest quintile). However, in
the 2010/11 NIDS, telephones had become the most
common asset. In fact, the largest increase in asset
access was in telecommunications, in both abso-
lute terms (an increase of 9.39 million households)
and relative terms (an increase of 59.65 percent-
age points). The proliferation of cellular phones is
surely the major driver of this growth. In contrast to
this trend, there were slight decreases in the propor-
tion of households with vehicles, radios and stoves
between the two surveys. The greatest decrease
here was in radio ownership (–10.05 percent), but
this finding could be due to the fact that in many
households, stand-alone radios have been replaced
with cellular phones, computers or other devices
that perform the same function. The decrease in ac-
cess to vehicles and stoves, however, is less easily
explained.
Changes in Access to Household Services
Table 2 shows the proportional changes in access to
high-quality household assets and services in each
category (e.g., formal housing in the “dwelling type” cat-
egory), while table A3 in the appendix shows the number
of households for the full quality range in every asset and
service. First, table 2 reveals a relatively rapid increase
in the proportion of households using electricity as their
fuel source for cooking (from 45.77 to 80.05 percent) and
as their source for lighting (from 52.65 to 87.01 percent)
between 1993 and 2010/11. Moreover, the proportion of
households with access to piped water and a flush/chem-
ical toilet increased by approximately 20 percent and 15
percent, respectively. In all categories, the greatest shifts
are evident in the lower income quintiles.
These trends are to be expected and largely reflect
the impact of government efforts to ensure the provi-
sion of basic services, particularly for poorer areas,
since the mid-1990s. For instance, the government
aims to provide electrification to all households in
the country and to provide free basic electricity (50
kilowatt-hours per household) to poor households
(Department of Minerals and Energy 2003; National
Treasury 2003). The Housing Subsidy Programme
identified the provision of low-cost housing as one
of the government’s core pro-poor programs since
1994 (National Treasury 2003). Finally, the govern-
ment has also prioritized free access to water, of up
to 6 kilolitres per household, alongside access to
toilets (National Treasury 2003). While these are, of
course, only aspirational policy objectives, the data
suggest that much progress has indeed been made
on these fronts.

8 GLOBAL ECONOMY AND DEVELOPMENT PROGRAM
Table 1 . Proportional Changes in Ownership of Private Assets by Quintile, 1993–2010/11
Quintile Vehicle Radio TV Set Telephone Refrigerator Stove
PSLSD 1993 (%)
1 5.27 68.96 15.68 2.09 10.10 80.05
2 7.11 75.01 29.83 5.84 21.25 82.93
3 14.56 78.43 48.59 17.45 39.92 87.31
4 34.31 79.85 59.14 35.94 54.37 85.60
5 77.33 92.79 84.16 74.93 83.02 91.09
All households 27.72 79.01 47.48 27.25 41.73 85.40
NIDS 2008 (%)
1 4.54 63.02 48.70 80.85 33.26 67.79
2 7.18 77.72 61.74 83.95 51.35 78.91
3 12.75 78.16 63.44 83.29 51.22 80.62
4 27.09 82.58 74.11 90.92 65.68 85.81
5 70.40 92.75 88.58 97.75 86.68 90.70
All households 24.38 78.84 67.31 87.35 57.63 80.76
NIDS 2010/11 (%)
1 3.44 61.64 57.72 80.23 46.46 72.33
2 6.88 62.44 63.51 82.72 52.80 77.45
3 10.22 66.76 68.93 82.80 60.15 81.67
4 29.85 72.46 74.04 91.14 66.85 81.59
5 63.37 81.48 85.66 97.63 82.51 85.34
All households 22.75 68.96 69.97 86.90 61.75 79.68
Difference between PSLSD 1993 and NIDS 2010/11 (percentage points)
1 –1.83 –7.32 42.04 78.14 36.36 –7.72
2 –0.23 –12.57 33.68 76.88 31.55 –5.48
3 –4.34 –11.67 20.34 65.35 20.23 –5.64
4 –4.46 –7.39 14.90 55.20 12.48 –4.01
5 –13.96 –11.31 1.50 22.70 –0.51 –5.75
All households –4.96 –10.05 22.49 59.65 20.02 –5.72
Source: Authors’ calculations using PSLSD 1993, NIDS 2008 and NIDS 2010/11 data.
Table A4 in the appendix shows the changes in ac-
cess to education over the same period. The table
shows the proportion of households in each edu-
cational attainment category by quintile, where the
household head is used a proxy.7 It can be seen
that overall education levels rose, and the propor-
tion with no or primary education declined in all
quintiles across the two surveys. However, it is also
clear that households in the upper income quintiles
saw the biggest gains in terms of those who finished
high school and those who went on to achieve a ter-
tiary qualification.

NONINCOME WELFARE AND INCLUSIVE GROWTH IN SOUTH AFRICA 9
Table 2 . Proportional Changes in Ownership of Household Services by Quintile, 1993–2010/11
QuintileDwelling Type:
FormalWater Source: Piped Water
Sanitation Facility: Flush or Chemical
Toilet
Fuel Source for Cooking: Electricity
Fuel Source for Lighting: Electricity
PSLSD 1993 (%)
1 48.67 21.68 13.51 7.37 14.99
2 57.78 35.46 23.68 16.92 27.77
3 71.85 61.05 49.05 40.17 47.11
4 87.34 83.38 82.18 72.04 78.92
5 96.95 96.48 96.83 92.39 94.51
All households 72.51 59.60 53.04 45.77 52.65
NIDS 2008
1 55.33 49.87 32.25 50.88 68.14
2 70.41 62.73 41.60 62.09 76.85
3 75.07 71.71 55.55 69.77 78.48
4 86.55 87.60 78.13 83.26 89.93
5 96.67 95.88 94.60 92.19 98.34
All households 76.80 73.55 60.42 71.63 82.34
NIDS 2010/11 (%)
1 62.83 59.97 45.35 63.30 77.30
2 67.59 67.69 54.49 69.74 79.64
3 76.16 81.68 67.92 81.46 86.54
4 84.87 88.95 81.46 90.20 93.52
5 95.54 95.88 93.60 95.61 98.09
All households 77.38 78.82 68.54 80.05 87.01
Difference between PSLSD 1993 and NIDS 2010/11 (percentage points)
1 14.16 38.29 31.84 55.93 62.31
2 9.81 32.23 30.81 52.82 51.87
3 4.31 20.63 18.87 41.29 39.43
4 –2.47 5.57 –0.72 18.16 14.60
5 –1.41 –0.60 –3.23 3.22 3.58
All households 4.87 19.22 15.50 34.28 34.36
Source: Authors’ calculations using PSLSD 1993, NIDS 2008 and NIDS 2010/11 data.

10 GLOBAL ECONOMY AND DEVELOPMENT PROGRAM
DERIVATION OF THE ASSET INDEX
Results from the Principal Components Analysis Methodology
As noted above, the PCA provides more insight into
overall changes in nonmonetary welfare by creating
a welfare index based on our three asset classes.
The analysis uses a pooled sample of the data sets,
and table A6 in the appendix presents the scoring
factors or weights for the index produced by the
PCA, based on the first principal component. The
signs of the weights are all as expected, with posi-
tive signs indicating that the ownership of assets, or
access to services, is associated with higher nonin-
come welfare. Relatively large positive weights were
derived for access to electricity, piped water, a flush
or chemical toilet, high-quality wall material for a
dwelling, residence in a formal dwelling, and owner-
ship of a refrigerator and television set. In contrast,
large negative weights were derived for the use of
candles for lighting, wood or dung for cooking, and a
medium-quality material of the dwelling.
The above-mentioned weights were applied to the
three data sets to calculate nonincome welfare index
values for all households. Table 3 presents the mean
values of the welfare index for each income quintile
by survey. It is evident that the changes in the poor-
est four quintiles, in both the periods 1993–2008 and
1993–2010, were statistically significant and large,
while there was no statistically significant change in
the richest quintile. Hence, the initial evidence here
points toward a story of inclusive growth in nonin-
come welfare over the period, where growth has
had a relatively greater impact for households in the
poorer income quintiles.
Table 4 examines the changes in income and non-
income welfare over the period for each quintile.
Here, households are divided into quintiles based on
income measures (shown in the rows in the table)
and nonincome measures (shown in columns), and
the cells contain the percentage share of households
in each overlapping category. For example, in 1993,
47.5 percent of households from the poorest income
quintile also fell into the lowest nonincome quintile.
However, this proportion decreased to 41.79 per-
cent in 2008 and 38.34 percent in 2010/11, as asset
ownership for income-poor households increased.
Reinforcing this point, the proportion of households
that fall into income quintile 2, but belong to a higher
nonincome quintile, increased from 35.6 percent in
1993 to 41.7 percent in 2010/11. Hence, the results
from the table suggest that nonincome welfare growth
was more rapid than income growth over the period.

NONINCOME WELFARE AND INCLUSIVE GROWTH IN SOUTH AFRICA 11
Table 3 . Mean Value of the Nonincome Welfare Index by Income Quintile
Quintile PSLSD 1993 NIDS 2008 NIDS 2010/11
Mean Mean t-statistic Mean t-statistic
1 –4.39 –1.80 –26.70* –0.98 –38.52*
2 –3.35 –0.73 –24.74* –0.45 –30.64*
3 –1.55 –0.15 –11.78* 0.43 –17.60*
4 0.59 1.16 –6.24* 1.38 –8.85*
5 2.33 2.51 –1.61 2.40 0.99
All households –1.28 0.20 –19.82* 0.56 –25.86*
Notes: *The 2008 estimate is significantly different at the 5% level from the 1993 estimate. **The 2010/2011 estimate is signifi-cantly different at the 5% level from the 1993 estimate.
Source: Authors’ calculations using PSLSD 1993, NIDS 2008 and NIDS 2010/2011 data.
Table 4 . Overlap between Nonincome Welfare Index Quintiles and Real Per Capita Income Quintiles (percent)
PSLSD 1993
Nonincome Welfare Index Household Quintile
1 2 3 4 5
Real per capita income quintile
1 47.50 33.07 14.28 4.81 0.34
2 32.57 31.81 23.33 10.93 1.35
3 16.24 23.80 26.39 27.49 6.08
4 3.99 10.30 26.71 35.00 24.00
5 0.80 1.70 10.78 21.58 65.13
NIDS 2008
Nonincome Welfare Index Household Quintile
1 2 3 4 5
Real per capita income quintile
1 41.79 29.22 19.46 9.01 0.52
2 26.41 29.00 23.68 17.81 3.10
3 21.69 24.61 24.53 23.35 5.82
4 8.95 12.33 23.82 33.78 21.11
5 1.19 4.77 9.25 20.50 64.30
NIDS 2010/2011
Nonincome Welfare Index Household Quintile
1 2 3 4 5
Real per capita income quintile
1 38.34 29.47 19.19 11.74 1.26
2 30.13 28.16 20.62 17.56 3.54
3 18.36 24.91 25.95 22.46 8.31
4 10.57 12.84 24.56 25.44 26.59
5 2.67 7.7 12.85 19.18 57.59%
Source: Authors’ calculations using PSLSD 1993, NIDS 2008 and NIDS 2010/2011 data.

12 GLOBAL ECONOMY AND DEVELOPMENT PROGRAM
CHANGES IN NONINCOME WELFARE, 1993–2010/11
In this section, the results derived after applying stan-
dard poverty analyses to the nonincome welfare index
are presented, for each survey. We evaluate the extent
to which households’ nonincome welfare has changed
in more detail and across different strata (e.g., race,
province, gender). For our poverty analysis, the index
values at the 20th and 40th percentiles in 1993 are
used as relative poverty lines, where the 20th percen-
tile is the “lower” poverty line and the 40th percentile is
the “upper” poverty line.
Changes in Nonincome Poverty
Table 5 presents the Foster-Greer-Thorbecke pov-
erty headcount rates and poverty gap ratios by vari-
ous demographic characteristics at the two selected
poverty lines. Overall, asset poverty has fallen by al-
most 17 percent, according to the lower poverty line.
Put differently, if we take the level of asset ownership
in 1993 as a benchmark and classify all households
below the 20th percentile as poor, we find that in
2011, only 3.5 percent of households remained poor
by that standard. Similarly, if we use the 40th per-
centile as an upper poverty line, the total household
poverty rate fell by 27.5 percentage points (from 40
to 12.5 percent). These decreases are both statisti-
cally significant.8
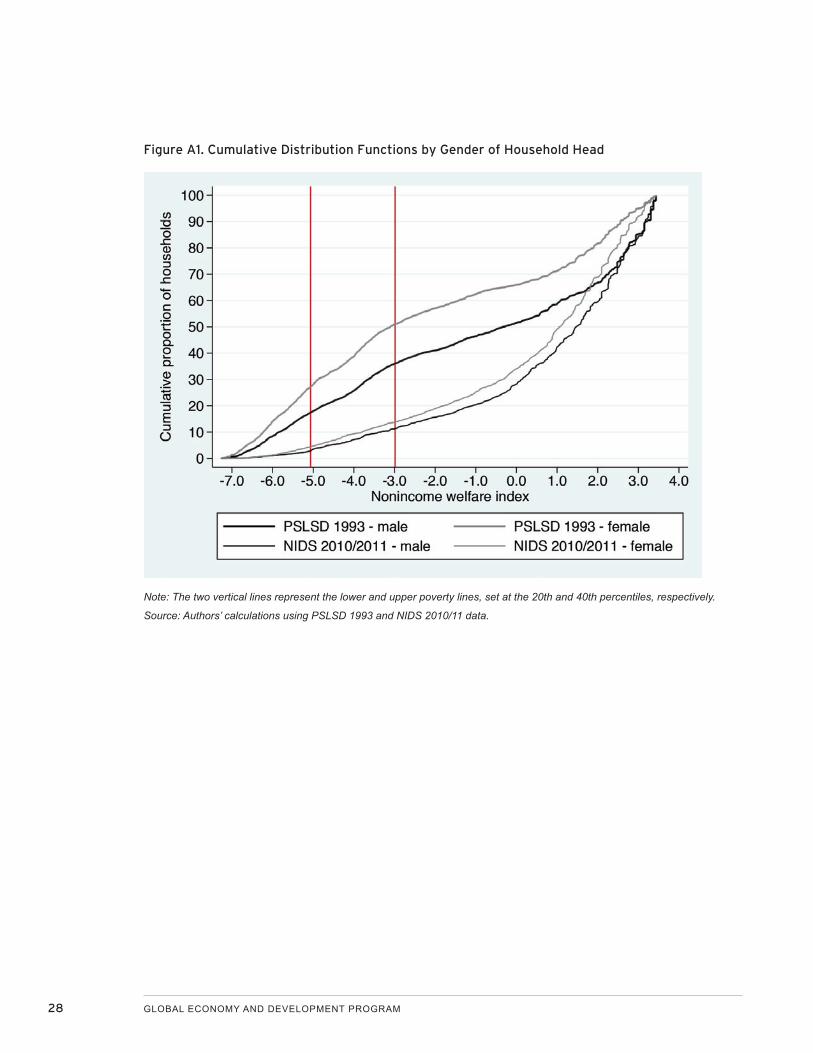
If we examine nonincome poverty by gender, it is
again clear that the decrease in the poverty head-
count ratio between the two surveys was large and
statistically significant, for both male- and female-
headed households. In particular, the decrease was
greater for female-headed households. As a result of
this sharper decline, the difference in poverty rates
between female- and male-headed households nar-
rowed from 9.7 percentage points in 1993 to only 1.6
points in 2010/11 at the lower poverty line, and from
14.9 to 2.6 points at the upper poverty line.
When we review nonincome poverty by race, the
initial estimates are startling: Only African-headed
households were poor under the lower poverty line
in 1993, and this situation persisted in 2011, with the
poor being exclusively those living in African-headed
households. If we use the upper poverty l ine,
African-headed households were joined by a very
small percentage of so-called Coloured-headed*
households in both 1993 and 2011. However, the
changes in poverty by race of the household head
do reveal substantial improvement. Both the poverty
headcount rates and poverty gap ratios decrease
dramatically for African-headed households over the
period—there was a 23.7 percentage point decrease
under the lower poverty line and a 40 point decrease
under the upper line. In other words, African-headed
households, since they were virtually the only nonin-
come poor households, benefited considerably from
the aggregate decrease in nonincome poverty over
the period. This trend again suggests that service
delivery efforts have been a success, in addition to
the private asset gains made by these households.
Table 5 also reports the different poverty estimates
by geographic region (urban/rural) and shows that
* Racial terminology in South Africa is a sensitive matter and in this paper we follow the most recent and widely used terminology. For example, the national statistics service Statistics South Africa also classifies people by population group with the options of Black African, Coloured, Indian or Asian, White, and Other. In this paper, “African” is used to refer to people classified by the apartheid state as “native,” “Bantu,” or “black”. “Coloured” refers mainly to people in the Western Cape province, and is an ethnic label for people of mixed ethnic origin who possess ancestry from Europe, Asia, and various Khoisan and Bantu tribes of Southern Africa.

NONINCOME WELFARE AND INCLUSIVE GROWTH IN SOUTH AFRICA 13
Table 5 . Nonincome Poverty Shifts by Race, Gender of Household Head and Geographic Region, 1993–2010/11
Characteristic
Headcount Rate (%) Poverty Gap Ratio (%)
PSLSD 1993
NIDS 2008
NIDS 2010/11
PSLSD 1993
NIDS 2008
NIDS 2010/11
Poverty line at 20th percentile
All households 20.0 6.6* 3.5** 8.5 2.2 1.2
By gender of household head
Male 17.4 5.3* 2.8** 7.3 1.8 1.0
Female 27.1 8.3* 4.4** 11.8 2.8 1.4
By race of household head
African 28.2 8.6* 4.5** 11.9 2.9 1.5
Geographic region
Urban 5.9 1.7* 0.7** 1.1 0.2 0.0
Rural 36.4 16.0* 8.1** 17.1 6.0 2.9
Poverty line at 40th percentile
All households 40.0 17.2* 12.5** 18.9 6.9 2.3
By gender of household head
Male 36.0 14.5* 11.3** 16.6 5.6 4.0
Female 50.9 20.9* 13.9** 25.2 8.6 5.2
By race of household head
African 56.0 22.2* 16.0** 26.5 8.9 5.8
Geographic region
Urban 15.4 7.7* 6.1** 5.4 2.6 1.8
Rural 68.9 35.5* 23.2** 34.6 15.2 9.1
Notes: *The 2008 estimate is significantly different at the 5% level from the 1993 estimate. **The 2010/11 estimate is significantly different at the 5% level from the 1993 estimate. We only show the results for “African” household head, the full results are avail-able from the authors.
Source: Authors’ calculations using PSLSD 1993, NIDS 2008 and NIDS 2010/11 data.
poverty headcount ratios decreased continuously in
both urban and rural areas, but the extent of this de-
cline was more rapid in rural areas. All the declines
in headcount poverty were statistically significant,
under both the upper and lower lines.
Cumulative Distribution Functions
The attraction of using cumulative distribution func-
tions (CDFs) is that they do not rely on selected pov-
erty lines. In the figures below, the two vertical lines
represent the lower and upper poverty lines, set at
the 20th and 40th percentiles, respectively. Figures

14 GLOBAL ECONOMY AND DEVELOPMENT PROGRAM
1 and 2 compare the changes in income poverty to
those of nonincome poverty using real per capita
income and the nonincome welfare index, respec-
tively. The proportion of households is represented
on the vertical axis (ranked by income/nonincome
welfare), and this is then plotted against income/
nonincome welfare on the x-axis. Both figures show
that poverty declined continuously across the three
surveys, but it is obvious that the decrease in non-
income poverty was more rapid, as shown by the
movements downward and to the right of the curves
in figure 2. The CDFs in figure 1 also provide a more
robust account of the slow growth in incomes that
are presented in table A1.
Concerning nonincome poverty, Figure 2 shows that,
with the exception of the top 20 percent of house-
holds, the poverty headcount ratio declined signifi-
cantly between 1993 and 2010/11, irrespective of the
poverty line chosen. Moreover, the gap between the
two lines is greatest for households in the lower-mid-
dle section of the distribution compared with the top
50 percent or the bottom 10 percent of households.
This implies that the nonincome poverty decline was
Figure 1 . Cumulative Distribution Functions for All Households, Using Real Per Capita Income
Note: The two vertical lines represent the lower and upper poverty lines, set at the 20th and 40th percentiles, respectively.
Source: Authors’ calculations using PSLSD 1993, NIDS 2008 and NIDS 2010/11 data.

NONINCOME WELFARE AND INCLUSIVE GROWTH IN SOUTH AFRICA 15
most rapid for households in the bottom 50 percent
of the distribution, while for the poorest 10 percent
and the richest 50 percent of households, more mod-
est changes have taken place. CDFs that illustrate
the welfare changes by gender and race over the
period can be found in the appendix (figures A1 and
A2). The results provide support for the trends identi-
fied in the previous section.
Figure 3 presents the CDFs for each income quintile
over time to examine how the distribution of nonin-
come welfare has changed for households with dif-
ferent levels of income. Here we are interested in
whether those households that were the poorest in
income terms in 1993 saw the largest improvement
in asset welfare over the period and how this change
has been spread across the distribution. The results
indicate that pro-poor nonincome welfare gains were
in fact most rapid for the poorest income quintile
where the gap between the 1993 and 2010/11 CDFs
is the greatest. The extent of this poverty decline di-
minishes when moving from quintile 1 to quintile 4,
while for the richest quintile there has been almost
no change at all.
Figure 2 . Cumulative Distribution Functions for All Households, Using Nonincome Welfare
Note: The two vertical lines represent the lower and upper poverty lines, set at the 20th and 40th percentiles, respectively.
Source: Authors’ calculations using PSLSD 1993, NIDS 2008 and NIDS 2010/11 data.

16 GLOBAL ECONOMY AND DEVELOPMENT PROGRAM
Figure 3 . Cumulative Distribution Functions by Per Capita Income Household Quintile
Note: The two vertical lines represent the lower and upper poverty lines, set at the 20th and 40th percentiles, respectively.
Source: Authors’ calculations using PSLSD 1993, NIDS 2008 and NIDS 2010/11 data.
Quintile 1 Quintile 2
Quintile 3 Quintile 4
Quintile 5

NONINCOME WELFARE AND INCLUSIVE GROWTH IN SOUTH AFRICA 17
CONCLUSION
This paper has examined the changing nature of non-
income welfare in postapartheid South Africa over
an 18-year period, from 1993 to 2010. It serves as a
supplement to the majority of South African studies on
poverty, which have focused predominantly on changes
in income welfare as the most important marker of eco-
nomic progress. Our paper is also an extension of the
few studies that focus on nonincome welfare, which
have generally not addressed the role of private assets
in the welfare calculation. We include public and private
assets as well as educational attainment in our PCA ap-
proach to derive a nonincome welfare index.
We find that poverty declined significantly over the pe-
riod, and this result holds for virtually all households,
regardless of the gender or race of the household
head, and whether it was in a rural or urban area.
The important exceptions are that in terms of race,
poverty declines were almost exclusively found for
African-headed households, the reason being that
these households constituted virtually the entire popu-
lation of households living in poverty in 1993. We also
found that poverty declines were relatively more rapid
for female-headed households and in rural areas.
Comparing the declines in income and nonincome
poverty over the same period revealed that nonincome
poverty fell much more rapidly than income poverty.
Finally, we note that poverty decreases were relatively
well targeted toward poor households, and it was
shown that in terms of both income and nonincome
poverty, poorer households experienced the largest
decreases in nonincome poverty.
In conclusion, the results are encouraging as South
Africa nears the end of its second decade of demo-
cratic rule. However, the changes that have taken
place must be understood in the context of the socio-
economic situation at the end of apartheid, with the
majority of the nonwhite population living in extreme
poverty, in both income and nonincome terms. The
substantial progress that we observe has built on an
exceptionally low base of initial nonincome welfare,
and the levels of poverty in South Africa, however one
chooses to measure them, remain high.

18 GLOBAL ECONOMY AND DEVELOPMENT PROGRAM
APPENDIX
Table A1 . Mean Real Per Capita Monthly Income in Rand (2010 prices), by Quintile
QuintilePSLSD 1993
NIDS 2008
NIDS 2010/11
Annualized Percentage Growth, 1993–2010 (%)
1 133 210 227 3.2
2 387 506 544 2.0
3 846 976 1,095 1.5
4 2,030 2,232 2,577 1.4
5 7,591 9,722 19,465 5.7
All households 2,197 2,727 4,768 4.7
Source: Authors’ calculations using PSLSD 1993, NIDS 2008 and NIDS 2010/11 data.

NONINCOME WELFARE AND INCLUSIVE GROWTH IN SOUTH AFRICA 19
Table A2 . Number of Households Owning Each Private Asset, 1993–20/11
Number
Vehicle Radio TV Set Telephone Refrigerator Stove
PSLSD 1993
1 82,451 1,079,427 245,425 32,722 158,146 1,252,958
2 111,226 1,173,791 466,787 91,397 332,545 1,297,757
3 227,996 1,227,822 760,728 273,246 624,941 1,366,907
4 536,442 1,248,595 924,729 561,962 850,190 1,338,500
5 1,209,628 1,451,507 1,316,435 1,172,135 1,298,595 1,424,945
All households 2,167,743 6,181,142 3,714,104 2,131,462 3,264,417 6,681,067
NIDS 2008
1 116,231 1,614,736 1,247,898 2,071,704 852,157 1,737,017
2 183,557 1,987,401 1,578,821 2,146,686 1,312,978 2,017,877
3 326,352 2,001,202 1,624,218 2,132,508 1,311,428 2,064,014
4 694,421 2,116,573 1,899,475 2,330,277 1,683,336 2,199,245
5 1,799,422 2,370,496 2,264,012 2,498,335 2,215,495 2,318,259
All households 3,119,983 10,090,408 8,614,424 11,179,510 7,375,394 10,336,412
NIDS 2010/11
1 91,375 1,635,836 1,531,685 2,129,158 1,232,996 1,919,473
2 182,879 1,659,127 1,687,296 2,197,790 1,402,851 2,057,791
3 271,104 1,770,672 1,828,164 2,195,985 1,595,432 2,165,985
4 793,097 1,925,338 1,967,495 2,421,840 1,776,478 2,168,015
5 1,674,780 2,153,208 2,263,679 2,579,898 2,180,582 2,255,132
All households 3,013,235 9,144,181 9,278,319 11,524,671 8,188,339 10,566,396
Difference between PSLSD 1993 and NIDS 2010/11
1 8,924 556,409 1,286,260 2,096,436 1,074,850 666,515
2 71,653 485,336 1,220,509 2,106,393 1,070,306 760,034
3 43,108 542,850 1,067,436 1,922,739 970,491 799,078
4 256,655 676,743 1,042,766 1,859,878 926,288 829,515
5 465,152 701,701 947,244 1,407,763 881,987 830,187
All households 845,492 2,963,039 5,564,215 9,393,209 4,923,922 3,885,329
Source: Authors’ calculations using PSLSD 1993 and NIDS 2010/11 data.

20 GLOBAL ECONOMY AND DEVELOPMENT PROGRAM
Table A3 . Number of Households in Each Household Asset Category by Quintile, 1993–2010/11
Number Number
Characteristic
PSLSD 1993 NIDS 2010/2011
Quintile 1 Quintile 2 Quintile 3 Quintile 4 Quintile 5 All households Quintile 1 Quintile 2 Quintile 3 Quintile 4 Quintile 5 All
households
Dwelling type
Formal 761,763 904,205 1,124,837 1,365,735 1,516,574 5,673,114 1,667,460 1,795,830 2,019,931 2,255,135 2,524,908 10,263,264
Traditional 399,007 276,110 120,207 22,500 3,679 821,503 561,954 393,969 194,778 92,359 38,713 1,281,773
Informal 404,502 384,540 320,506 175,469 44,031 1,329,048 424,376 467,146 437,535 309,779 79,032 1,717,868
All households 1,565,272 1,564,855 1,565,550 1,563,704 1,564,284 7,823,665 2,653,790 2,656,945 2,652,244 2,657,273 2,642,653 13,262,905
Roof material of dwelling
Bricks 17,756 15,496 15,738 43,686 46,865 139,541 158,170 194,929 340,350 372,104 474,554 1,540,107
Tile 8,329 30,759 144,591 358,402 796,683 1,338,764 101,064 142,460 338,239 676,858 1,140,082 2,398,703
Asbestos 106,503 202,992 357,347 477,850 194,092 1,338,784 145,821 249,887 251,007 248,905 218,866 1,114,486
Corrugated 1,142,267 1,146,971 931,843 630,283 490,977 4,342,341 2,019,108 1,866,933 1,607,868 1,331,159 789,653 7,614,721
Thatch 263,620 134,001 77,469 16,289 16,731 508,110 96,989 70,675 30,577 4,772 5,308 208,321
Inferior quality 26,797 34,636 38,562 37,194 18,936 156,125 132,638 132,061 84,203 23,475 14,190 386,567
All households 1,565,272 1,564,855 1,565,550 1,563,704 1,564,284 7,823,665 2,653,790 2,656,945 2,652,244 2,657,273 2,642,653 13,262,905
Wall material of dwelling
High quality 599,533 770,025 992,252 1,298,998 1,484,439 5,145,247 1,652,859 1,775,287 1,940,135 2,243,362 2,486,294 10,097,937
Medium quality 780,789 559,167 317,449 95,957 28,060 1,781,422 547,935 400,779 228,408 58,687 35,739 1,271,548
Low quality 184,950 235,663 255,849 168,749 51,785 896,996 452,996 480,879 483,701 355,224 120,620 1,893,420
All households 1,565,272 1,564,855 1,565,550 1,563,704 1,564,284 7,823,665 2,653,790 2,656,945 2,652,244 2,657,273 2,642,653 13,262,905
Water source
Piped water 339,378 554,959 955,693 1,303,843 1,509,242 4,663,115 1,591,449 1,798,378 2,166,377 2,363,551 2,533,787 10,453,542
Public tap 454,155 428,250 328,179 127,874 25,428 1,363,886 731,964 624,983 370,628 222,108 85,212 2,034,895
Borehole 301,169 249,113 122,488 49,354 5,352 727,476 36,365 40,785 17,873 23,287 8,065 126,375
Surface water 470,570 332,533 159,190 82,633 24,262 1,069,188 294,012 192,799 97,366 48,327 15,589 648,093
All households 1,565,272 1,564,855 1,565,550 1,563,704 1,564,284 7,823,665 2,653,790 2,656,945 2,652,244 2,657,273 2,642,653 13,262,905
Source: Authors’ calculations using PSLSD 1993 and NIDS 2010/2011 data.

NONINCOME WELFARE AND INCLUSIVE GROWTH IN SOUTH AFRICA 21
Table A3 . Number of Households in Each Household Asset Category by Quintile, 1993–2010/11
Number Number
Characteristic
PSLSD 1993 NIDS 2010/2011
Quintile 1 Quintile 2 Quintile 3 Quintile 4 Quintile 5 All households Quintile 1 Quintile 2 Quintile 3 Quintile 4 Quintile 5 All
households
Dwelling type
Formal 761,763 904,205 1,124,837 1,365,735 1,516,574 5,673,114 1,667,460 1,795,830 2,019,931 2,255,135 2,524,908 10,263,264
Traditional 399,007 276,110 120,207 22,500 3,679 821,503 561,954 393,969 194,778 92,359 38,713 1,281,773
Informal 404,502 384,540 320,506 175,469 44,031 1,329,048 424,376 467,146 437,535 309,779 79,032 1,717,868
All households 1,565,272 1,564,855 1,565,550 1,563,704 1,564,284 7,823,665 2,653,790 2,656,945 2,652,244 2,657,273 2,642,653 13,262,905
Roof material of dwelling
Bricks 17,756 15,496 15,738 43,686 46,865 139,541 158,170 194,929 340,350 372,104 474,554 1,540,107
Tile 8,329 30,759 144,591 358,402 796,683 1,338,764 101,064 142,460 338,239 676,858 1,140,082 2,398,703
Asbestos 106,503 202,992 357,347 477,850 194,092 1,338,784 145,821 249,887 251,007 248,905 218,866 1,114,486
Corrugated 1,142,267 1,146,971 931,843 630,283 490,977 4,342,341 2,019,108 1,866,933 1,607,868 1,331,159 789,653 7,614,721
Thatch 263,620 134,001 77,469 16,289 16,731 508,110 96,989 70,675 30,577 4,772 5,308 208,321
Inferior quality 26,797 34,636 38,562 37,194 18,936 156,125 132,638 132,061 84,203 23,475 14,190 386,567
All households 1,565,272 1,564,855 1,565,550 1,563,704 1,564,284 7,823,665 2,653,790 2,656,945 2,652,244 2,657,273 2,642,653 13,262,905
Wall material of dwelling
High quality 599,533 770,025 992,252 1,298,998 1,484,439 5,145,247 1,652,859 1,775,287 1,940,135 2,243,362 2,486,294 10,097,937
Medium quality 780,789 559,167 317,449 95,957 28,060 1,781,422 547,935 400,779 228,408 58,687 35,739 1,271,548
Low quality 184,950 235,663 255,849 168,749 51,785 896,996 452,996 480,879 483,701 355,224 120,620 1,893,420
All households 1,565,272 1,564,855 1,565,550 1,563,704 1,564,284 7,823,665 2,653,790 2,656,945 2,652,244 2,657,273 2,642,653 13,262,905
Water source
Piped water 339,378 554,959 955,693 1,303,843 1,509,242 4,663,115 1,591,449 1,798,378 2,166,377 2,363,551 2,533,787 10,453,542
Public tap 454,155 428,250 328,179 127,874 25,428 1,363,886 731,964 624,983 370,628 222,108 85,212 2,034,895
Borehole 301,169 249,113 122,488 49,354 5,352 727,476 36,365 40,785 17,873 23,287 8,065 126,375
Surface water 470,570 332,533 159,190 82,633 24,262 1,069,188 294,012 192,799 97,366 48,327 15,589 648,093
All households 1,565,272 1,564,855 1,565,550 1,563,704 1,564,284 7,823,665 2,653,790 2,656,945 2,652,244 2,657,273 2,642,653 13,262,905
Source: Authors’ calculations using PSLSD 1993 and NIDS 2010/2011 data.

22 GLOBAL ECONOMY AND DEVELOPMENT PROGRAM
Table A3 . Continued
Number Number
PSLSD 1993 NIDS 2010/2011
Quintile 1 Quintile 2 Quintile 3 Quintile 4 Quintile 5 All households Quintile 1 Quintile 2 Quintile 3 Quintile 4 Quintile 5 All
households
Sanitation facility
Flush/chemical 211,406 370,529 767,910 1,285,047 1,514,688 4,149,580 1,203,403 1,447,680 1,801,407 2,164,621 2,473,411 9,090,522
Pit with vent. 20,834 23,842 29,587 12,041 4,590 90,894 408,308 319,354 251,097 129,243 28,173 1,136,175
Pit without vent. 768,778 768,210 515,662 172,442 29,576 2,254,668 646,803 624,766 446,008 252,809 120,634 2,091,020
Bucket latrine 100,606 124,779 122,564 63,385 10,725 422,059 209,803 158,958 89,479 66,149 16,715 541,104
None 463,648 277,495 129,827 30,789 4,705 906,464 185,473 106,187 64,253 44,451 3,720 404,084
All households 1,565,272 1,564,855 1,565,550 1,563,704 1,564,284 7,823,665 2,653,790 2,656,945 2,652,244 2,657,273 2,642,653 13,262,905
Fuel source for cooking
Electricity 115,284 264,765 628,910 1,126,512 1,445,221 3,580,692 1,679,836 1,853,086 2,160,455 2,396,758 2,526,526 10,616,661
Gas 18,486 49,462 70,647 51,452 25,268 215,315 47,269 31,669 34,882 44,835 56,183 214,838
Paraffin/coal 469,310 598,250 564,681 312,857 89,212 2,034,310 318,855 401,131 299,524 156,537 47,522 1,223,569
Wood/dung 962,192 652,378 301,312 72,883 4,583 1,993,348 607,830 371,059 157,383 59,143 12,422 1,207,837
All households 1,565,272 1,564,855 1,565,550 1,563,704 1,564,284 7,823,665 2,653,790 2,656,945 2,652,244 2,657,273 2,642,653 13,262,905
Fuel source for lighting
Electricity 234,692 434,637 737,597 1,234,064 1,478,343 4,119,333 2,051,489 2,116,076 2,295,175 2,484,997 2,592,112 11,539,849
Paraffin 497,477 409,125 344,468 128,466 25,580 1,405,116 131,237 120,933 113,356 48,876 14,989 429,391
Candles 832,227 714,717 477,730 197,343 59,465 2,281,482 461,753 417,980 241,756 112,831 34,651 1,268,971
Other 876 6,376 5,755 3,831 896 17,734 9,311 1,956 1,957 10,569 901 24,694
All households 1,565,272 1,564,855 1,565,550 1,563,704 1,564,284 7,823,665 2,653,790 2,656,945 2,652,244 2,657,273 2,642,653 13,262,905
Source: Authors’ calculations using PSLSD 1993 and NIDS 2010/2011 data.

NONINCOME WELFARE AND INCLUSIVE GROWTH IN SOUTH AFRICA 23
Table A3 . Continued
Number Number
PSLSD 1993 NIDS 2010/2011
Quintile 1 Quintile 2 Quintile 3 Quintile 4 Quintile 5 All households Quintile 1 Quintile 2 Quintile 3 Quintile 4 Quintile 5 All
households
Sanitation facility
Flush/chemical 211,406 370,529 767,910 1,285,047 1,514,688 4,149,580 1,203,403 1,447,680 1,801,407 2,164,621 2,473,411 9,090,522
Pit with vent. 20,834 23,842 29,587 12,041 4,590 90,894 408,308 319,354 251,097 129,243 28,173 1,136,175
Pit without vent. 768,778 768,210 515,662 172,442 29,576 2,254,668 646,803 624,766 446,008 252,809 120,634 2,091,020
Bucket latrine 100,606 124,779 122,564 63,385 10,725 422,059 209,803 158,958 89,479 66,149 16,715 541,104
None 463,648 277,495 129,827 30,789 4,705 906,464 185,473 106,187 64,253 44,451 3,720 404,084
All households 1,565,272 1,564,855 1,565,550 1,563,704 1,564,284 7,823,665 2,653,790 2,656,945 2,652,244 2,657,273 2,642,653 13,262,905
Fuel source for cooking
Electricity 115,284 264,765 628,910 1,126,512 1,445,221 3,580,692 1,679,836 1,853,086 2,160,455 2,396,758 2,526,526 10,616,661
Gas 18,486 49,462 70,647 51,452 25,268 215,315 47,269 31,669 34,882 44,835 56,183 214,838
Paraffin/coal 469,310 598,250 564,681 312,857 89,212 2,034,310 318,855 401,131 299,524 156,537 47,522 1,223,569
Wood/dung 962,192 652,378 301,312 72,883 4,583 1,993,348 607,830 371,059 157,383 59,143 12,422 1,207,837
All households 1,565,272 1,564,855 1,565,550 1,563,704 1,564,284 7,823,665 2,653,790 2,656,945 2,652,244 2,657,273 2,642,653 13,262,905
Fuel source for lighting
Electricity 234,692 434,637 737,597 1,234,064 1,478,343 4,119,333 2,051,489 2,116,076 2,295,175 2,484,997 2,592,112 11,539,849
Paraffin 497,477 409,125 344,468 128,466 25,580 1,405,116 131,237 120,933 113,356 48,876 14,989 429,391
Candles 832,227 714,717 477,730 197,343 59,465 2,281,482 461,753 417,980 241,756 112,831 34,651 1,268,971
Other 876 6,376 5,755 3,831 896 17,734 9,311 1,956 1,957 10,569 901 24,694
All households 1,565,272 1,564,855 1,565,550 1,563,704 1,564,284 7,823,665 2,653,790 2,656,945 2,652,244 2,657,273 2,642,653 13,262,905
Source: Authors’ calculations using PSLSD 1993 and NIDS 2010/2011 data.

24 GLOBAL ECONOMY AND DEVELOPMENT PROGRAM
Table A4 . Proportional Changes in Highest Educational Attainment of Household Heads by Quintile, 1993–2010/11
Quintile None PrimaryIncomplete secondary Metric
Metric + Cert ./Dip . Degree
PSLSD 1993 (%)
1 41.32 40.22 16.72 1.32 0.35 0.07
2 35.65 40.00 21.36 2.41 0.51 0.07
3 21.37 34.30 35.72 6.53 1.70 0.39
4 9.90 27.59 41.62 13.11 6.69 1.09
5 4.50 9.21 24.07 26.56 21.99 13.67
All households 22.55 30.26 27.89 9.98 6.25 3.06
NIDS 2008 (%)
1 22.45 35.96 32.81 8.19 0.59 0.00
2 21.33 33.17 30.81 12.59 1.54 0.56
3 15.98 27.63 38.02 16.45 1.44 0.48
4 5.23 15.47 38.23 30.09 7.34 3.64
5 0.68 5.06 19.63 36.44 21.88 16.31
All households 13.14 23.46 31.91 20.75 6.55 4.19
NIDS 2010/11 (%)
1 22.75 32.58 33.59 9.45 1.57 0.05
2 18.80 32.18 37.23 9.24 2.39 0.16
3 14.01 21.57 43.11 16.18 4.79 0.35
4 3.32 15.22 37.60 28.60 12.03 3.23
5 0.97 4.73 22.31 30.60 21.97 19.42
All households 11.98 21.27 34.78 18.81 8.54 4.63
Difference between PSLSD 1993 and NIDS 2010/11 (percentage points)
1 -18.57 -7.64 16.87 8.13 1.22 -0.02
2 -16.85 -7.82 15.87 6.83 1.88 0.09
3 -7.36 -12.73 7.39 9.65 3.09 -0.04
4 -6.58 -12.37 -4.02 15.49 5.34 2.14
5 -3.53 -4.48 -1.76 4.04 -0.02 5.75
All households -10.57 -8.99 6.89 8.83 2.29 1.57
Source: Authors’ calculations using PSLSD 1993, NIDS 2008 and NIDS 2010/11 data.

NONINCOME WELFARE AND INCLUSIVE GROWTH IN SOUTH AFRICA 25
Table A5 . Number of Households in Each Educational Attainment Category, 1993–2010/11
Number
None PrimaryIncomplete secondary Metric
Metric + Cert ./Dip . Degree
PSLSD 1993
1 646,837 629,527 261,688 20,660 5,539 1,021
2 557,874 625,883 334,297 37,745 8,035 1,021
3 334,500 536,932 559,137 102,163 26,637 6,181
4 154,774 431,487 650,736 205,039 104,650 17,018
5 70,423 144,000 376,516 415,428 344,012 213,905
All households 1,764,408 2,367,829 2,182,374 781,035 488,873 239,146
NIDS 2008
1 575,262 921,380 840,803 209,810 15,066 0
2 545,379 848,266 787,821 321,980 39,457 14,203
3 409,221 707,486 973,418 421,063 36,828 12,282
4 133,953 396,529 979,864 771,121 188,172 93,331
5 17,349 129,258 501,743 931,341 559,219 416,947
All households 1,681,164 3,002,919 4,083,649 2,655,315 838,742 536,763
NIDS 2010/11
1 603,848 864,681 891,522 250,810 41,647 1,282
2 499,634 855,045 989,074 245,480 63,517 4,195
3 371,580 571,963 1,143,255 429,130 126,924 9,392
4 88,290 404,461 999,087 760,092 319,641 85,702
5 25,583 125,080 589,610 808,610 580,610 513,160
All households 1,588,935 2,821,230 4,612,548 2,494,122 1,132,339 613,731
Difference between PSLSD 1993 and NIDS 2010/11
1 –42,989 235,154 629,834 230,150 36,108 261
2 –58,240 229,162 654,777 207,735 55,482 3,174
3 37,080 35,031 584,118 326,967 100,287 3,211
4 –66,484 –27,026 348,351 555,053 214,991 68,684
5 –44,840 –18,920 213,094 393,182 236,598 299,255
All households –175,473 453,401 2,430,174 1,713,087 643,466 374,585
Source: Authors’ calculations using PSLSD 1993 and NIDS 2010/11 data.

26 GLOBAL ECONOMY AND DEVELOPMENT PROGRAM
Table A6 . Scoring Coefficients and Summary Statistics for Variables included in the Nonincome Welfare Index
VariableScoring Factor Mean
Standard Deviation
Vehicle 0.1647 0.2063 0.4046
Radio 0.0899 0.7454 0.4357
Television set 0.2130 0.5740 0.4945
Telephone 0.1619 0.6042 0.4890
Refrigerator 0.2246 0.5042 0.5000
Stove 0.0904 0.8107 0.3918
Dwelling: formal 0.2311 0.7292 0.4444
Dwelling: traditional -0.1705 0.1406 0.3476
Dwelling: informal -0.1373 0.1302 0.3365
Roof material: bricks 0.0491 0.0402 0.1964
Roof material: tile 0.1542 0.1340 0.3406
Roof material: asbestos 0.0576 0.1313 0.3378
Roof material: corrugated -0.1331 0.6169 0.4861
Roof material: thatch -0.1055 0.0507 0.2194
Roof material: inferior quality -0.0354 0.0269 0.1617
Wall material: high quality 0.2367 0.6884 0.4632
Wall material: medium quality -0.1986 0.1916 0.3936
Wall material: low quality -0.1097 0.1200 0.3250
Water source: piped water 0.2568 0.6271 0.4836
Water source: public tap -0.1610 0.2021 0.4016
Water source: borehole -0.0817 0.0519 0.2218
Water source: surface water -0.1503 0.1165 0.3208
Sanitation: flush or chemical toilet 0.2546 0.5363 0.4987
Sanitation: pit latrine with ventilation -0.0458 0.0726 0.2596
Sanitation: pit latrine without ventilation -0.1588 0.2563 0.4366
Sanitation: bucket latrine -0.0661 0.0467 0.2110
Sanitation: none -0.1416 0.0877 0.2828
Energy source for cooking: electricity 0.2778 0.5962 0.4907
Energy source for cooking: gas -0.0091 0.0248 0.1557
Energy source for cooking: paraffin/coal -0.1637 0.1691 0.3748
Energy source for cooking: wood/dung -0.1998 0.2099 0.4072
Energy source for lighting: electricity 0.2743 0.6861 0.4641
Energy source for lighting: paraffin -0.1362 0.0940 0.2919
Energy source for lighting: candles -0.2203 0.2172 0.4124

NONINCOME WELFARE AND INCLUSIVE GROWTH IN SOUTH AFRICA 27
VariableScoring Factor Mean
Standard Deviation
Energy source for lighting: other inferior sources -0.0118 0.0026 0.0512
Educational attainment of head: none -0.1207 0.2235 0.4166
Educational attainment of head: primary -0.0903 0.2938 0.4555
Educational attainment of head: incomplete secondary 0.0323 0.2821 0.4500
Educational attainment of head: metric 0.0866 0.1235 0.3290
Educational attainment of head: metric + cert./dip. 0.0757 0.0519 0.2219
Educational attainment of household head: degree 0.0704 0.0251 0.1565
Note: The first eigenvalue is 8.54 and 21% of the covariance is explained by the first principal component.
Source: Authors’ calculations using PSLSD 1993, NIDS 2008 and NIDS 2010/2011 data.
Table A7 . Share of the Poor by Race, Gender of Household Head, Area Type of Residence and Income Quintile, 1993–2010/11
Characteristic
Poverty Line at 20th Percentile Poverty Line at 40th Percentile
PSLSD 1993
NIDS 2008
NIDS 2010/11
PSLSD 1993
NIDS 2008
NIDS 2010/11
By gender of household head
Male 63.8 46.3 44.2 66.1 48.6 50.0
Female 36.2 53.7 55.8 33.9 51.4 50.0
By race of household head
African 100.0 99.7 99.2 99.3 98.3 98.1
Coloured 0.0 0.3 0.8 0.6 1.7 1.9
Asian 0.0 0.0 0.0 0.0 0.0 0.0
White 0.0 0.0 0.0 0.1 0.0 0.0
By area type of residence
Urban 16.1 17.0 13.8 20.7 29.6 31.0
Rural 83.9 83.0 86.2 79.3 70.4 69.0
By income quintile
1 47.0 51.5 49.3 39.9 42.2 39.4
2 32.2 25.0 35.5 31.9 27.2 32.7
3 16.1 15.8 13.4 19.8 20.4 18.5
4 4.0 7.2 1.8 7.1 8.9 7.9
5 0.8 0.6 0.1 1.2 1.3 1.4
Source: Authors’calculations using PSLSD 1993, NIDS 2008 and NIDS 2010/11 data.
Table A6 . Scoring Coefficients and Summary Statistics for Variables included in the Nonincome Welfare Index continued
28 GLOBAL ECONOMY AND DEVELOPMENT PROGRAM
Figure A1 . Cumulative Distribution Functions by Gender of Household Head
Note: The two vertical lines represent the lower and upper poverty lines, set at the 20th and 40th percentiles, respectively.
Source: Authors’ calculations using PSLSD 1993 and NIDS 2010/11 data.

NONINCOME WELFARE AND INCLUSIVE GROWTH IN SOUTH AFRICA 29
Figure A2 . Cumulative Distribution Functions for African and Coloured Households
Note: The two vertical lines represent the lower and upper poverty lines, set at the 20th and 40th percentiles, respectively.
Source: Authors’ calculations using PSLSD 1993 and NIDS 2010/11 data.

30 GLOBAL ECONOMY AND DEVELOPMENT PROGRAM
REFERENCES
Alkire, S., and Foster, J. 2011. Counting and multidi-
mensional poverty measurement. Journal of pub-
lic economics, 95(7), 476-487.
Alkire, S., and Santos, M. E. 2011. Acute multidi-
mensional poverty: A new index for developing
countries. Conference Paper, Proceedings of the
German Development Economics Conference,
2011 (Berlin).
Ardington, C., D. Lam, M. Leibbrandt, and M. Welch.
2005. The sensitivity of estimates of post-apart-
heid changes in South African poverty and in-
equality to key data imputations. CSSR Working
Paper 106. Cape Town: Centre for Social Science
Research at the University of Cape Town.
Bhorat, H., P. Naidoo, and C. Van der Westhuizen.
2006. Shifts in non-income welfare in South Africa:
1993–2004. DPRU Working Paper 06/108. Cape
Town: Development Policy Research Unit of the
University of Cape Town.
Bhorat, H., and C. Van der Westhuizen. 2012. Poverty,
inequality and the nature of economic growth in
South Africa. DPRU Working Paper 12/151. Cape
Town: Development Policy Research Unit of the
University of Cape Town.
———. 2013. “Non-monetary dimensions of well-being
in South Africa, 1993-2004: A post-apartheid divi-
dend?” Development Southern Africa 30, no. 3:
295–314.
Bhorat, H., C. Van der Westhuizen, and S. Goga. 2007.
Welfare shifts in post-apartheid South Africa: A
comprehensive measurement of changes. DPRU
Working Paper 07/128. Cape Town: Development
Policy Research Unit of the University of Cape Town.
Bhorat, H., C. Van der Westhuizen, and T. Jacobs.
2009. Income and non-income inequality in post-
apartheid South Africa: What are the drivers and
possible policy interventions? DPRU Working
Paper 09/138. Cape Town: Development Policy
Research Unit of the University of Cape Town.
Burger, R., S. Van der Berg, S. Van der Walt, and D.
Yu. 2004. “Geography as destiny: Considering
the spatial dimensions of poverty and depriva-
tion in South Africa.” In Conference proceed-
ings. Somerset West: Economic Society of South
Africa.
Department of Minerals and Energy. 2003. “Frequently
asked questions regarding the proposed policy of
providing free basic electricity (FBE).” www.dme.
gov.sa/energy/faq_energy.htm.
Falkingham, J., and C. Namazie. 2002. Measuring
health and poverty: A review of approaches to
identifying the poor. London: Health Systems
Resource Centre.
Filmer, D., and L. H. Pritchett. 2001. “Estimating wealth
effects without expenditure data or tears: An ap-
plication to educational enrollments in States of
India.” Demography 38, no. 1: 115–32.
Finn, A., M. Leibbrandt, and I. Woolard. 2013. What
happened to multidimensional poverty in South
Africa between 1993 and 2010? SALDRU
Working Paper 99. Cape Town: Southern Africa
Labour and Development Research Unit of the
University of Cape Town.
Foster, J. E., J. Greer, and E. Thorbecke. 1984. “A
class of decomposable poverty measures.”
Econometrics 52, no. 3: 761–66.
Hoogeveen, J. G., and B. Özler. 2006. “Poverty and
inequality in post-apartheid South Africa: 1995–
2000.” In Poverty and policy in post-apartheid
South Africa, ed. H. Bhorat and R. and Kanbur.
Cape Town: Human Sciences Research Council.

NONINCOME WELFARE AND INCLUSIVE GROWTH IN SOUTH AFRICA 31
Leibbrandt, M., L. Poswell, P. Naidoo, and M. Welch.
2006. “Measuring recent changes in South African
inequality and poverty using 1996 and 2001
Census data.” In Poverty and policy in post-apart-
heid South Africa, ed. H. Bhorat and R. and Kanbur.
Cape Town: Human Sciences Research Council.
Leibbrandt, M., I. Woolard, A. Finn, and J. Argent.
2010. Trends in South African income distribu-
tion and poverty since the fall of apartheid. OECD
Social, Employment, and Migration Working
Paper 101. Paris: Organization for Economic
Cooperation and Development.
McKenzie, D. J. 2005. “Measuring inequality with as-
set indicators.” Journal of Population Economics
18: 229–60.
Moser, C., and A. Felton. 2007. The construction of
an asset index measuring asset accumulation in
Ecuador. CPRC Working Paper 87. Washington:
Chronic Poverty Research Center.
National Treasury. 2003. Intergovernmental Fiscal
Review 2003. Pretoria: Government Printer.
Paxton, C., and N. Schady. 2005. Cognitive devel-
opment among children in Ecuador: The role of
wealth, health and parenting. Policy Research
Working Paper 3605. Washington: World Bank.
Pollitt, E., K. S. Gorman, P .L. Engle, R. Martorell,
and J. Rivera. 1993. “Early supplementary feed-
ing and cognition.” Monographs of the Society for
Research in Child Development 58, no. 7: 1–199.
Rutstein, S. O. 2008. The DHS wealth index:
Approaches for rural and urban areas. DHS
Working Paper 60. Calverton: Demographic and
Health Research.
Schiel, R. 2012. “Money-metric versus non-money-
metric measures of well-being.” Honors minidis-
sertation, University of Cape Town, Cape Town.
Schroeder, D. G., H. Kaplowitz, and R. Martorell. 1992.
“Patterns and predictors of participation and con-
sumption of supplement in an intervention study in
rural Guatemala.” Food and Nutrition Bulletin 14,
no. 3: 191–200.
Southern Africa Labour and Development Research
Unit. 1994. Project for Statistics on Living
Standards and Development: Metadata. Cape
Town: Southern Africa Labour and Development
Research Unit of the University of Cape Town.
Southern Africa Labour Development Research Unit.
2009. National Income Dynamics Study Wave
1: User document. Cape Town: Southern Africa
Labour and Development Research Unit of the
University of Cape Town.
Van der Berg, S., M. Louw, and L. Du Toit. 2008.
Poverty trends since the transition: What we
know. Stellenbosch: Stellenbosch University.
Van der Berg, S., S. Nieftagodien, and R. Burger. 2003.
“Consumption patterns and living standards of the
Black population in perspective.” In Conference
proceedings. Somerset West: Economic Society
of South Africa.
Vermaak, C. 2005. “Trends in income distribution,
inequality and poverty in South Africa, 1995
to 2003.” In Conference proceedings. Durban:
Economic Society of South Africa.
Vyas, S., and L. Kumaranayake. 2006. “Constructing
socio-economic status indices: How to use prin-
cipal components analysis.” Health Policy and
Planning 21, no. 6: 459–68.

32 GLOBAL ECONOMY AND DEVELOPMENT PROGRAM
ENDNOTES1. This section draws on Filmer and Pritchett (2001),
McKenzie (2005) and Vyas and Kumaranayake (2006).
2. This includes wood, plastic, cardboard, a mixture of mud and cement, wattle and daub, mud bricks, and stones and rocks.
3. Bricks and cement blocks are distinguished as high-quality wall materials.
4. A mixture of mud and cement, wattle and daub, and mud bricks are distinguished as medium-qual-ity materials.
5. Corrugated iron or zinc, wood, plastic, cardboard, tile, thatching, asbestos, and stones and rocks are regarded are low-quality materials.
6. We focus our discussion on the changes between 1993 and 2010/11, given that the changes be-tween 2008 and 2010/11 are very small.
7. Table A5 shows the absolute numbers.
8. Table A7 disaggregates poverty by race, gender of household head, area type of residence and in-come quintile.

The views expressed in this working paper do not necessarily reflect the official position of Brookings, its board or the advisory council members.
© 2015 The Brookings Institution
ISSN: 2166-5184 (online) | 2166-5176 (print)
Cover photos courtesy of (left to right): Trevor Samson / World Bank, Hansjoerg Richter, John Hogg / World Bank, Andrew Martin Green, Lorenzo Codacci, Eric Miller / World Bank, Ami Vitale / World Bank

1775 Massachusetts Avenue, NW Washington, DC 20036 202-797-6000 www.brookings.edu/global