nonfatal occupational injuries and illnesses requiring … reaction for nursing assistants was...
TRANSCRIPT

For release 10:00 a.m. (EST) Thursday, November 19, 2015 USDL 15-2205
Technical information: (202) 691-6170 • [email protected] • www.bls.gov/iif/oshcdnew.htm Media contact: (202) 691-5902 • [email protected]
NONFATAL OCCUPATIONAL INJURIES AND ILLNESSES REQUIRING DAYS AWAY FROM WORK, 2014
The overall incidence rate of nonfatal occupational injury and illness cases requiring days away from work to recuperate was 107.1 cases per 10,000 full-time workers in 2014, down from the 2013 rate of 109.4, the U.S. Bureau of Labor Statistics reported today. In 2014, there were 1,157,410 days-away-from-work cases in private industry, state government, and local government—essentially unchanged from the number of cases reported in 2013. The median days away from work to recuperate—a key measure of severity of injuries and illnesses—was 9 days in 2014, 1 day more than reported in 2013. (See table 1.)
In private industry in 2014, the number of days-away-from-work cases (916,440) and the incidence rate (97.8 cases per 10,000 full-time workers) was essentially unchanged from 2013. (See table 1.)
• The rate of falls on the same level in private industry increased to 16.6 in 2014, up from 15.4 in 2013.In transportation and warehousing the rate of falls on the same level increased from 28.3 in 2013 to30.4 in 2014—the second year in a row with an increase in this industry. Other industries where therate of falls on the same level increased in 2014 were wholesale trade, health care and socialassistance, and manufacturing. While the rate of falls on the same level in construction decreased in2014, the rate was larger than the 2011 and 2012 rates. (See chart A and table 1.)
Chart A. Days-away-from-work incidence rates for falls on the same level by selected private industries, 2011-14
• Heavy and tractor-trailer truck drivers and laborers and freight, stock, and material movers in theprivate sector each had more than 50,000 injuries and illnesses in 2014 (each with 6 percent of totalinjuries and illnesses). The incidence rate for heavy and tractor-trailer truck drivers increased to 355.4cases per 10,000 full-time workers in 2014, up from 322.8 in 2013. Laborers and freight, stock, andmaterial movers had a 4 percent increase in the number of injuries and illnesses with days away fromwork in 2014. However, there was little change in the incidence rate of 284.5 in 2014 compared to289.5 in 2013. (See table 4.)
048
121620242832
Transportation andWarehousing
Wholesale Trade Health Care andSocial Assistance
Manufacturing Construction Total
Incidencerates per
10,000full-time workers
2011 2012 2013 2014Source: U.S. Bureau of Labor Statistics
• Musculoskeletal disorders (MSDs) accounted for 32 percent of all injury and illness cases in2014 for all ownerships. The MSD incidence rate decreased to 33.8 cases per 10,000 full-time workersin 2014, down from 35.8 cases. Nursing assistants and laborers and freight, stock, and materialmovers incurred the highest number of MSD cases in 2014. (See table 16.) MSD cases accounted for54 percent of total cases that occurred to nursing assistants in 2014.
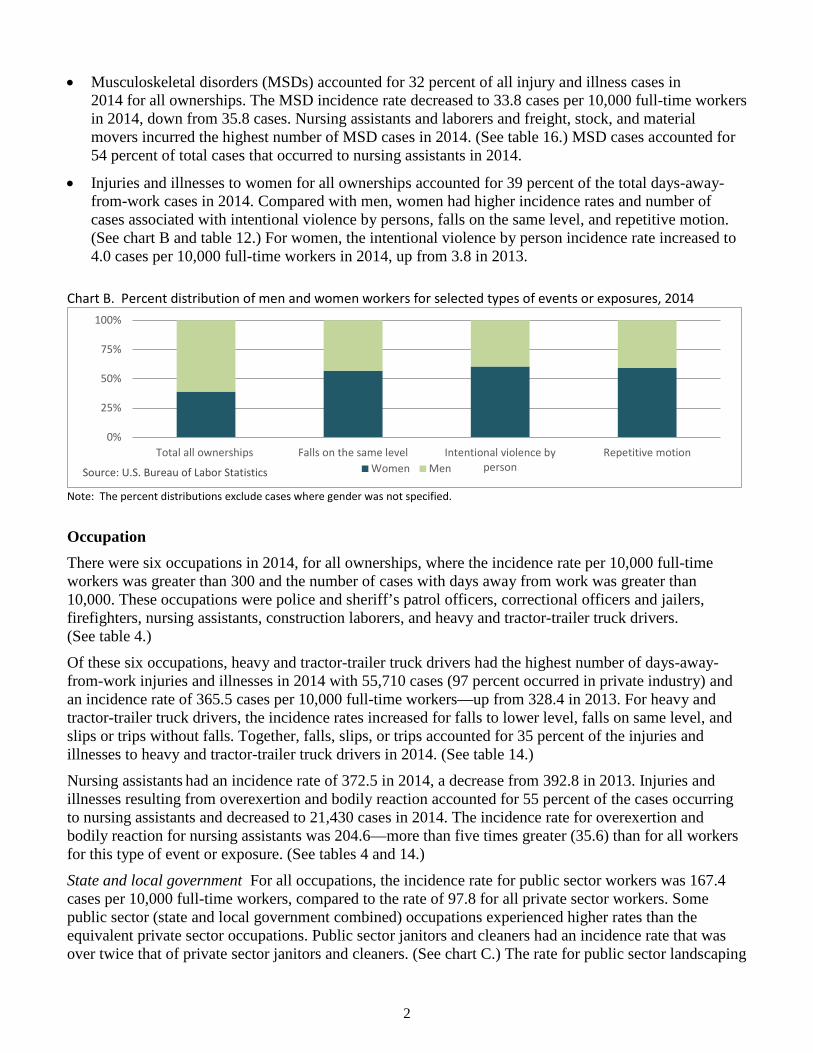
• Injuries and illnesses to women for all ownerships accounted for 39 percent of the total days-away-from-work cases in 2014. Compared with men, women had higher incidence rates and number ofcases associated with intentional violence by persons, falls on the same level, and repetitive motion.(See chart B and table 12.) For women, the intentional violence by person incidence rate increased to4.0 cases per 10,000 full-time workers in 2014, up from 3.8 in 2013.
Chart B. Percent distribution of men and women workers for selected types of events or exposures, 2014
Note: The percent distributions exclude cases where gender was not specified.
Occupation There were six occupations in 2014, for all ownerships, where the incidence rate per 10,000 full-time workers was greater than 300 and the number of cases with days away from work was greater than 10,000. These occupations were police and sheriff’s patrol officers, correctional officers and jailers, firefighters, nursing assistants, construction laborers, and heavy and tractor-trailer truck drivers. (See table 4.)
Of these six occupations, heavy and tractor-trailer truck drivers had the highest number of days-away-from-work injuries and illnesses in 2014 with 55,710 cases (97 percent occurred in private industry) and an incidence rate of 365.5 cases per 10,000 full-time workers—up from 328.4 in 2013. For heavy and tractor-trailer truck drivers, the incidence rates increased for falls to lower level, falls on same level, and slips or trips without falls. Together, falls, slips, or trips accounted for 35 percent of the injuries and illnesses to heavy and tractor-trailer truck drivers in 2014. (See table 14.)
Nursing assistants had an incidence rate of 372.5 in 2014, a decrease from 392.8 in 2013. Injuries and illnesses resulting from overexertion and bodily reaction accounted for 55 percent of the cases occurring to nursing assistants and decreased to 21,430 cases in 2014. The incidence rate for overexertion and bodily reaction for nursing assistants was 204.6—more than five times greater (35.6) than for all workers for this type of event or exposure. (See tables 4 and 14.)
State and local government For all occupations, the incidence rate for public sector workers was 167.4 cases per 10,000 full-time workers, compared to the rate of 97.8 for all private sector workers. Some public sector (state and local government combined) occupations experienced higher rates than the equivalent private sector occupations. Public sector janitors and cleaners had an incidence rate that was over twice that of private sector janitors and cleaners. (See chart C.) The rate for public sector landscaping
0%
25%
50%
75%
100%
Total all ownerships Falls on the same level Intentional violence byperson
Repetitive motionWomen MenSource: U.S. Bureau of Labor Statistics
2

and groundskeeping workers was 795.1 cases per 10,000 full-time workers, compared to 190.4 for private sector landscaping and groundskeeping workers.
Chart C. Incidence rates of injuries and illnesses with days away from work for selected occupations with high case counts by ownership, 2014
Note: These occupations had at least 1 percent of the days-away-from-work cases in the respective ownerships.
In state government, there were 67,400 cases with days away from work in 2014 which was essentially unchanged from the number reported for 2013. The incidence rate was 170.3 cases per 10,000 full-time workers. State government workers required a median of 12 days away from work, up from a median of 10 days in 2013. (See table 3.)
Correctional officers and jailers had 10,590 cases in 2014, the most injuries and illnesses in state government, with 16 percent of the total. The rate of 491.2 was essentially unchanged in 2014 compared to 2013. (See table 4.)
In local government, the number of cases was 173,570 and the incidence rate was 166.4 cases per 10,000 full-time workers, both essentially unchanged from 2013. Workers in local government took a median of 10 days away from work to recuperate from their occupational injuries and illnesses. (See table 3.)
Police and sheriff’s patrol officers had the highest number of cases with 24,230 in local government. (See table 4.) The incidence rate was 519.9 per 10,000 full-time workers, essentially unchanged from 2013.
Case characteristics and musculoskeletal disorders The leading event or exposure resulting in occupational injuries or illnesses for all ownerships in 2014 was overexertion and bodily reaction with 384,260 cases accounting for 33 percent of total cases. The 2014 incidence rate for overexertion or bodily reaction was 35.6 cases per 10,000 full-time workers, down from 37.7 in 2013. (See table 5.)
Falls, slips, or trips accounted for an additional 27 percent of the total in 2014 with 316,650 days-away-from-work cases. The incidence rate increased to 29.3 in 2014, up from 27.9 in 2013.
The leading nature (type) of injury or illness in 2014 for all ownerships was sprains, strains, or tears with 420,870 days-away-from-work cases. The rate was 38.9 cases per 10,000 full-time workers, down from a rate of 40.2 in 2013. Workers who sustained sprains, strains, or tears required a median of 10 days away from work compared to 9 days for all types of injuries or illnesses. (See table 5.)
0 100 200 300 400 500 600 700 800
Maintenance and repairs workers, general
Registered nurses
Janitors and cleaners, except maids and housekeepers
Landscaping and groundskeeping workers
Nursing assistants
All occupations
State and localgovernmentPrivate sector
Source: U.S. Bureau of Labor Statistics Incidence rate per 10,000 full-time workers
3

Workers who sustained fractures required a median of 32 days to recuperate before returning to work. This was more than three times the number of days required for all types of injuries or illnesses.
Musculoskeletal disorders In 2014 for all workers, there were 365,580 cases of musculoskeletal disorders (MSDs), such as sprains or strains resulting from overexertion in lifting. The MSD incidence rate was 33.8 cases per 10,000 full-time workers in 2014, down from 35.8 in 2013. Workers who sustained an MSD required a median of 13 days to recuperate before returning to work in 2014, compared to 9 days for all types of cases and up from 11 days in 2013. (See table 16.)
Industry Three private sector industries had more than 100,000 days-away-from-work incidents in 2014: health care and social assistance (164,440), manufacturing (125,990), and retail trade (120,640). Of these three industries, retail trade was the only one to have a decrease in the incidence rate, to 104.5 in 2014 down from 112.8 in 2013. The number of cases in manufacturing increased 5 percent in 2014. The incidence rate in this industry was 103.1 cases in 2014, essentially unchanged from 100.9 reported for 2013. (See table 1.)
Transportation and warehousing had 95,040 occupational injuries and illnesses in 2014 resulting in an incidence rate of 225.2 per 10,000 full-time workers—the highest reported among private industries. Despite a 9 percent increase in the case count from 2013, the incidence rate was essentially unchanged from the rate reported for 2013. Musculoskeletal disorders (MSDs) accounted for 40 percent of the cases in transportation and warehousing in 2014. The MSD rate increased to 89.9 cases per 10,000 full-time workers, up from 80.3 in 2013. (See chart D and table 1.)
Chart D. Musculoskeletal disorder incidence rates for selected private sector industries, 2013-14
Health care and social assistance had a rate of 121.3 cases per 10,000 full-time workers, the highest among the private industry sectors with greater than 100,000 cases. Musculoskeletal disorders accounted for 39 percent of the total injuries and illnesses reported in this industry in 2014. The MSD incidence rate decreased to 46.9 cases, down from 50.2 in 2013. (See chart D.) The rate of violence and other injuries by persons or animal decreased to 14.4 cases per 10,000 full-time workers in 2014. The rate of injuries and
0 10 20 30 40 50 60 70 80 90
Arts, entertainment, and recreation
Health care and social assistance
Transportation and warehousing
Service providing:
Manufacturing
Construction
Agriculture, forestry, fishing, and hunting
Goods producing:
Total
Incidence rate per 10,000 full-time workers
2013 2014Source: U.S. Bureau of Labor Statistics
4

illnesses from violence in this industry was more than three times greater than the violence rate for all private industries. (See table 1.)
There were 7,680 occupational injuries and illnesses in mining (including quarrying, and oil and gas extraction) in 2014 resulting in an incidence rate of 84.7—less than the overall private industry rate of 97.8. Workers in the mining industry required a median of 31 days away from work to recuperate from injuries and illnesses, up from 24 days in 2013. This was more than three times the number of days required in all industries. (See table 1.)
Gender The nonfatal injury and illness incidence rate for men in private sector, state government, and local government (all ownerships) was 116.5 in 2014, down from 119.2 reported for 2013. (See table 6.) Injuries and illnesses to men accounted for 60 percent (699,470) of all cases and required a median of 10 days away from work, 3 days more than the median for women. The 2014 nonfatal injury and illness incidence rates for women in all ownerships was 95.1 cases per 10,000 full-time workers.
The two leading types of injuries or illnesses for both men and women were sprains, strains, or tears, and soreness and pain. (See chart E and table 12.) Men incurred sprains, strains, or tears at a greater rate than women with 41.7 cases per 10,000 full-time workers compared to a rate of 35.8 for women. Women workers had a higher incidence rate than men for bruises, contusions with an incidence rate of 10.0 compared with a rate of 8.3 for men.
Chart E. Incidence rates of nonfatal occupational injuries and illnesses involving days away from work by gender and selected nature of injury or illness, all ownerships, 2014
For additional data on gender, see tables 6, 8, 9, and 12. For additional data on nature of injury or illness, see tables 2, 5, 12, 13, and 15.
Age groups Workers in age group 45 to 54 had the highest number (286,490) of days-away-from-work cases in 2014, for all ownerships, with an incidence rate of 117.2 cases per 10,000 full-time workers. (See chart F and table 6.) The number of injuries and illnesses to workers in age group 55 to 64 increased to 201,740 cases in 2014. Despite the increase in the number of cases for age group 55 to 64, the incidence rate (116.3 cases per 10,000 full-time workers) was essentially unchanged from the rate reported for 2013. Incidence rates decreased in 2014 for workers in age groups 25 to 34 and 35 to 44.
0
10
20
30
40
Total all ownerships Men Women
Incidence rate per 10,000
full-time workers
Sprains, strains, tears Soreness, pain Cuts, lacerations, punctures Fractures Bruises, contusions
Source: U.S. Bureau of Labor Statistics
5

The median days away from work increased by 1 day in 2014 for workers in age groups 35 to 44, 45 to 54, and 55 to 64. For workers in age group 65 and older, the median increased 3 days in 2014 to 17 median days away from work to recuperate from occupational injuries and illnesses.
Chart F. Incidence rate, number of cases, and median days away from work by age group, all ownerships, 2014
For additional information on age groups, see tables 6, 8, 9, and 12.
Race or ethnicity There were 444,590 days-away-from-work cases reported among white workers, which accounted for 38 percent of all cases for all ownerships. (See table 7.) This was essentially unchanged from the number of cases reported for 2013. Hispanic or Latino workers accounted for 12 percent of the injuries and illnesses in 2014 and the number of cases did not change significantly from 2012. Asian and Native Hawaiian or other Pacific Islander were the only groups with an increase in cases in 2014. The number of injuries and illnesses to Asian workers increased to 15,950 cases in 2014, up from 14,180 in 2013. The number of injuries and illnesses increased 27 percent for Native Hawaiian or Pacific Islanders to 3,860 cases. Race or ethnicity were unreported in 40 percent of all cases.
For additional information on race or ethnicity, see tables 7, 8, and 9.
Notes This release is the third in a series of releases from the BLS covering occupational safety and health statistics for 2014. The first release, in September 2015, covered work-related fatal injuries from the 2014 Census of Fatal Occupational Injuries. In October 2015, the Survey of Occupational Injuries and Illnesses (SOII) reported counts and rates of injuries and illnesses by detailed industry and case type for 2014. Data in this third release are a subset of the SOII data and include additional detail about the case
0
20
40
60
80
100
120
Incidence rate per 10,000 full-time
workers
0
75,000
150,000
225,000
300,000
Number of days-away-from-work
cases
0369
121518
16 to 19 20 to 24 25 to 34 35 to 44 45 to 54 55 to 64 65 and over
Median daysaway from work
Age groupsSource: U.S. Bureau of Labor Statistics
6

circumstances and worker characteristics for occupational injury and illness cases that required at least 1 day away from work to recuperate. While the data come from the same survey, they are reported at different levels of precision. For example, in this release, injury and illness incidence rates for days-away-from-work cases are reported as 107.1 cases per 10,000 full-time workers. However, the same incidence rate in the SOII annual summary news release is reported as 1.1 cases per 100 full-time workers. Data users are cautioned to take into account the different levels of precision when analyzing the data. Additional background and methodological information regarding the BLS occupational safety and health statistics program can be found in Chapter 9 of the BLS Handbook of Methods at www.bls.gov/opub/hom/pdf/homch9.pdf.
In 2014, the SOII began using the 2012 North American Industry Classification System (NAICS). Comparison of SOII estimates for 2014 to prior years is not advised below the sector level due to this change. For additional detailed information regarding NAICS revisions, visit www.bls.gov/bls/naics.htm.
This release does not present all the publishable estimates and rates for days-away-from-work cases. Additional detailed data are available from BLS staff at (202) 691-6170, [email protected], and the BLS website at www.bls.gov/iif/home.htm. Information in this release is available to sensory-impaired individuals upon request. Voice phone: (202) 691-5200; Federal relay service: (800) 877-8339.
Days of job transfer or restriction pilot study In January of 2012, the BLS Survey of Occupational Injuries and Illnesses (SOII) began to collect information on case circumstances and worker characteristics for days-of-job-transfer-or-restriction (DJTR) cases. The pilot included six industries: specialty trade contractors; food manufacturing; building material and garden equipment supplies dealers; air transportation; warehousing and storage; and nursing and residential care facilities. The 2011-13 data from this study were published in August 2015 in BLS Report 1056: www.bls.gov/opub/reports/iif/a-pilot-study-of-job-transfer-or-work-restriction-cases-2011-2013.pdf.
In January of 2015, the original six industries selected for the DJTR study were replaced with a new set of six industries. The new industries are beverage and tobacco product manufacturing; general merchandise stores; couriers and messengers; waste management and remediation services; hospitals; and accommodation. DJTR data for these industries will be released in 2016.
Completeness of SOII BLS has long acknowledged that some conditions which often are difficult for employers to relate to the workplace are not adequately recognized and reported during a calendar year (for example, long-term latent illnesses) and are believed to be understated in SOII illness measures. Following several studies in the mid-2000s questioning the completeness of SOII injury and illness counts, BLS began internal research in 2007 and, at the request of Congress, established an ongoing research program. Initial research conducted between 2009 and 2012 found that the SOII failed to capture some cases but could not determine the magnitude or leading cause of an undercount. Researchers determined that the ability to match injury and illness data across different data sources was impacted by various factors, such as establishment type, the time of case filing, and the type of injury. BLS initiated additional research from 2012 to 2014 that included interviews with employers in four states to learn more about their injury and illness recordkeeping practices and a multiple-year match of SOII data to workers' compensation records to analyze matching trends over time. BLS is currently funding a nationwide follow-back survey with SOII respondents to learn more about their recordkeeping practices and timing issues that may negatively affect injury and illness reporting to the SOII. BLS also continues to conduct exploratory research on the collection of occupational injury and illness data directly from employees. For more information on undercount research, please see www.bls.gov/iif/undercount.htm.
7

TABLE 1. Number, median days away from work1, and incidence rate2 for nonfatal occupational injuries and illnesses involving days away from work3 by ownership, industry,musculoskeletal disorders4, and event or exposure, 2014
Industry NumberMedian
days awayfrom work
Musculo-skeletal
disorders(incidence
rate)
Incidencerate
Event or exposure leading to injury or illness(incidence rate)
Contactwith
objects
Fallto
lowerlevel
Fallon
samelevel
Slipsor
tripswithout
fall
Over-exertion inlifting/low-
ering
Repetitivemotion
Exposureto
harmfulsub-
stancesor
environ-ments
Transpor-tation in-cidents
Firesand
explo-sions
Violenceand otherinjuries bypersons
or animal
Total private, state and local government ............... 1,157,410 9 33.8 107.1 23.8 5.4 18.8 4.4 11.0 2.7 4.3 5.8 0.2 6.8
Total private industry5,6,7 ...................................... 916,440 9 31.9 97.8 24.0 5.3 16.6 4.0 10.7 2.7 4.0 5.1 .1 4.0
Total goods producing ........................................... 225,180 10 34.6 114.4 40.1 8.5 12.7 4.2 10.9 4.4 5.1 4.3 .3 1.8Natural resources and mining5,6 ........................ 24,730 10 29.1 133.0 43.7 10.1 15.0 5.8 8.3 1.9 5.8 8.5 .5 10.4
Agriculture, forestry, fishing, and hunting5 ..... 17,050 6 39.0 179.0 51.1 14.9 21.3 8.2 9.8 3.3 8.1 11.7 – 19.7Mining6 .......................................................... 7,680 31 18.8 84.7 35.9 5.1 8.5 3.2 6.7 .5 3.4 5.2 1.0 .6
Construction ...................................................... 74,460 10 32.7 132.7 44.3 17.7 14.8 5.9 11.1 1.0 4.6 7.2 .4 1.7Manufacturing .................................................... 125,990 10 36.3 103.1 37.5 4.0 11.4 3.2 11.2 6.4 5.2 2.3 .2 .5
Total service providing ........................................... 691,260 8 31.1 93.4 19.7 4.4 17.6 3.9 10.6 2.2 3.7 5.3 .1 4.6Trade, transportation and utilities7 ..................... 278,700 11 46.0 127.2 32.8 6.4 18.6 5.3 18.4 2.3 2.9 9.6 .2 1.9
Wholesale trade ............................................. 59,240 11 36.5 106.0 28.8 6.1 13.4 5.4 15.0 1.9 2.2 9.6 .3 .6Retail trade .................................................... 120,640 7 35.3 104.5 32.0 4.0 17.3 3.9 16.0 2.2 2.9 4.1 .2 2.2Transportation and warehousing ................... 95,040 20 89.9 225.2 43.0 13.7 30.4 9.0 30.8 3.6 3.7 25.0 .1 2.9Utilities ........................................................... 3,780 10 28.2 69.0 11.8 3.8 10.2 3.4 8.4 1.1 2.9 5.2 – 1.4
Information ......................................................... 15,730 12 19.9 62.3 10.2 4.8 11.5 3.7 3.7 2.0 1.6 5.4 – 1.8Financial activities ............................................. 26,350 9 11.0 36.9 6.4 3.4 10.1 1.2 2.8 3.3 1.0 1.6 – .6
Real estate and rental and leasing ................ 16,350 10 27.2 91.5 22.1 9.6 18.0 3.4 8.6 2.2 1.9 3.9 – 1.6Professional and business services .................. 77,720 10 14.9 53.2 10.3 3.2 9.8 2.5 5.2 1.9 1.8 4.0 .1 3.0
Professional, scientific, and technicalservices ....................................................... 19,360 8 6.7 25.4 3.9 .9 5.2 .6 1.7 1.8 1.4 1.5 – 3.8
Management of companies and enterprises 5,530 7 8.8 26.6 4.0 1.5 6.4 2.0 2.9 1.8 .6 1.4 – 1.1Administrative and support and wastemanagement and remediation services ....... 52,830 10 30.2 107.3 22.8 7.4 18.4 5.8 11.4 2.2 3.1 9.1 .2 2.6
Education and health services ........................... 175,900 6 42.9 114.1 13.3 3.1 25.5 4.4 11.4 2.0 4.9 3.9 – 13.7Educational services ...................................... 11,460 5 14.3 61.5 9.4 3.9 15.7 3.9 3.7 1.3 2.0 2.3 – 8.2Health care and social assistance ................. 164,440 6 46.9 121.3 13.8 2.9 26.8 4.5 12.4 2.1 5.3 4.1 – 14.4
Leisure and hospitality ....................................... 90,920 7 22.5 97.2 26.9 4.1 22.6 4.2 7.7 1.9 9.1 2.1 .1 2.9Arts, entertainment, and recreation ............... 15,770 7 36.1 121.1 29.4 6.6 21.1 6.1 7.1 1.9 4.5 4.3 – 8.6Accommodation and food services ................ 75,140 6 20.3 93.4 26.5 3.7 22.8 3.9 7.8 1.9 9.8 1.7 .1 2.0
Other services ................................................... 25,940 11 25.3 85.1 20.9 5.5 16.0 3.0 9.8 2.6 3.2 5.4 – 2.9
See footnotes at end of table.
8

TABLE 1. Number, median days away from work1, and incidence rate2 for nonfatal occupational injuries and illnesses involving days away from work3 by ownership, industry,musculoskeletal disorders4, and event or exposure, 2014 — Continued
Industry NumberMedian
days awayfrom work
Musculo-skeletal
disorders(incidence
rate)
Incidencerate
Event or exposure leading to injury or illness(incidence rate)
Contactwith
objects
Fallto
lowerlevel
Fallon
samelevel
Slipsor
tripswithout
fall
Over-exertion inlifting/low-
ering
Repetitivemotion
Exposureto
harmfulsub-
stancesor
environ-ments
Transpor-tation in-cidents
Firesand
explo-sions
Violenceand otherinjuries bypersons
or animal
Total state government5,6,7 ................................... 67,400 12 42.1 170.3 20.7 5.5 28.8 7.0 10.3 3.3 5.9 11.2 0.2 32.1
Total service providing ........................................... 65,520 12 41.4 168.8 19.9 5.2 28.7 6.8 10.1 3.3 5.8 10.9 .2 32.8Education and health services ........................... 27,820 9 39.7 139.2 16.3 3.8 25.8 4.6 10.5 1.8 3.7 3.6 – 38.2
Educational services ...................................... 8,380 8 20.1 57.6 9.4 3.0 15.3 3.0 6.2 1.3 2.0 1.5 – 2.0Health care and social assistance ................. 19,450 10 92.1 357.7 34.6 5.9 53.8 9.0 21.9 3.2 8.1 9.4 – 135.2
Public administration ......................................... 33,240 13 40.1 190.2 21.7 5.5 31.0 8.8 8.9 5.1 7.5 12.7 .4 28.6Justice, public order, and safety activities ..... 19,300 14 62.1 272.8 32.5 7.0 50.9 16.4 9.3 4.7 11.9 18.0 .6 63.9
Total local government5,6,7 ................................... 173,570 10 48.4 166.4 22.9 6.8 35.1 8.0 14.7 2.9 6.3 10.0 .6 22.0
Total goods producing ........................................... 3,000 11 92.6 295.1 60.5 29.7 41.8 10.8 26.4 6.1 6.8 20.3 – 23.3Construction ...................................................... 2,990 11 93.0 296.4 60.4 29.9 42.2 10.9 26.6 6.1 6.7 20.5 – 23.5
Total service providing ........................................... 170,570 10 47.9 165.1 22.5 6.5 35.0 7.9 14.6 2.9 6.3 9.9 .6 22.0Trade, transportation and utilities7 ..................... 12,810 16 76.2 274.4 37.6 11.3 38.3 11.8 15.7 4.1 21.7 32.9 – 13.2
Transportation and warehousing ................... 9,460 21 98.7 395.5 49.8 14.7 48.7 15.9 10.3 4.6 33.3 57.6 – 20.2Utilities ........................................................... 3,340 9 53.2 148.8 25.0 7.7 27.9 7.6 21.6 3.7 9.6 7.1 – 6.0
Education and health services ........................... 68,840 7 30.0 110.6 13.2 4.2 32.2 5.7 10.0 1.8 2.9 3.9 – 15.4Educational services ...................................... 57,470 7 25.8 104.7 12.8 4.6 32.0 5.6 9.2 1.7 2.5 3.8 – 14.9Health care and social assistance ................. 11,370 7 61.4 155.0 16.2 1.8 34.3 5.9 15.9 2.5 5.6 4.7 – 19.3
Public administration ......................................... 81,300 12 72.4 246.8 35.9 10.4 39.9 11.9 20.8 4.1 10.5 18.2 1.7 36.6Justice, public order, and safety activities ..... 34,870 12 103.9 392.9 52.6 10.5 66.0 15.3 28.0 4.0 16.8 25.6 2.8 78.7
1 Median days away from work is the measure used to summarize the varying lengths of absences fromwork among the cases with days away from work. Half the cases involved more days and half involved fewerdays than a specified median. Median days away from work are represented in actual values.
2 The incidence rates represent the number of injuries and illnesses per 10,000 full-time workers and werecalculated as (N/EH) x 20,000,000, where
N = number of injuries and illnessesEH = total hours worked by all employees during the calendar year20,000,000 = base for 10,000 equivalent full-time workers(working 40 hours per week, 50 weeks per year).
3 Days-away-from-work cases include those that resulted in days away from work, some of which alsoincluded job transfer or restriction.
4 Musculoskeletal disorders include cases in which the nature of the injury or illness is pinched nerve;herniated disc; meniscus tear; sprains, strains, tears; hernia (traumatic and nontraumatic); pain, swelling, andnumbness; carpal or tarsal tunnel syndrome; Raynaud’s syndrome or phenomenon; musculoskeletal systemand connective tissue diseases and disorders, and when the event or exposure leading to the injury or illnessis overexertion and bodily reaction, unspecified; overexertion involving outside sources; repetitive motioninvolving microtasks; other and multiple exertions or bodily reactions; and rubbed, abraded, or jarred by
vibration.5 Excludes farms with fewer than 11 employees.6 Data for Mining (Sector 21 in the North American Industry Classification System-- United States, 2012)
include establishments not governed by the Mine Safety and Health Administration rules and reporting, suchas those in Oil and Gas Extraction and related support activities. Data for mining operators in coal, metal, andnonmetal mining are provided to BLS by the Mine Safety and Health Administration, U.S. Department ofLabor. Independent mining contractors are excluded from the coal, metal, and nonmetal mining industries. These data do not reflect the changes the Occupational Safety and Health Administration made to itsrecordkeeping requirements effective January 1, 2002; therefore, estimates for these industries are notcomparable to estimates in other industries.
7 Data for employers in rail transportation are provided to BLS by the Federal Railroad Administration, U.S.Department of Transportation.
Note: Dash indicates data do not meet publication guidelines. Because of rounding and data exclusion ofnonclassifiable responses, data may not sum to the totals.
Source: U.S. Bureau of Labor Statistics, Survey of Occupational Injuries and Illnesses, in cooperation withparticipating state agencies.
9

TABLE 2. Number, median days away from work1, and incidence rate2 for nonfatal occupational injuries and illnesses involving days away from work3 by ownership, industry, and nature ofinjury, 2014
Industry NumberMedian
days awayfrom work
Incidencerate
Nature of injury or illness4
(incidence rate)
Sprains,strains,tears
FracturesCuts,lacer-ations
Amputa-tions
Bruises,contu-sions
Heat(thermal)
burns
Chemicalburns
Carpaltunnel
syndrome
Tendonitis(other or
un-specified)
Multipletraumaticinjuriesand dis-orders
Soreness,pain, in-cludingback
Allother
natures5
Total private, state and local government .. 1,157,410 9 107.1 38.9 8.8 7.3 0.5 9.0 1.3 0.3 0.7 0.2 3.3 18.3 16.9
Total private industry6,7,8 ......................... 916,440 9 97.8 35.4 8.6 7.6 .5 7.9 1.4 .4 .7 .2 2.8 16.0 14.9
Total goods producing .............................. 225,180 10 114.4 33.5 12.5 12.4 1.3 7.7 1.4 .8 1.3 .3 3.2 16.4 21.0Natural resources and mining6,7 ........... 24,730 10 133.0 37.8 17.5 11.3 .8 11.4 1.3 .7 .1 – 4.0 18.2 28.1
Agriculture, forestry, fishing, andhunting6 .......................................... 17,050 6 179.0 48.4 16.5 16.4 .6 16.5 .8 1.1 – – 6.1 31.1 38.0
Mining7 .............................................. 7,680 31 84.7 26.6 18.5 6.0 .9 5.9 1.9 .3 .2 – 1.8 4.6 17.7Construction ......................................... 74,460 10 132.7 36.3 16.1 16.1 .5 6.7 .7 1.0 .2 – 4.3 23.0 23.5Manufacturing ....................................... 125,990 10 103.1 31.6 10.0 10.9 1.7 7.7 1.7 .8 1.9 .5 2.6 13.1 18.8
Total service providing .............................. 691,260 8 93.4 35.8 7.5 6.3 .2 8.0 1.4 .2 .6 .2 2.7 15.9 13.3Trade, transportation and utilities8 ........ 278,700 11 127.2 52.7 11.1 9.2 .4 11.7 .7 .3 .6 .2 3.3 18.8 16.9
Wholesale trade ................................ 59,240 11 106.0 41.0 12.7 6.9 .8 7.8 .4 .3 .5 .1 2.7 16.9 14.2Retail trade ....................................... 120,640 7 104.5 39.6 8.1 10.6 .3 11.6 1.0 .3 .3 .2 2.4 14.2 14.8Transportation and warehousing ...... 95,040 20 225.2 106.8 17.6 9.1 .3 18.4 .4 .4 1.2 .4 6.6 35.1 27.2Utilities .............................................. 3,780 10 69.0 32.8 6.2 3.0 – 3.0 .6 – – – 1.7 9.1 10.8
Information ............................................ 15,730 12 62.3 27.9 4.8 3.2 .1 4.2 .1 – .8 .2 2.3 7.6 10.4Financial activities ................................ 26,350 9 36.9 9.6 3.1 2.1 – 2.9 .1 – 1.4 .1 1.4 9.8 6.1
Real estate and rental and leasing ... 16,350 10 91.5 23.1 7.8 6.3 .2 6.1 .3 – – – 3.2 28.7 14.5Professional and business services ..... 77,720 10 53.2 16.7 5.4 3.5 .1 3.4 .3 .1 .5 .1 2.0 9.7 9.7
Professional, scientific, and technicalservices .......................................... 19,360 8 25.4 5.2 3.2 1.4 – 1.1 – – .6 – .9 4.5 6.0
Management of companies andenterprises ...................................... 5,530 7 26.6 8.9 2.9 1.5 .1 2.2 .2 – .5 .1 1.1 6.2 2.7
Administrative and support andwaste management andremediation services ....................... 52,830 10 107.3 37.7 9.8 7.6 .2 7.5 .9 .4 .4 .1 3.9 19.1 18.5
Education and health services .............. 175,900 6 114.1 50.6 6.9 3.0 .1 10.3 1.0 .2 .4 .3 3.5 21.9 14.8Educational services ......................... 11,460 5 61.5 21.3 7.1 2.9 .1 5.5 .5 – .3 – 2.1 10.2 10.7Health care and social assistance .... 164,440 6 121.3 54.6 6.9 3.0 .1 11.0 1.0 .2 .4 .3 3.7 23.5 15.3
Leisure and hospitality .......................... 90,920 7 97.2 27.7 6.8 13.0 .3 8.5 6.8 .6 .2 .2 2.6 16.2 13.8Arts, entertainment, and recreation .. 15,770 7 121.1 41.1 13.5 8.6 .5 8.8 1.7 .4 .2 .8 4.8 17.1 22.0Accommodation and food services ... 75,140 6 93.4 25.5 5.7 13.7 .3 8.4 7.6 .6 .2 .1 2.3 16.0 12.4
Other services ...................................... 25,940 11 85.1 25.2 10.3 7.7 .4 4.1 .8 .1 .9 – 2.7 15.3 15.3
See footnotes at end of table.
10

TABLE 2. Number, median days away from work1, and incidence rate2 for nonfatal occupational injuries and illnesses involving days away from work3 by ownership, industry, and nature ofinjury, 2014 — Continued
Industry NumberMedian
days awayfrom work
Incidencerate
Nature of injury or illness4
(incidence rate)
Sprains,strains,tears
FracturesCuts,lacer-ations
Amputa-tions
Bruises,contu-sions
Heat(thermal)
burns
Chemicalburns
Carpaltunnel
syndrome
Tendonitis(other or
un-specified)
Multipletraumaticinjuriesand dis-orders
Soreness,pain, in-cludingback
Allother
natures5
Total state government6,7,8 ...................... 67,400 12 170.3 60.8 8.9 4.6 0.4 14.9 0.5 0.3 0.7 0.4 6.9 34.7 36.2
Total service providing .............................. 65,520 12 168.8 59.9 8.6 4.5 .4 14.8 .5 .3 .7 .4 6.9 34.5 36.2Education and health services .............. 27,820 9 139.2 53.8 7.6 3.8 .2 15.5 .9 .5 .3 .2 6.1 33.3 16.0
Educational services ......................... 8,380 8 57.6 24.4 5.5 2.7 .2 5.2 .4 .3 .3 .2 3.0 7.8 7.1Health care and social assistance .... 19,450 10 357.7 132.6 13.4 6.5 – 43.0 2.0 1.1 .3 – 14.5 101.5 40.0
Public administration ............................ 33,240 13 190.2 57.9 9.5 4.8 .6 12.8 .2 – 1.1 .6 7.4 35.2 58.6Justice, public order, and safetyactivities .......................................... 19,300 14 272.8 99.1 8.8 7.5 – 21.8 .3 – 2.2 .5 14.8 64.3 49.8
Total local government6,7,8 ...................... 173,570 10 166.4 62.9 11.4 5.4 .5 16.4 1.0 .2 .9 .4 6.4 32.5 26.7
Total goods producing .............................. 3,000 11 295.1 123.2 9.3 10.0 – 43.2 – – – – 3.8 42.0 53.8Construction ......................................... 2,990 11 296.4 123.6 9.4 10.1 – 43.6 – – – – 3.9 42.3 54.0
Total service providing .............................. 170,570 10 165.1 62.3 11.4 5.3 .5 16.1 1.0 .2 .9 .4 6.4 32.4 26.5Trade, transportation and utilities8 ........ 12,810 16 274.4 107.9 13.9 10.0 .6 25.8 1.1 .4 1.5 – 9.2 33.7 66.3
Transportation and warehousing ...... 9,460 21 395.5 141.9 15.3 14.2 – 43.3 – – – – 13.2 52.9 108.4Utilities .............................................. 3,340 9 148.8 72.9 12.6 5.7 1.0 7.5 2.0 – 2.4 – 5.2 13.6 22.3
Education and health services .............. 68,840 7 110.6 42.0 7.9 3.1 .1 12.8 .7 .1 .8 .2 5.6 21.9 14.8Educational services ......................... 57,470 7 104.7 38.2 8.1 3.0 .2 12.6 .5 .1 .8 .2 5.9 20.2 14.3Health care and social assistance .... 11,370 7 155.0 69.8 6.4 3.4 – 13.8 1.7 .3 .9 – 4.0 35.2 18.5
Public administration ............................ 81,300 12 246.8 92.6 18.1 8.5 1.2 21.5 1.4 .3 .7 .7 7.5 50.4 40.2Justice, public order, and safetyactivities .......................................... 34,870 12 392.9 157.7 29.7 12.9 – 48.0 1.5 .5 .7 2.3 11.9 56.6 63.8
1 Median days away from work is the measure used to summarize the varying lengths of absences fromwork among the cases with days away from work. Half the cases involved more days and half involved fewerdays than a specified median. Median days away from work are represented in actual values.
2 The incidence rates represent the number of injuries and illnesses per 10,000 full-time workers and werecalculated as (N/EH) x 20,000,000, where
N = number of injuries and illnessesEH = total hours worked by all employees during the calendar year20,000,000 = base for 10,000 equivalent full-time workers(working 40 hours per week, 50 weeks per year).
3 Days-away-from-work cases include those that resulted in days away from work, some of which alsoincluded job transfer or restriction.
4 Data shown in columns correspond to the following Nature codes: Sprains, strains, tears = 123; Fractures= 111; Cuts, lacerations, punctures, Total = 132-133; Cuts, lacerations = 132; Punctures = 133; Bruises,contusions = 143; Heat burns = 152; Chemical burns = 151; Amputations = 1311; Carpal tunnel syndrome =2241; Tendonitis (other or unspecified) = 2735; Multiple traumatic injuries and illnesses, Total = 18; Withfractures and other injuries = 183; With sprains and other injuries = 182; Soreness, pain = 1972; All othernatures = all remaining codes, including 9999 (Nonclassifiable). These codes are based on the OccupationalInjury and Illness Classification System 2.01 developed by the Bureau of Labor Statistics.
5 Includes nonclassifiable responses.6 Excludes farms with fewer than 11 employees.7 Data for Mining (Sector 21 in the North American Industry Classification System-- United States, 2012)
include establishments not governed by the Mine Safety and Health Administration rules and reporting, such asthose in Oil and Gas Extraction and related support activities. Data for mining operators in coal, metal, andnonmetal mining are provided to BLS by the Mine Safety and Health Administration, U.S. Department of Labor. Independent mining contractors are excluded from the coal, metal, and nonmetal mining industries. These datado not reflect the changes the Occupational Safety and Health Administration made to its recordkeepingrequirements effective January 1, 2002; therefore, estimates for these industries are not comparable toestimates in other industries.
8 Data for employers in rail transportation are provided to BLS by the Federal Railroad Administration, U.S.Department of Transportation.
Note: Dash indicates data do not meet publication guidelines. Because of rounding and data exclusion ofnonclassifiable responses, data may not sum to the totals.
Source: U.S. Bureau of Labor Statistics, Survey of Occupational Injuries and Illnesses, in cooperation withparticipating state agencies.
11

TABLE 3. Number, incidence rate1, and median days away from work2 for nonfatal occupational injuries and illnesses involving days away from work3 by summary occupational groups andownership, 2014
Occupation
Total private,state, and local government4,5,6
Privateindustry4,5,6
Stategovernment5,6
Localgovernment5,6
Number Incidencerate
Mediandays awayfrom work
Number Incidencerate
Mediandays awayfrom work
Number Incidencerate
Mediandays awayfrom work
Number Incidencerate
Mediandays awayfrom work
Total ....................................................................................... 1,157,410 107.1 9 916,440 97.8 9 67,400 170.3 12 173,570 166.4 10
Management occupations .............................................................. 24,390 36.9 7 20,510 34.6 7 910 42.8 5 2,970 61.4 8Business and financial operations occupations ............................. 8,770 15.7 7 6,560 13.0 9 1,580 52.1 6 630 26.7 5Computer and mathematical occupations ..................................... 2,740 8.3 6 2,100 6.8 6 240 18.7 7 410 31.9 7Architecture and engineering occupations ..................................... 3,960 18.8 19 3,580 18.1 16 220 29.0 31 170 24.5 14Life, physical, and social science occupations .............................. 3,300 37.1 7 2,240 35.4 5 530 34.4 16 520 53.5 21Community and social services occupations ................................. 14,370 94.9 6 7,010 74.8 5 4,480 189.0 9 2,880 87.9 3Legal occupations .......................................................................... 1,400 15.5 10 980 13.2 10 170 22.2 5 260 29.7 13Education, training, and library occupations .................................. 36,540 59.0 5 9,890 69.3 5 1,080 16.9 6 25,570 66.3 5Arts, design, entertainment, sports, and media occupations ......... 6,410 47.9 7 5,740 46.2 7 120 30.1 10 550 90.8 5Healthcare practitioners and technical occupations ...................... 64,500 103.6 7 51,060 92.9 7 6,070 227.3 11 7,370 153.8 9Healthcare support occupations .................................................... 64,240 220.6 6 55,200 201.3 6 5,120 575.3 9 3,930 390.7 7Protective service occupations ...................................................... 78,910 298.7 12 9,270 97.5 8 17,600 454.4 14 52,030 426.0 11Food preparation and serving related occupations ........................ 76,450 96.9 6 69,690 91.6 5 1,530 454.4 9 5,230 160.5 9Building and grounds cleaning and maintenance occupations ...... 84,090 258.5 9 58,570 214.2 8 4,360 522.0 10 21,160 490.2 10Personal care and service occupations ......................................... 30,370 110.3 6 26,090 103.9 5 2,640 585.9 14 1,640 75.0 9Sales and related occupations ....................................................... 55,900 51.8 9 55,460 51.1 9 260 169.6 9 180 44.2 2Office and administrative support occupations .............................. 81,750 50.4 10 70,750 49.0 10 3,910 62.5 4 7,090 58.5 10Farming, fishing, and forestry occupations .................................... 15,160 149.8 6 14,780 147.8 6 220 181.7 5 160 188.0 9Construction and extraction occupations ....................................... 88,910 189.5 12 73,460 168.9 11 4,460 503.2 8 10,990 400.6 18Installation, maintenance, and repair occupations ......................... 94,430 202.9 11 81,730 189.6 10 2,640 328.8 12 10,060 354.4 11Production occupations ................................................................. 108,130 136.5 8 104,980 133.6 8 520 298.7 9 2,630 234.2 10Transportation and material moving occupations .......................... 203,180 – 14 182,800 246.7 14 3,500 – 21 16,880 464.9 13
1 The incidence rates represent the number of injuries and illnesses per 10,000 full-time workers and werecalculated as (N/EH) x 20,000,000, where
N = number of injuries and illnessesEH = total hours worked by all employees during the calendar year20,000,000 = base for 10,000 equivalent full-time workers(working 40 hours per week, 50 weeks per year).
2 Median days away from work is the measure used to summarize the varying lengths of absences from workamong the cases with days away from work. Half the cases involved more days and half involved fewer daysthan a specified median. Median days away from work are represented in actual values.
3 Days-away-from-work cases include those that resulted in days away from work, some of which alsoincluded job transfer or restriction.
4 Excludes farms with fewer than 11 employees.5 Data for Mining (Sector 21 in the North American Industry Classification System-- United States, 2012)
include establishments not governed by the Mine Safety and Health Administration rules and reporting, such as
those in Oil and Gas Extraction and related support activities. Data for mining operators in coal, metal, andnonmetal mining are provided to BLS by the Mine Safety and Health Administration, U.S. Department of Labor. Independent mining contractors are excluded from the coal, metal, and nonmetal mining industries. These datado not reflect the changes the Occupational Safety and Health Administration made to its recordkeepingrequirements effective January 1, 2002; therefore, estimates for these industries are not comparable to estimatesin other industries.
6 Data for employers in rail transportation are provided to BLS by the Federal Railroad Administration, U.S.Department of Transportation.
Note: Dash indicates data do not meet publication guidelines. Because of rounding and data exclusion ofnonclassifiable responses, data may not sum to the totals.
Source: U.S. Bureau of Labor Statistics, Survey of Occupational Injuries and Illnesses, in cooperation withparticipating state agencies.
12

TABLE 4. Number, incidence rate,1 and median days away from work2 for nonfatal occupational injuries and illnesses involving days away from work3 by selected worker occupation4 andownership, 2014
Occupation4
Total private,state, and local government5,6,7
Privateindustry5,6,7
Stategovernment6,7
Localgovernment6,7
Number Incidencerate
Mediandays awayfrom work
Number Incidencerate
Mediandays awayfrom work
Number Incidencerate
Mediandays awayfrom work
Number Incidencerate
Mediandays awayfrom work
Total ....................................................................................... 1,157,410 107.1 9 916,440 97.8 9 67,400 170.3 12 173,570 166.4 10
Police and Sheriffs Patrol Officers ................................................. 27,660 485.8 10 130 194.4 10 3,300 523.0 10 24,230 519.9 10Firefighters ..................................................................................... 14,440 448.4 13 250 170.2 15 590 609.3 8 13,600 495.2 14Highway Maintenance Workers ..................................................... 5,110 433.0 8 120 191.0 30 2,660 761.0 8 2,320 320.5 7Correctional Officers and Jailers .................................................... 16,050 423.3 14 390 190.8 4 10,590 491.2 17 5,070 374.2 8Nursing Assistants ......................................................................... 39,020 372.5 6 34,250 353.6 6 1,630 586.4 11 3,140 565.6 7
Heavy and Tractor-Trailer Truck Drivers ....................................... 55,710 365.5 20 54,030 355.4 20 190 – 3 1,490 840.8 8Emergency Medical Technicians and Paramedics ........................ 7,010 333.0 9 4,650 342.9 7 70 – 12 2,290 336.4 16Construction Laborers ................................................................... 22,190 309.7 9 20,300 294.2 7 130 463.1 8 1,750 629.8 40Light Truck or Delivery Services Drivers ........................................ 22,420 299.9 20 21,950 293.9 20 130 – 12 340 532.1 6Heating, Air Conditioning, and Refrigeration Mechanics andInstallers ...................................................................................... 6,590 284.7 8 6,150 279.9 8 110 254.8 30 330 368.2 11
Nonfarm Animal Caretakers .......................................................... 3,090 274.0 5 2,860 257.0 5 50 – 3 190 – 11Maids and Housekeeping Cleaners ............................................... 18,390 271.9 7 17,150 261.9 6 480 858.1 9 760 388.8 10Telecommunications Equipment Installers and Repairers, ExceptLine Installers ............................................................................... 5,110 269.8 18 5,080 271.3 18 – – – 20 – 12
Landscaping and Groundskeeping Workers .................................. 18,190 264.8 8 11,490 190.4 7 770 617.3 8 5,930 833.7 13Janitors and Cleaners, Except Maids and HousekeepingCleaners ...................................................................................... 39,290 258.1 9 23,450 202.6 9 2,840 497.8 11 12,990 434.0 9
Maintenance and Repair Workers, General .................................. 27,460 250.7 10 20,910 227.5 10 1,390 345.5 15 5,160 380.1 10Carpenters ..................................................................................... 12,480 238.0 17 11,710 227.3 16 260 701.6 31 500 536.6 24Taxi Drivers and Chauffeurs .......................................................... 3,410 237.2 11 3,200 229.7 11 20 – 3 190 402.7 10Electrical Power-Line Installers and Repairers .............................. 2,510 223.8 17 1,810 182.2 10 – – – 690 556.3 78Automotive Service Technicians and Mechanics .......................... 11,830 209.8 7 11,160 203.9 7 210 364.9 5 470 322.9 6
Laundry and Dry-Cleaning Workers .............................................. 3,060 200.3 13 2,860 191.2 15 80 – 5 130 442.7 2Reservation and Transportation Ticket Agents and Travel Clerks 2,250 199.4 22 2,250 198.1 22 – – – – – –Bus and Truck Mechanics and Diesel Engine Specialists ............. 4,700 199.1 12 3,250 158.0 14 360 1,118.9 18 1,090 409.9 6Painters, Construction and Maintenance ....................................... 3,240 196.7 25 2,920 185.5 30 120 – 27 200 341.0 16Bus Drivers, School or Special Client ............................................ 6,710 192.9 13 2,780 168.0 15 80 – 3 3,860 226.6 12
Stock Clerks and Order Fillers ....................................................... 25,250 189.0 9 24,900 187.9 9 180 197.3 7 180 130.5 6Food Service Managers ................................................................. 3,400 182.6 7 3,200 176.8 7 50 – 1 160 340.3 8Food Servers, Nonrestaurant ........................................................ 2,990 181.5 7 2,720 170.8 7 110 – 22 160 260.6 13Operating Engineers and Other Construction EquipmentOperators ..................................................................................... 5,670 177.5 23 1,990 74.2 19 530 461.1 5 3,140 785.6 23
Cleaners of Vehicles and Equipment ............................................. 4,350 175.9 7 4,220 172.0 6 20 – 7 110 259.6 8
Laborers and freight, stock, and material movers, hand ................ 55,370 – 9 52,800 284.5 9 310 – 13 2,260 999.4 8
1 The incidence rates represent the number of injuries and illnesses per 10,000 full-time workers and werecalculated as (N/EH) x 20,000,000, where
N = number of injuries and illnessesEH = total hours worked by all employees during the calendar year20,000,000 = base for 10,000 equivalent full-time workers(working 40 hours per week, 50 weeks per year).
2 Median days away from work is the measure used to summarize the varying lengths of absences from workamong the cases with days away from work. Half the cases involved more days and half involved fewer daysthan a specified median. Median days away from work are represented in actual values.
3 Days-away-from-work cases include those that resulted in days away from work, some of which alsoincluded job transfer or restriction.
4 These occupations have at least 0.1% of full-time equivalent employment.5 Excludes farms with fewer than 11 employees.6 Data for Mining (Sector 21 in the North American Industry Classification System-- United States, 2012)
include establishments not governed by the Mine Safety and Health Administration rules and reporting, such asthose in Oil and Gas Extraction and related support activities. Data for mining operators in coal, metal, andnonmetal mining are provided to BLS by the Mine Safety and Health Administration, U.S. Department of Labor. Independent mining contractors are excluded from the coal, metal, and nonmetal mining industries. These datado not reflect the changes the Occupational Safety and Health Administration made to its recordkeepingrequirements effective January 1, 2002; therefore, estimates for these industries are not comparable to estimatesin other industries.
7 Data for employers in rail transportation are provided to BLS by the Federal Railroad Administration, U.S.Department of Transportation.
Note: Dash indicates data do not meet publication guidelines. Because of rounding and data exclusion ofnonclassifiable responses, data may not sum to the totals.
Source: U.S. Bureau of Labor Statistics, Survey of Occupational Injuries and Illnesses, in cooperation withparticipating state agencies.
13

TABLE 5. Number, incidence rate1, and median days away from work2 for nonfatal occupational injuries and illnesses involving days away from work3 by injury or illnesscharacteristics and ownership, 2014
Characteristic
Total private, state, and localgovernment4,5,6
Private industry4,5,6
State government5,6
Local government5,6
Number Incidencerate
Mediandays awayfrom work
Number Incidencerate
Mediandays awayfrom work
Number Incidencerate
Mediandays awayfrom work
Number Incidencerate
Mediandays awayfrom work
Total .............................................................................. 1,157,410 107.1 9 916,440 97.8 9 67,400 170.3 12 173,570 166.4 10
Musculoskeletal disorders7 ............................................... 365,580 33.8 13 298,460 31.9 13 16,670 42.1 14 50,450 48.4 13
Nature of injury or illness:Fractures ........................................................................... 95,550 8.8 32 80,160 8.6 35 3,520 8.9 21 11,870 11.4 26Sprains, strains, tears ....................................................... 420,870 38.9 10 331,180 35.4 10 24,080 60.8 13 65,610 62.9 11Amputations ...................................................................... 4,900 .5 19 4,250 .5 21 140 .4 7 510 .5 13Cuts, lacerations, punctures ............................................. 94,670 8.8 3 84,840 9.1 3 2,270 5.7 5 7,550 7.2 4
Cuts, lacerations ........................................................... 78,510 7.3 4 71,100 7.6 4 1,800 4.6 5 5,610 5.4 4Punctures (except gunshot wounds) ............................ 16,160 1.5 2 13,740 1.5 2 470 1.2 4 1,940 1.9 4
Bruises, contusions ........................................................... 97,080 9.0 5 74,140 7.9 5 5,880 14.9 5 17,060 16.4 6Chemical burns and corrosions ........................................ 3,750 .3 3 3,440 .4 4 110 .3 2 200 .2 3Heat (thermal) burns ......................................................... 14,120 1.3 5 12,890 1.4 5 220 .5 7 1,010 1.0 5Multiple traumatic injuries ................................................. 36,040 3.3 10 26,680 2.8 10 2,720 6.9 11 6,640 6.4 8
With sprains .................................................................. 16,420 1.5 8 11,980 1.3 8 1,270 3.2 12 3,170 3.0 7With fractures ................................................................ 6,990 .6 31 5,540 .6 35 230 .6 26 1,220 1.2 27
Soreness, pain .................................................................. 197,870 18.3 9 150,180 16.0 9 13,740 34.7 10 33,950 32.5 10Carpal tunnel syndrome .................................................... 7,970 .7 32 6,800 .7 32 260 .7 42 910 .9 29Tendonitis (other or unspecified) ...................................... 2,440 .2 15 1,930 .2 15 140 .4 28 370 .4 6All other natures ................................................................ 182,150 16.9 9 139,940 14.9 8 14,310 36.2 13 27,900 26.7 8
Event or exposure leading to injury or illness:Violence and other injuries by persons or animal ............. 73,410 6.8 6 37,750 4.0 5 12,720 32.1 11 22,940 22.0 6Intentional injury by other person .................................... 31,380 2.9 6 15,980 1.7 5 6,270 15.8 10 9,130 8.7 5Injury by person unintentional or intent unknown ........... 27,090 2.5 8 10,270 1.1 7 5,860 14.8 14 10,970 10.5 8Animal and insect related incidents ................................ 14,390 1.3 3 11,210 1.2 3 440 1.1 4 2,740 2.6 4
Transportation incidents ................................................... 62,240 5.8 12 47,320 5.1 13 4,440 11.2 11 10,470 10.0 12Roadway incidents involving motorized land vehicles .... 44,980 4.2 11 32,930 3.5 11 3,710 9.4 9 8,340 8.0 12
Fires and explosions ......................................................... 1,980 .2 11 1,320 .1 14 80 .2 1 580 .6 6Falls, slips, trips ................................................................ 316,650 29.3 11 247,120 26.4 12 16,650 42.1 12 52,880 50.7 10Slips, trips without fall ..................................................... 48,090 4.4 10 37,020 4.0 10 2,760 7.0 12 8,300 8.0 10Fall on same level ........................................................... 203,480 18.8 10 155,480 16.6 10 11,390 28.8 11 36,610 35.1 9Fall to lower level ............................................................ 58,440 5.4 19 49,210 5.3 20 2,180 5.5 23 7,060 6.8 14
Exposure to harmful substances or environments ............ 46,000 4.3 4 37,150 4.0 3 2,320 5.9 7 6,530 6.3 6Contact with object, equipment ......................................... 256,930 23.8 5 224,840 24.0 5 8,190 20.7 6 23,900 22.9 6Struck by object or equipment ........................................ 145,300 13.4 5 129,440 13.8 5 3,870 9.8 5 11,990 11.5 5Struck against object or equipment ................................ 59,490 5.5 5 49,120 5.2 5 2,640 6.7 6 7,720 7.4 6Caught in or compressed by object or equipment .......... 37,850 3.5 9 34,440 3.7 9 1,160 2.9 5 2,250 2.2 13
Overexertion and bodily reaction ...................................... 384,260 35.6 13 312,200 33.3 13 17,960 45.4 14 54,090 51.8 13Overexertion in lifting or lowering ................................... 119,410 11.0 12 99,990 10.7 12 4,090 10.3 14 15,330 14.7 13Repetitive motion involving microtasks ........................... 29,440 2.7 23 25,120 2.7 23 1,310 3.3 21 3,020 2.9 22
All other event or exposures ............................................. 15,930 1.5 13 8,730 .9 7 5,020 12.7 13 2,170 2.1 21
See footnotes at end of table.
14

TABLE 5. Number, incidence rate1, and median days away from work2 for nonfatal occupational injuries and illnesses involving days away from work3 by injury or illnesscharacteristics and ownership, 2014 — Continued
Characteristic
Total private, state, and localgovernment4,5,6
Private industry4,5,6
State government5,6
Local government5,6
Number Incidencerate
Mediandays awayfrom work
Number Incidencerate
Mediandays awayfrom work
Number Incidencerate
Mediandays awayfrom work
Number Incidencerate
Mediandays awayfrom work
Part of body affected by the injury or illness:Head ................................................................................. 84,750 7.8 3 68,940 7.4 3 4,620 11.7 5 11,190 10.7 4
Eye(s) ........................................................................... 23,730 2.2 2 20,910 2.2 2 930 2.3 3 1,890 1.8 3Neck .................................................................................. 16,060 1.5 8 12,410 1.3 8 1,390 3.5 7 2,260 2.2 6Trunk ................................................................................. 269,290 24.9 9 218,560 23.3 9 12,670 32.0 9 38,050 36.5 10
Back .............................................................................. 200,250 18.5 8 162,720 17.4 7 9,440 23.8 9 28,090 26.9 10Upper extremities .............................................................. 346,170 32.0 10 288,240 30.8 10 15,360 38.8 12 42,570 40.8 11
Shoulder ....................................................................... 88,980 8.2 26 72,200 7.7 26 4,500 11.4 28 12,270 11.8 24Arm ............................................................................... 53,330 4.9 11 44,290 4.7 11 2,480 6.3 10 6,560 6.3 9Wrist .............................................................................. 43,980 4.1 15 36,540 3.9 14 1,590 4.0 13 5,850 5.6 18Hand ............................................................................. 137,440 12.7 5 119,810 12.8 5 5,050 12.8 8 12,570 12.1 7
Lower extremities .............................................................. 268,860 24.9 12 211,990 22.6 12 14,290 36.1 15 42,580 40.8 12Knee ............................................................................. 104,090 9.6 17 79,850 8.5 16 6,170 15.6 20 18,060 17.3 17Ankle ............................................................................. 60,830 5.6 9 47,950 5.1 8 3,050 7.7 11 9,830 9.4 11Foot ............................................................................... 52,070 4.8 9 43,460 4.6 9 2,580 6.5 7 6,030 5.8 7
Body systems ................................................................... 24,440 2.3 5 17,340 1.9 4 1,760 4.4 9 5,350 5.1 8Multiple ............................................................................. 131,910 12.2 10 89,490 9.6 10 12,300 31.1 13 30,120 28.9 7All other parts of body ....................................................... 15,930 1.5 10 9,470 1.0 5 5,010 12.7 13 1,450 1.4 5
Source of injury or illness:Chemicals and chemical products .................................... 13,840 1.3 3 11,790 1.3 3 660 1.7 3 1,380 1.3 2Containers ........................................................................ 118,540 11.0 10 104,730 11.2 10 2,830 7.1 11 10,980 10.5 12Furniture and fixtures ........................................................ 47,140 4.4 7 38,140 4.1 6 2,360 6.0 6 6,640 6.4 9Machinery ......................................................................... 55,870 5.2 10 50,480 5.4 9 1,320 3.3 9 4,070 3.9 18Parts and materials ........................................................... 86,320 8.0 10 77,860 8.3 9 1,750 4.4 12 6,710 6.4 11Person, injured or ill worker .............................................. 184,720 17.1 13 141,490 15.1 13 10,590 26.7 14 32,640 31.3 12
Worker motion or position ............................................. 174,640 16.2 13 135,110 14.4 13 9,950 25.1 13 29,580 28.4 11Person, other than injured or ill worker ............................. 108,790 10.1 7 65,300 7.0 7 15,790 39.9 12 27,690 26.5 7
Patient ........................................................................... 58,090 5.4 7 43,920 4.7 7 8,220 20.8 10 5,950 5.7 9Floors, walkways, ground surfaces ................................... 207,620 19.2 10 158,730 16.9 11 12,390 31.3 14 36,490 35.0 9Handtools .......................................................................... 44,350 4.1 5 38,790 4.1 5 1,250 3.1 6 4,320 4.1 8Ladder ............................................................................... 21,240 2.0 15 19,050 2.0 15 270 .7 35 1,920 1.8 9Vehicles ............................................................................ 116,390 10.8 12 93,970 10.0 12 6,190 15.6 10 16,230 15.6 10
Trucks ........................................................................... 30,040 2.8 18 26,300 2.8 18 990 2.5 10 2,740 2.6 18Cart, dolly, hand truck nonpowered .............................. 14,820 1.4 9 13,090 1.4 10 560 1.4 11 1,180 1.1 3
All other sources ............................................................... 152,610 14.1 6 116,100 12.4 5 12,010 30.3 11 24,500 23.5 8
1 The incidence rates represent the number of injuries and illnesses per 10,000 full-time workers andwere calculated as (N/EH) x 20,000,000, where
N = number of injuries and illnessesEH = total hours worked by all employees during the calendar year20,000,000 = base for 10,000 equivalent full-time workers(working 40 hours per week, 50 weeks per year).
2 Median days away from work is the measure used to summarize the varying lengths of absencesfrom work among the cases with days away from work. Half the cases involved more days and halfinvolved fewer days than a specified median. Median days away from work are represented in actualvalues.
3 Days-away-from-work cases include those that resulted in days away from work, some of which alsoincluded job transfer or restriction.
4 Excludes farms with fewer than 11 employees.5 Data for Mining (Sector 21 in the North American Industry Classification System-- United States,
2012) include establishments not governed by the Mine Safety and Health Administration rules andreporting, such as those in Oil and Gas Extraction and related support activities. Data for miningoperators in coal, metal, and nonmetal mining are provided to BLS by the Mine Safety and HealthAdministration, U.S. Department of Labor. Independent mining contractors are excluded from the coal,
metal, and nonmetal mining industries. These data do not reflect the changes the Occupational Safetyand Health Administration made to its recordkeeping requirements effective January 1, 2002; therefore,estimates for these industries are not comparable to estimates in other industries.
6 Data for employers in rail transportation are provided to BLS by the Federal Railroad Administration,U.S. Department of Transportation.
7 Musculoskeletal disorders include cases in which the nature of the injury or illness is pinched nerve;herniated disc; meniscus tear; sprains, strains, tears; hernia (traumatic and nontraumatic); pain, swelling,and numbness; carpal or tarsal tunnel syndrome; Raynaud’s syndrome or phenomenon; musculoskeletalsystem and connective tissue diseases and disorders, and when the event or exposure leading to theinjury or illness is overexertion and bodily reaction, unspecified; overexertion involving outside sources;repetitive motion involving microtasks; other and multiple exertions or bodily reactions; and rubbed,abraded, or jarred by vibration.
Note: Dash indicates data do not meet publication guidelines. Because of rounding and dataexclusion of nonclassifiable responses, data may not sum to the totals.
Source: U.S. Bureau of Labor Statistics, Survey of Occupational Injuries and Illnesses, in cooperationwith participating state agencies.
15

TABLE 6. Number, incidence rate1, and median days away from work2 for nonfatal occupational injuries and illnesses involving days away from work3 by gender, agegroups, and ownership, 2014
Characteristic
Total private, state, and localgovernment4,5,6
Private industry4,5,6
State government5,6
Local government5,6
Number Incidencerate
Mediandays awayfrom work
Number Incidencerate
Mediandays awayfrom work
Number Incidencerate
Mediandays awayfrom work
Number Incidencerate
Mediandays awayfrom work
Total ............................................................ 1,157,410 107.1 9 916,440 97.8 9 67,400 170.3 12 173,570 166.4 10
Gender:Male .................................................................. 699,470 116.5 10 560,970 103.9 10 35,120 223.9 12 103,380 224.7 12Female .............................................................. 446,280 95.1 7 348,720 89.4 7 27,590 130.5 9 69,960 120.2 7
Age:14 - 15 .............................................................. 180 – 3 130 – 4 – – – 50 – 116 - 19 .............................................................. 22,860 106.6 4 21,520 104.8 4 540 249.6 7 800 107.0 220 - 24 .............................................................. 97,680 104.9 5 88,460 101.9 5 2,250 102.2 4 6,970 165.6 525 - 34 .............................................................. 234,180 96.4 6 195,090 90.3 6 11,470 160.3 8 27,620 138.3 735 - 44 .............................................................. 244,710 104.0 10 188,490 93.2 9 14,590 179.9 12 41,620 165.3 945 - 54 .............................................................. 286,490 117.2 12 216,280 104.0 12 18,240 195.0 12 51,970 189.7 1055 - 64 .............................................................. 201,740 116.3 14 155,410 106.3 15 12,400 169.8 12 33,930 168.8 1265 and over ....................................................... 41,600 94.2 17 32,250 85.6 17 1,930 111.6 13 7,420 154.4 18
1 The incidence rates represent the number of injuries and illnesses per 10,000 full-time workersand were calculated as (N/EH) x 20,000,000, where
N = number of injuries and illnessesEH = total hours worked by all employees during the calendar year20,000,000 = base for 10,000 equivalent full-time workers(working 40 hours per week, 50 weeks per year).
2 Median days away from work is the measure used to summarize the varying lengths ofabsences from work among the cases with days away from work. Half the cases involved more daysand half involved fewer days than a specified median. Median days away from work are representedin actual values.
3 Days-away-from-work cases include those that resulted in days away from work, some of whichalso included job transfer or restriction.
4 Excludes farms with fewer than 11 employees.5 Data for Mining (Sector 21 in the North American Industry Classification System-- United
States, 2012) include establishments not governed by the Mine Safety and Health Administration
rules and reporting, such as those in Oil and Gas Extraction and related support activities. Data formining operators in coal, metal, and nonmetal mining are provided to BLS by the Mine Safety andHealth Administration, U.S. Department of Labor. Independent mining contractors are excludedfrom the coal, metal, and nonmetal mining industries. These data do not reflect the changes theOccupational Safety and Health Administration made to its recordkeeping requirements effectiveJanuary 1, 2002; therefore, estimates for these industries are not comparable to estimates in otherindustries.
6 Data for employers in rail transportation are provided to BLS by the Federal RailroadAdministration, U.S. Department of Transportation.
Note: Dash indicates data do not meet publication guidelines. Because of rounding and dataexclusion of nonclassifiable responses, data may not sum to the totals.
Source: U.S. Bureau of Labor Statistics, Survey of Occupational Injuries and Illnesses, incooperation with participating state agencies.
16

TABLE 7. Number, percent distribution, and median days away from work1 for nonfatal occupational injuries and illnesses involving days away from work2 by race orethnic origin, length of service, and ownership, 2014
Characteristic
Total private, state, and localgovernment
Privateindustry3,4,5
Stategovernment4,5
Localgovernment4,5
Number PercentMedian
days awayfrom work
Number PercentMedian
days awayfrom work
Number PercentMedian
days awayfrom work
Number PercentMedian
days awayfrom work
Total ............................................................ 1,157,410 100.0 9 916,440 100.0 9 67,400 100.0 12 173,570 100.0 10
Race or ethnic origin:6
White only ......................................................... 444,590 38.4 8 358,210 39.1 8 18,270 27.1 10 68,110 39.2 8Black only ......................................................... 88,480 7.6 8 72,280 7.9 8 6,470 9.6 14 9,740 5.6 9Hispanic or Latino only ..................................... 138,110 11.9 8 124,280 13.6 8 2,490 3.7 9 11,340 6.5 8Asian only ......................................................... 15,950 1.4 8 13,930 1.5 8 530 .8 20 1,490 .9 9Native Hawaiian or Pacific Islander only .......... 3,860 .3 9 3,460 .4 9 120 .2 15 280 .2 9American Indian or Alaskan Native only ........... 5,420 .5 7 4,020 .4 7 450 .7 12 960 .6 5Hispanic or Latino and other race ..................... 1,080 .1 5 970 .1 5 – – – 100 .1 3Multi-race .......................................................... 1,160 .1 4 1,020 .1 5 50 .1 26 90 .1 3Not reported ...................................................... 458,770 39.6 10 338,280 36.9 10 39,010 57.9 12 81,480 46.9 11
Length of service with employer:Less than 3 months .......................................... 105,430 9.1 6 98,860 10.8 6 2,060 3.1 7 4,510 2.6 43 - 11 months .................................................... 193,530 16.7 7 177,790 19.4 7 4,110 6.1 7 11,630 6.7 61 - 5 years ......................................................... 348,690 30.1 7 299,670 32.7 7 14,070 20.9 7 34,950 20.1 8More than 5 years ............................................. 483,710 41.8 12 323,760 35.3 12 40,610 60.3 14 119,340 68.8 11
1 Median days away from work is the measure used to summarize the varying lengths ofabsences from work among the cases with days away from work. Half the cases involved more daysand half involved fewer days than a specified median. Median days away from work are representedin actual values.
2 Days-away-from-work cases include those that resulted in days away from work, some of whichalso included job transfer or restriction.
3 Excludes farms with fewer than 11 employees.4 Data for Mining (Sector 21 in the North American Industry Classification System-- United
States, 2012) include establishments not governed by the Mine Safety and Health Administrationrules and reporting, such as those in Oil and Gas Extraction and related support activities. Data formining operators in coal, metal, and nonmetal mining are provided to BLS by the Mine Safety andHealth Administration, U.S. Department of Labor. Independent mining contractors are excludedfrom the coal, metal, and nonmetal mining industries. These data do not reflect the changes the
Occupational Safety and Health Administration made to its recordkeeping requirements effectiveJanuary 1, 2002; therefore, estimates for these industries are not comparable to estimates in otherindustries.
5 Data for employers in rail transportation are provided to BLS by the Federal RailroadAdministration, U.S. Department of Transportation.
6 Race and ethnicity data do not add to total. Some cases may be counted as both multi-raceand Hispanic and other race.
Note: Dash indicates data do not meet publication guidelines. Because of rounding and dataexclusion of nonclassifiable responses, data may not sum to the totals.
Source: U.S. Bureau of Labor Statistics, Survey of Occupational Injuries and Illnesses, incooperation with participating state agencies.
17

TABLE 8. Number of nonfatal occupational injuries and illnesses involving days away from work1 by worker characteristics and industry sector, 2014
CharacteristicPrivateindustry
2,3,4
Goods producing Service providing
Totalgoods
producing
Naturalresources
andmining2,3
Construc-tion
Manufac-turing
Totalservice
providing
Trade,transpor-tation andutilities4
Informa-tion
Financialactivities
Profes-sionaland
businessservices
Educationand
healthservices
Leisureand
hospitality
Otherservices
Total ............................................... 916,440 225,180 24,730 74,460 125,990 691,260 278,700 15,730 26,350 77,720 175,900 90,920 25,940
Gender:Male ..................................................... 560,970 192,320 20,670 72,270 99,380 368,650 193,960 12,200 14,880 50,450 36,420 44,070 16,670Female ................................................. 348,720 32,710 4,030 2,170 26,520 316,010 81,290 3,510 11,470 24,750 139,250 46,820 8,920
Age:14 - 15 ................................................. 130 40 40 – – 90 – – – – 30 30 –16 - 19 ................................................. 21,520 4,670 760 1,540 2,370 16,850 5,940 120 200 1,210 2,350 6,420 59020 - 24 ................................................. 88,460 21,330 3,330 7,120 10,890 67,130 26,850 890 1,370 6,510 14,880 14,080 2,55025 - 34 ................................................. 195,090 52,140 6,740 19,740 25,660 142,950 54,080 3,270 4,890 17,460 36,650 21,380 5,23035 - 44 ................................................. 188,490 50,090 5,000 18,480 26,610 138,400 55,000 3,980 5,560 16,280 36,410 15,560 5,60045 - 54 ................................................. 216,280 52,570 4,620 15,640 32,310 163,700 68,200 4,090 6,530 18,790 42,720 17,440 5,92055 - 64 ................................................. 155,410 35,190 3,110 9,070 23,020 120,210 52,060 2,670 6,510 10,350 32,960 11,760 3,91065 and over .......................................... 32,250 4,830 620 1,080 3,140 27,420 11,400 280 1,040 2,900 7,270 3,080 1,440
Length of service with employer:Less than 3 months ............................. 98,860 31,060 6,000 11,110 13,950 67,810 26,960 640 2,400 9,250 11,890 13,470 3,2003 - 11 months ....................................... 177,790 45,970 5,480 16,810 23,680 131,820 52,510 2,630 3,880 15,800 30,620 21,290 5,0901 - 5 years ............................................ 299,670 71,460 7,510 25,480 38,480 228,210 84,740 3,830 8,860 28,150 62,250 32,590 7,790More than 5 years ................................ 323,760 73,820 5,250 19,730 48,840 249,930 108,690 8,390 11,040 21,140 69,030 22,370 9,270
Race or ethnic origin:5
White only ............................................ 358,210 104,870 5,850 39,550 59,470 253,340 99,240 2,880 9,520 29,880 69,070 29,730 13,030Black only ............................................ 72,280 12,420 450 2,470 9,500 59,860 16,580 610 2,210 5,880 25,390 7,190 2,000Hispanic or Latino only ........................ 124,280 47,080 9,960 15,800 21,310 77,200 25,230 550 4,610 13,260 14,250 16,110 3,190Asian only ............................................ 13,930 2,920 80 350 2,500 11,010 2,650 110 670 1,210 3,410 2,650 300Native Hawaiian or Pacific Islanderonly .................................................... 3,460 840 60 480 300 2,620 760 30 170 370 760 500 40
American Indian or Alaskan Nativeonly .................................................... 4,020 1,070 100 430 540 2,950 750 50 180 530 830 510 100
Hispanic or Latino and other race ........ 970 150 – 100 50 820 100 – – 470 180 50 –Multi-race ............................................. 1,020 320 30 220 70 700 150 – 20 50 400 70 –Not reported ......................................... 338,280 55,520 8,200 15,070 32,250 282,760 133,250 11,490 8,960 26,070 61,620 34,110 7,270
1 Days-away-from-work cases include those that resulted in days away from work, some of whichalso included job transfer or restriction.
2 Excludes farms with fewer than 11 employees.3 Data for Mining (Sector 21 in the North American Industry Classification System-- United States,
2012) include establishments not governed by the Mine Safety and Health Administration rules andreporting, such as those in Oil and Gas Extraction and related support activities. Data for miningoperators in coal, metal, and nonmetal mining are provided to BLS by the Mine Safety and HealthAdministration, U.S. Department of Labor. Independent mining contractors are excluded from thecoal, metal, and nonmetal mining industries. These data do not reflect the changes the OccupationalSafety and Health Administration made to its recordkeeping requirements effective January 1, 2002;
therefore, estimates for these industries are not comparable to estimates in other industries. 4 Data for employers in rail transportation are provided to BLS by the Federal Railroad
Administration, U.S. Department of Transportation. 5 Race and ethnicity data do not add to total. Some cases may be counted as both multi-race and
Hispanic and other race.
Note: Dash indicates data do not meet publication guidelines. Because of rounding and dataexclusion of nonclassifiable responses, data may not sum to the totals.
Source: U.S. Bureau of Labor Statistics, Survey of Occupational Injuries and Illnesses, incooperation with participating state agencies.
18

TABLE 9. Number, median days away from work1, and percent distribution of nonfatal occupational injuries and illnesses involving days away from work2 by selected worker characteristics and days away from work groups, 2014
CharacteristicPrivateindustry
3,4,5
Percent of days-away-from-work cases involving Mediandays awayfrom work1 day 2 days 3 - 5 days 6 - 10 days 11 - 20
days21 - 30days
31 days ormore
Total ............................................... 916,440 13.9 10.7 17.1 11.8 11.3 6.3 29.0 9
Gender:Female ................................................. 348,720 14.1 11.9 18.0 12.2 11.1 5.7 27.0 7Not reported ......................................... 6,760 14.6 8.9 13.6 7.4 10.5 8.4 36.5 17
Age:16 - 19 ................................................. 21,520 18.4 17.5 24.6 11.5 12.1 5.0 10.8 420 - 24 ................................................. 88,460 19.7 14.3 19.3 14.1 10.6 4.6 17.3 525 - 34 ................................................. 195,090 16.1 12.9 20.0 11.9 11.3 5.5 22.3 635 - 44 ................................................. 188,490 14.0 10.6 16.6 11.6 11.2 6.4 29.6 945 - 54 ................................................. 216,280 11.7 9.0 15.8 11.5 11.5 6.9 33.6 1255 - 64 ................................................. 155,410 10.6 8.0 14.7 11.3 11.6 7.2 36.6 1565 and over .......................................... 32,250 10.1 8.2 13.6 10.3 10.6 7.1 40.2 17
Length of service with employer:Less than 3 months ............................. 98,860 17.0 12.1 18.6 12.6 10.1 5.9 23.6 63 - 11 months ....................................... 177,790 14.9 12.2 18.4 11.5 11.8 5.9 25.4 71 - 5 years ............................................ 299,670 14.7 11.3 17.6 12.3 10.9 5.7 27.5 7More than 5 years ................................ 323,760 11.6 8.9 15.6 11.4 11.8 7.1 33.6 12
Race or ethnic origin:6
White only ............................................ 358,210 15.8 11.0 16.8 11.2 11.0 6.9 27.3 8Black only ............................................ 72,280 13.6 11.0 18.5 12.7 10.7 6.0 27.6 8Hispanic or Latino only ........................ 124,280 13.4 11.0 18.3 11.8 11.9 5.8 27.9 8Asian only ............................................ 13,930 10.9 12.3 19.7 14.4 10.2 4.9 27.7 8Native Hawaiian or Pacific Islanderonly .................................................... 3,460 12.1 13.9 15.0 13.9 7.2 4.6 33.2 9
American Indian or Alaskan Nativeonly .................................................... 4,020 10.7 12.9 18.4 19.9 8.5 8.5 21.1 7
Hispanic or Latino and other race ........ 970 9.3 15.5 34.0 10.3 10.3 5.2 16.5 5Multi-race ............................................. 1,020 7.8 23.5 21.6 17.6 7.8 4.9 16.7 5Not reported ......................................... 338,280 12.3 9.9 16.6 12.1 11.6 5.9 31.7 10
1 Median days away from work is the measure used to summarize thevarying lengths of absences from work among the cases with days awayfrom work. Half the cases involved more days and half involved fewer daysthan a specified median. Median days away from work are represented inactual values.
2 Days-away-from-work cases include those that resulted in days awayfrom work, some of which also included job transfer or restriction.
3 Excludes farms with fewer than 11 employees.4 Data for Mining (Sector 21 in the North American Industry
Classification System-- United States, 2012) include establishments notgoverned by the Mine Safety and Health Administration rules and reporting,such as those in Oil and Gas Extraction and related support activities. Datafor mining operators in coal, metal, and nonmetal mining are provided toBLS by the Mine Safety and Health Administration, U.S. Department ofLabor. Independent mining contractors are excluded from the coal, metal,
and nonmetal mining industries. These data do not reflect the changes theOccupational Safety and Health Administration made to its recordkeepingrequirements effective January 1, 2002; therefore, estimates for theseindustries are not comparable to estimates in other industries.
5 Data for employers in rail transportation are provided to BLS by theFederal Railroad Administration, U.S. Department of Transportation.
6 Race and ethnicity data do not add to total. Some cases may becounted as both multi-race and Hispanic and other race.
Note: Dash indicates data do not meet publication guidelines. Becauseof rounding and data exclusion of nonclassifiable responses, data may notsum to the totals.
Source: U.S. Bureau of Labor Statistics, Survey of Occupational Injuriesand Illnesses, in cooperation with participating state agencies.
19

TABLE 10. Number, median days away from work1, and percent distribution of nonfatal occupational injuries and illnesses involving days away fromwork2 by selected worker occupation3 and days away from work groups, all ownerships, 2014
Occupation Total
Percent of days-away-from-work cases involving Mediandays awayfrom work1 day 2 days 3 - 5 days 6 - 10 days 11 - 20
days21 - 30days
31 days ormore
Total ....................................................................................... 1,157,410 13.3 10.5 16.8 12.3 11.5 6.6 28.9 9
Heavy and tractor-trailer truck drivers ............................................ 55,710 7.7 7.0 14.1 11.1 11.1 7.0 42.0 20Laborers and freight, stock, and material movers, hand ................ 55,370 14.6 9.9 17.0 11.9 11.3 6.4 28.8 9Janitors and cleaners, except maids and housekeeping cleaners 39,290 11.8 10.2 17.3 13.9 11.1 6.1 29.5 9Nursing assistants ......................................................................... 39,020 14.3 12.6 20.6 14.7 10.4 5.0 22.5 6Police and sheriffs patrol officers ................................................... 27,660 9.8 6.6 20.3 15.3 10.2 8.7 29.1 10
Maintenance and repair workers, general ..................................... 27,460 14.2 8.5 15.8 13.0 14.5 6.0 28.0 10Registered nurses .......................................................................... 26,830 13.0 11.0 19.3 13.1 11.7 7.4 24.5 7Stock clerks and order fillers .......................................................... 25,250 14.2 11.2 16.8 10.0 11.4 6.7 29.7 9Retail salespersons ....................................................................... 23,500 18.8 10.6 17.6 11.1 10.5 6.2 25.4 7Light truck or delivery services drivers ........................................... 22,420 9.5 6.3 13.1 10.2 11.7 6.8 42.2 20
Construction laborers ..................................................................... 22,190 14.2 10.5 19.4 10.5 10.7 6.5 28.2 9Production workers, all other ......................................................... 21,750 15.9 9.7 18.2 11.3 10.5 5.7 28.8 8Maids and housekeeping cleaners ................................................ 18,390 15.2 12.0 18.4 13.9 12.0 4.9 23.5 7Landscaping and groundskeeping workers ................................... 18,190 11.5 10.3 18.7 14.1 10.9 5.9 28.6 8Food preparation workers .............................................................. 17,050 16.2 14.7 21.0 12.1 11.3 4.4 20.3 5
Correctional officers and jailers ..................................................... 16,050 9.2 11.6 14.1 10.9 13.3 6.3 34.6 14Firefighters ..................................................................................... 14,440 8.0 7.9 14.0 11.1 20.4 10.4 28.3 13Personal care aides ....................................................................... 14,290 9.6 13.4 20.2 14.1 10.3 6.2 26.5 7First-line supervisors of retail sales workers .................................. 12,680 12.1 8.1 12.6 12.9 18.0 6.0 30.3 14Teacher assistants ......................................................................... 12,620 16.2 15.5 16.6 16.9 8.2 7.2 19.3 6
Carpenters ..................................................................................... 12,480 10.9 12.3 11.9 9.5 6.4 12.9 36.1 17Automotive service technicians and mechanics ............................ 11,830 18.7 10.7 17.8 8.4 10.3 8.0 26.2 7Driversales workers ....................................................................... 10,550 7.8 9.1 14.7 15.8 10.2 9.0 33.5 13Assemblers and fabricators, all other ............................................ 10,110 14.3 9.6 15.0 11.4 11.7 7.2 30.8 10Elementary school teachers, except special education ................. 9,310 21.7 13.4 18.7 19.7 9.1 4.0 13.4 5
Cooks, restaurant .......................................................................... 9,290 17.4 11.6 21.1 14.1 11.1 6.9 17.8 5Cashiers ......................................................................................... 8,950 12.6 11.8 16.3 12.5 8.8 4.0 33.9 9Combined food preparation and serving workers, including fastfood .............................................................................................. 8,850 13.3 14.6 24.3 10.3 11.9 4.2 21.4 5
Customer service representatives ................................................. 8,420 11.6 7.8 11.6 9.3 11.8 4.4 43.3 19Bus drivers, transit and intercity ..................................................... 8,320 6.0 7.2 12.4 12.6 9.4 9.1 43.3 22
Home health aides ......................................................................... 8,190 8.8 11.2 17.3 12.6 9.9 7.4 32.8 11Security guards .............................................................................. 8,150 11.2 13.4 17.4 11.5 10.7 6.4 29.4 8Farmworkers and laborers, crop, nursery, and greenhouse .......... 8,040 14.6 13.2 20.0 12.8 8.8 5.0 25.5 6Waiters and waitresses .................................................................. 7,150 11.0 12.3 18.0 12.7 10.9 4.9 30.2 8Emergency medical technicians and paramedics .......................... 7,010 11.3 9.1 19.7 12.6 11.6 7.8 28.1 9
First-line supervisors of construction trades and extractionworkers ........................................................................................ 6,830 18.0 5.1 13.8 17.0 7.3 6.6 32.5 10
Bus drivers, school or special client ............................................... 6,710 8.9 10.4 16.5 9.5 13.4 7.3 33.8 13Cargo and freight agents ............................................................... 6,620 4.2 5.0 14.2 11.0 14.0 7.7 43.8 23Heating, air conditioning, and refrigeration mechanics andinstallers ....................................................................................... 6,590 13.2 7.4 22.8 10.3 10.0 8.2 28.1 8
Licensed practical and licensed vocational nurses ........................ 6,510 14.9 10.8 18.6 12.1 11.5 5.1 27.0 8
Electricians .................................................................................... 6,490 18.6 8.6 20.5 7.7 7.6 6.0 30.8 7Psychiatric aides ............................................................................ 6,110 14.1 10.3 21.8 15.2 11.1 4.9 22.6 6First-line supervisors of food preparation and serving workers ..... 5,740 16.4 9.6 21.3 11.3 12.5 4.9 23.9 7Welders, cutters, solderers, and brazers ....................................... 5,720 18.9 14.9 14.5 8.6 10.3 8.2 24.8 7Industrial truck and tractor operators ............................................. 5,700 12.6 9.8 12.5 12.5 12.1 6.8 33.7 12
See footnotes at end of table.
20

TABLE 10. Number, median days away from work1, and percent distribution of nonfatal occupational injuries and illnesses involving days away fromwork2 by selected worker occupation3 and days away from work groups, all ownerships, 2014 — Continued
Occupation Total
Percent of days-away-from-work cases involving Mediandays awayfrom work1 day 2 days 3 - 5 days 6 - 10 days 11 - 20
days21 - 30days
31 days ormore
Operating engineers and other construction equipment operators 5,670 7.8 8.6 13.9 6.5 10.2 15.9 37.0 23Cooks, institution and cafeteria ...................................................... 5,600 18.0 13.2 16.8 14.5 12.0 5.9 19.6 6Office clerks, general ..................................................................... 5,470 18.3 13.7 16.8 11.2 8.8 5.1 26.1 6Plumbers, pipefitters, and steamfitters .......................................... 5,450 13.9 7.2 19.8 7.5 9.4 5.7 36.7 12Flight attendants ............................................................................ 5,140 2.9 5.8 17.1 10.9 15.0 5.3 43.4 20
1 Median days away from work is the measure used to summarize the varyinglengths of absences from work among the cases with days away from work. Half thecases involved more days and half involved fewer days than a specified median.Median days away from work are represented in actual values.
2 Days-away-from-work cases include those that resulted in days away from work,some of which also included job transfer or restriction.
3 Selected occupations ranked in descending case count for private, State, and local
government.
Note: Dash indicates data do not meet publication guidelines. Because of roundingand data exclusion of nonclassifiable responses, data may not sum to the totals.
Source: U.S. Bureau of Labor Statistics, Survey of Occupational Injuries andIllnesses, in cooperation with participating state agencies.
21

TABLE 11. Number of nonfatal occupational injuries and illnesses involving days away from work1 by time, hours on the job, day of the week, and industry sector, privateindustry, 2014
CharacteristicPrivateindustry
2,3,4
Goods producing Service providing
Totalgoods
producing
Naturalresources
andmining2,3
Construc-tion
Manufac-turing
Totalservice
providing
Trade,transpor-tation andutilities4
Informa-tion
Financialactivities
Profes-sionaland
businessservices
Educationand
healthservices
Leisureand
hospitality
Otherservices
Total ......................................................... 916,440 225,180 24,730 74,460 125,990 691,260 278,700 15,730 26,350 77,720 175,900 90,920 25,940
Time of event:12:01 A.M. to 4:00 A.M. ....................... 29,330 7,040 790 260 5,990 22,290 10,930 310 110 2,000 6,340 2,380 2204:01 A.M. to 8:00 A.M. ......................... 87,130 25,000 2,940 5,930 16,130 62,130 28,220 810 1,240 6,510 18,430 4,860 2,0608:01 A.M. to 12:00 noon ...................... 257,950 67,780 7,700 27,140 32,930 190,170 77,620 5,110 9,930 21,740 47,630 20,230 7,91012:01 P.M. to 4:00 P.M. ....................... 197,780 48,540 5,790 18,080 24,670 149,240 61,860 4,710 4,740 16,460 37,410 17,940 6,1104:01 P.M. to 8:00 P.M. ......................... 102,380 17,220 1,930 3,320 11,970 85,160 34,730 1,310 2,610 6,670 23,140 14,670 2,0308:01 P.M. to 12:00 midnight ................. 53,810 10,160 1,020 570 8,570 43,650 16,920 440 410 3,430 11,750 9,760 950Not reported ......................................... 188,060 49,450 4,560 19,160 25,730 138,610 48,420 3,030 7,320 20,910 31,200 21,070 6,660
Hours on the job before eventoccurred:Before shift began ............................... 8,010 1,460 30 270 1,150 6,550 1,910 240 390 700 2,720 510 90Less than 1 hour .................................. 71,510 14,050 1,180 4,040 8,830 57,460 23,660 930 2,860 5,220 15,830 7,020 1,9401 hour to less than 2 hours .................. 82,890 17,480 1,380 5,090 11,010 65,400 28,100 1,600 2,230 6,140 16,710 8,530 2,1002 hours to less than 4 hours ................ 189,760 45,330 4,060 16,640 24,640 144,420 61,300 3,200 5,220 15,010 35,890 19,120 4,6804 hours to less than 6 hours ................ 142,400 34,270 3,620 10,700 19,950 108,130 42,640 2,970 3,490 10,470 28,470 16,300 3,8006 hours to less than 8 hours ................ 121,480 32,570 3,140 10,670 18,760 88,910 36,320 2,210 2,170 10,330 24,070 9,910 3,9008 hours to less than 10 hours .............. 62,900 17,910 2,410 5,620 9,880 44,990 19,870 940 1,760 5,240 10,970 4,600 1,62010 hours to less than 12 hours ............ 18,040 5,650 590 1,450 3,610 12,390 5,450 430 350 1,120 4,010 600 44012 hours to less than 16 hours ............ 9,250 1,590 370 210 1,020 7,660 2,750 100 80 900 2,510 780 550More than 16 hours ............................. 860 120 30 – 70 740 400 – 20 – 280 – –Not reported ......................................... 209,340 54,750 7,920 19,760 27,070 154,590 56,310 3,110 7,780 22,580 34,450 23,530 6,820
Day of week:Sunday ................................................ 59,970 6,280 1,210 1,140 3,920 53,690 19,730 980 1,580 2,750 13,530 13,070 2,050Monday ................................................ 168,230 46,940 4,630 16,680 25,630 121,290 50,720 3,260 4,220 14,940 30,640 12,610 4,920Tuesday ............................................... 160,170 44,000 4,850 15,030 24,110 116,170 47,350 2,710 4,240 15,830 29,400 12,370 4,270Wednesday .......................................... 162,400 43,750 4,130 15,330 24,290 118,660 48,240 2,920 5,210 14,820 30,200 12,430 4,840Thursday .............................................. 154,590 38,210 3,940 12,400 21,870 116,380 44,580 2,890 5,760 14,420 30,360 13,560 4,800Friday ................................................... 137,730 34,410 3,750 11,420 19,250 103,320 44,250 2,070 3,830 10,820 25,880 13,420 3,040Saturday .............................................. 73,360 11,600 2,220 2,460 6,920 61,750 23,820 900 1,510 4,140 15,900 13,460 2,020
1 Days-away-from-work cases include those that resulted in days away from work, some of whichalso included job transfer or restriction.
2 Excludes farms with fewer than 11 employees.3 Data for Mining (Sector 21 in the North American Industry Classification System-- United States,
2012) include establishments not governed by the Mine Safety and Health Administration rules andreporting, such as those in Oil and Gas Extraction and related support activities. Data for miningoperators in coal, metal, and nonmetal mining are provided to BLS by the Mine Safety and HealthAdministration, U.S. Department of Labor. Independent mining contractors are excluded from thecoal, metal, and nonmetal mining industries. These data do not reflect the changes the Occupational
Safety and Health Administration made to its recordkeeping requirements effective January 1, 2002;therefore, estimates for these industries are not comparable to estimates in other industries.
4 Data for employers in rail transportation are provided to BLS by the Federal RailroadAdministration, U.S. Department of Transportation.
Note: Dash indicates data do not meet publication guidelines. Because of rounding and dataexclusion of nonclassifiable responses, data may not sum to the totals.
Source: U.S. Bureau of Labor Statistics, Survey of Occupational Injuries and Illnesses, incooperation with participating state agencies.
22

TABLE 12. Incidence rates1 for nonfatal occupational injuries and illnesses involving days away from work2 per 10,000 full-time workers by injury or illness characteristics, gender, andage groups, all ownerships, 2014
CharacteristicTotal
incidencerate
Gender Age
Male Female 16-19 20-24 25-34 35-44 45-54 55-64 65 and over
Total ........................................................................................................................ 107.1 116.5 95.1 106.6 104.9 96.4 104.0 117.2 116.3 94.2
Musculoskeletal disorders3 ......................................................................................... 33.8 37.5 29.7 24.2 28.1 30.5 36.2 40.4 35.8 19.7
Nature of injury or illness:Fractures ..................................................................................................................... 8.8 10.2 7.3 7.1 7.5 6.3 6.7 9.6 13.1 18.2Sprains, strains, tears ................................................................................................. 38.9 41.7 35.8 28.2 32.8 35.2 42.4 45.7 40.7 24.0Amputations ................................................................................................................ .5 .7 .1 .4 .9 .4 .4 .4 .4 .3Cuts, lacerations, punctures ....................................................................................... 8.8 12.0 4.8 19.3 15.9 10.5 7.5 7.4 6.2 5.2
Cuts, lacerations ..................................................................................................... 7.3 10.2 3.7 16.6 13.5 8.1 6.2 6.3 5.5 4.8Punctures (except gunshot wounds) ....................................................................... 1.5 1.8 1.1 2.7 2.4 2.4 1.3 1.2 .7 .4
Bruises, contusions ..................................................................................................... 9.0 8.3 10.0 10.8 9.0 8.4 8.2 9.0 10.8 10.5Chemical burns and corrosions .................................................................................. .3 .5 .2 .7 .6 .4 .3 .3 .4 .1Heat (thermal) burns ................................................................................................... 1.3 1.3 1.3 7.5 2.7 1.5 1.1 .9 .6 .7Multiple traumatic injuries ........................................................................................... 3.3 3.4 3.4 1.7 2.1 2.6 3.3 3.4 4.8 5.1
With sprains ............................................................................................................ 1.5 1.3 1.8 .7 .7 1.0 1.6 1.7 2.4 1.9With fractures .......................................................................................................... .6 .8 .4 .4 .6 .4 .7 .6 1.0 1.0
Soreness, pain ............................................................................................................ 18.3 18.8 18.0 13.6 15.0 15.4 17.9 21.5 21.3 17.3Carpal tunnel syndrome .............................................................................................. .7 .5 1.1 – .1 .3 .7 1.1 1.4 .5Tendonitis (other or unspecified) ................................................................................ .2 .2 .3 – .2 .2 .2 .3 .2 .2All other natures .......................................................................................................... 16.9 18.9 12.9 17.4 18.1 15.1 15.4 17.6 16.3 12.0
Event or exposure leading to injury or illness:Violence and other injuries by persons or animal ....................................................... 6.8 5.9 8.0 4.0 7.0 8.3 7.9 7.3 4.2 3.2Intentional injury by other person .............................................................................. 2.9 2.1 4.0 1.2 2.6 3.4 3.7 3.0 2.0 1.6Injury by person unintentional or intent unknown ...................................................... 2.5 2.3 2.8 1.0 2.3 3.0 3.0 2.9 1.5 .7Animal and insect related incidents .......................................................................... 1.3 1.5 1.2 1.7 2.1 1.8 1.1 1.3 .7 .8
Transportation incidents .............................................................................................. 5.8 7.5 3.6 2.6 5.2 5.4 6.1 6.1 6.5 5.1Roadway incidents involving motorized land vehicles .............................................. 4.2 5.3 2.8 1.0 3.5 3.9 4.6 4.4 4.9 3.4
Fires and explosions ................................................................................................... .2 .3 .1 .2 .2 .2 .2 .2 .1 .1Falls, slips, trips .......................................................................................................... 29.3 27.6 31.9 18.1 18.8 19.7 25.7 34.1 44.3 49.5Slips, trips without fall ............................................................................................... 4.4 5.0 3.9 3.2 3.7 3.6 4.5 5.6 5.1 3.3Fall on same level ..................................................................................................... 18.8 14.6 24.6 10.6 10.8 11.2 15.4 21.4 31.5 40.3Fall to lower level ...................................................................................................... 5.4 7.2 3.2 3.9 3.8 4.2 5.0 6.5 7.2 5.7
Exposure to harmful substances or environments ...................................................... 4.3 4.5 4.1 11.5 6.5 4.6 4.2 3.8 3.1 1.6Contact with object, equipment ................................................................................... 23.8 30.6 15.5 43.9 37.4 25.4 21.4 23.0 19.9 13.2Struck by object or equipment .................................................................................. 13.4 17.3 8.8 26.0 21.9 14.4 12.1 13.1 10.6 8.0Struck against object or equipment ........................................................................... 5.5 6.7 4.1 10.4 7.2 5.7 5.2 5.3 5.2 2.9Caught in or compressed by object or equipment .................................................... 3.5 4.8 1.9 5.5 6.2 3.8 3.1 3.2 3.1 1.8
Overexertion and bodily reaction ................................................................................ 35.6 39.3 31.4 26.1 29.4 32.2 38.0 42.3 37.5 21.3Overexertion in lifting or lowering .............................................................................. 11.0 13.4 8.3 8.7 11.6 10.1 10.9 13.5 11.1 6.4Repetitive motion involving microtasks ..................................................................... 2.7 2.0 3.7 .8 1.3 2.0 2.9 3.3 3.8 2.1
See footnotes at end of table.
23

TABLE 12. Incidence rates1 for nonfatal occupational injuries and illnesses involving days away from work2 per 10,000 full-time workers by injury or illness characteristics, gender, andage groups, all ownerships, 2014 — Continued
CharacteristicTotal
incidencerate
Gender Age
Male Female 16-19 20-24 25-34 35-44 45-54 55-64 65 and over
Event or exposure leading to injury or illness:All other event or exposures ....................................................................................... 1.5 0.8 0.6 0.2 0.4 0.5 0.6 0.6 0.6 0.1
Part of body affected by the injury or illness:Head ........................................................................................................................... 7.8 8.8 6.7 11.6 11.1 7.8 7.0 7.4 7.5 7.4
Eye(s) ...................................................................................................................... 2.2 3.1 1.1 3.2 3.7 2.5 2.1 2.2 1.5 .9Neck ............................................................................................................................ 1.5 1.4 1.6 .8 1.1 1.3 1.5 1.8 1.6 1.5Trunk ........................................................................................................................... 24.9 28.7 20.4 16.5 21.2 24.1 26.6 27.4 25.6 22.0
Back ........................................................................................................................ 18.5 20.5 16.3 12.8 16.9 19.2 20.7 20.3 17.0 9.6Upper extremities ........................................................................................................ 32.0 36.0 27.5 44.8 36.3 29.0 30.1 34.3 35.6 26.0
Shoulder .................................................................................................................. 8.2 9.4 6.9 4.1 5.3 6.1 7.1 10.3 12.4 8.2Arm ......................................................................................................................... 4.9 5.2 4.6 7.8 3.4 3.9 5.3 5.7 5.5 5.6Wrist ........................................................................................................................ 4.1 3.3 5.1 3.9 4.0 3.6 3.6 4.5 5.1 4.2Hand ....................................................................................................................... 12.7 16.3 8.3 28.3 22.1 13.9 11.4 11.2 10.5 6.4
Lower extremities ........................................................................................................ 24.9 27.6 21.7 26.6 25.2 22.3 23.5 28.5 26.8 20.4Knee ........................................................................................................................ 9.6 10.5 8.6 7.8 7.0 8.0 8.7 12.0 12.1 8.9Ankle ....................................................................................................................... 5.6 6.0 5.2 7.9 7.0 5.6 6.6 5.6 4.3 3.1Foot ......................................................................................................................... 4.8 5.6 4.0 7.6 7.3 4.8 3.8 5.0 4.7 3.9
Body systems .............................................................................................................. 2.3 2.1 2.6 1.7 2.3 2.5 2.4 2.4 1.8 1.0Multiple ........................................................................................................................ 12.2 11.0 13.9 4.3 7.3 8.8 12.3 14.8 16.7 15.1All other parts of body ................................................................................................. 1.5 .8 .7 .3 .6 .7 .6 .6 .6 .7
Source of injury or illness:Chemicals and chemical products .............................................................................. 1.3 1.4 1.2 1.9 1.5 1.4 1.3 1.2 1.2 .5Containers ................................................................................................................... 11.0 12.8 8.8 13.0 13.3 10.1 10.7 12.5 10.7 7.5Furniture and fixtures .................................................................................................. 4.4 3.9 5.0 4.4 5.0 3.4 4.0 4.7 5.3 4.9Machinery ................................................................................................................... 5.2 7.0 2.9 11.1 7.0 5.2 4.2 5.5 4.9 3.7Parts and materials ..................................................................................................... 8.0 12.6 2.2 7.3 8.6 8.0 8.2 8.7 7.7 2.8Person, injured or ill worker ........................................................................................ 17.1 18.5 15.6 11.5 12.8 14.6 18.4 20.2 19.1 12.5
Worker motion or position ....................................................................................... 16.2 17.6 14.6 11.1 12.0 13.8 17.4 19.2 18.3 11.7Person, other than injured or ill worker ....................................................................... 10.1 6.0 15.4 6.3 9.7 11.5 12.1 10.9 7.1 4.3
Patient ..................................................................................................................... 5.4 2.1 9.6 2.8 5.4 6.2 6.2 5.7 4.1 1.9Floors, walkways, ground surfaces ............................................................................. 19.2 15.5 24.3 11.5 11.4 12.2 15.4 22.2 31.3 38.2Handtools .................................................................................................................... 4.1 6.0 1.7 9.9 7.3 4.4 4.2 3.6 3.0 1.2Ladder ......................................................................................................................... 2.0 2.8 .9 1.4 1.3 1.7 1.9 2.2 2.8 1.4Vehicles ...................................................................................................................... 10.8 14.2 6.5 8.0 10.0 9.4 11.2 11.6 12.6 9.9
Trucks ..................................................................................................................... 2.8 4.7 .3 .8 1.7 2.2 3.1 3.4 3.3 2.7Cart, dolly, hand truck nonpowered ........................................................................ 1.4 1.4 1.4 1.1 1.3 1.1 1.3 1.5 1.8 1.2
All other sources ......................................................................................................... 14.1 15.6 10.6 20.5 17.1 14.5 12.4 13.9 10.4 7.3
1 The incidence rates represent the number of injuries and illnesses per 10,000 full-time workers andwere calculated as (N/EH) x 20,000,000, where
N = number of injuries and illnessesEH = total hours worked by all employees during the calendar year20,000,000 = base for 10,000 equivalent full-time workers(working 40 hours per week, 50 weeks per year).
2 Days-away-from-work cases include those that resulted in days away from work, some of which alsoincluded job transfer or restriction.
3 Musculoskeletal disorders include cases in which the nature of the injury or illness is pinched nerve;herniated disc; meniscus tear; sprains, strains, tears; hernia (traumatic and nontraumatic); pain, swelling, and
numbness; carpal or tarsal tunnel syndrome; Raynaud’s syndrome or phenomenon; musculoskeletal systemand connective tissue diseases and disorders, and when the event or exposure leading to the injury or illnessis overexertion and bodily reaction, unspecified; overexertion involving outside sources; repetitive motioninvolving microtasks; other and multiple exertions or bodily reactions; and rubbed, abraded, or jarred byvibration.
Note: Dash indicates data do not meet publication guidelines. Because of rounding and data exclusion ofnonclassifiable responses, data may not sum to the totals.
Source: U.S. Bureau of Labor Statistics, Survey of Occupational Injuries and Illnesses, in cooperation withparticipating state agencies.
24

TABLE 13. Incidence rates1 for nonfatal occupational injuries and illnesses involving days away from work2 per 10,000 full-time workers by selected worker occupation3
and nature of injury or illness, all ownerships, 2014
Occupation3Total
incidencerate
Nature of injury or illness4
(incidence rate)
Sprains,strains,tears
Fractures
Cuts, lacerations, punctures
Bruises,contusions
Heatburns
Chemicalburns Amputations
Total Cuts,lacerations Punctures
Total ........................................................................................... 107.1 38.9 8.8 8.8 7.3 1.5 9.0 1.3 0.3 0.5
Police and Sheriffs Patrol Officers ..................................................... 485.8 167.2 35.0 30.4 17.3 13.0 48.3 – .5 –Firefighters ......................................................................................... 448.4 204.8 12.5 17.8 17.4 .5 7.5 7.1 1.2 10.7Highway Maintenance Workers ......................................................... 433.0 203.2 29.8 10.7 10.2 – 52.3 – – –Correctional Officers and Jailers ....................................................... 423.3 141.2 22.5 17.1 12.8 4.3 68.5 – – –Nursing Assistants ............................................................................. 372.5 204.7 10.8 5.6 4.3 1.3 30.7 .9 – –
Heavy and Tractor-Trailer Truck Drivers ........................................... 365.5 155.8 41.1 15.9 12.9 3.0 27.4 .4 .7 .6Emergency Medical Technicians and Paramedics ............................ 333.0 183.5 14.1 5.2 3.9 1.3 13.4 – – –Construction Laborers ....................................................................... 309.7 83.3 32.2 46.7 31.6 15.1 18.5 1.8 2.0 1.3Light Truck or Delivery Services Drivers ........................................... 299.9 147.2 17.2 9.3 7.9 1.4 16.3 – – .2Heating, Air Conditioning, and Refrigeration Mechanics andInstallers .......................................................................................... 284.7 83.8 38.8 60.4 51.9 8.5 13.3 2.4 13.3 1.4
Nonfarm Animal Caretakers .............................................................. 274.0 83.1 5.1 85.2 14.2 71.0 4.1 – – –Maids and Housekeeping Cleaners ................................................... 271.9 109.3 15.6 12.1 9.5 2.6 31.3 1.2 2.2 –Telecommunications Equipment Installers and Repairers, ExceptLine Installers .................................................................................. 269.8 148.6 9.6 14.1 11.5 2.6 9.9 – – –
Landscaping and Groundskeeping Workers ..................................... 264.8 85.8 25.9 29.6 25.1 4.4 19.3 1.0 – 1.3Janitors and Cleaners, Except Maids and Housekeeping Cleaners .. 258.1 96.8 19.9 13.9 11.9 1.9 24.4 1.3 3.2 .3
Maintenance and Repair Workers, General ...................................... 250.7 80.7 29.7 24.7 21.5 3.2 17.4 3.7 1.5 2.4Carpenters ......................................................................................... 238.0 60.9 26.4 56.2 43.5 12.7 13.2 – – 1.9Taxi Drivers and Chauffeurs .............................................................. 237.2 84.8 12.4 4.5 4.5 – 18.3 – 1.2 –Electrical Power-Line Installers and Repairers .................................. 223.8 88.5 19.2 29.1 24.4 4.8 6.4 – – –Automotive Service Technicians and Mechanics .............................. 209.8 72.1 9.6 27.9 20.0 7.9 14.8 3.0 1.3 2.3
Laundry and Dry-Cleaning Workers .................................................. 200.3 90.1 10.5 6.0 5.5 – 15.3 3.0 – –Reservation and Transportation Ticket Agents and Travel Clerks .... 199.4 132.0 12.1 7.2 7.2 – 10.0 – – –Bus and Truck Mechanics and Diesel Engine Specialists ................. 199.1 76.4 12.2 19.9 18.2 1.6 19.1 1.3 – 2.0Painters, Construction and Maintenance ........................................... 196.7 43.2 32.5 10.3 9.7 – 8.1 – – 1.0Bus Drivers, School or Special Client ................................................ 192.9 79.0 13.9 3.1 2.2 1.0 14.9 – – –
Stock Clerks and Order Fillers ........................................................... 189.0 87.9 10.7 19.0 18.1 .8 20.8 .9 .2 .3Food Service Managers .................................................................... 182.6 69.4 5.6 12.2 12.2 – 11.9 5.1 – –Food Servers, Nonrestaurant ............................................................ 181.5 58.0 14.9 17.1 14.4 2.7 22.4 10.1 – 1.2Operating Engineers and Other Construction Equipment Operators 177.5 45.2 8.4 12.5 11.9 .6 13.7 1.6 1.4 –Cleaners of Vehicles and Equipment ................................................ 175.9 65.9 14.7 15.4 13.2 2.2 8.7 2.1 3.6 –
See footnotes at end of table.
25

TABLE 13. Incidence rates1 for nonfatal occupational injuries and illnesses involving days away from work2 per 10,000 full-time workers byselected worker occupation3 and nature of injury or illness, all ownerships, 2014 — Continued
Occupation3
Nature of injury or illness4
(incidence rate)
Carpaltunnel
syndromeTendonitis
Multiple traumatic injuries and disorders
Soreness,pain
Allother
natures5TotalWith fractures
andother injuries
With sprainsand
other injuries
Total ........................................................................................... 0.7 0.2 3.3 0.6 1.5 18.3 16.9
Police and Sheriffs Patrol Officers ..................................................... – 1.3 25.2 6.3 10.9 90.1 87.7Firefighters ......................................................................................... – 4.4 6.8 1.6 4.9 64.4 111.3Highway Maintenance Workers ......................................................... – – 4.4 – 1.8 67.4 63.8Correctional Officers and Jailers ....................................................... .6 .4 21.2 1.3 9.3 91.2 60.2Nursing Assistants ............................................................................. – .5 7.4 .5 4.6 83.4 28.3
Heavy and Tractor-Trailer Truck Drivers ........................................... 1.5 .3 15.7 2.5 5.9 59.7 46.3Emergency Medical Technicians and Paramedics ............................ – 2.7 3.6 .8 1.9 69.6 40.7Construction Laborers ....................................................................... – – 10.7 3.8 1.6 55.2 57.9Light Truck or Delivery Services Drivers ........................................... .5 .7 6.0 .6 2.9 70.3 32.0Heating, Air Conditioning, and Refrigeration Mechanics andInstallers .......................................................................................... – – 3.7 1.2 2.1 38.4 29.0
Nonfarm Animal Caretakers .............................................................. – – 7.2 – – 51.3 37.9Maids and Housekeeping Cleaners ................................................... 1.2 .8 7.4 .5 4.5 58.0 32.8Telecommunications Equipment Installers and Repairers, ExceptLine Installers .................................................................................. – – 8.6 1.0 3.5 41.9 36.1
Landscaping and Groundskeeping Workers ..................................... – .3 10.0 2.1 3.6 45.4 46.0Janitors and Cleaners, Except Maids and Housekeeping Cleaners .. 1.8 .9 9.4 3.0 3.3 53.5 32.7
Maintenance and Repair Workers, General ...................................... .9 .1 5.6 1.6 2.1 46.7 37.2Carpenters ......................................................................................... .7 – 6.9 3.7 1.7 38.1 33.5Taxi Drivers and Chauffeurs .............................................................. – – 7.0 – 3.7 78.8 30.1Electrical Power-Line Installers and Repairers .................................. – – 2.3 – 1.3 20.6 55.9Automotive Service Technicians and Mechanics .............................. .6 – 1.9 – .8 40.0 36.1
Laundry and Dry-Cleaning Workers .................................................. 4.0 1.4 1.6 – 1.2 34.6 32.6Reservation and Transportation Ticket Agents and Travel Clerks .... – 2.7 4.0 – 3.5 2.7 27.4Bus and Truck Mechanics and Diesel Engine Specialists ................. – – 6.9 – 2.0 26.7 33.0Painters, Construction and Maintenance ........................................... – – 4.6 1.0 – 57.9 38.6Bus Drivers, School or Special Client ................................................ – .5 13.0 .6 4.7 49.4 18.6
Stock Clerks and Order Fillers ........................................................... 1.0 .3 3.1 .6 1.4 24.1 20.9Food Service Managers .................................................................... – – 2.7 – 2.4 29.9 43.5Food Servers, Nonrestaurant ............................................................ 1.0 – 4.7 – 3.5 29.6 22.0Operating Engineers and Other Construction Equipment Operators – – 5.8 1.5 3.2 60.0 28.4Cleaners of Vehicles and Equipment ................................................ .7 – 1.8 – 1.0 38.7 24.1
1 The incidence rates represent the number of injuries and illnesses per 10,000full-time workers and were calculated as (N/EH) x 20,000,000, where
N = number of injuries and illnessesEH = total hours worked by all employees during the calendar year20,000,000 = base for 10,000 equivalent full-time workers(working 40 hours per week, 50 weeks per year).
2 Days-away-from-work cases include those that resulted in days away fromwork, some of which also included job transfer or restriction.
3 These occupations have at least 0.1% of full-time equivalent employment.4 Data shown in columns correspond to the following Nature codes: Sprains,
strains, tears = 123; Fractures = 111; Cuts, lacerations, punctures, Total = 132-133;Cuts, lacerations = 132; Punctures = 133; Bruises, contusions = 143; Heat burns =152; Chemical burns = 151; Amputations = 1311; Carpal tunnel syndrome = 2241;
Tendonitis (other or unspecified) = 2735; Multiple traumatic injuries and illnesses,Total = 18; With fractures and other injuries = 183; With sprains and other injuries =182; Soreness, pain = 1972; All other natures = all remaining codes, including 9999(Nonclassifiable). These codes are based on the Occupational Injury and IllnessClassification System 2.01 developed by the Bureau of Labor Statistics.
5 Includes nonclassifiable responses.
Note: Dash indicates data do not meet publication guidelines. Because ofrounding and data exclusion of nonclassifiable responses, data may not sum to thetotals.
Source: U.S. Bureau of Labor Statistics, Survey of Occupational Injuries andIllnesses, in cooperation with participating state agencies.
26

TABLE 14. Incidence rates1 for nonfatal occupational injuries and illnesses involving days away from work2 per 10,000 full-time workers by selected worker occupation3 andevents or exposures, all ownerships, 2014
Occupation3Total
incidencerate
Event or exposure leading to injury or illness(incidence rate)
Contact with objects
Fallto
lowerlevel
Fallon
samelevel
Slipsor
tripswithout
fall
Overexertion and bodily reaction
TotalStruck
byobject
Struckagainstobject
Caught in orcompressed byequipment or
object
TotalOverexertionin lifting/low-
ering
Repetitivemotion
Total ........................................................................................... 107.1 23.8 13.4 5.5 3.5 5.4 18.8 4.4 35.6 11.0 2.7
Police and Sheriffs Patrol Officers ..................................................... 485.8 42.5 10.6 26.2 3.3 17.7 87.5 14.8 104.2 11.7 2.2Firefighters ......................................................................................... 448.4 80.8 32.1 34.3 12.5 18.4 45.6 22.0 208.5 67.4 1.6Highway Maintenance Workers ......................................................... 433.0 78.9 39.0 15.5 15.1 43.3 47.1 21.0 143.3 33.1 25.3Correctional Officers and Jailers ....................................................... 423.3 57.1 20.6 28.3 6.5 8.0 69.1 25.6 82.3 9.8 1.4Nursing Assistants ............................................................................. 372.5 31.5 17.4 9.1 3.4 1.8 61.8 11.5 204.6 44.4 1.4
Heavy and Tractor-Trailer Truck Drivers ........................................... 365.5 60.2 34.3 15.5 7.5 41.0 58.6 22.2 114.2 28.9 2.9Emergency Medical Technicians and Paramedics ............................ 333.0 30.1 14.2 8.2 7.3 16.0 24.1 14.3 187.2 84.6 3.4Construction Laborers ....................................................................... 309.7 122.8 77.1 13.9 18.2 31.2 21.5 16.8 81.8 28.1 3.0Light Truck or Delivery Services Drivers ........................................... 299.9 40.9 20.4 13.4 6.2 14.9 40.8 19.0 143.2 53.0 2.5Heating, Air Conditioning, and Refrigeration Mechanics andInstallers .......................................................................................... 284.7 79.2 51.0 17.0 7.0 36.5 26.5 17.1 75.2 19.8 1.8
Nonfarm Animal Caretakers .............................................................. 274.0 17.1 4.7 7.9 2.6 7.4 28.1 7.6 96.7 33.2 5.5Maids and Housekeeping Cleaners ................................................... 271.9 54.3 26.9 18.8 7.8 12.2 66.1 15.1 103.0 29.0 6.7Telecommunications Equipment Installers and Repairers, ExceptLine Installers .................................................................................. 269.8 34.3 10.9 18.3 – 35.2 32.2 13.0 96.5 10.5 3.2
Landscaping and Groundskeeping Workers ..................................... 264.8 72.8 39.3 12.9 9.0 10.7 36.8 19.5 89.3 29.3 3.9Janitors and Cleaners, Except Maids and Housekeeping Cleaners .. 258.1 50.0 25.2 17.1 5.3 14.3 56.7 13.0 99.7 39.8 7.0
Maintenance and Repair Workers, General ...................................... 250.7 70.6 39.5 15.4 10.7 19.7 34.5 9.2 84.2 25.2 3.8Carpenters ......................................................................................... 238.0 90.1 56.8 19.4 8.5 24.9 27.1 8.9 77.4 22.0 1.5Taxi Drivers and Chauffeurs .............................................................. 237.2 15.9 8.5 5.0 1.4 3.1 46.8 3.4 74.7 40.9 –Electrical Power-Line Installers and Repairers .................................. 223.8 59.3 25.2 20.0 9.8 13.7 18.2 8.0 91.3 22.8 2.1Automotive Service Technicians and Mechanics .............................. 209.8 71.9 37.7 18.9 10.9 4.4 22.3 6.3 76.7 27.8 6.3
Laundry and Dry-Cleaning Workers .................................................. 200.3 45.4 20.1 13.0 11.5 2.1 57.5 2.5 84.3 17.6 16.0Reservation and Transportation Ticket Agents and Travel Clerks .... 199.4 25.2 13.9 9.9 – 3.9 41.6 3.9 117.6 58.1 5.6Bus and Truck Mechanics and Diesel Engine Specialists ................. 199.1 69.3 46.2 15.0 6.0 7.8 15.5 8.7 80.9 22.1 1.0Painters, Construction and Maintenance ........................................... 196.7 35.4 23.0 2.3 5.9 83.5 25.1 3.1 37.4 7.7 2.0Bus Drivers, School or Special Client ................................................ 192.9 18.9 12.1 4.6 1.5 10.2 51.8 10.6 40.0 7.2 2.1
Stock Clerks and Order Fillers ........................................................... 189.0 56.1 39.8 9.5 5.4 6.3 19.6 4.2 91.7 47.8 4.2Food Service Managers .................................................................... 182.6 31.6 25.4 3.7 2.5 35.8 42.4 6.0 48.7 23.6 9.3Food Servers, Nonrestaurant ............................................................ 181.5 51.9 30.7 17.1 2.4 3.0 44.9 4.3 57.3 16.6 8.2Operating Engineers and Other Construction Equipment Operators 177.5 44.7 30.7 5.9 4.8 27.8 14.8 22.3 39.1 11.7 3.9Cleaners of Vehicles and Equipment ................................................ 175.9 33.9 17.1 8.1 4.5 11.4 30.7 8.4 62.6 8.0 7.2
See footnotes at end of table.
27

TABLE 14. Incidence rates1 for nonfatal occupational injuries and illnesses involving days away from work2 per 10,000 full-time workers by selected workeroccupation3 and events or exposures, all ownerships, 2014 — Continued
Occupation3
Event or exposure leading to injury or illness(incidence rate)
Exposure toharmful
substances orenvironments
Transportation incidents
Firesand
explo-sions
Violence and other injuries by persons or animal
Allother
events4Total Roadwayincidents Total
Intentionalinjury by
otherperson
Injury byperson--un-intentionalor intentunknown
Animal andinsectrelated
Total ........................................................................................... 4.3 5.8 4.2 0.2 6.8 2.9 2.5 1.3 1.5
Police and Sheriffs Patrol Officers ..................................................... 15.1 67.7 53.4 .3 131.1 42.5 72.5 15.1 1.7Firefighters ......................................................................................... 37.5 5.7 3.4 10.0 12.6 1.1 3.2 8.3 6.0Highway Maintenance Workers ......................................................... 10.9 53.4 47.6 – 20.0 – – 20.0 –Correctional Officers and Jailers ....................................................... 11.6 8.9 7.7 – 153.2 53.5 96.5 1.4 5.2Nursing Assistants ............................................................................. 5.6 1.9 1.5 – 51.6 31.3 18.5 1.5 2.0
Heavy and Tractor-Trailer Truck Drivers ........................................... 5.5 52.1 42.8 .3 2.9 1.6 – 1.2 3.5Emergency Medical Technicians and Paramedics ............................ 4.0 30.1 27.8 2.1 18.9 10.6 7.6 .7 6.0Construction Laborers ....................................................................... 8.4 14.9 6.0 .7 5.6 .4 – 5.1 1.0Light Truck or Delivery Services Drivers ........................................... 2.1 33.0 29.9 – 3.2 .7 – 2.5 1.2Heating, Air Conditioning, and Refrigeration Mechanics andInstallers .......................................................................................... 22.0 9.6 5.9 – 10.3 – – 10.3 1.6
Nonfarm Animal Caretakers .............................................................. 7.1 – – – 107.7 – – 106.8 1.8Maids and Housekeeping Cleaners ................................................... 10.0 3.9 2.0 – 3.8 .7 .5 2.6 3.1Telecommunications Equipment Installers and Repairers, ExceptLine Installers .................................................................................. 8.9 28.5 28.3 – 6.1 – – 5.4 4.7
Landscaping and Groundskeeping Workers ..................................... 5.0 17.1 9.4 .2 10.7 – – 10.6 1.5Janitors and Cleaners, Except Maids and Housekeeping Cleaners .. 10.3 6.8 3.6 .3 1.9 .5 .2 1.1 4.0
Maintenance and Repair Workers, General ...................................... 11.1 14.8 12.6 .9 3.5 .3 – 3.0 .9Carpenters ......................................................................................... 3.1 1.4 .3 – 1.8 1.6 – – 1.3Taxi Drivers and Chauffeurs .............................................................. 2.8 79.4 73.0 – 7.2 4.0 3.1 – 2.8Electrical Power-Line Installers and Repairers .................................. 18.5 10.2 8.9 – – – – – –Automotive Service Technicians and Mechanics .............................. 5.6 18.2 11.0 .7 .9 .4 – .3 .4
Laundry and Dry-Cleaning Workers .................................................. 6.0 – – – 1.1 – – – –Reservation and Transportation Ticket Agents and Travel Clerks .... 3.0 – – – 2.5 1.9 – – –Bus and Truck Mechanics and Diesel Engine Specialists ................. 8.4 3.1 2.0 3.7 .7 – – .7 .7Painters, Construction and Maintenance ........................................... 3.8 3.0 2.1 – 3.1 – – – –Bus Drivers, School or Special Client ................................................ 1.8 43.1 41.5 – 14.6 6.7 7.2 .7 .8
Stock Clerks and Order Fillers ........................................................... 2.6 5.1 .5 .8 1.3 .4 .3 .6 .9Food Service Managers .................................................................... 8.0 7.3 7.0 – 2.8 2.1 – – –Food Servers, Nonrestaurant ............................................................ 15.2 2.3 – – 1.7 – – – –Operating Engineers and Other Construction Equipment Operators 7.6 11.8 7.2 1.1 1.3 – – 1.1 –Cleaners of Vehicles and Equipment ................................................ 17.7 8.0 3.4 – 2.6 – 2.3 – –
1 The incidence rates represent the number of injuries and illnesses per 10,000 full-timeworkers and were calculated as (N/EH) x 20,000,000, where
N = number of injuries and illnessesEH = total hours worked by all employees during the calendar year20,000,000 = base for 10,000 equivalent full-time workers(working 40 hours per week, 50 weeks per year).
2 Days-away-from-work cases include those that resulted in days away from work, someof which also included job transfer or restriction.
3 These occupations have at least 0.1% of full-time equivalent employment.4 Includes nonclassifiable responses.
Note: Dash indicates data do not meet publication guidelines. Because of rounding anddata exclusion of nonclassifiable responses, data may not sum to the totals.
Source: U.S. Bureau of Labor Statistics, Survey of Occupational Injuries and Illnesses, incooperation with participating state agencies.
28

TABLE 15. Number, incidence rate1, and median days2 away from work for nonfatal occupational injuries and illnesses involving days away from work3 for event or exposure and part of body by nature of injury or illness, all ownerships, 2014
Characteristic
Sprains, strains, tears Bruises, contusions Fractures Soreness, pain
Number Incidencerate
Mediandays awayfrom work
Number Incidencerate
Mediandays awayfrom work
Number Incidencerate
Mediandays awayfrom work
Number Incidencerate
Mediandays awayfrom work
Total .................................................................................... 420,870 38.9 10 97,080 9.0 5 95,550 8.8 32 197,870 18.3 9
Event or exposure leading to injury or illness:Violence and other injuries by persons or animal ................... 18,820 1.7 8 10,490 1.0 5 3,790 .4 15 13,420 1.2 7
Intentional injury by other person ......................................... 6,470 .6 7 6,000 .6 5 1,330 .1 18 6,460 .6 6Injury by person unintentional or intent unknown ................. 11,330 1.0 9 3,670 .3 7 2,020 .2 14 5,810 .5 9Animal and insect related incidents ...................................... 860 .1 7 740 .1 7 410 – 7 1,000 .1 11
Transportation incidents ......................................................... 18,910 1.7 11 6,130 .6 6 6,170 .6 49 16,770 1.6 10Roadway incidents involving motorized land vehicles .......... 14,930 1.4 10 3,340 .3 7 3,400 .3 49 13,380 1.2 10
Fires and explosions ............................................................... 70 – 5 60 – 9 160 – 113 100 – 6Falls, slips, trips ...................................................................... 108,330 10.0 10 38,460 3.6 6 52,990 4.9 40 62,350 5.8 9Slips, trips without fall ........................................................... 33,260 3.1 8 390 – 7 3,180 .3 41 7,190 .7 13Fall on same level ................................................................. 56,150 5.2 12 31,230 2.9 6 34,370 3.2 37 42,600 3.9 6Fall to lower level .................................................................. 15,670 1.4 13 6,130 .6 6 14,210 1.3 45 11,810 1.1 19
Exposure to harmful substances or environments ................. – – – – – – – – – 880 .1 2Contact with object, equipment .............................................. 22,170 2.1 11 41,520 3.8 4 29,140 2.7 21 28,050 2.6 5Struck by object or equipment .............................................. 9,780 .9 11 26,890 2.5 4 17,670 1.6 22 16,410 1.5 5Struck against object or equipment ...................................... 7,760 .7 13 9,800 .9 4 3,400 .3 21 7,210 .7 5Caught in or compressed by object or equipment ................ 3,430 .3 6 4,200 .4 4 7,200 .7 18 2,950 .3 7
Overexertion and bodily reaction ............................................ 250,070 23.1 10 120 – 3 2,950 .3 35 74,760 6.9 12Overexertion in lifting or lowering ......................................... 83,820 7.8 10 20 – 1 480 – 41 21,790 2.0 13Repetitive motion involving microtasks ................................. 8,770 .8 20 – – – 20 – 2 5,860 .5 15
All other event or exposures ................................................... 2,500 .2 22 300 – 33 350 – 70 1,550 .1 5
Part of body affected by the injury or illness:Head ....................................................................................... 340 – 5 11,800 1.1 3 3,620 .3 10 13,880 1.3 3
Eye(s) ................................................................................. 30 – 2 1,160 .1 3 40 – 19 2,390 .2 2Neck ....................................................................................... 10,110 .9 8 260 – 4 410 – 63 3,190 .3 5Trunk ...................................................................................... 155,920 14.4 7 15,100 1.4 5 10,740 1.0 41 55,220 5.1 8
Back .................................................................................... 140,140 13.0 7 5,230 .5 5 2,280 .2 49 43,440 4.0 9Upper extremities ................................................................... 104,760 9.7 17 21,720 2.0 5 40,320 3.7 24 45,430 4.2 14
Shoulder ............................................................................. 56,800 5.3 27 2,730 .3 7 3,010 .3 46 18,000 1.7 23Arm ..................................................................................... 16,610 1.5 18 4,730 .4 5 9,240 .9 25 7,720 .7 10Wrist ................................................................................... 13,880 1.3 7 1,630 .2 11 10,790 1.0 30 5,100 .5 12Hand ................................................................................... 9,030 .8 7 10,710 1.0 4 16,750 1.6 15 9,060 .8 7
Lower extremities ................................................................... 112,920 10.4 11 31,020 2.9 5 37,860 3.5 42 38,500 3.6 11Knee ................................................................................... 51,140 4.7 19 12,060 1.1 6 2,650 .2 54 21,020 1.9 17Ankle ................................................................................... 39,570 3.7 7 1,710 .2 4 10,510 1.0 49 5,110 .5 7Foot .................................................................................... 6,710 .6 7 10,560 1.0 3 16,270 1.5 23 5,970 .6 5
Body systems ......................................................................... – – – – – – – – – 40 – 1Multiple ................................................................................... 35,930 3.3 13 16,660 1.5 5 2,510 .2 66 40,620 3.8 9All other parts of body ............................................................. 900 .1 8 520 – 9 90 – 46 1,000 .1 8
1 The incidence rates represent the number of injuries and illnesses per 10,000 full-time workers andwere calculated as (N/EH) x 20,000,000, where
N = number of injuries and illnessesEH = total hours worked by all employees during the calendar year20,000,000 = base for 10,000 equivalent full-time workers(working 40 hours per week, 50 weeks per year).
2 Median days away from work is the measure used to summarize the varying lengths of absences fromwork among the cases with days away from work. Half the cases involved more days and half involved
fewer days than a specified median. Median days away from work are represented in actual values.3 Days-away-from-work cases include those that resulted in days away from work, some of which also
included job transfer or restriction.
Note: Dash indicates data do not meet publication guidelines. Because of rounding and data exclusionof nonclassifiable responses, data may not sum to the totals.
Source: U.S. Bureau of Labor Statistics, Survey of Occupational Injuries and Illnesses, in cooperationwith participating state agencies.
29

TABLE 16. Number, incidence rate1, and median days2 away from work for nonfatal occupational injuries and illnesses involving days away from work3 and musculoskeletal disorders4 byselected worker occupation5 and ownership, 2014
Occupation
Musculoskeletal disorders(MSDs)
Total private,state, and local government6,7,8
Privateindustry6,7,8
Stategovernment7,8
Localgovernment7,8
Number Incidencerate
Mediandays awayfrom work
Number Incidencerate
Mediandays awayfrom work
Number Incidencerate
Mediandays awayfrom work
Number Incidencerate
Mediandays awayfrom work
Total ....................................................................................... 365,580 33.8 13 298,460 31.9 13 16,670 42.1 14 50,450 48.4 13
Laborers and freight, stock, and material movers, hand ................ 21,480 – 12 20,590 111.0 11 150 – 19 730 324.8 14Nursing assistants ......................................................................... 20,920 199.8 7 18,510 191.1 6 720 259.7 12 1,690 304.2 8Heavy and tractor-trailer truck drivers ............................................ 17,030 111.7 19 16,410 108.0 20 50 – 2 570 319.8 8Janitors and cleaners, except maids and housekeeping cleaners 14,530 95.4 13 7,830 67.6 13 1,160 202.3 13 5,540 185.2 13Stock clerks and order fillers .......................................................... 11,870 88.8 15 11,700 88.3 15 80 85.5 41 90 67.2 6
Registered nurses .......................................................................... 11,360 55.0 9 9,820 55.3 9 640 60.1 14 900 48.8 9Light truck or delivery services drivers ........................................... 10,390 139.0 27 10,240 137.1 29 60 – 5 100 158.4 6Maintenance and repair workers, general ..................................... 8,880 81.0 10 5,880 63.9 10 620 154.6 20 2,380 175.1 8Retail salespersons ....................................................................... 7,380 23.1 8 7,380 22.9 8 – – – – – –Production workers, all other ......................................................... 7,140 – 15 7,130 – 15 – – – – – –
Maids and housekeeping cleaners ................................................ 6,650 98.4 10 6,090 93.1 10 250 451.1 9 310 158.9 8Landscaping and groundskeeping workers ................................... 5,930 86.3 13 3,120 51.7 10 330 268.1 6 2,470 347.9 23Construction laborers ..................................................................... 5,790 80.8 14 4,720 68.4 10 60 215.7 7 1,010 362.3 45Firefighters ..................................................................................... 5,760 178.8 15 40 29.2 19 – – – 5,710 208.0 15Personal care aides ....................................................................... 5,300 60.6 10 4,380 50.4 9 780 634.5 18 150 150.7 6
Police and sheriffs patrol officers ................................................... 5,180 91.0 27 – – – 710 112.7 7 4,450 95.5 29First-line supervisors of retail sales workers .................................. 4,450 40.5 16 4,450 40.3 16 – – – – – –Automotive service technicians and mechanics ............................ 4,210 74.7 15 3,950 72.2 15 120 205.8 2 140 100.0 8Assemblers and fabricators, all other ............................................ 4,210 – 16 4,210 – 16 – – – – – –Cargo and freight agents ............................................................... 4,120 – 26 4,120 572.4 26 – – – – – –
Carpenters ..................................................................................... 3,950 75.3 17 3,660 71.0 16 160 418.8 42 140 145.9 16Emergency medical technicians and paramedics .......................... 3,880 184.4 12 2,630 193.5 7 40 – 8 1,210 178.0 25Food preparation workers .............................................................. 3,790 – 8 3,110 62.5 8 150 – 11 520 – 2Driversales workers ....................................................................... 3,790 – 15 3,780 98.0 15 – – – – – –Home health aides ......................................................................... 3,270 55.4 11 3,160 54.2 12 70 116.0 5 40 62.5 6
Cashiers ......................................................................................... 3,130 15.2 11 3,080 15.1 11 40 54.0 9 – – –Customer service representatives ................................................. 2,940 15.1 36 2,900 15.2 42 20 10.3 6 20 6.1 7Correctional officers and jailers ..................................................... 2,850 75.1 24 80 37.5 12 2,210 102.6 27 560 41.3 14Flight attendants ............................................................................ 2,480 – 15 2,480 331.3 15 – – – – – –Teacher assistants ......................................................................... 2,270 28.2 14 690 40.3 22 30 14.3 2 1,550 27.1 14
Licensed practical and licensed vocational nurses ........................ 2,250 41.7 9 1,830 37.5 7 170 78.2 50 250 77.0 10Farmworkers and laborers, crop, nursery, and greenhouse .......... 2,090 – 7 2,080 – 7 – – – – – –Bus drivers, transit and intercity ..................................................... 2,090 – 13 840 149.0 11 360 – 21 880 181.2 13Plumbers, pipefitters, and steamfitters .......................................... 2,010 59.8 12 1,740 53.9 14 60 149.7 17 220 174.4 8Shipping, receiving, and traffic clerks ............................................ 1,990 36.1 8 1,980 35.7 8 – – – – – –
Electricians .................................................................................... 1,900 37.2 12 1,640 33.3 12 120 189.0 11 140 94.0 18Combined food preparation and serving workers, including fastfood .............................................................................................. 1,880 9.6 10 1,820 9.7 10 – – – 40 3.8 40
Bus and truck mechanics and diesel engine specialists ................ 1,880 79.5 24 1,310 63.5 29 140 423.6 31 430 162.8 11Telecommunications equipment installers and repairers, exceptline installers ................................................................................ 1,820 96.0 28 1,810 96.9 28 – – – – – –
Industrial truck and tractor operators ............................................. 1,720 36.3 14 1,700 35.8 14 – – – – – –
Packers and packagers, hand ....................................................... 1,720 – 13 1,720 33.4 13 – – – – – –Highway maintenance workers ...................................................... 1,690 143.2 10 20 36.2 19 860 245.3 12 810 111.3 10
See footnotes at end of table.30

TABLE 16. Number, incidence rate1, and median days2 away from work for nonfatal occupational injuries and illnesses involving days away from work3 and musculoskeletal disorders4 byselected worker occupation5 and ownership, 2014 — Continued
Occupation
Musculoskeletal disorders(MSDs)
Total private,state, and local government6,7,8
Privateindustry6,7,8
Stategovernment7,8
Localgovernment7,8
Number Incidencerate
Mediandays awayfrom work
Number Incidencerate
Mediandays awayfrom work
Number Incidencerate
Mediandays awayfrom work
Number Incidencerate
Mediandays awayfrom work
Heating, air conditioning, and refrigeration mechanics andinstallers ....................................................................................... 1,640 70.9 12 1,360 62.0 11 50 103.2 28 240 260.5 13
Welders, cutters, solderers, and brazers ....................................... 1,640 47.0 13 1,600 45.6 13 30 – 59 – – –First-line supervisors of construction trades and extractionworkers ........................................................................................ 1,570 32.7 12 1,380 30.9 12 20 17.5 6 170 70.7 22
Cleaners of vehicles and equipment .............................................. 1,510 61.1 4 1,460 59.6 4 – – – 40 104.7 14Telecommunications line installers and repairers .......................... 1,500 142.7 28 1,460 137.9 28 – – – 40 – 28Refuse and recyclable material collectors ..................................... 1,470 156.7 8 680 114.2 9 – – – 800 246.4 8Office clerks, general ..................................................................... 1,440 6.8 6 750 4.2 4 320 25.3 5 370 16.9 15Metal workers and plastic workers, all other .................................. 1,430 – 12 1,430 – 12 – – – – – –
1 The incidence rates represent the number of injuries and illnesses per 10,000 full-time workers and werecalculated as (N/EH) x 20,000,000, where
N = number of injuries and illnessesEH = total hours worked by all employees during the calendar year20,000,000 = base for 10,000 equivalent full-time workers(working 40 hours per week, 50 weeks per year).
2 Median days away from work is the measure used to summarize the varying lengths of absences from workamong the cases with days away from work. Half the cases involved more days and half involved fewer daysthan a specified median. Median days away from work are represented in actual values.
3 Days-away-from-work cases include those that resulted in days away from work, some of which alsoincluded job transfer or restriction.
4 Musculoskeletal disorders include cases in which the nature of the injury or illness is pinched nerve;herniated disc; meniscus tear; sprains, strains, tears; hernia (traumatic and nontraumatic); pain, swelling, andnumbness; carpal or tarsal tunnel syndrome; Raynaud’s syndrome or phenomenon; musculoskeletal system andconnective tissue diseases and disorders, and when the event or exposure leading to the injury or illness isoverexertion and bodily reaction, unspecified; overexertion involving outside sources; repetitive motion involvingmicrotasks; other and multiple exertions or bodily reactions; and rubbed, abraded, or jarred by vibration.
5 Selected occupations ranked in descending musculoskeletal disorder count for private, State, and local
government.6 Excludes farms with fewer than 11 employees.7 Data for Mining (Sector 21 in the North American Industry Classification System-- United States, 2012)
include establishments not governed by the Mine Safety and Health Administration rules and reporting, such asthose in Oil and Gas Extraction and related support activities. Data for mining operators in coal, metal, andnonmetal mining are provided to BLS by the Mine Safety and Health Administration, U.S. Department of Labor. Independent mining contractors are excluded from the coal, metal, and nonmetal mining industries. These datado not reflect the changes the Occupational Safety and Health Administration made to its recordkeepingrequirements effective January 1, 2002; therefore, estimates for these industries are not comparable to estimatesin other industries.
8 Data for employers in rail transportation are provided to BLS by the Federal Railroad Administration, U.S.Department of Transportation.
Note: Dash indicates data do not meet publication guidelines. Because of rounding and data exclusion ofnonclassifiable responses, data may not sum to the totals.
Source: U.S. Bureau of Labor Statistics, Survey of Occupational Injuries and Illnesses, in cooperation withparticipating state agencies.
31