non-users’ trade-off between natural scenery, water quality, ecological functions and biodiversity...
TRANSCRIPT

Non-users’ trade-off between natural scenery, water quality,ecological functions and biodiversity conservation: a wayto preserve wetlands
Sara Kaffashi • Mad Nasir Shamsudin •
Alias Radam • Khalid Abdul Rahim •
Mohd Rusli Yacob
Published online: 6 February 2013
� Springer Science+Business Media New York 2013
Abstract The inclusion of both non-use values and val-
ues placed by non-users provide more reliable results about
the real values of wetlands. A choice experiment method
was conducted to estimate the willingness to pay for
environmental conservation in non-users’ communities
adjacent to the Shadegan International Wetland (SIW) in
Iran. A random parameter logit (RPL) model was devel-
oped to derive the marginal value and compensating sur-
plus of the respondents for five attributes of the non-market
values of SIW. The trade-off between five different wet-
land attributes showed that water quality improvement and
biodiversity conservation were the most highly valued
attributes. The results demonstrated that about 66 % of
non-users were willing to donate money for the contribu-
tion in SIW conservation, suggesting that non-users have
the potential to contribute to SIW conservation programs.
Keywords Non-users � Choice experiment � Random
parameter logit � Shadegan International Wetland �Compensating surplus
1 Introduction
Wetlands support people’s lives with various products and
functions. They are an important source of goods (e.g.,
food, fuel wood, fresh water and construction materials)
and services (e.g., pollution control, water treatment, and
nutrient deposition). However, in competition between
existence of wetland and polluted industries, wetlands are
often the losers because most industries are unfamiliar with
the wide range of values provided by wetlands. Shadegan
International Wetland (SIW), as the largest wetland in Iran,
is presumed to be one of the losers of this competition.
Poor management, disorganized and unplanned construc-
tion, accompanied by lack of information about the real
values of this wetland, have lead to the increasing rate of
destruction of this ecosystem (Kaffashi et al. 2011).
It is believed that evaluating the true value of natural
assets according to the comparable values with other eco-
nomic sectors of the country can improve long-term against
short-term economic benefits. In economics, values are tied
to human wants and costs imposed to them to satisfy
human wants (Badola et al. 2010). Since most of wetlands’
values are not included in market price, the economic value
of wetland can be threatened by uncertainty. Evaluating the
total economic value of preserving wetlands will increase
social benefits and in essence will maximize social welfare.
While researchers are mostly interested in estimating the
value of certain wetland area based on users’ perceptions,
total economic value of wetlands should include non-use
values and values placed by non-users as well. The prob-
lem is that the benefits from wetlands are often not real-
izable in conventional economic terms and are often
received by those who do not bear the costs because they
are distant from the wetland in space or time (Ambastha
et al. 2007; Wattage and Mardle 2007). Since the motives
of the non-users are mostly non-use values, estimating non-
users’ values could provide more reliable results about the
real values of wetlands and possibly lead to more plausible
alternative policies (Fonseca 2009). Generally, non-users
are located away from the wetland and value the preser-
vation or existence value of it. However, others of these
respondents may value the possibility of future use of
wetland (Bateman and Langford 1997). The aim of this
S. Kaffashi (&) � M. N. Shamsudin � A. Radam �K. A. Rahim � M. R. Yacob
Serdang, Malaysia
e-mail: [email protected]
123
Environ Syst Decis (2013) 33:251–260
DOI 10.1007/s10669-013-9436-7
study is hence to determine the economic value of different
functions and services of SIW for non-users of this eco-
system. A choice experiment (CE) method was applied for
the analysis.
Most natural resource economic value studies have tried
to capture non-users’ willingness to pay (WTP) by using
contingent valuation method (CVM). Bateman and Lang-
ford (1997) reported the non-users’ WTP for non-use val-
ues of the Norfolk Broads preservation. The results of their
study showed that non-users had positive WTP, although it
was 3.5 times smaller than users’ WTP. Kniivila’s (2006)
studied whether non-users lack of familiarity with the
valued resource caused invalid and unreliable responses in
CVM surveys. The study reported that there was no sig-
nificant difference in validity of responses of non-users of
the resource compared to those with previous experience of
the resource. Horton et al. (2003) assessed the non-users’
WTP for protected areas in the Amazon (Brazil). Their
study also found that non-users were significantly willing
to protect the Brazilian Amazon forest. Fonseca (2009)
studied the value of Fijian coral reefs for non-user house-
holds in the Metro Atlanta area. Using CVM, the results of
the study demonstrated an average value of about US$
13.9. Other studies such as by Klocek (2004), Rogers et al.
(2012), Jørgensen et al. (2012), and Martınez-Paz and Perni
(2011) also confirmed the significant and positive WTP of
non-users in natural resources conservation.
2 Methodology
2.1 Choice experiments
The CE method was applied in this study due to its capa-
bility in valuing the diverse attributes of the natural envi-
ronment (Hensher et al. 2005a, b; Louviere et al. 2000).
Like CVM, CE is used for measuring both use values in
practical applications and non-use values for theory (Ad-
amowicz et al. 1994, 1998). Bennett and Blamey (2001)
and Alpizar et al. (2001) argued that CE has grown in
popularity because of the quantity of information it can
provide, its ability to generate values for resource attri-
butes, its realism relative to other methods and because of
concerns regarding the validity of CVM.
Given the complexity of natural resource decisions, CE
method results can be used to investigate the importance of
attributes and to gain useful information about people’s
preferences over a number of decision alternatives (Bat-
eman et al. 2002). The data then can be used to estimate the
economic value of various combinations of attributes and
their levels. Hence, more information can be collected from
a single CE survey than from CVM.
2.1.1 Questionnaire design
Choice experiment is based on questionnaires to gather
information. Hence, respondents were presented with a
hypothetical market. The first step in developing a CE
questionnaire was to identify relevant attributes of the non-
market goods under valuation. Several meetings were con-
ducted with wetland managers and local authorities to select
appropriate attributes and related levels. Two series of focus
group studies were conducted (one with university lecturers
of Iran and another with staffs of the Natural environment
sector of Shadegan Environmental Conservation Office) to
aid in questionnaire design and identify relevant attributes
and levels (Kaffashi et al. 2012). In addition, review of the
attributes and attribute levels used in the previous studies of
Shadegan Wetland (e.g., Zare-Maivan 2004; PCE 2002;
Ansari and Mohammadi 2006; Internal reports of DOE of
Iran 1999 and 2005; DOE of Khuzestan Province 1995,
1996, 1997; and Fishery research Organization of Khuzestan
Province 1995) helped us to select those attributes which
were either policy relevant or expected to influence the
respondents’ choices (Alpizar et al. 2001). Based on the
focus group discussion and the literatures, the relevant
attributes and levels for economic valuation of SIW that were
selected included natural scenery (NS), water quality
(WAT), biodiversity (with emphasis on endangered bird
species) (BIO), ecological functions (EF) and conservation
value (price) (CV) (Table 1). As shown in the table, each
attribute was set at three levels based on historical quality
change of the attribute. In this way, the minimum level was
the ‘‘current condition’’ or ‘‘status quo,’’ while the maximum
level designated the best condition, historically. Since one
primary purpose of this study was to calculate the social
welfare measure, it was necessary to include a monetary
attribute. The price vector used in the design was based on
Iranian national parks’ entrance fees. The payment vehicle
was assumed to be a hypothetical donation to improve the
wetland conservation.
2.1.2 Experimental design
Based on the selected attributes and levels, the experi-
mental design technique and SPSS software were used to
obtain orthogonal design. While full factorial design
included 324 alternatives, using fractional factorial design
resulted in 16 alternatives. The final design then consisted
of just 10 alternatives in five choice sets, each choice set
including two purposed options, plus status quo.
2.1.3 Questionnaire development
The questionnaire was categorized into three subsections.
The first part included the CE questions. Three unique
252 Environ Syst Decis (2013) 33:251–260
123
options were presented, distinguished by their attributes
and associated cost. Option A and option B entailed various
combinations of conservation along with some yearly cost
to the households, while option C was always a weak
conservation scenario (the current situation), to which no
cost was attached. The respondents were asked to choose
one of the two options presented in each question,
according to their preference, or the ‘‘no change’’ or ‘‘status
quo’’ box if they like current condition to continue in
Shadegan wetland without extra cost to them but more
losses in naturalness, hydrological and ecological function
of wetland. The respondents were also asked to answer
each choice set independent than others. It was expected
that the respondents would value those levels of NS, BIO,
WAT and EF that might be expected to result in a higher
quality of life and offer greater utility of the wetlands’
natural resources (Kaffashi et al. 2012). The choice of
alternative A, B or the status quo to answer each question
yielded information about the value of each selected sce-
nario to any given respondent. The second part contained
questions to gauge respondents’ attitudes on different
aspects of SIW. In this section, series of statement were
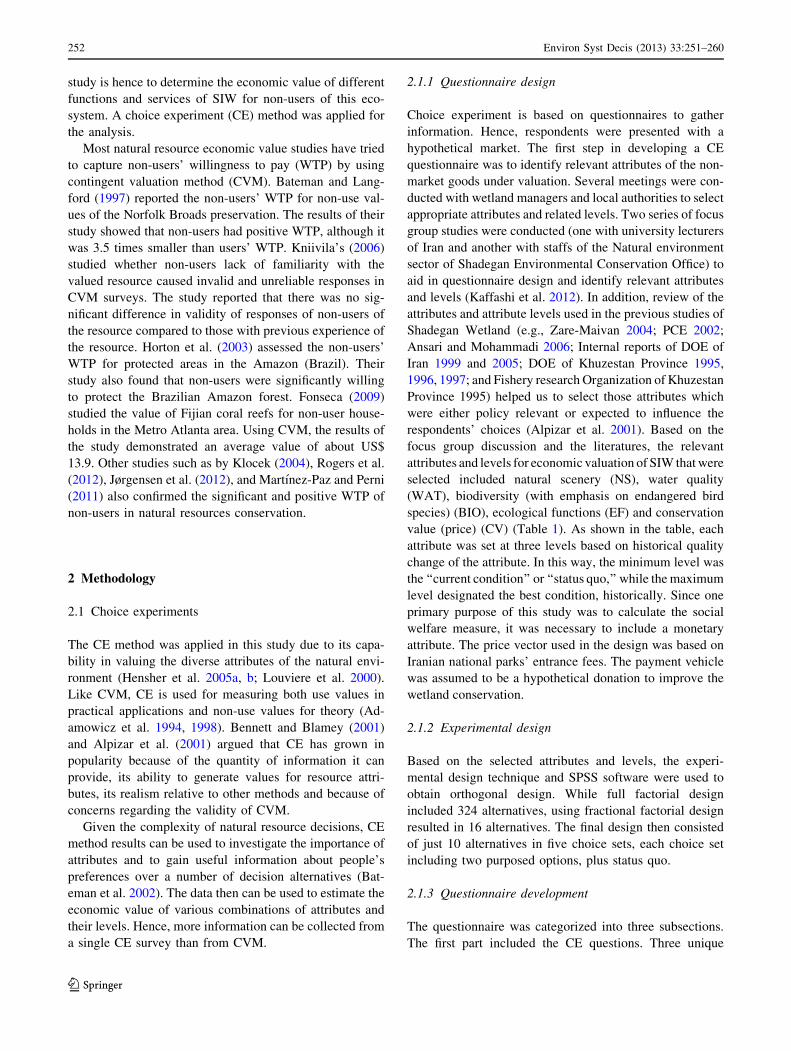
Table 1 Attributes and their levels used for SIW valuation
Attribute Attribute levelLevel 1 level 2 level 3
Natural Scenery: Satisfaction level from knowing that natural scenery is as close as possible to its natural state and relatively unaffected by human activity.
Not satisfactory* Less Satisfactory SatisfactoryNot satisfactory*: several constructions and activities destroyed natural beautyLess Satisfactory: allowed some constructions in those parts of wetland which is closed to petrochemical and industrial zone Satisfactory: The natural scenery preserved beautifully with little damage and pollution, no threats to the scenery from industrial development
Water quality: physical, chemical and biological characteristics of Shadegan wetland with emphasis on nutrients, Electrical conductivity, biological and chemical oxygen demand, water color, odor and phytoplankton bloom.
Unacceptable* Moderately acceptable AcceptableUnacceptable*: polluted water, stink, unclear, algal bloom Moderately acceptable : unclear, moderately polluted water Acceptable; without odor, color and acceptable water quality standard view point of contaminant
Biodiversity: Refers to the number of endangered, vulnerable and rare bird species.
Low* Medium HighLow*: 50% of historic population with no strict management and continued decline of familiar, rare and endangered species. Medium: Improvement some essential condition of wetland and mend ecosystem health until we have 65% of historic population. High: Improvement wetland condition including restoration habitats, ecosystem health and process and prevention of pollution and diverse human activities until we have 80% of historic population. .
Ecological functionsRefers to those processes that wetlands perform independent of human intervention, such as nutrient cycling, flood flow alteration, sediment stabilization and pollution retention.
Weak* Moderate PerfectWeak*: allow further degradation of Shadegan wetland and losses in wetland functions until wetland has no more capacity for flood control, sediment and nutrient retention and other functions. Moderate: restoration just those functions that have direct Impact on human like e.g. flood control Perfect: Improvement all functions to original condition
Conservation value Rials 0*Rials 15000Rials 22500Rials 30000
* Status quo or current condition of SIW
Environ Syst Decis (2013) 33:251–260 253
123
presented to gauge the perceptions about environmental
policy in general and wetlands conservation in particular
on a five-point scale ranging from ‘‘strongly agree’’ to
‘‘strongly disagree.’’ The questions related to visiting or
using SIW were also included in this section. These
questions later helped us to distinguish the non-users of the
wetland and consider them for further analysis. However,
the interviews were merely to elicit responses to the
questionnaire, but open-ended questions on respondents’
disagreement to participate in interview or always choos-
ing status quo were included as well. The last section of
the questionnaire contained questions regarding socio-
economic profile of the respondents. This section included
questions about age, gender, occupation, education level,
family size, income level and residential status.
2.2 Welfare measurement
The CE technique relies on both random utility theory
(Thurstone 1927; McFadden 1974; Manski 1977) and the
characteristics theory of value (Lancaster 1966). Thus, the
individual utility function (for individual i), where the
respondent is facing a set of K alternatives (j = 1,…, K),
can be specified as:
Uij ¼ Vij þ eij ð1Þ
where Uij is the utility that individual i obtains from an
alternative choice set j, Vij is a non-stochastic utility
function and eij is a random component. Consider an
individual was asked to choose between alternative goods
that are assumed to be differentiated by their attributes and
levels. In choosing between them, the respondent is
assumed to compare the preference relation represented
by utility that he or she could get with either choice before
selecting the alternative with the higher utility:
Pij ¼ ðVij þ eijÞ[ ðVik þ eikÞ¼ P½ Vij � Vik
� �[ ðeij � eikÞ�
ð2Þ
Assuming that the vector Vij is linear, the utility function of
the respondent’s components can be written as follows:
Vij ¼ b1Xij þ b2X2inj þ . . .þ bnXnij ð3Þ
where, Xs are variables in the utility function and bs are the
coefficients to be estimated. If a single vector of the
coefficients, bs, applies to the whole associated utility
function, then:
Pij ¼expðbVijÞ
Rij expðbVikÞð4Þ
where Pij = probability that respondent i will choose
alternative j; Xij and Xik = vectors of attributes i and j; and
b = vector of coefficients.
The above formula is expressed as the probability of
choosing alternative j over alternative k when the differ-
ences between the deterministic parts of their utility exceed
the differences in their error parts. The assumption of
independently and identically distributed error terms
implies independence of the irrelevant attributes (IIA),
meaning that the ratio of choice probabilities for any two
alternatives is unchanged by the addition or removal of
other, unselected alternatives (Blamey et al. 2001). This
assumption is one limitation of conditional logit models
(CLM), in which, if an IIA property is violated, the results
would be biased. Hence, some other model random
parameter logit (RPL) or Latent Class should be used that
does not need the IIA property (Kaffashi et al. 2012).
A RPL model, which is a generalization of the standard
multinomial logit model, was applied in this study for two
main reasons. First, it explicitly accounts for unobserved
preference heterogeneity across respondents, and second,
in the RPL model the alternatives are not independent
(Cameron and Trivedi 2005; Hensher and Greene 2003).
Thus, it has an advantage of relaxing the IIA assumption of
independence of irrelevant alternatives (IIA) (Birol and
Cox 2007). In this case, the random utility function is given
by the following expression:
Uij ¼ biXij þ eij ¼ b0Xj þ biXj þ eij ð5Þ
where Uij is the utility of alternative j for individual i, and bis the sum of the population mean (b0) and the individual
deviation from the mean (b). We assumed that all variables
other than CV (the conservation value, or cost variable) are
random and normally distributed. The specification of RPL
can be found in Hensher and Greene (2003) and Hensher
et al. (2005a, b).
For an estimation of willingness to pay (WTP), the price
or cost attribute must be included. For a marginal change in
an attribute, the WTP value is typically derived by dividing
the b value of each non-monetary attribute by the b value
of the price attribute (Kaffashi et al. 2012). Accordingly,
the average willingness to pay for changes in attributes can
be computed using the following formula (Holmes and
Adamowicz 2003):
$ Welfare ¼ 1=bcð Þ V0 � V1½ � ð6Þ
where bc is the value of the price attribute, and V0 and V1
represent indirect utility functions before and after the
change under consideration.
2.3 Data collection
2.3.1 Study site
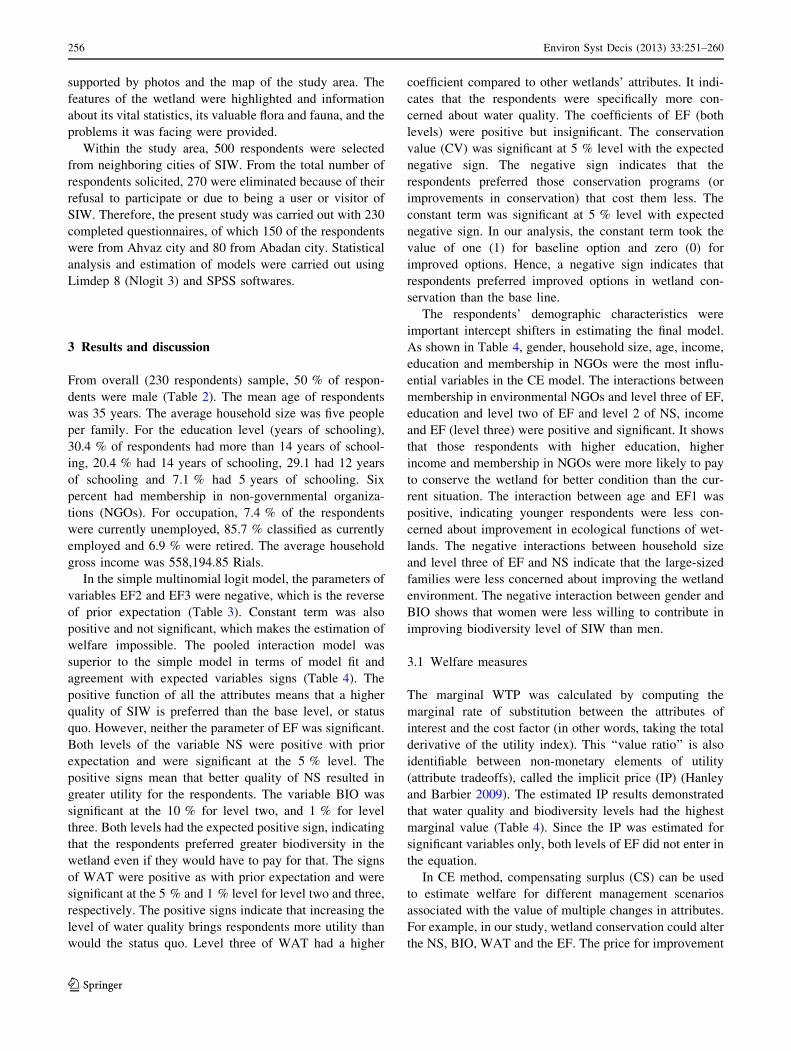
With an area of 537,000 hectares, SIW is the largest wet-
land in Iran (Fig. 1). Following the demise of much of the
254 Environ Syst Decis (2013) 33:251–260
123
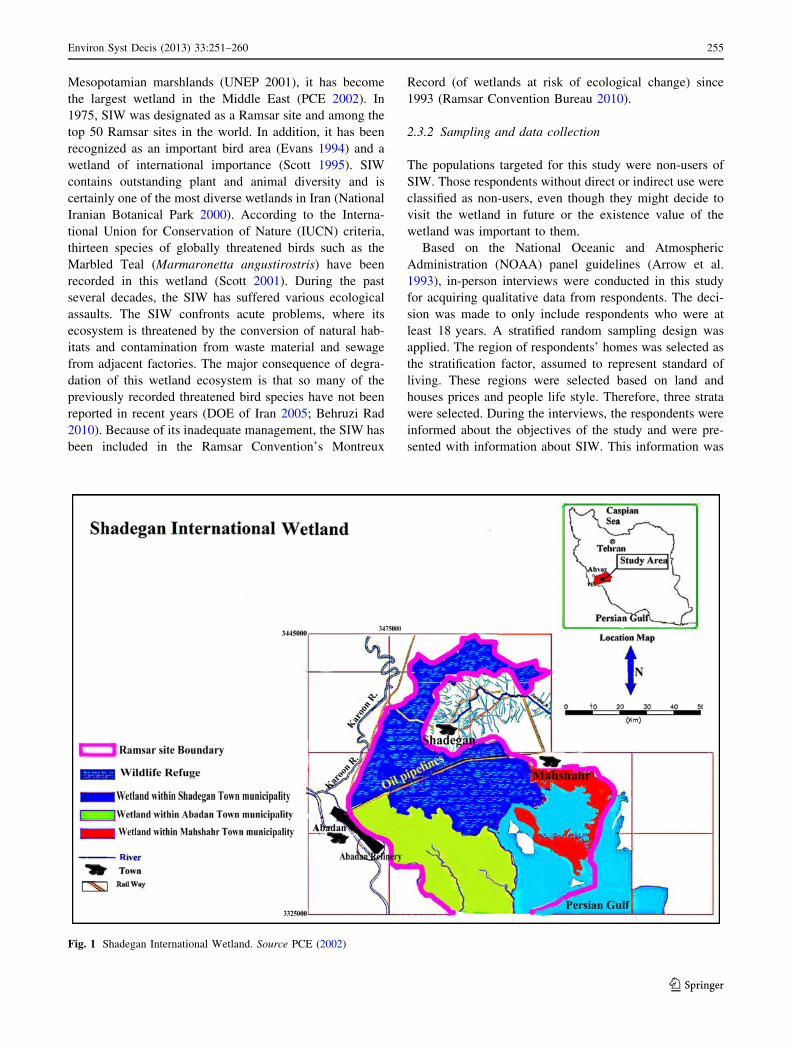
Mesopotamian marshlands (UNEP 2001), it has become
the largest wetland in the Middle East (PCE 2002). In
1975, SIW was designated as a Ramsar site and among the
top 50 Ramsar sites in the world. In addition, it has been
recognized as an important bird area (Evans 1994) and a
wetland of international importance (Scott 1995). SIW
contains outstanding plant and animal diversity and is
certainly one of the most diverse wetlands in Iran (National
Iranian Botanical Park 2000). According to the Interna-
tional Union for Conservation of Nature (IUCN) criteria,
thirteen species of globally threatened birds such as the
Marbled Teal (Marmaronetta angustirostris) have been
recorded in this wetland (Scott 2001). During the past
several decades, the SIW has suffered various ecological
assaults. The SIW confronts acute problems, where its
ecosystem is threatened by the conversion of natural hab-
itats and contamination from waste material and sewage
from adjacent factories. The major consequence of degra-
dation of this wetland ecosystem is that so many of the
previously recorded threatened bird species have not been
reported in recent years (DOE of Iran 2005; Behruzi Rad
2010). Because of its inadequate management, the SIW has
been included in the Ramsar Convention’s Montreux
Record (of wetlands at risk of ecological change) since
1993 (Ramsar Convention Bureau 2010).
2.3.2 Sampling and data collection
The populations targeted for this study were non-users of
SIW. Those respondents without direct or indirect use were
classified as non-users, even though they might decide to
visit the wetland in future or the existence value of the
wetland was important to them.
Based on the National Oceanic and Atmospheric
Administration (NOAA) panel guidelines (Arrow et al.
1993), in-person interviews were conducted in this study
for acquiring qualitative data from respondents. The deci-
sion was made to only include respondents who were at
least 18 years. A stratified random sampling design was
applied. The region of respondents’ homes was selected as
the stratification factor, assumed to represent standard of
living. These regions were selected based on land and
houses prices and people life style. Therefore, three strata
were selected. During the interviews, the respondents were
informed about the objectives of the study and were pre-
sented with information about SIW. This information was
Fig. 1 Shadegan International Wetland. Source PCE (2002)
Environ Syst Decis (2013) 33:251–260 255
123
supported by photos and the map of the study area. The
features of the wetland were highlighted and information
about its vital statistics, its valuable flora and fauna, and the
problems it was facing were provided.
Within the study area, 500 respondents were selected
from neighboring cities of SIW. From the total number of
respondents solicited, 270 were eliminated because of their
refusal to participate or due to being a user or visitor of
SIW. Therefore, the present study was carried out with 230
completed questionnaires, of which 150 of the respondents
were from Ahvaz city and 80 from Abadan city. Statistical
analysis and estimation of models were carried out using
Limdep 8 (Nlogit 3) and SPSS softwares.
3 Results and discussion
From overall (230 respondents) sample, 50 % of respon-
dents were male (Table 2). The mean age of respondents
was 35 years. The average household size was five people
per family. For the education level (years of schooling),
30.4 % of respondents had more than 14 years of school-
ing, 20.4 % had 14 years of schooling, 29.1 had 12 years
of schooling and 7.1 % had 5 years of schooling. Six
percent had membership in non-governmental organiza-
tions (NGOs). For occupation, 7.4 % of the respondents
were currently unemployed, 85.7 % classified as currently
employed and 6.9 % were retired. The average household
gross income was 558,194.85 Rials.
In the simple multinomial logit model, the parameters of
variables EF2 and EF3 were negative, which is the reverse
of prior expectation (Table 3). Constant term was also
positive and not significant, which makes the estimation of
welfare impossible. The pooled interaction model was
superior to the simple model in terms of model fit and
agreement with expected variables signs (Table 4). The
positive function of all the attributes means that a higher
quality of SIW is preferred than the base level, or status
quo. However, neither the parameter of EF was significant.
Both levels of the variable NS were positive with prior
expectation and were significant at the 5 % level. The
positive signs mean that better quality of NS resulted in
greater utility for the respondents. The variable BIO was
significant at the 10 % for level two, and 1 % for level
three. Both levels had the expected positive sign, indicating
that the respondents preferred greater biodiversity in the
wetland even if they would have to pay for that. The signs
of WAT were positive as with prior expectation and were
significant at the 5 % and 1 % level for level two and three,
respectively. The positive signs indicate that increasing the
level of water quality brings respondents more utility than
would the status quo. Level three of WAT had a higher
coefficient compared to other wetlands’ attributes. It indi-
cates that the respondents were specifically more con-
cerned about water quality. The coefficients of EF (both
levels) were positive but insignificant. The conservation
value (CV) was significant at 5 % level with the expected
negative sign. The negative sign indicates that the
respondents preferred those conservation programs (or
improvements in conservation) that cost them less. The
constant term was significant at 5 % level with expected
negative sign. In our analysis, the constant term took the
value of one (1) for baseline option and zero (0) for
improved options. Hence, a negative sign indicates that
respondents preferred improved options in wetland con-
servation than the base line.
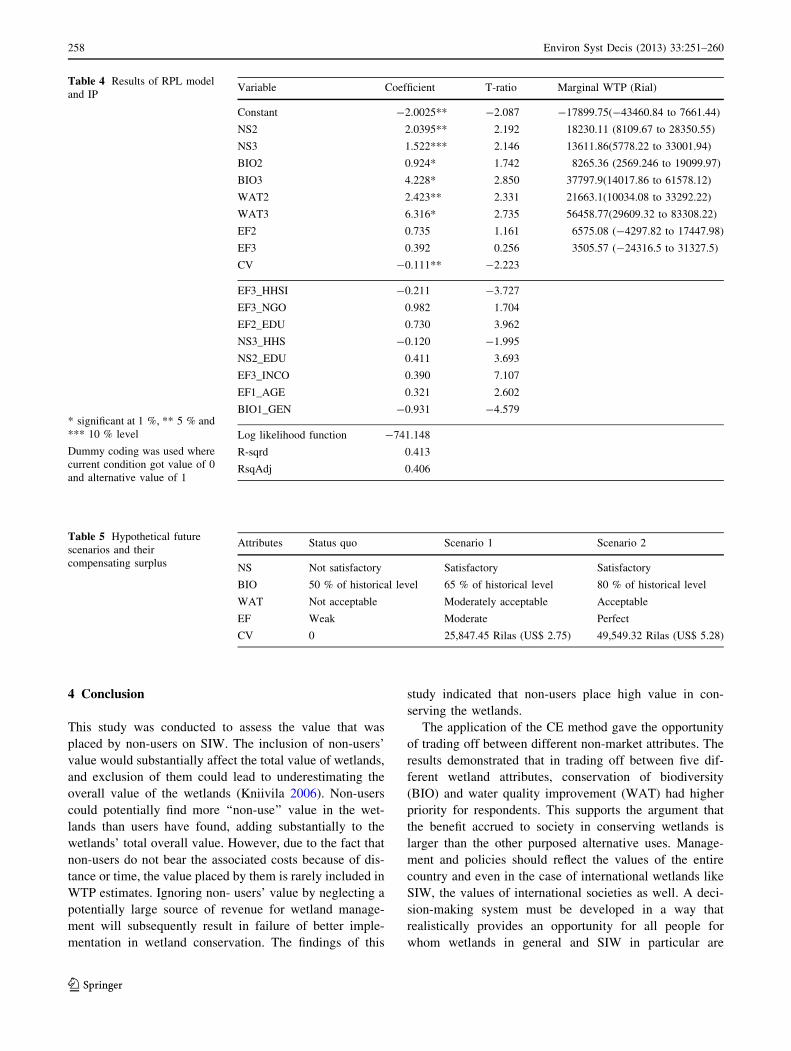
The respondents’ demographic characteristics were
important intercept shifters in estimating the final model.
As shown in Table 4, gender, household size, age, income,
education and membership in NGOs were the most influ-
ential variables in the CE model. The interactions between
membership in environmental NGOs and level three of EF,
education and level two of EF and level 2 of NS, income
and EF (level three) were positive and significant. It shows
that those respondents with higher education, higher
income and membership in NGOs were more likely to pay
to conserve the wetland for better condition than the cur-
rent situation. The interaction between age and EF1 was
positive, indicating younger respondents were less con-
cerned about improvement in ecological functions of wet-
lands. The negative interactions between household size
and level three of EF and NS indicate that the large-sized
families were less concerned about improving the wetland
environment. The negative interaction between gender and
BIO shows that women were less willing to contribute in
improving biodiversity level of SIW than men.
3.1 Welfare measures
The marginal WTP was calculated by computing the
marginal rate of substitution between the attributes of
interest and the cost factor (in other words, taking the total
derivative of the utility index). This ‘‘value ratio’’ is also
identifiable between non-monetary elements of utility
(attribute tradeoffs), called the implicit price (IP) (Hanley
and Barbier 2009). The estimated IP results demonstrated
that water quality and biodiversity levels had the highest
marginal value (Table 4). Since the IP was estimated for
significant variables only, both levels of EF did not enter in
the equation.
In CE method, compensating surplus (CS) can be used
to estimate welfare for different management scenarios
associated with the value of multiple changes in attributes.
For example, in our study, wetland conservation could alter
the NS, BIO, WAT and the EF. The price for improvement
256 Environ Syst Decis (2013) 33:251–260
123

(paid in donations) was implemented as a conservation
value attribute. The CE method is consistent with utility
maximization and demand theory. Once the parameters are
estimated, CS welfare measures required to effect a desired
change in wetland conservation, CS, can be calculated by
using the following formula (Hanley and Barbier 2009):
CS ¼ ln R exp Vi1ð Þ � ln R exp Vi0ð Þ½ �=a¼ �1=bCV Vi1 � Vi0ð Þ ð7Þ
while
Vi0 ¼ aþ bNS0 þ bBIO0 þ bWAT0 þ bEF0 ð8Þ
where a is the marginal utility of income (represented by
the coefficient of the monetary attribute in the CE), and Vi0and Vi1 represent indirect utility functions before and after
the change under consideration, respectively.
The attribute levels were used to characterize different
management scenarios (Table 5). The estimated CS for
medium level of the SIW management was 25,847.45 Rilas
(US$ 2.75), and for perfect management scenario, this value
increased to 49,549.32 Rilas (US$ 5.28). However, there is a
probability of uncertainty in the results based on proposed
scenarios and definition of perfect or medium level man-
agement. Overall, these values show the utility that people
derive simply from improvement in the wetland condition
and a change in their condition from the status quo.
Table 2 Socio-economic profile of the respondents
Variable Description Number Frequency (%) Mean
Overall Ahvaz Abadan
Age (year) Continuous variable 34.5 35.5 35.13
Gender
Male Dummy: 1 = male, 0 = female 115 50 50 51
Female 115 50 49 49
Education Level Continuous variable; years of schooling 14.17
Elementary school 16 7 5 9.1
Secondary school 46 20 17.5 22.7
High school 67 29.1 32.5 22.5
College 31 13.5 12.5 14.5
Graduate or postgraduate 70 30.4 32.5 28.2
Number of household Continuous variable 5.4 5.04 5.23
Membership in NGOs Dummy: 0 = no membership, 1 = membership
Yes 14 7 11.7 0
No 216 93 88.3 100
Employment status Dummy: 0 = unemployed, 1 = currently employed
and retiredCurrently unemployed 17 7.4 14.5 8.2
Currently employed 197 85.7 80 88.8
Retired 16 6.9 5.5 3.0
Income (Rials) Annual household income after declining tax
and other costs
558,194.85
Low (\3,000,000) 32 13.9 18.3 11.8
Medium (3,100,000–6,400,000) 108 47.0 50 43.6
High ([6,500,000) 90 39.1 31.7 44.5
Table 3 Results of Simple multinomial logit model
Variable Coefficient T-ratio
NS2 2.859 3.871
NS3 0.777 1.306
BIO2 0.416 0.843
BIO3 2.916** 2.395
WAT2 3.065* 3.806
WAT3 6.090* 3.305
EF2 -0.403 -0.939
EF3 -2.087 -2.319
CV -0.0008** -2.006
Log likelihood function -915.780
R-sqrd 0.282
* significant at 1 %, ** 5 %
Environ Syst Decis (2013) 33:251–260 257
123
4 Conclusion
This study was conducted to assess the value that was
placed by non-users on SIW. The inclusion of non-users’
value would substantially affect the total value of wetlands,
and exclusion of them could lead to underestimating the
overall value of the wetlands (Kniivila 2006). Non-users
could potentially find more ‘‘non-use’’ value in the wet-
lands than users have found, adding substantially to the
wetlands’ total overall value. However, due to the fact that
non-users do not bear the associated costs because of dis-
tance or time, the value placed by them is rarely included in
WTP estimates. Ignoring non- users’ value by neglecting a
potentially large source of revenue for wetland manage-
ment will subsequently result in failure of better imple-
mentation in wetland conservation. The findings of this
study indicated that non-users place high value in con-
serving the wetlands.
The application of the CE method gave the opportunity
of trading off between different non-market attributes. The
results demonstrated that in trading off between five dif-
ferent wetland attributes, conservation of biodiversity
(BIO) and water quality improvement (WAT) had higher
priority for respondents. This supports the argument that
the benefit accrued to society in conserving wetlands is
larger than the other purposed alternative uses. Manage-
ment and policies should reflect the values of the entire
country and even in the case of international wetlands like
SIW, the values of international societies as well. A deci-
sion-making system must be developed in a way that
realistically provides an opportunity for all people for
whom wetlands in general and SIW in particular are
Table 4 Results of RPL model
and IP
* significant at 1 %, ** 5 % and
*** 10 % level
Dummy coding was used where
current condition got value of 0
and alternative value of 1
Variable Coefficient T-ratio Marginal WTP (Rial)
Constant -2.0025** -2.087 -17899.75(-43460.84 to 7661.44)
NS2 2.0395** 2.192 18230.11 (8109.67 to 28350.55)
NS3 1.522*** 2.146 13611.86(5778.22 to 33001.94)
BIO2 0.924* 1.742 8265.36 (2569.246 to 19099.97)
BIO3 4.228* 2.850 37797.9(14017.86 to 61578.12)
WAT2 2.423** 2.331 21663.1(10034.08 to 33292.22)
WAT3 6.316* 2.735 56458.77(29609.32 to 83308.22)
EF2 0.735 1.161 6575.08 (-4297.82 to 17447.98)
EF3 0.392 0.256 3505.57 (-24316.5 to 31327.5)
CV -0.111** -2.223
EF3_HHSI -0.211 -3.727
EF3_NGO 0.982 1.704
EF2_EDU 0.730 3.962
NS3_HHS -0.120 -1.995
NS2_EDU 0.411 3.693
EF3_INCO 0.390 7.107
EF1_AGE 0.321 2.602
BIO1_GEN -0.931 -4.579
Log likelihood function -741.148
R-sqrd 0.413
RsqAdj 0.406
Table 5 Hypothetical future
scenarios and their
compensating surplus
Attributes Status quo Scenario 1 Scenario 2
NS Not satisfactory Satisfactory Satisfactory
BIO 50 % of historical level 65 % of historical level 80 % of historical level
WAT Not acceptable Moderately acceptable Acceptable
EF Weak Moderate Perfect
CV 0 25,847.45 Rilas (US$ 2.75) 49,549.32 Rilas (US$ 5.28)
258 Environ Syst Decis (2013) 33:251–260
123

important to participate in major decisions affecting wet-
land ecosystems.
References
Adamowicz W, Louviere J, Williams M (1994) Combining revealed
and stated preference methods. J Environ Econ Manage 26:
271–292
Adamowicz W, Boxall P, Williams M, Louviere J (1998) Stated
preference approaches for measuring passive use values: choice
experiments and contingent valuation. Am J Agric Econ 80(1):
64–75
Alpizar F, Carlsson F, Martinsson P (2001) Using choice experiments
for non-market valuation. Working papers in Economics no. 52.
Department of Economics Goteborg University
Ambastha K, Hussain SA, Badola R (2007) Social and economic
considerations in conserving wetlands of indo-gangetic plains: a
case study of Kabartal wetland, India. Environmentalist 30:
320–329
Ansari M, Mohammadi GH (2006) Comparison of fish and fishery
situation in Shadegan International Wetland (In Persion). The
3rd Iranian congress on environmental crises and their rehabil-
itation methodologies. Ahvaz 27–29 Dec 2006
Arrow K, Solow R, Portney PR, Leamer EE, Radner R, Schuman H
(1993) Report of the NOAA panel on contingent valuation. Fed
Reg 58:4601–4614
Badola R, Hussain SA, Mishra BK, Konthoujam B, Thapliyal S,
Dhakate PM (2010) An assessment of ecosystem services of
Corbett Tiger Reserve, India. Environmentalist 30:320–329
Bateman I, Langford I (1997) Non-users’ willingness to pay for a
national park: an application and critique of the contingent
valuation method. Regional Studies 31(6):571–582
Bateman IJ, Carson RT, Day B, Hanemann M, Hanley N, Hett T,
Jones-Lee M, Loomes J, Mourato S, Ozdemiroglu E, Pearce DW,
Sugden R, Swanson J (2002) Economic valuation with stated
preference techniques: a manual. Edward Elgar, Cheltenham
Behruzi Rad B (2010) Decline in Khuzestan migratory birds population.
http://abadan.irib.ir/1390-05-13-09-08-44/4409-1390-06-24-07-
42-58. Accessed 10 Dec 2010
Bennett J, Blamey R (2001) The choice modeling approach to
environmental valuation. Edward Elgar, Cheltenham
Birol E, Cox V (2007) Using choice experiments to design wetland
management programmes: the case of Severn estuary wetland,
UK. J environ plann manage 50(3):363–380
Blamey R, Rolfe J, Bennett J, Morrison M (2001) Valuing remnant
vegetation in Central Queensland using choice modeling. Aust J
Agric Resour Econ 44(3):439–456
Cameron AC, Trivedi PK (2005) Microeconometrics: methods and
applications. Cambridge university press, Cambridge
Department of Environment of Iran (1999) Specifications of areas
protected by DOE. Unpublished report, pp 15–38
Department of Environment of Iran (2005) Comprehensive manage-
ment of Shadegan wetland with especial emphasize on ecosys-
tem. Unpublished report (In Persian)
Evans MI (1994) Important birds areas in the Middle East.
Cambridge, U.K.: BirdLife International (BirdLife Conservation
Series no. 2)
Fonseca C (2009) The value of Fijian Coral Reefs by nonusers: a
contingent valuation study to investigate willingness-to-pay for
conservation, Understand scale/magnitude of Reef problems and
provide tools for practitioners. PhD Thesis. USA: Georgia
Institute of Technology
Hanley N, Barbier EB (2009) Pricing nature. Cost benefit analysis and
environmental policy. Edward Elgar Publishing Limited, UK
Hensher DA, Greene WH (2003) The mixed logit model: the state of
practice. Transportation 30(2):133–176
Hensher DA, Rose JM, Greene WH (2005a) Applied choice analysis:
a primer. Cambridge University Press, Cambridge
Hensher D, Shore N, Train K (2005b) Households’ willingness to pay
for water service attributes. Environ Resource Econ 32:509–531
Holmes TP, Adamowicz WL (2003) Attribute-based methods. In:
Champ A, Boyle KJ, Brown TC (eds) A primer on nonmarket
valuation. Kluwer Academic Publishers, Netherlands
Horton B, Colarullo G, Bateman IJ, Carlson AP (2003) Evaluating
non-user willingness to pay for a large-scale conservation
programme in Amazonia: a UK/Italian contingent valuation
study. Environ Conserv 30(02):139–146
Jørgensen LS, Olsen SB, Ladenburg J, Martinsen L, Svenningsen SR,
Hasler B (2012) Spatially induced disparities in users’ and non-
users’ WTP for water quality improvements-Testing the effect of
multiple substitutes and distance decay. Ecological Economics
(2012), http://dx.doi.org/10.1016/j.ecolecon.2012.07.015
Kaffashi S, Shamsudin MN, Radam A, Rahim KA, Yacob MR, Muda
A, Yazid M (2011) Economic valuation of Shadegan Interna-
tional Wetland, Iran: notes for conservation. Regional Environ
Change 11(4):925–934
Kaffashi S, Shamsudin MN, Radam A, Rahim AKh, Rusli MY, Yazid
M (2012) Economic valuation and conservation: do people vote
for better preservation of Shadegan International Wetland? Biol
Conserv 150:150–158
Khuzestan Environmental Conservation Office (1995) Study on
recognition and rehabilitation of natural environment in Khuze-
stan Province. Unpublished report, pp 33–43
Khuzestan Environmental Conservation Office (1996) Study on
recognition and rehabilitation of natural environment in Khuze-
stan Province. Unpublished report, pp 56–76
Khuzestan Environmental Conservation Office (1997) Study on
recognition and rehabilitation of natural environment in Khuze-
stan Province. Unpublished report, pp 44–50
Klocek CA (2004) Estimating the economic value of canaan valley
national wildlife refuge: a contingent valuation approach. PhD
Thesis Davis College of Agriculture Forestry, and Consumer
Sciences, West Virginia University. Morgantown, WV
Kniivila M (2006) Users and non-users of conservation areas: are
there differences in WTP, motives and the validity of responses
in CVM surveys? Ecol Econ 59(4):530–539
Lancaster KJ (1966) A new approach to consumer theory. The Journal
of Political Economy 74(2):132–157
Louviere J, Hensher D, Swait J (2000) Stated choice methods. Analysis
and application. Cambridge University Press, Cambridge
Manski C (1977) The structure of random utility models. Theor Decis
8:229–254
Martınez-Paz JM, Perni A (2011) Environmental cost of groundwater:
a contingent valuation approach. Int J Environ Res 5(3):603–612
McFadden D (1974) Conditional logit analysis of qualitative choice
behavior. In: Zarembka P (ed) Frontiers in econometrics.
Academic Press, New York
National Iranian Botanic Park (NIBP) (2000) Flora of Shadegan
International Wetland. Unpublished report
Pandam Consulting Engineers (2002) Management Plan for the
Shadegan Wetland Ecosystem. Report 4 of the EC-IIP Environ-
mental Management Project for Shadegan Wetland, 2002
Partow H (2001) The mesopotamian marshlands: demise of an ecosys-
tem, early warning and assessment technical report—division of
early warning and assessment DEWA (UNEP), No. 3, pp 3–22
Ramsar Convention Bureau (2010) http://www.ramsar.org/cda/en/
ramsar-documents-list/main/ramsar/1-31-218_4000_0. Accessed
on Dec 2010
Rogers S, Halstead J, and Seager T (2012) Characterization of Public and
Stakeholder Objectives in Environmental Management: A Case
Environ Syst Decis (2013) 33:251–260 259
123

Study of New Hampshire’s Lamprey River. J Water Resour Plann
Manage 2012. doi: 10.1061/(ASCE)WR.1943-5452.0000246
Scott DA (1995) A directory of the wetlands in the Middle East.
IUCN/IWRB
Scott DA (2001) The birds of Shadegan marshes and adjecent tidal
mudflats, Islamic Republic of Iran, pp 1–19
Thurstone L (1927) A law of comparative judgment. Psychol Rev
34:273–286
Wattage P, Mardle S (2007) Total economic value of wetland
conservation in Sri Lanka identifying use and non-use values.
Wetlands Ecol Manage 16(5):359–369
Zare-Maivan H (2004) Monitoring of ecological change in Shadegan
Wetland plant communities affected severely by oil spills and
soot consequent to the Iraq—Kuwait War. DRAFT version final
report on monitoring and assessment claim No. 5000344.
Ministry of Jihad-e-Agriculture, IR Iran
260 Environ Syst Decis (2013) 33:251–260
123