non-invasive method for detecting changes in soil … · muhammad iqbal dalel (n6459544) page ii...
TRANSCRIPT

NON-INVASIVE METHOD FOR DETECTING
CHANGES IN SOIL MOISTURE USING
WIRELESS SENSOR NETWORKS
MASTER’S TITLE
Muhammad Iqbal Darma Dalel, B.Eng
Submitted in fulfilment of the requirements for the degree of
Master of Engineering (Research)
Science and Engineering Faculty
Queensland University of Technology
2012

Master’s Thesis
Muhammad Iqbal Dalel (n6459544) Page i

Master’s Thesis
Muhammad Iqbal Dalel (n6459544) Page ii
Abstract
There are several popular soil moisture measurement methods today such as
time domain reflectometry, electromagnetic (EM) wave, electrical and acoustic
methods. Significant studies have been dedicated in developing method of
measurements using those concepts, especially to achieve the characteristics of non-
invasiveness. EM wave method provides an advantage because it is non-invasive to
the soil and does not need to utilise probes to penetrate or bury in the soil. But some
EM methods are also too complex, expensive, and not portable for the application of
Wireless Sensor Networks; for example satellites or UAV (Unmanned Aerial
Vehicle) based sensors.
This research proposes a method in detecting changes in soil moisture using
soil-reflected electromagnetic (SREM) wave from Wireless Sensor Networks
(WSNs). Studies have shown that different levels of soil moisture will affects soil’s
dielectric properties, such as relative permittivity and conductivity, and in turns
change its reflection coefficients. The SREM wave method uses a transmitter
adjacent to a WSNs node with purpose exclusively to transmit wireless signals that
will be reflected by the soil. The strength from the reflected signal that is determined
by the soil’s reflection coefficients is used to differentiate the level of soil moisture.
The novel nature of this method comes from using WSNs communication signals to
perform soil moisture estimation without the need of external sensors or invasive
equipment. This innovative method is non-invasive, low cost and simple to set up.
There are three locations at Brisbane, Australia chosen as the experiment’s
location. The soil type in these locations contains 10–20% clay according to the
Australian Soil Resource Information System. Six approximate levels of soil
moisture (8, 10, 13, 15, 18 and 20%) are measured at each location; with each
measurement consisting of 200 data. In total 3600 measurements are completed in
this research, which is sufficient to achieve the research objective, assessing and
proving the concept of SREM wave method. These results are compared with
reference data from similar soil type to prove the concept. A fourth degree

Master’s Thesis
Muhammad Iqbal Dalel (n6459544) Page iii
polynomial analysis is used to generate an equation to estimate soil moisture from
received signal strength as recorded by using the SREM wave method.

Master’s Thesis
Muhammad Iqbal Dalel (n6459544) Page iv
Table of Contents
Abstract ........................................................................................................................ ii
Table of Contents ........................................................................................................ iv
List of Figures ............................................................................................................. vi
List of Tables............................................................................................................. viii
List of Abbreviations................................................................................................... ix
Statement of Original Authorship ................................................................................ x
CHAPTER 1: INTRODUCTION ............................................................................. 1
1.1 Introduction......................................................................................................... 1
1.2 Significance and Contribution of Research ........................................................ 3
1.3 Research Questions and Objectives .................................................................... 4
1.4 Limitation and Scope of Research ...................................................................... 4
1.5 Summary ............................................................................................................. 5
CHAPTER 2: LITERATURE REVIEW ................................................................. 6
2.1 Introduction......................................................................................................... 6
2.2 Radio Wave Propagation .................................................................................... 6
2.2.1 Free Space ................................................................................................. 6
2.2.2 Ground Reflection Model.......................................................................... 7
2.2.3 Electrical Properties of Materials and the Fresnel Reflection Coefficient 9
2.2.4 Incorporating Reflection Coefficient into Free Space Equation ............. 12
2.3 Relationship between Dielectric Properties of Soil and Its Reflection
Coefficient .................................................................................................................. 12
2.4 Recent Studies on Methods of Measuring Soil Moisture ................................. 15
2.5 Summary ........................................................................................................... 20
CHAPTER 3: RESEARCH METHODOLOGY .................................................. 21
3.1. Introduction....................................................................................................... 21
Master’s Thesis
Muhammad Iqbal Dalel (n6459544) Page v
3.2. Equipment ......................................................................................................... 21
3.3 Experimental Set Up ......................................................................................... 23
3.4 Experiments ...................................................................................................... 27
3.4.1 Performance Characterisation of Waspmote and Antennas .................... 27
3.4.2 Proving Concept and Field Measurements.............................................. 29
3.5 Summary ........................................................................................................... 29
CHAPTER 4: RESULTS ......................................................................................... 31
4.1 Introduction....................................................................................................... 31
4.2 Test Results ....................................................................................................... 31
4.2.1 Transmission Distance and Attenuation by Vegetation .......................... 31
4.2.2 Attenuation by Angle ............................................................................. 35
4.2.3 Field Experiments ................................................................................... 36
4.2.4 Polynomial Equation ............................................................................... 46
4.3 Summary ........................................................................................................... 47
CHAPTER 5: CONCLUSIONS.............................................................................. 49
REFERENCES ......................................................................................................... 52

Master’s Thesis
Muhammad Iqbal Dalel (n6459544) Page vi
List of Figures
Figure 1 Signal attenuation decay rate in free space from equation (1)....................... 7
Figure 2 5 dBi (bottom) and 2 dBi antennae for 2.4 GHz frequency ......................... 7
Figure 3 Ground reflection two-ray model [9] ............................................................. 8
Figure 4 Geometry for calculating reflection coefficient between two dielectrics [11]10
Figure 5 Fresnel reflection coefficients for = 4 and = 12 as a function of
incidence angle [9] .............................................................................................. 11
Figure 6 Relationship between soil moisture and its dielectric properties [10] ......... 13
Figure 7 Soil relative permittivity at different soil moistures and frequencies [23] .. 14
Figure 8 Waspmote wireless sensor node with omni-directional antenna. ................ 21
Figure 9 WaspMote’s node with the yagi (right) and omni (left) antennas attached . 22
Figure 10 Lutron PMS714 soil moisture sensor ........................................................ 22
Figure 11 Three test sites at Brisbane, Queensland, Australia (Courtesy of Google
Map) .................................................................................................................... 23
Figure 12 ASRIS data on Australian surface soil texture [49]................................... 24
Figure 13 Experimental set up ................................................................................... 25
Figure 14 SREM wave method configuration. .......................................................... 26
Figure 15 WaspMote Gateway connected to a laptop ............................................... 26
Figure 16 Three scenarios from left right and bottom, grass, bush, and forest .......... 28
Figure 17 Transmission distance test results in dBm ................................................. 31
Figure 18 Comparison between horizontal and vertical polarisation......................... 32
Figure 19 Path Loss Exponent Calculation from Vertical and Horizontal Polarization33
Figure 20 Theoretical relationship between RSS and reflection coefficient.............. 36
Figure 21 RSS values based on reflection coefficients from Table 4 (εr = 4 – 14) ... 38
Figure 22 Measurement data from three test sites ..................................................... 40

Master’s Thesis
Muhammad Iqbal Dalel (n6459544) Page vii
Figure 23 Comparison between a fourth degree polynomial curve for measured data
and theoretical values with RSS measured as dBm ............................................ 43
Figure 24 Seventh and ninth degree polynomial curve of measured data and
theoretical values ................................................................................................ 45
Figure 25 Curve fitting to generate an empirical polynomial function ...................... 46

Master’s Thesis
Muhammad Iqbal Dalel (n6459544) Page viii
List of Tables
TABLE 1 DIFFERENT MATERIAL’S ELECTRICAL PROPERTIES ............................................... 9
TABLE 2 COMPARISON BETWEEN SEVERAL COMMERCIALLY AVAILABLE SOIL
MOISTURE SENSORS ....................................................................................................................... 19
TABLE 3 WASPMOTE’S SIGNAL STRENGTH ATTENUATION BECAUSE OF FOLIAGE ..... 34
TABLE 4 HARDWARE PERFORMANCE CHARACTERISATION RESULTS ............................ 35
TABLE 5 RECEIVED SIGNAL STRENGTH AT DIFFERENT SOIL CONDITIONS .................... 37
TABLE 6 THEORETICAL SIGNAL STRENGTH VALUES FOR 10–20% CLAY SOIL ............... 38
TABLE 7 MEAN SIGNAL STRENGTH VALUES FROM SOIL MOISTURE MEASUREMENTS41
TABLE 8 GOODNESS OF FIT OF THE DEGREES OF POLYNOMIAL ........................................ 44
TABLE 9 GOODNESS OF FIT OF THE FOURTH DEGREE POLYNOMIAL CURVE ................. 47

Master’s Thesis
Muhammad Iqbal Dalel (n6459544) Page ix
List of Abbreviations
SREM Soil-Reflected Electromagnetic
RSS Received Signal Strength
EM Electromagnetic
WSNs/WSNs Wireless Sensor Network/Networks
TDR Time Domain Reflectometry
FDR Frequency Domain Reflectometry
LOS Line of Sight

Master’s Thesis
Muhammad Iqbal Dalel (n6459544) Page x
Statement of Original Authorship
The work contained in this thesis has not been previously submitted to meet
requirements for an award at this or any other higher education institution. To the best of
my knowledge and belief, the thesis contains no material previously published or written
by another person except where due reference is made.
Signature: _________________________
Date: _________________________

Chapter 1: Introduction Page 1
Muhammad Iqbal Dalel (n6459544) Page 1
Chapter 1: Introduction
1.1 INTRODUCTION
This study investigates how electromagnetic (EM) waves, used by
wireless sensor networks (WSNs) to communicate with other applications, can be
utilised for environmental parameter determination. The main objective is to utilise
the attenuation of the surrounding environment that the wireless signals perceive for
measurement or estimation, without the use of invasive instruments. Malajner et al.
(2009) studied the accuracy of using received signal strength indicators (RSSIs) to
measure distances between WSNs nodes [1]. Giacomin, Vasconcelos and Silva
(2007) pursued a study on estimating vegetation moisture from received WSNs
signals [2]. With those concepts in mind, this research developed an alternative
method for detecting changes in soil moisture using WSNs signals.
WSNs provide new methods of remote monitoring as they are designed
to work with virtually no need for human intervention for long periods [3, 4]. They
can provide continuous data, logged at a selected interval of time or be only activated
by certain events detected by their sensors. Based on these aspects, WSNs present
useful characteristics that may help satisfy particular application purposes.
WSNs may need to be able to operate for long periods without human
intervention and therefore may rely on high capacity batteries and/or alternative
energy systems such as solar panels to optimise the battery use. Low power
consumption, small and compact, practical installation, weather and tamper proof in
some cases, and with a total height from the ground rarely exceeding 1.5 m are some
of the main characteristics and constraints to take into account when implementing
WSNs. Designing an effective method for detecting changes in soil moisture using a
WSNs application needs to consider all these aspects.
One of the most accurate methods of measuring soil moisture is weighing
the soil, then drying it in the oven until all water has evaporated [5, 6]. The
difference in weight before and after drying is the weight of the moisture in that soil
sample. This method, although it provides a relatively accurate measurement, is
destructive, labour intensive and non-economical [5, 6]. Regardless, this method is
usually employed to calibrate other methods of measuring soil moisture.

Chapter 1: Introduction Page 2
Muhammad Iqbal Dalel (n6459544) Page 2
Other methods do not directly measure the moisture in the soil; rather
they measure other variables that change when moisture levels change. For example,
some methods measure dielectric properties, emissivity, or speed of sound waves in
the soil. Measuring such variables provides a less invasive and overall more practical
and economical alternative than the direct measurement method; however, it may
introduces error and therefore reduce accuracy [5, 6].
These indirect methods of measuring soil moisture may be categorised
according to their means of detecting the variables. These are EM wave, electrical,
radiological, acoustic and physical based methods. EM wave methods, such as time
domain reflectometry (TDR) and frequency domain reflectometry (FDR), measure
the EM wave travel time in a waveguide buried in the soil. EM wave methods that
are more elaborate include capturing soil-reflected EM waves transmitted from a
satellite or an airplane. Electrical methods measure either the resistance or
capacitance of the soil. Acoustic method measure the travel time of a sound wave
between a transmitter and a receiver buried in the soil. Physical methods measure the
gravitational soil water potential.
Except for measuring the emissivity of the soil, which are expensive
processes, all methods described here required some sort of sensor (usually a steel
rod) to be inserted or buried in the soil. The major disadvantages of this approach are
that the inserted sensor disturbs the soil (an invasive method), it needs to be
connected through potentially impractical cables and it might corrode or be damaged
over time. Dry and hard soil conditions present further difficulties for probe
insertion. Additionally, since the sensors are highly precise and sensitive, they are
expensive to install and replace.
Recent research efforts have focused on developing methods to measure
soil moisture that have the characteristics of being non-invasive, practical, compact,
economical and accurate, although there is no one method that has satisfied all these
criteria. Adamo et al. (2004) [7] pursued the concept of using acoustic waves to
detect changes in soil moisture, but that method still needed an undersoil sensor.
Calla et al. (2008) [8] used a passive radiometer to capture satellite bound EM wave
emissions, but their elaborate equipment was impractical for many portable
applications.
This study reports a non-invasive, practical and economical method to
detect changes in soil moisture using wireless signals from WSNs. By reflecting EM

Chapter 1: Introduction Page 3
Muhammad Iqbal Dalel (n6459544) Page 3
waves to the soil at a certain angle of incidence and observing the corresponding
received signal strength (RSS) a relationship between RSS and soil moisture can be
developed. This is because changes in soil moisture affect the soil’s dielectric
properties. The strength of the reflected EM wave depends on the dielectric
properties of the reflected surface [9-11].
This method, herein called the soil-reflected electromagnetic (SREM)
wave method, utilises a transmitter antenna placed in the immediate vicinity of a
WSNs node with the purpose of exclusively transmitting wireless signals for soil
moisture measurement. The transmitter uses a single directional antenna that points
at a certain angle of incidence to the soil. The neighbouring WSNs node captures the
soil-reflected signal and records its RSS, which may be translated into a measure of
soil moisture. The node can then transmit the recorded data to where it is to be used.
This SREM wave method is non-invasive and can be used to detect
changes in soil moisture. The use of wireless signals means impractical cables and
connectors are not needed. Moreover, using the method only involves measuring
distances between the WSNs nodes and the antenna’s angle of incidence. Most
commercially available WSNs nodes are already capable of recording transmission
RSS; therefore, there should be no need for major developments of additional WSNs
software and operating systems.
This research used a Waspmote 2.4 GHz sensor, a state of the art WSNs
node sensor implementing the IEEE 802.15.4 standard. Although the SREM wave
method only requires a simple transmitter adjacent to the WSNs node, in this
research two identical WSNs nodes were used: one as a dedicated transmitter and the
other a standard WSNs for the receiver.
1.2 SIGNIFICANCE AND CONTRIBUTION OF RESEARCH
The SREM wave method has advantages over other methods as it is non-
invasive, low cost and practical. Invasive methods can disturb the accuracy of soil
moisture reading. Moreover, connecting cables presents problems with impracticability,
while dry soil adds difficulty when it is too hard to insert the sensor probes.
Soil moisture is an important type of data in many fields including
agriculture, farming and environmental monitoring. Farmers can determine the right
time to irrigate their fields by looking at soil moisture data to save water, or as a part of
preliminary test to determine whether a soil is suitable for farming [12-14]. Continuous

Chapter 1: Introduction Page 4
Muhammad Iqbal Dalel (n6459544) Page 4
soil moisture monitoring made possible with WSNs would allow data to be gathered on
rain distribution [13, 14]). Rhebergen (2003) [15] concluded that soil moisture content
plays a vital part in ground penetrating radar calibration to detect land mines.
Although there are many studies on using WSNs to estimate soil moisture
[3, 16], there is no research investigating the SREM wave method. Therefore, this study
contributes a method to estimate soil moisture. The nature of the contribution comes
from using WSNs communication signals to perform soil moisture estimation without
the need of external sensors or invasive equipment. This innovative method allows the
use of simple, low-cost radio transmitters to estimate soil moisture. The method also
involves low computational costs because it is only necessary to measure RSS, a feature
that is commonly available in most WSNs.
Another contribution from this research is the derivation of a function
that depicts the relationship between soil moisture and RSS. Results from this
research will provide the basis for further studies on the use of WSNs for estimating
soil moisture content.
1.3 RESEARCH QUESTIONS AND OBJECTIVES
The research question that this research was designed to address was:
‘Can we use soil-reflected electromagnetic waves to estimate soil moisture using
wireless sensor networks?’
The main research aim was to study and assess the concept of a non-invasive,
low cost and practical method for estimating soil moisture content using WSNs. To
answer the research question the following research objectives were developed:
1. Assess the concept of detecting different soil moisture levels using the
signal strength of SREM waves.
2. Propose an empirical function depicting the relationship between soil
moisture and signal strength from WSNs.
3. Analyse the proposed method results by comparing them to results from
theoretical and existing empirical methods.
1.4 LIMITATION AND SCOPE OF RESEARCH
The main research aim is to assess the concept of estimating soil moisture
with SREM waves using WSNs. Waspmote 2.4 GHz WSNs nodes with IEEE 802.15
Standard protocol are used. This study reports the hardware requirement and

Chapter 1: Introduction Page 5
Muhammad Iqbal Dalel (n6459544) Page 5
configuration of the SREM wave method and analyses the results by comparing them to
theoretical studies.
The expected limitations on this research include the sensitivity of the
WSNs nodes and the radiation pattern of the antenna. The sensitivity limitation in
detecting RSS of the Waspmote’s WSNs nodes is 1 dBm. The Yagi antenna cannot
completely eliminate the direct-path signal and this limitation will cause interference
with the soil-reflected signals.
The experiments’ benchmark is a portable soil moisture sensor; thus, the
results are highly dependent on this device. This is not a major concern because the goal
is to investigate the concept; thus, it is sufficient to show that the SREM wave method
can differentiate between different levels of soil moisture. The data collected are only
from soil at Brisbane, Australia, comprising ten to twenty per cent clay, as determined
from data in the Australian Soil Resource Information System (ASRIS). To assess the
method further, additional studies of different types of soils are needed.
1.5 SUMMARY
There are five chapters in this thesis. Chapter 2 presents a literature review
and describes the basic concepts of wireless signal propagation and EM waves. It
discusses the relationship between soil moisture, soil dielectric properties and the related
behaviour of EM waves. It also describes the available methods for measuring and
detecting soil moisture, the current studies in that field and the directions current
research trends are heading. It discusses the importance of non-invasive, inexpensive and
simple to set up and operate methods of monitoring soil moisture in WSNs applications.
Chapter 3 describes the research design and what experimental set up was
needed to achieve the objectives of this research. It discusses the goals of each research
phase and their importance. That chapter describes the steps taken in determining the
performance characteristics of the hardware used and the efforts made to investigate the
concept of detecting the changes in soil moisture using soil-reflected wireless signals.
Chapter 4 presents the results of the steps taken during research design and
of the field experiments. Chapter 5 concludes the thesis and discusses the limitations and
implications of this research, and presents suggestions for future study and development.

Chapter 2: Literature Review Page 6
Muhammad Iqbal Dalel (n6459544) Page 6
Chapter 2: Literature Review
2.1 INTRODUCTION
This review contains five sections starting with this introduction. The next
part explains the basics of EM wave propagation and factors present in EM waves that
are applicable to this study. The third section describes the relationship between soil
dielectric properties and soil reflection coefficients. The fourth section describes how to
estimate soil moisture by detecting the changes in its dielectric properties. The next
section describes recent methods for measuring soil moisture, how they compare to the
method outlined in this thesis as well as their advantages and characteristics. A
conclusion ends the chapter.
This chapter explains the necessary theories that are the basis for the SREM
wave method. It also discusses current methods available on measuring soil moisture and
their characteristics. The EM wave-based method is one of the simplest ways to achieve
the goal of measuring soil moisture, but it is still in need of further study and
development to overcome its limitations.
2.2 RADIO WAVE PROPAGATION
2.2.1 Free Space
How an EM wave propagates through space can be explained with the Friis
equation for free space propagation [9]. This equation describes, in terms of received
power, the relationship when a transmitter at point A makes a transmission to a receiver
at point B with distance R between them. The equation indicates that a lower frequency
and higher antenna gain will improve transmission range.
(1)
Equation 1 [9] indicates that the received power ( ) will depend on the transmit
power ( ), the wavelength (λ) and the gains of the transmitting and receiving antennas
( , , respectively) in an ideal (free space) environment. Received power will decrease

Chapter 2: Literature Review Page 7
Muhammad Iqbal Dalel (n6459544) Page 7
over distance (Figure 1), although in real-world situations the decay rate is also affected
by reflection, diffraction, scattering due to obstacles and various atmospheric conditions
[9, 17-19].
Figure 1 Signal attenuation decay rate in free space from equation (1)
Larger wavelengths or lower frequency signals will produce a better
received-power decay rate compared to received power from higher frequency/smaller
wavelength signals. Higher antenna gain is also beneficial to received power, although
antenna size might be a constraint (see Figure 2).
Figure 2 5 dBi (bottom) and 2 dBi antennae for 2.4 GHz frequency
2.2.2 Ground Reflection Model
In application, a single direct path between the transceiver and the
receiver, as in the case of propagation in a free space, is unlikely. A ground reflection
two-ray model offers a more accurate representation than a free space propagation
model as the former takes into account both the direct path and reflection from the
ground (Figure 3). Within a line of sight (LOS) with minimum vegetation and a
relatively flat environment, such as a farm, signal reflection will most likely come
from the ground itself.

Chapter 2: Literature Review Page 8
Muhammad Iqbal Dalel (n6459544) Page 8
Figure 3 Ground reflection two-ray model [9]
Figure 3 [9] indicates that two propagating waves will arrive at the
receiver. The reflected wave will differ in its propagation path from the direct-path
wave. The LOS wave ( ) travels along the shortest possible path from the
transmitter to the receiver (Equation [2]). The ground wave ( travels at an angle of
incidence ) is then reflected off the ground before arriving at the receiver.
The angle of incidence ) depends on the height of transmitting and receiving
antennas. The reflected energy will depend on the Fresnel reflection coefficient ( Γ )
as shown in equation [3].
( )
( (
)) (2)
Direct-path wave E-field.
( ) Γ
( (
)) (3)
Reflected wave E-field.
The two waves differ in their paths, the LOS path (d ) and reflected path
(d). The equation in Equation 3 shows that Γ substantially influences the reflected
wave energy. As the reflected wave arrives at the receiver, it will cause constructive
Chapter 2: Literature Review Page 9
Muhammad Iqbal Dalel (n6459544) Page 9
and destructive interference to the LOS wave, depending on their phase and time
difference.
In other words direct path and ground reflection waves influence each
other. Equation 4 [20] is the propagation model for outdoor applications of WSNs
that combine the free space and ground reflection. The round reflection coefficient is
taken into account to calculate the ground reflection influence to the direct path/free
space waves.
(
)
(4)
The next section describes in more detail the effects of the reflection
coefficient.
2.2.3 Electrical Properties of Materials and the Fresnel Reflection Coefficient
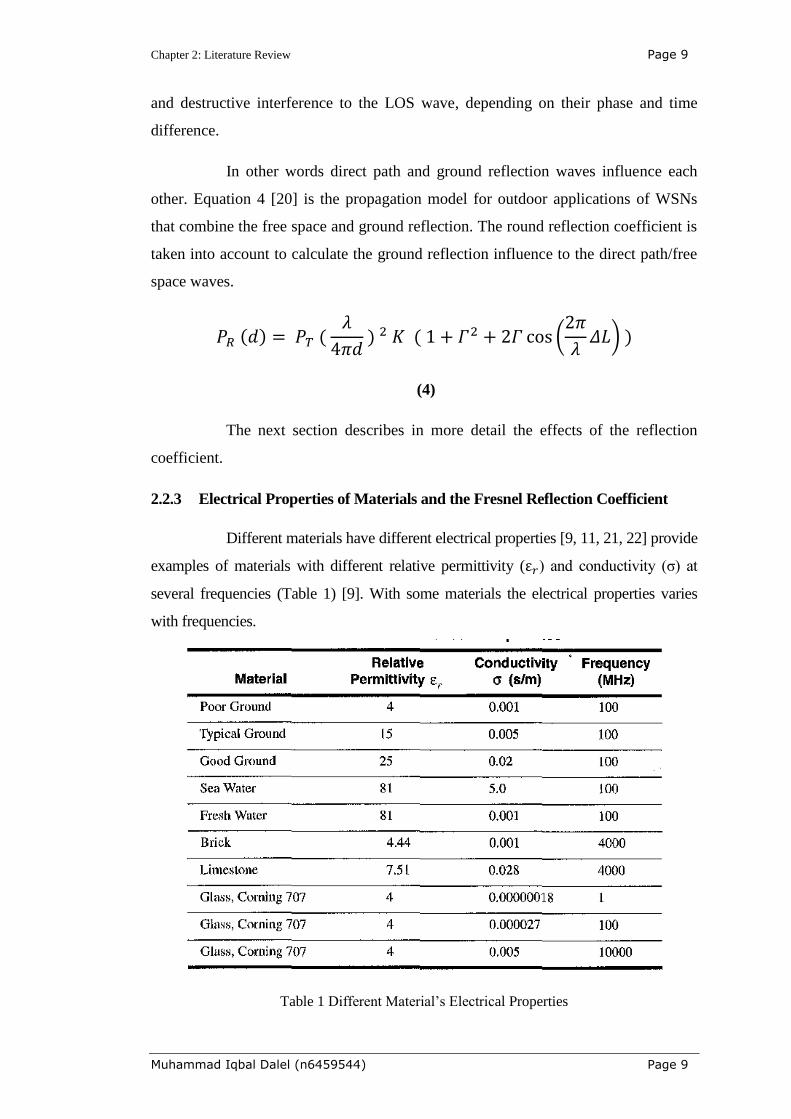
Different materials have different electrical properties [9, 11, 21, 22] provide
examples of materials with different relative permittivity ( ) and conductivity (σ) at
several frequencies (Table 1) [9]. With some materials the electrical properties varies
with frequencies.
Table 1 Different Material’s Electrical Properties

Chapter 2: Literature Review Page 10
Muhammad Iqbal Dalel (n6459544) Page 10
EM waves propagating from one medium into another that has a different
electrical property will have part of their energy reflected and another part
transmitted, depending on the dielectric properties of those mediums (Figure 4 [11]).
A perfect conductor will reflect all of the energy from the EM wave without any loss
[9].
Figure 4 Geometry for calculating reflection coefficient between two dielectrics [11]
Dielectrics behave differently from a perfect conductor. The amount of
energy reflected and transmitted is related to Γ, which is a function of the material’s
dielectric properties, the frequency and polarisation of the wave and the angle of
incidence [9, 11]. Figure 4 shows the geometry for calculating Γ between two
dielectrics at parallel polarisations (E-field in the plane of incidence). At a
perpendicular polarisation, the E-field will be in the opposite direction. The formulae
for Γ values for different antenna polarisations, parallel and perpendicular, are
presented in Equation 5 [9].
(5)
In equation 6, η is the intrinsic impedance of the medium, as shown in Equation 5.
η = √(μ/εi) (6)

Chapter 2: Literature Review Page 11
Muhammad Iqbal Dalel (n6459544) Page 11
Figure 5 [9] shows that changes in a medium’s relative permittivity ( )
will change the Γ value. The angle of incidence ) is also considered when
determining the Γ value (Figure 5). Antenna polarisation, parallel (vertical) and
perpendicular (horizontal), is important when deriving the value of Γ. Moreover,
there is a correlation between frequency and conductivity, although permittivity is
generally constant [23]
Figure 5 Fresnel reflection coefficients for = 4 and = 12 as a function of incidence angle
[9]
At two different relative permittivity values, two mediums will have two
different reflection coefficient values [9]. Figure 5 shows that to get a large
difference in Γ, an angle of incidence ) of more than approximately 40° is needed.
Thus, if we want to differentiate different values of Γ, the angle of incidence needs to
be as high as possible.

Chapter 2: Literature Review Page 12
Muhammad Iqbal Dalel (n6459544) Page 12
2.2.4 Incorporating Reflection Coefficient into Free Space Equation
In this research application, the energy from the direct-path wave is not to be
included. This can be achieved by using a directional antenna that is pointed towards the
ground at an appropriate angle of incidence. As a result, what would be received would
be the signal from the ground-reflected wave. In theory, the direct-path signal could be
completely eliminated; however, the Yagi directional antenna used here could only
reduce a portion of the direct-path signal.
The received signal can be calculated using a free space model that
includes the Fresnel reflection coefficient (equation 7) [11]. Fresnel reflection
coefficient is a function of materials dielectric properties and also angle of incidence,
polarisation and frequency [5, 8, 9, 12, 22, 24].
(7)
Equation 7 [11] is similar to the free space equation and includes
variables of transmit power ( ), wavelength (λ) and gains of transmitting and
receiving antennas ( , , respectively). Distances and are the total distances
travelled by the reflected wave as it is reflected from the medium. The final value of
received power depends on the Γ value of the medium.
2.3 RELATIONSHIP BETWEEN DIELECTRIC PROPERTIES OF SOIL
AND ITS REFLECTION COEFFICIENT
Studies have shown that soil moisture affects the dielectric properties of soil
(Figure 6) [10], and this relationship has been used to measure and estimate soil moisture
by others [10, 23, 25-29]. Curtis (2001) [10] used a coaxial transmission method to
gather data on the relationship between soil moisture and its dielectric properties and
concluded that there is a dependence of soil dielectric properties on its volumetric
moisture content.

Chapter 2: Literature Review Page 13
Muhammad Iqbal Dalel (n6459544) Page 13
Soil dielectric properties are also dependent on its composition and
characteristics [10, 23, 25, 26], such as its water holding capacity, salinity and organic or
metallic content. Therefore, calibration of the measurement method to the specific type
of soil is important in soil moisture measurement.
Figure 6 Relationship between soil moisture and its dielectric properties [10]
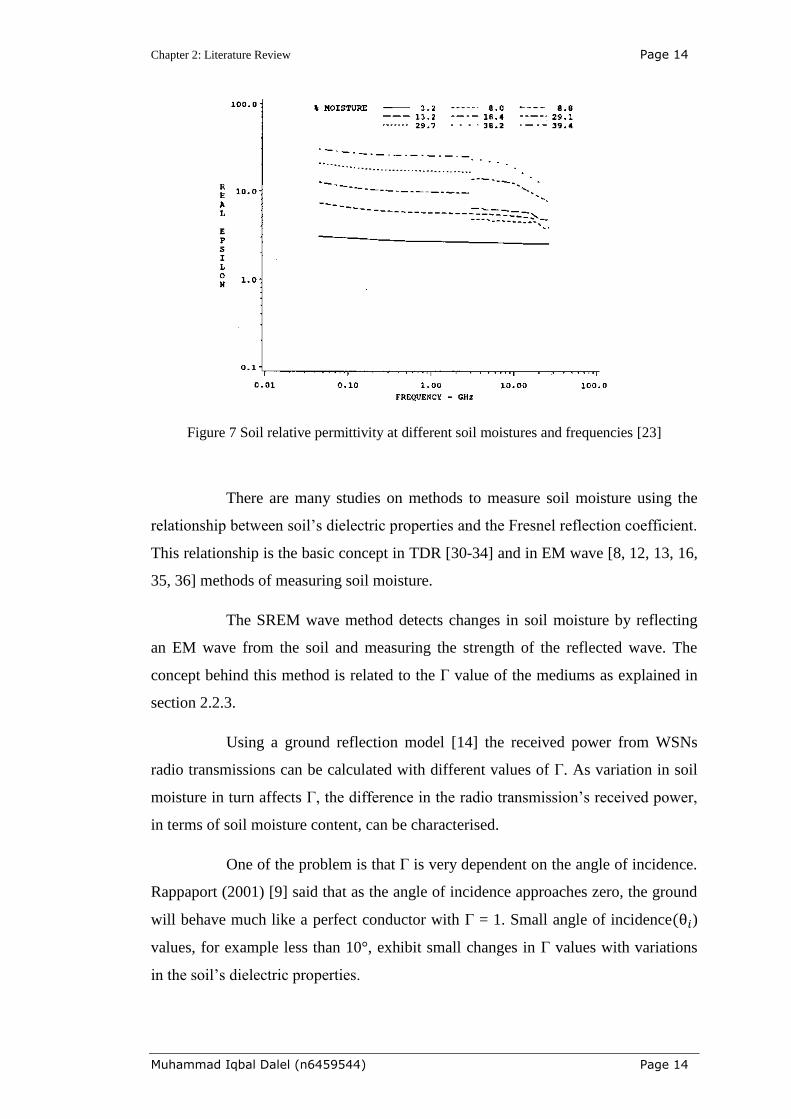
Radio wave frequency’s effects on a soil’s dielectric properties at a given
moisture content largely occur at very low or very high frequencies (Figure 7) [23]
and relatively constant at frequencies in the middle. although the soil’s type and
characteristics can alter this relationship, albeit a little [23].
Chapter 2: Literature Review Page 14
Muhammad Iqbal Dalel (n6459544) Page 14
Figure 7 Soil relative permittivity at different soil moistures and frequencies [23]
There are many studies on methods to measure soil moisture using the
relationship between soil’s dielectric properties and the Fresnel reflection coefficient.
This relationship is the basic concept in TDR [30-34] and in EM wave [8, 12, 13, 16,
35, 36] methods of measuring soil moisture.
The SREM wave method detects changes in soil moisture by reflecting
an EM wave from the soil and measuring the strength of the reflected wave. The
concept behind this method is related to the Γ value of the mediums as explained in
section 2.2.3.
Using a ground reflection model [14] the received power from WSNs
radio transmissions can be calculated with different values of Γ. As variation in soil
moisture in turn affects Γ, the difference in the radio transmission’s received power,
in terms of soil moisture content, can be characterised.
One of the problem is that Γ is very dependent on the angle of incidence.
Rappaport (2001) [9] said that as the angle of incidence approaches zero, the ground
will behave much like a perfect conductor with Γ = 1. Small angle of incidence )
values, for example less than 10°, exhibit small changes in Γ values with variations
in the soil’s dielectric properties.

Chapter 2: Literature Review Page 15
Muhammad Iqbal Dalel (n6459544) Page 15
This research proposes a method that includes a second transmitter
located close to (a distance of less than five metres) the main WSNs node in order to
achieve a high θ value (45°). The second transmitter’s purpose is only to transmit a
signal to the node. This angle is sufficient to achieve the highest possible
differentiation of Γ, as described in section 2.2.3. By recording the RSS values, the
relationship between them and different levels of soil moisture can be depicted.
2.4 RECENT STUDIES ON METHODS OF MEASURING SOIL
MOISTURE
Here, how soil moisture content is traditionally measured is defined.
There are basically two definitions for soil moisture content: gravimetric and
volumetric (Figure 15). Gravimetric soil moisture (Equation 8) is based on the ratio
between the water contained and the dry soil mass in that soil. Volumetric content
(Equation 9) is based on the ratio between the volume of water in a sample of soil
and the volume of both the soil and the contained water. Both are measured in per
cents (WMO, 2008).
(8) (9)
There are five common methods of measuring soil moisture content [5]:
1. Gravimetric direct measurement
This method directly measures the difference between the soil sample
before and after its water content is removed. The soil sample is removed from the
ground then placed in a container while carefully minimising disturbance to the soil.
The container and the soil are then weighted. The soil in the container is then dried in
an oven until the mass is stabilised at a constant value, indicating that there is no
remaining water content. The ratio between the mass before and after drying is the
gravimetric soil moisture content.
Chapter 2: Literature Review Page 16
Muhammad Iqbal Dalel (n6459544) Page 16
This method, while arguably accurate, presents several constraints. It is
invasive as the soil is disturbed and may be impractical. Oven temperature is crucial
since there are cases where the soil contains organic matter that burns during the
drying process, resulting in inaccurate measurements. As the soil’s capacity to hold
water might change when it is disturbed, this direct soil moisture measurement
method is not ideal in applications when soil disturbance is undesirable.
2. Indirect measurement—Radiological method
Two common radiological methods for measuring soil moisture content
utilise neutron scatter and gamma rays attenuation. The neutron scatter method
observes the interaction between high-energy (fast) neutrons and the hydrogen atoms
from the water content in the soil. The gamma ray method measures the attenuation
of gamma rays as they pass through the soil. These two methods have higher risk
since use radioactive materials and are usually only performed at specialised
laboratories or research facilities.
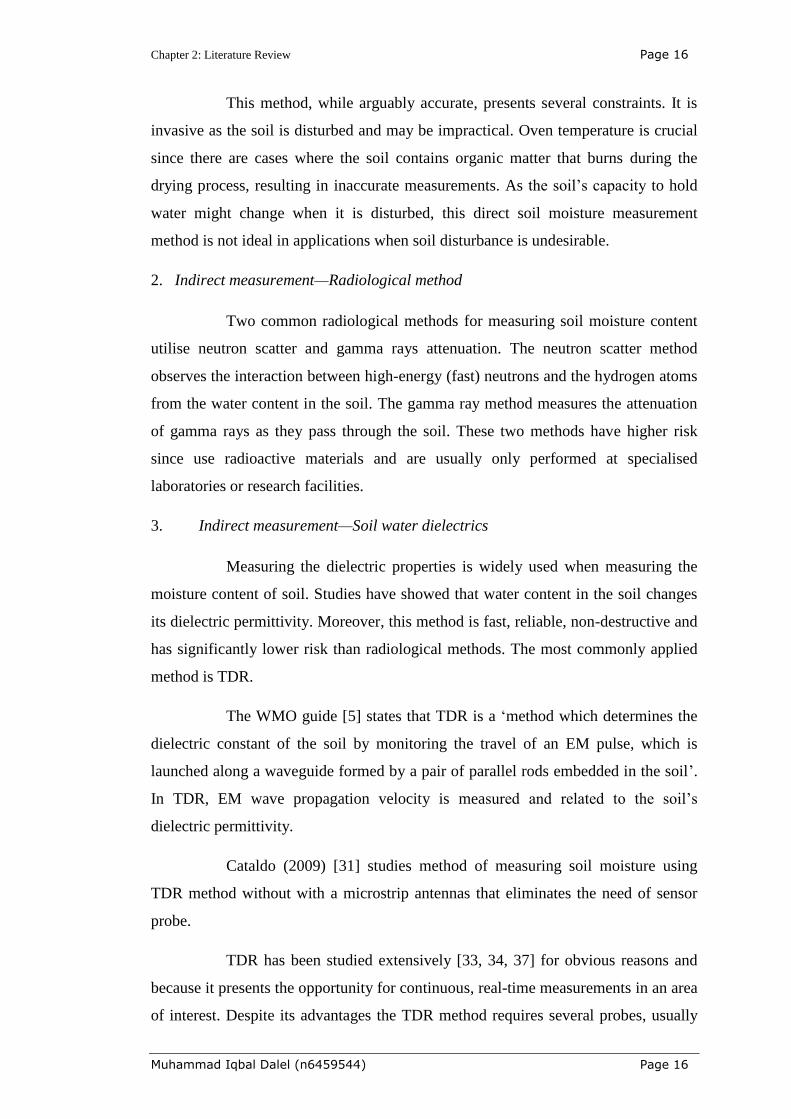
3. Indirect measurement—Soil water dielectrics
Measuring the dielectric properties is widely used when measuring the
moisture content of soil. Studies have showed that water content in the soil changes
its dielectric permittivity. Moreover, this method is fast, reliable, non-destructive and
has significantly lower risk than radiological methods. The most commonly applied
method is TDR.
The WMO guide [5] states that TDR is a ‘method which determines the
dielectric constant of the soil by monitoring the travel of an EM pulse, which is
launched along a waveguide formed by a pair of parallel rods embedded in the soil’.
In TDR, EM wave propagation velocity is measured and related to the soil’s
dielectric permittivity.
Cataldo (2009) [31] studies method of measuring soil moisture using
TDR method without with a microstrip antennas that eliminates the need of sensor
probe.
TDR has been studied extensively [33, 34, 37] for obvious reasons and
because it presents the opportunity for continuous, real-time measurements in an area
of interest. Despite its advantages the TDR method requires several probes, usually

Chapter 2: Literature Review Page 17
Muhammad Iqbal Dalel (n6459544) Page 17
ranging from 10–50 cm in length [5] to be placed undersoil. In addition, cables are
needed to connect the probes to the measurement sensor.
4. Indirect measurement—Soil water potential
Instruments used in this method measure the potential water in the soil
and return analogue readings unlike TDR readings that are measured electronically.
Tensiometers function in a manner similar to that of plant roots; usually the meters
include a porous container filled with water. If the water content in the ground
increases, water will seep into the tensiometers. Tensiometers tend to only work well
in wet soil and lose their accuracy in dry soil [5].
Electrical resistance blocks are used for dry soil environment. They
measure the relationship of water content in the soil and the soil’s electrical
resistance. Although relatively inexpensive, the blocks need to be calibrated
individually and routinely to produce a reliable measurement. Alkalinity in the soil
also decreases the accuracy of this method.
5. Indirect measurement—Remote sensing
When the area of measurement becomes too large to be practically
covered by other methods, a microwave method may be used [8, 12, 28, 36]. Using
the same principle as that in TDR, measurement is based on the dielectric properties
of the soil changing as its moisture content change. There are two methods of
sensing, passive (where satellites or airborne sensors monitor microwave emissions
from the earth) and active (where the measurement is taken from the satellite sent
signal). To cover wider area satellites [8, 13] and airborne platforms [16] have been
used.
This method is useful for measurement on broad geographic scales or to
assess inhomogeneous soil moisture content and to provide measurement from deep
soil layers. As it usually involves satellite and airborne platforms, this method is not
suitable for local measurement application and is associated with high costs.

Chapter 2: Literature Review Page 18
Muhammad Iqbal Dalel (n6459544) Page 18
Name Basic
Principal
Spot/
Continuous Price Picture
[38]Decagon
EC-5
&
EC-10
FDR/TDR Continuous
US$139
+
US850
(Data
Logger)
AquaSpy[39] Capacitan
ce Continuous N/A
Sentek
EnviroScan
[40]
TDR Continuous US$225
Spectrum
Watermark
6450
[41]
Resistance Continuous
US$35
(not
including
cable and
data
logger)
Vernier
[42]
TDR Continuous
US$95
(not
including
data
logger)

Chapter 2: Literature Review Page 19
Muhammad Iqbal Dalel (n6459544) Page 19
Stevens Hydra
Probe II
[43]
TDR Spot
US$395
Or
US$1995
w/ Data
Logger
Lutron
PMS714
[44]
FDR Spot AU$350
AquaPro
[45]
Capacitan
ce Spot
US$1034
w/logger
Table 2 Comparison between Several Commercially Available Soil Moisture Sensors
Table 2 lists several commercially available soil moisture sensors based
on their principal operation system, whether their capable of continuous monitoring,
and their prices. As best of the author’s knowledge current soil moisture sensing
solution still invasive to the soil as shown in table 2.
There are many soil-based factors that affect the accuracy and precision
of results from measuring soil moisture, especially affecting indirect or surrogate
methods of measurement [5]. These factors may include soil density, salinity,
temperature and metallic components of the soil. These sources of inaccuracy usually
can be reduced by calibrating the sensors for different types of soil. Moreover, the
water holding capacity of soil largely depends on its clay and sand content; clay
holds more water than sand [5].
Studies also show that some indirect methods work well on certain range
of soil moistures where others do not [5, 6]. It is advisable to investigate the type and

Chapter 2: Literature Review Page 20
Muhammad Iqbal Dalel (n6459544) Page 20
consistency of the soil to be measured to determine its water holding capacity and
then choose the appropriate method to measure its water content.
Other studies indicate that there have been efforts aimed at developing
non-invasive methods of measuring and estimating soil moisture with the majority
using EM waves [8, 12, 16] and TDR [31, 34].
2.5 SUMMARY
This review describes the factors involved in EM wave propagation that
are applicable to detecting changes in soil moisture. Changes in soil moisture content
will change the soil’s dielectric properties, which in turn will affect the soil’s Fresnel
reflection coefficient. By measuring differences in RSS in relation to variations in
Fresnel reflection coefficients, soil moisture can be estimated.
Using directional antenna that point ground-ward at an appropriate angle
of incidence, will minimise the energy from the direct-path EM wave. The received
signal will then consist largely of the ground-reflected wave. By using a free space
model, propagation that includes the Fresnel reflection coefficient will provide
different RSS values at different moisture levels.
There are many interesting and innovative studies in the field of soil
moisture measurement [11, 22, 23, 27, 30-33, 36, 37]. Adamo et al. [7, 46, 47]
studied the use of sound wave propagation for measuring soil moisture, although it
needed invasive probes for measurement.
The literature review indicates that although there are extensive studies in
the field of soil moisture measurement, there have not been reported non-invasive
methods based on WSNs radio wave propagation. The SREM wave method, with its
non-invasiveness and practical characteristics, provides significant advantages
compared to existing methods.

Chapter 3: Research Methodology Page 21
Muhammad Iqbal Dalel (n6459544) Page 21
Chapter 3: Research Methodology
3.1. INTRODUCTION
This chapter describes the methodology used and the research design
developed to achieve the research objectives discussed in Chapter 1. It also describes
in detail the configuration of the SREM wave method and the hardware that is
needed to implement it. This chapter also describes the three types of experiments
undertaken in this research.
3.2. EQUIPMENT
The research uses Waspmote wireless sensor nodes operating in the 2.4
GHz ISM frequency band with the IEEE 802.15.4 standard protocol (Figure 10)[48].
Waspmote nodes can operate independently as they are powered by rechargeable
batteries. Single node consisting of the electronic board, rechargeable battery,
transceiver (IEEE 802.15.4), and antenna cost US$150 at the time of purchase. The
gateway is connected to a laptop computer to access the measurement data. The
objective is to make two WSNs nodes communicate while the gateway monitors the
process. The transmitting node sends data to the receiving node where the RSS will
be recorded.
Figure 8 Waspmote wireless sensor node with omni-directional antenna.
Chapter 3: Research Methodology Page 22
Muhammad Iqbal Dalel (n6459544) Page 22
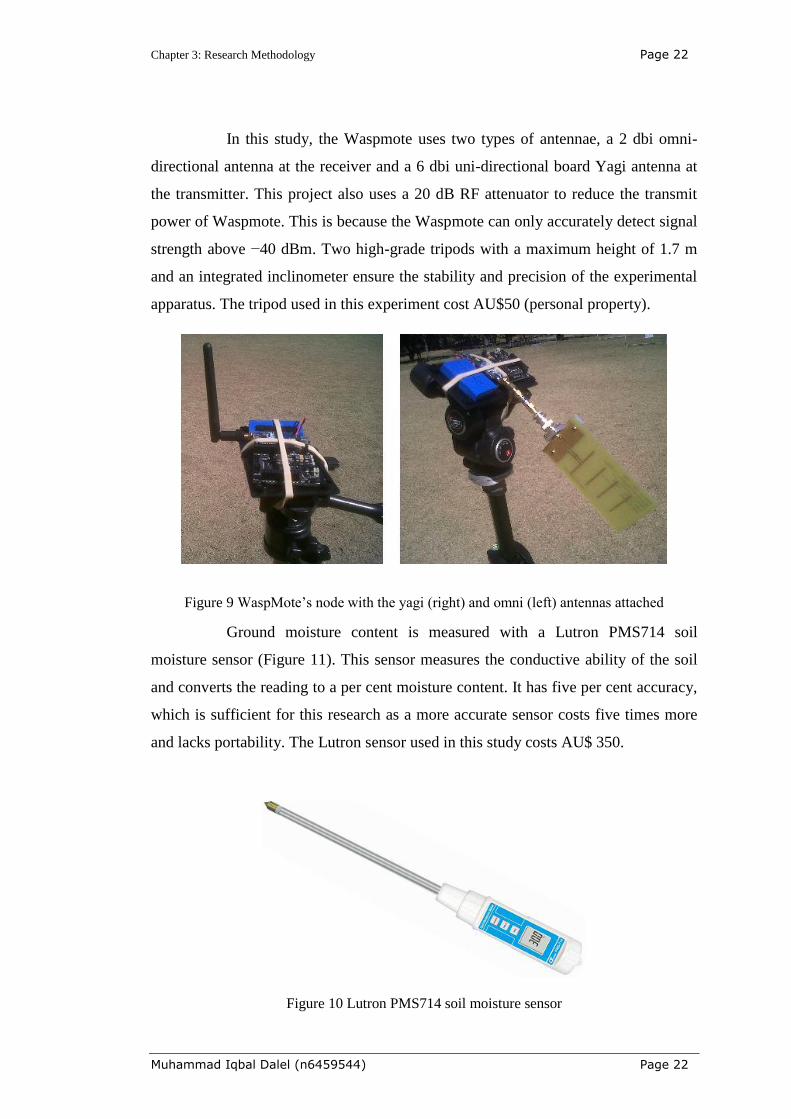
In this study, the Waspmote uses two types of antennae, a 2 dbi omni-
directional antenna at the receiver and a 6 dbi uni-directional board Yagi antenna at
the transmitter. This project also uses a 20 dB RF attenuator to reduce the transmit
power of Waspmote. This is because the Waspmote can only accurately detect signal
strength above −40 dBm. Two high-grade tripods with a maximum height of 1.7 m
and an integrated inclinometer ensure the stability and precision of the experimental
apparatus. The tripod used in this experiment cost AU$50 (personal property).
Figure 9 WaspMote’s node with the yagi (right) and omni (left) antennas attached
Ground moisture content is measured with a Lutron PMS714 soil
moisture sensor (Figure 11). This sensor measures the conductive ability of the soil
and converts the reading to a per cent moisture content. It has five per cent accuracy,
which is sufficient for this research as a more accurate sensor costs five times more
and lacks portability. The Lutron sensor used in this study costs AU$ 350.
Figure 10 Lutron PMS714 soil moisture sensor

Chapter 3: Research Methodology Page 23
Muhammad Iqbal Dalel (n6459544) Page 23
3.3 EXPERIMENTAL SET UP
Experiments were performed at three different locations in Brisbane,
Australia: one is a soccer field and the other two are public parks. The levelness of
the ground is determined by making sure that all three tripod legs are fully extended
and the inclinometer shows that both tripods are level. This is to make sure the angle
of incidence calculation is accurate.
ASRIS [49] indicates that the soil in each of these locations comprises
ten to twenty per cent clay. At each site, six individual spots representing six
different levels of soil moisture were examined. These six levels of soil moisture are
8, 10, 15, 18 and 20% according to the portable soil moisture. The different levels are
chosen to clearly differentiate the measurement results.
Figure 11 Three test sites at Brisbane, Queensland, Australia (Courtesy of Google Map)

Chapter 3: Research Methodology Page 24
Muhammad Iqbal Dalel (n6459544) Page 24
The objective of these field tests is to measure RSS and its relationship to
soil moisture content. The experimental set up consists of two nodes (transmitter and
receiver) mounted on a tripod at a height of 1.3 m and one gateway connected to the
laptop to record the measurements. The first node transmits data to the second node
and the receiving node sends confirmation signals and also forwards the RSS data to
a laptop computer connected via a gateway. The distance from each node to the
measurement location is 1.3 m, resulting in a 45° angle of incidence (Figure 14). This
angle is deemed the best angle since it provides the best direct-path signal attenuation
and the simplest configuration for this experimental set up; a higher angle means the
distance between the two nodes would be too close to each other.
Figure 12 ASRIS data on Australian surface soil texture [49]

Chapter 3: Research Methodology Page 25
Muhammad Iqbal Dalel (n6459544) Page 25
Figure 13 Experimental set up
The set up for all experiments is as follows:
a. The transmitter uses a Yagi directional antenna with a 20 dB RF
attenuator and the receiver uses an omni-directional antenna.
b. Both transmitter and receiver are placed on their respective tripod at a 1.3
m height.
c. The spot to be measured is located.
d. Distances from transmitter and receiver to the measured spot are 1.3 m,
achieving a 45° angle of incidence.
e. The transmitter antenna is angled 45° downward, to coincide with the
angle of incidence calculated from the antenna height and distance to the
measurement spot.
f. Tx node sends signal to Rx node
g. Rx node sends the measured RSS to Waspmote gateway connected to a
laptop. Software records these measurements and converts them to a
manageable text file.
h. RSS is measured 200 times and the average RSS value determined.
i. Soil moisture level is measured with the portable sensor
j. Repeat these steps at different locations or under different levels of soil
moisture.

Chapter 3: Research Methodology Page 26
Muhammad Iqbal Dalel (n6459544) Page 26
Figure 14 SREM wave method configuration.
Two hundred measurements were averaged because Waspmote’s sensitivity
is only 1 dBm according to the manufacturer’s specifications. Using this number of
individual measurements will increase the accuracy of each measurement average. A 45°
incidence angle is easy to set up because only the height of the antenna and its distance
to the measured spot need to be equalised.
Figure 15 WaspMote Gateway connected to a laptop
Soil
45° 45°
𝑇𝑥 (Yagi)
𝑅𝑥 (Omni)
1.3m 1.3m
1.3
m
1.3
m Measured
Spot

Chapter 3: Research Methodology Page 27
Muhammad Iqbal Dalel (n6459544) Page 27
3.4 EXPERIMENTS
3.4.1 Performance Characterisation of Waspmote and Antennas
Before the field experiment phase, detailed knowledge of the Waspmote and
other hardware used in this project is needed. This is necessary to verify the
manufacturer’s specifications. Knowing the exact gains, polarisations and transmission
lobes of the antennae is especially vital to ensure subsequent measures are as accurate as
possible since the method relies heavily on the angle of incidence and the radiation
patterns of the antennae. There are two works done in achieving this, one consist of the
transmission distance and attenuation by vegetation test and the other one is directly
relevant to the study in this thesis is the attenuation by angle test.
3.4.1. a. Transmission Distance and Attenuation by Vegetation
A study done with fellow student, Mr. Praditio Trenggono, investigates the
attenuations from different types of vegetation to Waspmote. Although this study is not
directly related to the research presented in this thesis, it is important to further
investigate the performance characterisation of Waspmote. This study consists of two
stages, transmission test and attenuation by vegetation test.
The purpose of transmission distance test is to verify the signal strength
decay rate as the distance between transmitter and receiver increases in a line of sight
(LOS) scenario. In this experiment received signal strength at distance 0, 12, 25, 50,
100, 200, 400 and 500 m is recorded; two different polarisations were used, vertical
and horizontal. To ensure accuracy 200 points of data from each measurement are
recorded and the result is then averaged.
This experiment will expect decrease in received signal strength as the
distance between transmitter and receiver increases. As there is LOS the primary
variable that affects the decrease in signal strength is free-space propagation.

Chapter 3: Research Methodology Page 28
Muhammad Iqbal Dalel (n6459544) Page 28
Figure 16 Three scenarios from left right and bottom, grass, bush, and forest
The next stage is the attenuation by foliage test (figure 15). The objective of
this experiment is to determine the attenuation to received signal strength from various
types of vegetation that obstruct the transmission between transmitter and receiver. The
experiment places the transmitter and receiver at 12 m with each types of vegetation
between them. The types of vegetation chosen are grass, tall grass, dense grass, bush and
forest/tall trees. Received signal strengths of each vegetation scenarios are compared to
the free space values at the same distance to figure their total attenuation.
3.4.1. b. Attenuation by Angle
The first step is a distance test to determine the Waspmote attenuation levels
at distances of three and five metres. The transmitter node uses a Yagi directional
antenna pointed directly at the receiver, which has an omni-directional antenna. One
hundred RSS values for each range are taken, and then averaged to obtain the final
values. The range test phase also tests the RF attenuators to determine their exact
attenuation. The procedure is similar and involves capturing each RSS value at five
metres and ten metres. The designated range is important to verify that each result is
consistent with other results.

Chapter 3: Research Methodology Page 29
Muhammad Iqbal Dalel (n6459544) Page 29
The next step is to verify the attenuation resulting from different angles of
the directional antenna by angling it at upward angles of 30°, 45°, and 60°, thereby
avoiding any signal reflection. As with the previous steps, measurements are taken at
five and ten metres to improve the consistency of the results. This phase is important as
it determine whether the captured RSS value when the antenna is pointed towards the
ground is from the soil-reflected wave.
3.4.2 Proving Concept and Field Measurements
Using the configuration shown in Figure 19, measurements are taken under
three different soil conditions: very dry, moist and very wet. The objective of this
experiment is to determine whether different soil moisture conditions will result in
different RSS readings. The soccer field at St. Lucia, Brisbane was selected for this
experiment because it has a large, flat unobstructed terrain.
After the previous steps have determined the validity of the concept of using
soil-reflected EM wave to detect changes in soil moisture, this step is undertaken to
derive a curve relating different soil moisture levels with obtained RSS values. This is
achieved by using the process of calibration [5] and recording different RSS values at
different soil moisture levels. This calibration method is required for different soil types
and compositions since reflected EM wave methods of detecting changes is soil moisture
are highly dependent on soil properties.
Eighteen spots were measured at three different locations in Brisbane to
provide the data needed for analysis. Because at each spots two hundred measurements
are taken, there are 3600 data points in total. Typical text file data size of this experiment
is approximately 50kb. after At the analysis each on two hundred measurements are
averaged into one value to increase accuracy because Waspmote can only record signal
strength in 1 dB steps.
3.5 SUMMARY
This chapter describes in detail the experimental approach used to detect
changes in soil moisture using WSNs signals and the methodology in assessing that
concept in a real life situation. The chapter starts by explaining the steps taken to acquire

Chapter 3: Research Methodology Page 30
Muhammad Iqbal Dalel (n6459544) Page 30
performance characterisation of the Waspmote sensor and other hardware used in this
project. It also presents the proposed method to calibrate the apparatus for use in
different soil types and composition.
All experiments in this research are conducted at an open field where there
are no unwanted signal reflections from the surroundings vegetation or objects. The
method of determining antenna radiation pattern explained in section 3.4.1.b usually
needs to be done in an anechoic chamber. But since there are no unwanted signal
reflection the research equipment did not detect any Wi-Fi signal at the test sites,
interference from other 2.4 GHz transmitting devices are minimal or non-existent. As
with other devices such as cordless phones, their range is limited and should not reach
the experiment location.
The next chapter presents the result obtained in each of the experiments
described in this chapter.

Chapter 4: Results Page 31
Muhammad Iqbal Dalel (n6459544) Page 31
Chapter 4: Results
4.1 INTRODUCTION
Chapter 4 presents the results of this research including field experiments
and the analysis that accompanies them. The field experiments are the main focus of this
study and consist of three parts:
1. Characterising hardware performance.
2. Developing a curve that depicts the relationship between soil moisture
and received signal strength.
3. Generating a polynomial function based on the data points taken from
field measurements.
4.2 TEST RESULTS
4.2.1 Transmission Distance and Attenuation by Vegetation
Range/ 1 m 12 m 25 m 50 m 100 m 200 m 400 m 500 m
Polarisation
Vertical
(dBm) −36 −44.4 −52.1 −54 −60.7 −66.7 −78.3 −89.9
Horizontal
(dBm) −36 −41.9 −44.1 −49.9 −55.1 −63.9 −75.4 −91.9
Difference 0 2.5 8 4 5.6 2.7 2.9 2
Figure 17 Transmission distance test results in dBm
As expected the signal strength decrease as the distance between
transmitter and receiver increases. By observing the decay rate from the graph we
can see the performance characteristic of this particular WSNs device. Although the
performance characteristic is specific to Waspmote, it could also give a guideline on
how a WSNs device performs in terms of relationship between range and signal
strength.

Chapter 4: Results Page 32
Muhammad Iqbal Dalel (n6459544) Page 32
Figure 18 Comparison between horizontal and vertical polarisation
We can immediately see in Figure 16 that horizontal polarisation exhibit
better performance than vertical polarisation. This is primarily because in vertical
polarisation the signal is more prone to interference from ground reflection than
horizontal polarisation. Ground reflection effect to signal strength diminishes as the
distances between transmitter and receiver increase. The effect happens as a result of
the angle of incidence between them approaches zero and the strength of the
reflected signal approaches the direct-path signal [50]. That is why as the distance
grew the different at signal strength between the two polarisations is getting smaller.
0 50 100 150 200 250 300 350 400 450 500-100
-90
-80
-70
-60
-50
-40
-30Signal Strenght at Various Distance and Different Polarization
Distance (m)
Sig
nal S
trength
(dB
m)
Horizontal Polarization
Vertical Polarization
0 50 100 150 200 250 300 350 400 450 5002.2
2.3
2.4
2.5
2.6
2.7
2.8
2.9Path Loss Exponent For Vertical Polarization
Distance (m)
Path
Loss E
xponent
Path Loss Exponent
PLE Trend Line
Chapter 4: Results Page 33
Muhammad Iqbal Dalel (n6459544) Page 33
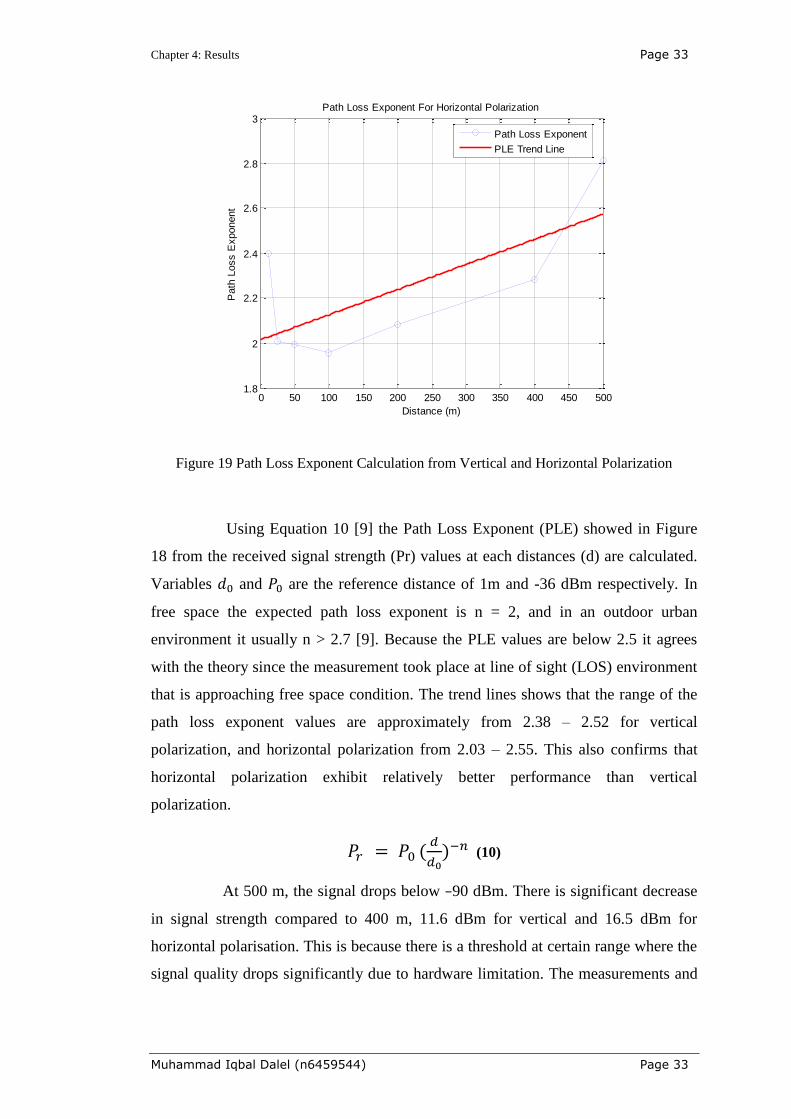
Figure 19 Path Loss Exponent Calculation from Vertical and Horizontal Polarization
Using Equation 10 [9] the Path Loss Exponent (PLE) showed in Figure
18 from the received signal strength (Pr) values at each distances (d) are calculated.
Variables and are the reference distance of 1m and -36 dBm respectively. In
free space the expected path loss exponent is n = 2, and in an outdoor urban
environment it usually n > 2.7 [9]. Because the PLE values are below 2.5 it agrees
with the theory since the measurement took place at line of sight (LOS) environment
that is approaching free space condition. The trend lines shows that the range of the
path loss exponent values are approximately from 2.38 – 2.52 for vertical
polarization, and horizontal polarization from 2.03 – 2.55. This also confirms that
horizontal polarization exhibit relatively better performance than vertical
polarization.
(10)
At 500 m, the signal drops below −90 dBm. There is significant decrease
in signal strength compared to 400 m, 11.6 dBm for vertical and 16.5 dBm for
horizontal polarisation. This is because there is a threshold at certain range where the
signal quality drops significantly due to hardware limitation. The measurements and
0 50 100 150 200 250 300 350 400 450 5001.8
2
2.2
2.4
2.6
2.8
3Path Loss Exponent For Horizontal Polarization
Distance (m)
Path
Loss E
xponent
Path Loss Exponent
PLE Trend Line

Chapter 4: Results Page 34
Muhammad Iqbal Dalel (n6459544) Page 34
path loss exponent calculation shows the performance characteristic of WaspMote
WSNs node in a Line of Sight outdoor environment.
Foliage/
Polarisation Free Grass
Tall
Grass
Dense
Grass Bush Forest
Vertical −44.4 −49.5 −49.6 −56.7 −69.3 −65.3
Horizontal −41.9 −46.5 −46.7 N/A −59.2 −58.5
Diff. Vert. 5.1 5.2 12.3 24.9 20.9
Diff. Hor. 4.6 4.8 N/A 17.3 16.6
Table 3 Waspmote’s Signal Strength Attenuation Because of Foliage
Obstruction in the form of vegetation between the transmission paths will
introduce attenuation in signal strength. We have to consider the wavelength of the
frequency we are using in this experiment, 2.4 GHz has 12.5 cm wavelength. If the
wave confronts obstacles smaller than its length, it could scatters. When it confronts
obstacles larger, it could reflect. Both of these phenomena contribute to signal
attenuation. [50]
As with the transmission distance test, horizontal polarisation exhibit
better performance than vertical polarisation. Bush scenario even shows more than
10 dBm difference. One of the factors is in foliage condition primary obstructions are
vertical tree trunks and branches of which the length is equal or larger than the 2.4
GHz frequency wavelength (12.5 cm) [50, 51]. This is why horizontal polarisation
fared better than vertical polarisation. Furthermore, when the vegetation is much
denser, the attenuation becomes higher. The branches and leaves of the bush are
simply too dense compared with the forest scenario [52].
When compared to result in transmission distance test, at 12 m LOS
condition the present of vegetation could contribute to attenuation as low as 5 dBm
and as high as 15 dBm. The presents of vegetation could contribute significant
amount of attenuation to signal strength and in turns cause severe decrease in
transmission distance. Just 12 m transmission distance at forest scenario for example
exhibit decrease in signal strength almost the same as 200 m LOS.

Chapter 4: Results Page 35
Muhammad Iqbal Dalel (n6459544) Page 35
4.2.2 Attenuation by Angle
The objective of this part of the study is to determine the performance of the
hardware used in the experiments. Signal strength is recorded at distances of five and ten
metres, both with and without an RF attenuator. Rather than perform tests at one
distance, tests at two different distances are done to help confirm the results. As
described in Chapter 3, the RF attenuator is vital because Waspmote is only accurate in
detecting signal strength at levels above 40 dBm and has maximum sensitivity of 36
dBm. Therefore, a 20 dBm attenuator is used to reduce the signal strength below 40
dBm to ensure detection accuracy.
Determination of the attenuation caused by the directionality of the Yagi
antenna is also required. By knowing the Yagi antenna’s radiation pattern it is possible to
determine the best angle of incidence for the next step. This pattern is obtained by
pointing the Yagi antenna upward at three different angles, 30°, 45° and 60° and then
recording the RSS (Table 3). The angle with the highest attenuation is then chosen as the
angle of incidence.
Angle RSSI Without Attenuator (dBm) RSSI With Attenuator (dBm)
5 m 10 m 5 m 10 m
0° −36 −36 −53 −55
30° −37 −41 −57 −61
45° −46 −48 −65 −67
60° −42 −45 −62 −64
Table 4 Hardware Performance Characterisation Results
The results in Table 3 show that, in the absence of an attenuator, even at 5 m
distance the signal strength is too high to be detected accurately by Waspmote.
Considering that measurement of soil moisture is done at distances of less than three
metres to achieve sufficient angle of incident the use of an attenuator is necessary. The
difference in signal strength between five and ten metres is 2 dBm. The attenuator
decreases the signal strength by approximately 20 dBm as its specification stated.
With the 0° angle value used as a reference, we conclude that a 30° angle
gives 4 dBm attenuation, 45° angle gives 12 dBm attenuation and 60° angle gives 9 dBm

Chapter 4: Results Page 36
Muhammad Iqbal Dalel (n6459544) Page 36
total attenuation. Therefore, the angle of incidence for subsequent experiments in this
research will be 45°, as it provides the highest attenuation to the direct-path signal.
This approach is a simple yet reliable method of determining the radiation
pattern of an antenna. More precise methods require an anechoic chamber to eliminate
signal reflections that might interfere with the test results. Here, since the antenna
characterisation test is done in an empty, open field location and as the antenna in
pointed up to the sky, there will be no interference from unwanted reflected signals.
4.2.3 Field Experiments
In this step, the concept that using soil-reflected electromagnetic waves
emanating from a WSNs node to differentiate levels of soil moisture value is tested.
Studies have shown that different values of soil moisture will affect the reflection
coefficient of the soil; thereby affecting the amount of energy from electromagnetic
waves that are be reflected from it. The experiments also provide a fundamental
configuration for subsequent test of hardware, positioning, programming code and the
overall methodology.
To successfully prove the concept, the received signal strength from three
different soil conditions (wet, moist and dry) should be differentiable. Chapter 2
describes reports showing that higher soil moisture levels produce higher soil reflection
coefficients and, as a result, better levels of RSS; the opposite is also true.
Figure 20 Theoretical relationship between RSS and reflection coefficient
0.1 0.2 0.3 0.4 0.5 0.6 0.7 0.8 0.9 1-52
-50
-48
-46
-44
-42
-40
-38
-36
-34
-32
-30
Reflection Coefficient
Receiv
ed S
Ignal S
trength
(dB
m)
Relationship Between RSS and Reflection Coefficient

Chapter 4: Results Page 37
Muhammad Iqbal Dalel (n6459544) Page 37
The graph in Figure 19, derived from equation [7] with reflection coefficient
values from 0.1 to 1, depicts the theoretical relationship between the reflection
coefficient of a surface and the signal strength reflected from that surface. It shows a
non-linear curve with increasing steepness as the reflection coefficient decreases. Higher
soil moisture values produce higher reflection coefficients and hence higher signal
strength values. Moreover, differences in signal strengths are higher at lower reflection
coefficient values. In this research, those relationships mean that the differences in signal
strength at higher values of soil moisture are smaller than the signal strength differences
at lower values of soil moisture.
Table 4 shows the measurements of received signal strength at three
different soil conditions: wet, moist and dry. The soils were measured under the driest
and wettest conditions possible and the soil moisture measurements are taken with the
portable soil moisture sensor. It should be noted that the probe of the sensor cannot
penetrate the hard dry soil; therefore, the dry soil moisture measurement could not be
obtained; even measuring moisture levels in moderately moist soil is difficult with that
portable sensor. This shows one of the advantages of developing a non-invasive method
of measuring soil moisture, a method in which no probe and no soil penetration is
required.
Dry Moist Wet
RSS (dBm) −55.1 −52.7 −49.3
Moisture (%) N/A 10.2 20
Table 4 Received Signal Strength at Different Soil Conditions
The results show that differentiation of those three soil moisture conditions
in terms of RSS reflected from the soil is possible. The signal strength is higher under
wetter conditions and lower under drier soil conditions. These results agree with the
theory of reflection coefficient that higher soil moisture values have higher reflection
coefficient and therefore will reflect more electromagnetic wave energy.

Chapter 4: Results Page 38
Muhammad Iqbal Dalel (n6459544) Page 38
Table 6 presents soil moisture and their corresponding reflection
coefficient (εr) values from [23] for soil classified as silty sand containing 14% clay,
77% sand and 9% silt. That soil is chosen because it is similar to the test site’s soil
type (10–20% clay per ASRIS [49]). Using equation [7], the expected RSS values for
each soil moisture level can be calculated (Table 4).
εr Moisture (%) RSS
4 8 −42.0209
6.5 13.2 −39.2932
9 18.4 −37.9154
14 29.1 −36.0604
Table 5 Theoretical Signal Strength Values for 10–20% Clay Soil
Figure 21 RSS values based on reflection coefficients from Table 4 (εr = 4 – 14)
5 10 15 20 25 30
-42
-41
-40
-39
-38
-37
-36
Soil Moisture (%)
RS
S (
dB
m)
Relationship Between Soil Moisture and Signal Strength for Soil Containing 14% Clay

Chapter 4: Results Page 39
Muhammad Iqbal Dalel (n6459544) Page 39
Table 6 shows that for soil moisture levels of 8–29%, the corresponding
relative permittivity values are εr = 4–14. The reflection coefficient can be
calculated from equation [5] and, based on those values, the relationship between the
signal strength and soil moisture value can be plotted using equation [7] (Figure 20).
This graph agrees with the results from the field measurement data obtained using
the SREM method.
The data from Table 6 and Figure 20 are from a study by Curtis (1995)
[23]. That study measured the electrical properties of different types of soil using an
FDR method. That study’s results are chosen as a reference because they represent
the closest soil type to the one used for measurement in this research. The results
confirm that further research into the development of a new method of measuring
soil moisture is needed, especially with regard to different types of soil.
Chapter 4: Results Page 40
Muhammad Iqbal Dalel (n6459544) Page 40
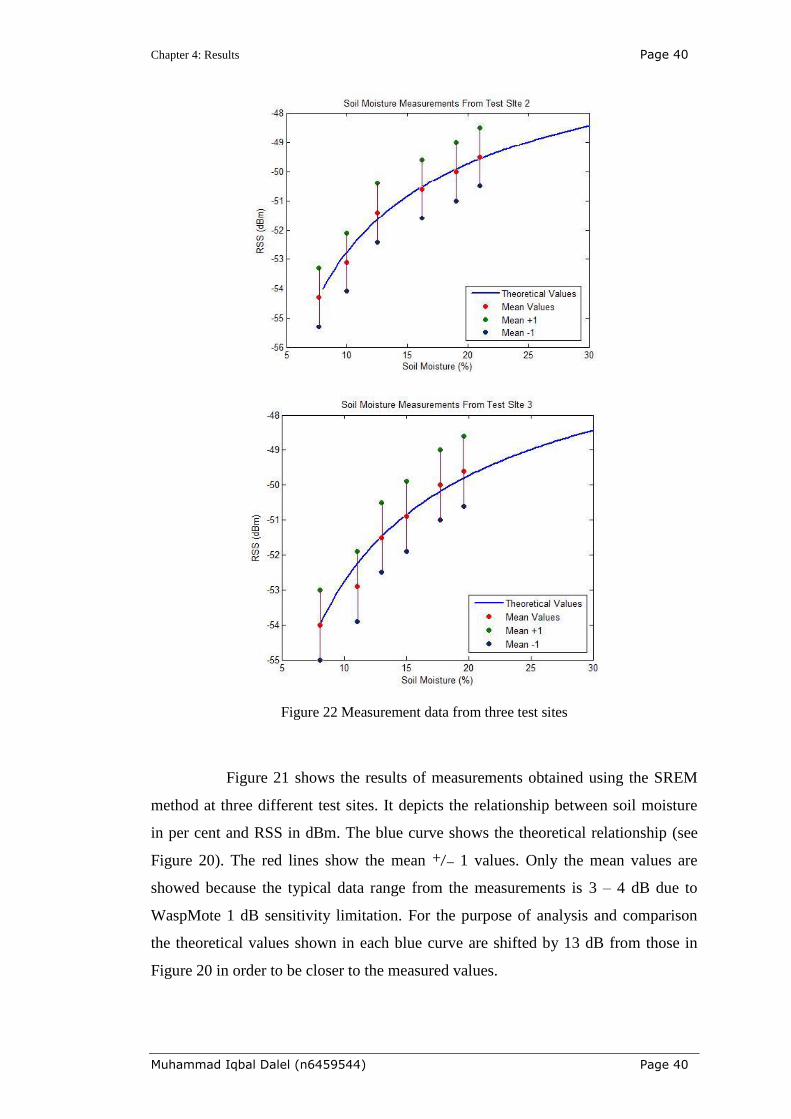
Figure 22 Measurement data from three test sites
Figure 21 shows the results of measurements obtained using the SREM
method at three different test sites. It depicts the relationship between soil moisture
in per cent and RSS in dBm. The blue curve shows the theoretical relationship (see
Figure 20). The red lines show the mean ⁄ 1 values. Only the mean values are
showed because the typical data range from the measurements is 3 – 4 dB due to
WaspMote 1 dB sensitivity limitation. For the purpose of analysis and comparison
the theoretical values shown in each blue curve are shifted by 13 dB from those in
Figure 20 in order to be closer to the measured values.
Chapter 4: Results Page 41
Muhammad Iqbal Dalel (n6459544) Page 41
As the measurements use a 20 dBm RF attenuator and as the direct-path
wave cannot be completely eliminated, a gap between the two results is expected.
The shifting process does not compromise the analysis as it is just used to show how
the trends compare. Regardless, the two results follow the same trend and agree with
each other.
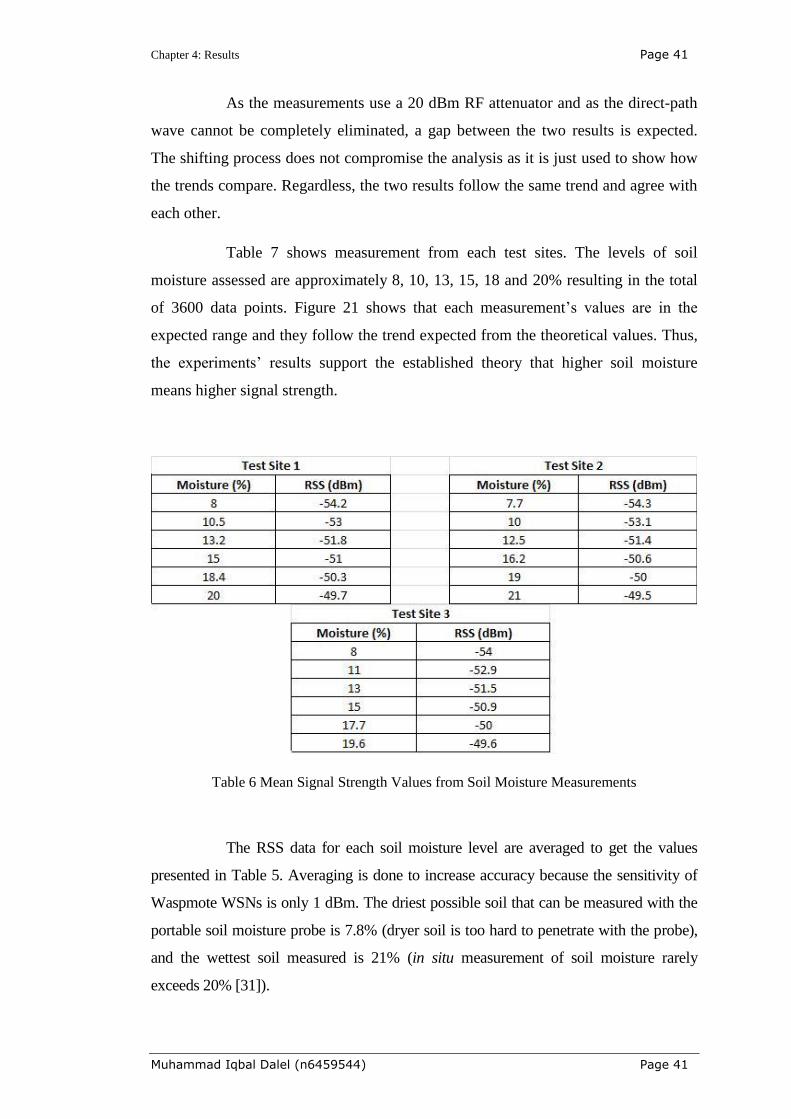
Table 7 shows measurement from each test sites. The levels of soil
moisture assessed are approximately 8, 10, 13, 15, 18 and 20% resulting in the total
of 3600 data points. Figure 21 shows that each measurement’s values are in the
expected range and they follow the trend expected from the theoretical values. Thus,
the experiments’ results support the established theory that higher soil moisture
means higher signal strength.
Table 6 Mean Signal Strength Values from Soil Moisture Measurements
The RSS data for each soil moisture level are averaged to get the values
presented in Table 5. Averaging is done to increase accuracy because the sensitivity of
Waspmote WSNs is only 1 dBm. The driest possible soil that can be measured with the
portable soil moisture probe is 7.8% (dryer soil is too hard to penetrate with the probe),
and the wettest soil measured is 21% (in situ measurement of soil moisture rarely
exceeds 20% [31]).
Chapter 4: Results Page 42
Muhammad Iqbal Dalel (n6459544) Page 42
As explained in chapter 3.3, the Lutron soil moisture sensor measurements
are used as the benchmark in the experiments. Therefore the results shown in the thesis
are from the Lutron sensor. These results then compared with the theoretical calculation
from references.
The signal strength range from the 7.8–21% soil moisture data is 4.4 dBm;
the theoretical signal strength for a 8–29% range is 6 dBm. This RSS difference is
because the experimental set up cannot completely eliminate the direct-path signal
received, therefore affecting the soil-reflected signal. However, the experiments showed
clear separation of RSS between the highest and lowest soil moisture levels; supporting
the theoretical data.
The difference between signal strengths is larger at low soil moisture than at
high soil moisture. There is a clear 1 dBm difference between 8% and 10% compared to
a difference of 0.3 dBm between 18.4% and 20% soil moisture. This agrees with
previous studies [24, 31].
Although the accuracy of the measurements is consistent when recording
relatively similar values at each determined values (8, 10, 13, 15, 18 and 20%), its
precision suggests the need for improvement; especially at higher soil moisture levels
where the signal strength difference is relatively small. This lack of precision is largely
due to the sensitivity of the hardware itself and not due to the method as the theoretical
values in Figure 19 show that this is the case with soil moisture measurement method
that utilise soil relative permittivity values [5, 30].

Chapter 4: Results Page 43
Muhammad Iqbal Dalel (n6459544) Page 43
Figure 23 Comparison between a fourth degree polynomial curve for measured data and
theoretical values with RSS measured as dBm
Figure 22 shows a plot of 18 mean values obtained from 3600
measurements. It shows the relationship between RSS in dBm and soil moisture. The red
curve is for the theoretical reference values from Figure 19 that are shifted 13 dBm for
the purpose of comparison and analysis. The green triangles are for each of the 18
measurement mean values and the blue curve is a fourth degree polynomial curve fitting
of those data. Figure 20 show that the fourth order polynomial curve trend closely
matches the theoretical curve, especially in the 11–13% soil moisture range and only
shows large differences from the theoretical at 8–10% soil moisture. There is a relatively
small error in the measurement at 8% moisture. A possible reason to explain this is that
the reference and measured soil types and relative permittivity values are not exactly a
match. The error shows more here because the influence of the relative permittivity to
the reflection coefficient is more pronounced at lower soil moisture values compared to
higher values.
The measurements values consisted of the direct path reflected path signals
that influence each other depending on their phase and time arrived. Reflected wave
signals arrive after the direct path signals as it travel at a longer path. As in this
experiment the direct path wave signals cannot be completely eliminated it influence the
reflected signals as explained in section 2.2.2. Equation 7 only calculates the pure
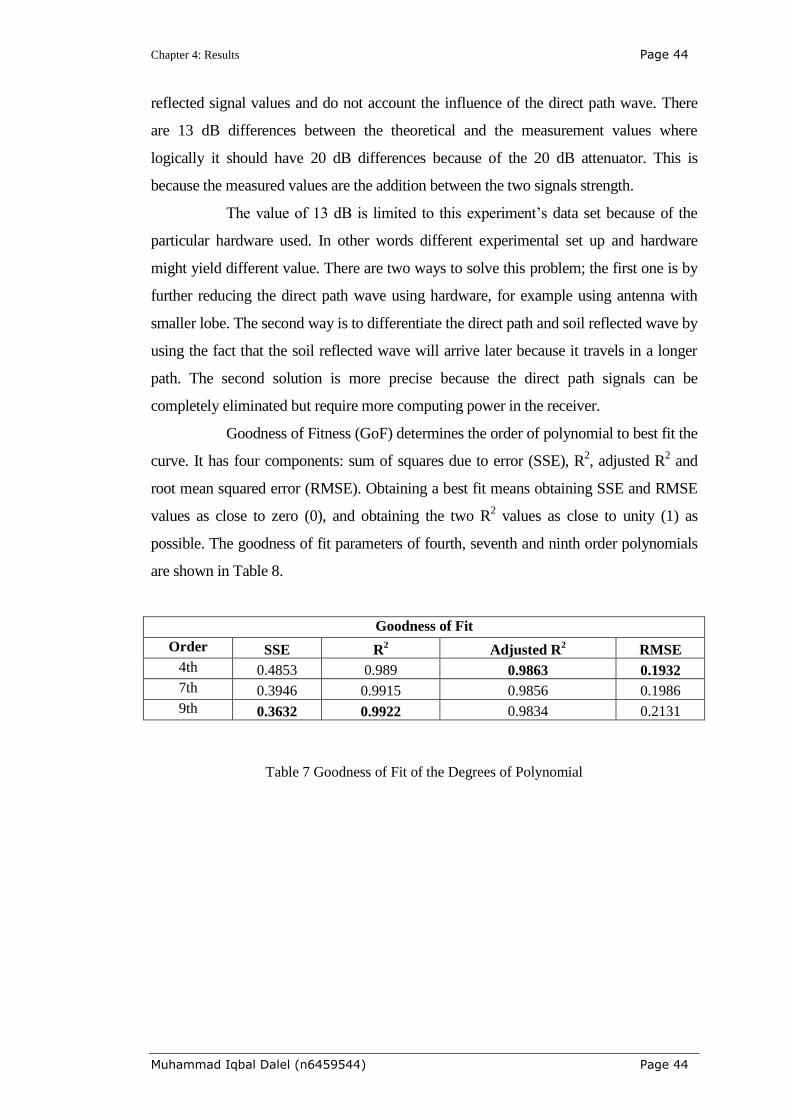
Chapter 4: Results Page 44
Muhammad Iqbal Dalel (n6459544) Page 44
reflected signal values and do not account the influence of the direct path wave. There
are 13 dB differences between the theoretical and the measurement values where
logically it should have 20 dB differences because of the 20 dB attenuator. This is
because the measured values are the addition between the two signals strength.
The value of 13 dB is limited to this experiment’s data set because of the
particular hardware used. In other words different experimental set up and hardware
might yield different value. There are two ways to solve this problem; the first one is by
further reducing the direct path wave using hardware, for example using antenna with
smaller lobe. The second way is to differentiate the direct path and soil reflected wave by
using the fact that the soil reflected wave will arrive later because it travels in a longer
path. The second solution is more precise because the direct path signals can be
completely eliminated but require more computing power in the receiver.
Goodness of Fitness (GoF) determines the order of polynomial to best fit the
curve. It has four components: sum of squares due to error (SSE), R2, adjusted R
2 and
root mean squared error (RMSE). Obtaining a best fit means obtaining SSE and RMSE
values as close to zero (0), and obtaining the two R2 values as close to unity (1) as
possible. The goodness of fit parameters of fourth, seventh and ninth order polynomials
are shown in Table 8.
Goodness of Fit
Order SSE R2 Adjusted R
2 RMSE
4th 0.4853 0.989 0.9863 0.1932
7th 0.3946 0.9915 0.9856 0.1986
9th 0.3632 0.9922 0.9834 0.2131
Table 7 Goodness of Fit of the Degrees of Polynomial

Chapter 4: Results Page 45
Muhammad Iqbal Dalel (n6459544) Page 45
Figure 24 Seventh and ninth degree polynomial curve of measured data and theoretical
values
8 10 12 14 16 18 20 22-56
-55
-54
-53
-52
-51
-50
-49
Soil Moisture (%)
RS
S (
dB
m)
7th Degree Polynomial Curve
Theoritical Value
Measurement Data
7th degree
8 10 12 14 16 18 20 22-56
-55
-54
-53
-52
-51
-50
-49
Soil Moisture (%)
RS
S (
dB
m)
9th Degree Polynomial Curve
Theoritical Value
Measurement Data
9th degree
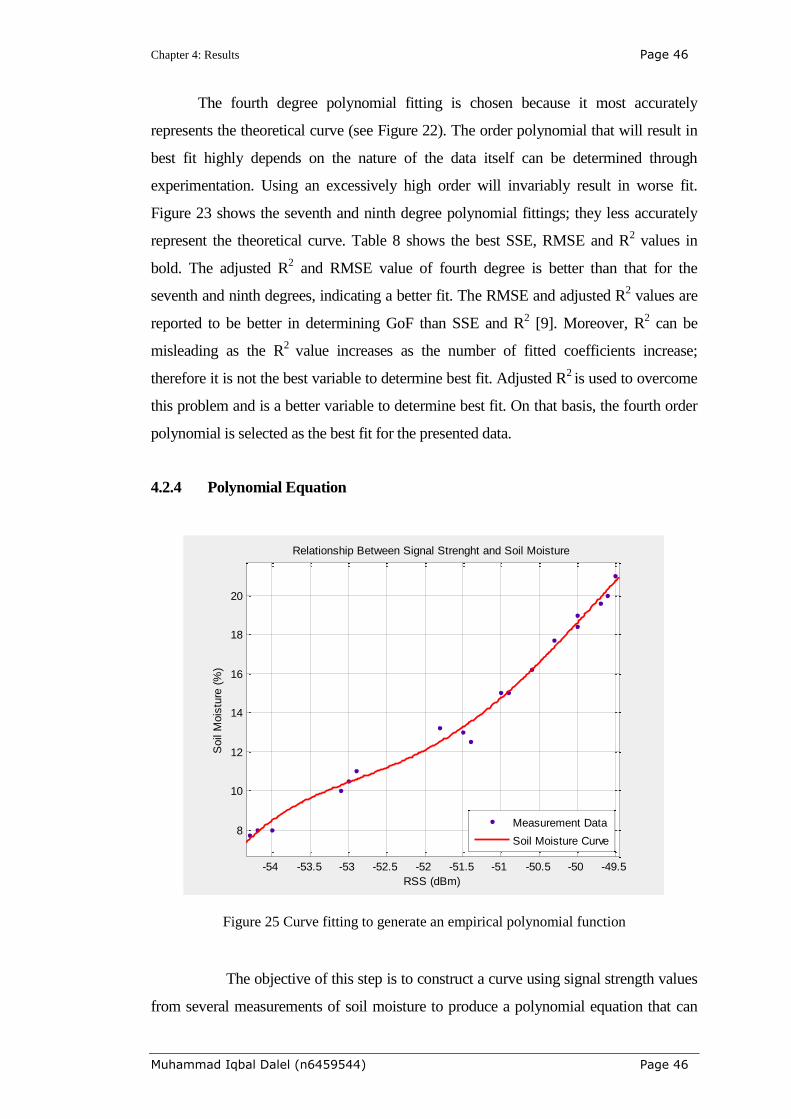
Chapter 4: Results Page 46
Muhammad Iqbal Dalel (n6459544) Page 46
The fourth degree polynomial fitting is chosen because it most accurately
represents the theoretical curve (see Figure 22). The order polynomial that will result in
best fit highly depends on the nature of the data itself can be determined through
experimentation. Using an excessively high order will invariably result in worse fit.
Figure 23 shows the seventh and ninth degree polynomial fittings; they less accurately
represent the theoretical curve. Table 8 shows the best SSE, RMSE and R2 values in
bold. The adjusted R2 and RMSE value of fourth degree is better than that for the
seventh and ninth degrees, indicating a better fit. The RMSE and adjusted R2 values are
reported to be better in determining GoF than SSE and R2 [9]. Moreover, R
2 can be
misleading as the R2
value increases as the number of fitted coefficients increase;
therefore it is not the best variable to determine best fit. Adjusted R2 is used to overcome
this problem and is a better variable to determine best fit. On that basis, the fourth order
polynomial is selected as the best fit for the presented data.
4.2.4 Polynomial Equation
Figure 25 Curve fitting to generate an empirical polynomial function
The objective of this step is to construct a curve using signal strength values
from several measurements of soil moisture to produce a polynomial equation that can
-54 -53.5 -53 -52.5 -52 -51.5 -51 -50.5 -50 -49.5
8
10
12
14
16
18
20
RSS (dBm)
Soil
Mois
ture
(%
)
Relationship Between Signal Strenght and Soil Moisture
Measurement Data
Soil Moisture Curve

Chapter 4: Results Page 47
Muhammad Iqbal Dalel (n6459544) Page 47
be used to accurately estimate values of soil moisture from recorded signal strength. For
that purpose, derivation of an equation for values of soil moistures from measured signal
strength is needed. To that end, the x and y axes from the fourth order polynomial curve
are reversed so that the y values (soil moisture in per cent) can be predicted as the
function of the x values (RSS). The GoF data for the reversed curve indicates that the
fourth order polynomial provides a best fit (Table 9). The curve fitting and calculation
are done by MatLab software.
Goodness of Fit
SSE R2 Adjusted R
2 RMSE
0.2767 0.9917 0.9891 0.4614
Table 8 Goodness of Fit of the Fourth Degree Polynomial Curve
The fourth order polynomial curve is similar to the one depicting the
theoretical relationship between signal strength and reflection coefficient (see Figure x).
This further indicates that it is the best fit to represents the relationship between soil
moisture levels and received signal strengths.
Equation 11 is the fourth order polynomial equation used to estimate soil
moisture values from RSS values. By substituting obtained RSS values (in dBm) for the
x values in equation, the corresponding values of soil moisture (in per cent) can be
calculated.
(11)
4.3 SUMMARY
The first conclusion from the experiments results is that the concept of
estimating soil moisture using soil-reflected signals from wireless sensor networks is
viable. When subjected to three different soil conditions (wet, moist and dry), three
different signal strength levels were obtained, agreeing with the results expected from a
theory based on reflection coefficients.

Chapter 4: Results Page 48
Muhammad Iqbal Dalel (n6459544) Page 48
These experiments obtained 3600 signal strength measurements at different
soil moisture values and those are compared with measurements from a Lutron portable
soil moisture sensor. Using these data points other values were interpolated to construct a
curve representing the relationship between the recorded signal strengths and the
measured soil moistures.
A fourth degree polynomial curve agrees with the theoretical relationship
between signal strengths and reflection coefficients. The polynomial has a similar
steepness that increases as the soil becomes dryer or the reflection coefficient smaller.
The differences between signal strength values increase as the soil moisture values
decrease. This means that estimating soil moisture becomes more precise in dryer soil.
An empirical equation to estimate soil moisture from measured signal
strength is derived using the fourth degree polynomial curve. Although this equation and
the results in this chapter are for a specific hardware and set up and for the soil type used
in this research, the results indicate that a methodology and set up that utilises the
telecommunication signal of a WSNs node can detect changes in soil moisture. This
approach can for the basis for further studies and development.
Chapter 5: Conclusions Page 49
Muhammad Iqbal Dalel (n6459544) Page 49
Chapter 5: Conclusions
There are various soil moisture measurement methods available today,
including those based on TDR, FDR, EM wave, acoustic and radiological concepts.
Studies have been conducted into developing new methods of measurement using one or
several of those concepts. This research’s objective is to assess the concept of developing
an innovative method of detecting changes in soil moisture by using the
telecommunication signals of WSNs.
The SREM wave method utilises the strength of soil-reflected signals to
differentiate different levels of soil moisture. By using wireless signals and a simple
transmitter adjacent to WSNs nodes, an SREM wave method would be non-invasive,
simple to set up and low cost. The SREM wave method works on the principle that
different levels of soil moisture will affect the electrical properties of the soil and,
therefore, change its reflection coefficient based on angle of incidence. Higher reflection
coefficient means more energy that will be reflected back from the soil, hence higher
signal strength.
In the one year research timeline in this study, the methodology chosen to
achieve the research objective involved field experiments using Waspmote WSNs nodes
and a Lutron portable soil moisture sensor. Each WSNs signal strength measurement
was paired with a correspondent value of soil moisture measured by the portable sensor.
While the IEEE 802.15.4 standard protocol used in Waspmote has an ability to measure
and record RSS in dBm, the sensitivity is only 1 dBm. Therefore it cannot register RSS
differences of less than 1 dBm. To increase the accuracy level, each experiment contains
200 measurements at 18 different locations within three test sites in Brisbane; each
location comprises 200 measurements for the total of 3600 data points. This amount of
data is sufficient for the purpose of assessing and proving the SREM wave method
concept.
The first phase involved proving the concept by obtaining measurements
under three different soil conditions: very wet, moist and very dry. This phase
successfully recorded different signal strengths for each corresponding soil moisture

Chapter 5: Conclusions Page 50
Muhammad Iqbal Dalel (n6459544) Page 50
level, and the results agree with the theory that higher soil moistures means higher
received signal strengths.
The second research phase conducts measurements at the designated test
sites (see section 3.3). The 3600 data points support the findings in the first phase.
Higher signal strength corresponds to higher soil moisture values, and it decays as the
soil becomes dryer. The results confirm that the differences in signal strength at different
level of moisture are greater in dryer soil; therefore measurement is more accurate
compared to wetter soil. The highest soil moisture value (21%) was under the wettest
condition possible. This is because in situ soil moisture measurements higher that 20%
are rare. The soil portable soil moisture probe also can only record a level of 7.7% under
the driest soil conditions because the probe cannot penetrate the hardened dry soil. This
supports the advantage of using a non-invasive method that does not need a sensor
probe.
The last research phase generates an empirical equation using a fourth
degree polynomial developed from the experimental results. The equation can be used to
estimate soil moisture based on the measured signal strength value. Although this
equation is restricted to the specific hardware and soil type used in this research, the
methodology and set up, which utilises the telecommunication signal of a WSNs node to
detect changes in soil moisture, is innovative and can form a basis for further studies and
development.
The SREM wave method is heavily dependent on the amount of direct-path
wave strength that can be attenuated so that the receiver only captures the soil-reflected
wave. The project uses a Yagi directional antenna with small beam width to reduce the
2.4 GHz direct-path signal. The antenna is angled down to the soil, based on a selected
angle of incidence. The WSNs node then captures this soil-reflected wave and records its
signal strength. Although a 45° angle from the directional antenna provides significant
12 dBm attenuation to the direct-path wave, it does not completely erase it. Thus, there is
still unwanted interference to the reflected signal.
Soil type and structure is important to any method of soil moisture
measurement, especially one that measures the electrical properties of the soil. Different
types of soil have different water holding capacity; for example, higher clay content
means higher water retention capacity while higher sand content means lower retention.
The experiments in this study are done 10–20% clay content soils. It is common and

Chapter 5: Conclusions Page 51
Muhammad Iqbal Dalel (n6459544) Page 51
important to calibrate for different soil types and locations before installing any type of
sensors.
Two limitations in this research are the hardware used and the experimental
location. The experiment results rely heavily on the portable soil moisture sensor that
was selected and the performance characteristics of the Waspmote node and the Yagi
antenna, Moreover the study is limited to one soil type in Brisbane, Australia. Another
limitation is that the EM wave method becomes less precise at high levels of soil
moistures (see Chapter 4); however, as in situ measurements of soil moisture rarely
exceed 20% this may not be a significant problem. Despite these limitations the research
successfully assesses and proves the validity of the concept of using soil-reflected EMs
to differentiate soil moisture levels using WSNs. The results indicate that further
research and study is warranted.
Accuracy and precision of measurements are two main points that should be
addressed in further studies. There are two suggestions in achieving improvements in
these factors: one is the development of a more sensitive, dedicated sensor to measure
signal strength; the second is the use of a smaller beamwidth, more precise transmitting
antenna to eliminate interference from the direct-path wave. These hardware upgrades
might mean higher cost, but the advantages of non-invasiveness and simplicity of set up
are significant and warrant further studies. In-depth research and experiments that
involve more soil types and experimental locations will also contribute to the further
development of the SREM wave method.
In conclusion, despite the limitations of this research it has been proven that
the concept of an SREM wave method that can detect changes in soil moisture with soil-
reflected electromagnetic wave using WSNs is valid. From the data gathered a fourth
degree polynomial equation to estimate soil moisture value from measured RSS values is
presented (Equation 11). The results successfully answer the research questions posed in
Chapter 1.

REFERENCES Page 52
Muhammad Iqbal Dalel (n6459544) Page 52
REFERENCES
1. Malajner, M., et al., The accuracy of propagation models for distance measurement
between WSN nodes, 2009, University of Maribor: Slovenia.
2. Giacomin, J.C., F.H. Vasconcelos, and E.J.d. Silva, Estimating Vegetation Water
Content with WSN Communication Signal, in Instrumentation and Measurement
Technology Conference - IMTC 20072007: Warsaw, Poland.
3. Moghaddam, M., et al., A Wireless Soil Moisture Smart Sensor Web Using Physics-
Based Optimal Control: Concept and Initial Demonstrations, 2010.
4. Yuwen, S., et al. Design of a Wireless Sensor Network for Farmland Monitoring. in
Frontier of Computer Science and Technology (FCST), 2010 Fifth International
Conference on. 2010.
5. Organization, W.M., WMO Guide - MEASUREMENT OF SOIL MOISTURE, 2010,
WMO: Switzerland.
6. (IAEA), I.A.E.A., Field Estimation of Soil Water Content, in A Practical Guide to
Methods, Instrumentation and Sensor Technology2008, IAEA: Vienna.
7. Adamo, F., et al., Velocity–Moisture Relationships for Sandy Soils:
Experimental Results and Data Analysis. Instrumentation and Measurement, IEEE
Transactions on, 2009. 58(2): p. 311-317.
8. O.P.N.Calla, et al. Measurement of Soil Moisture Using Microwave Radiometer. in
International Conference of Microwave. 2008.
9. Rappaport, T.S., Wireless Communications Principle and Practices2002, Westford,
Massachusetts: Prentice Hall.
10. Curtis, J.O., Moisture Effects on the Dielectric Properties of Soils. IEEE
TRANSACTIONS ON GEOSCIENCE AND REMOTE SENSING, 2001. 39(January
2001).
11. Landron, O., M.J. Feuerstein, and T.S. Rappaport, In Situ Microwave Reflection
Coefficient Measurements for Smooth and Rough Exterior Wall Surfaces. 1993.
12. Sokol, J., et al. Polarimetric C-band observations of soil moisture for pasture fields. in
Geoscience and Remote Sensing Symposium, 2002. IGARSS '02. 2002 IEEE
International. 2002.
13. Draper, C.S., J.P. Walker, and P.J. Steinle, An evaluation of remotely sensed soil
moisture over Australia, 2008.
14. Walker, J.P., G.R. Willgoose, and J.D. Kalma, The Nerrigundah data set - Soil moisture
patterns, soil characteristics, and hydrological flux measurements. WATER
RESOURCES RESEARCH, 2001. Vol. 37(November 2001).
15. Rhebergen, J.B. Results of, measurements, processing and modelling of GPR data
showing the effect of soil moisture content on land-mine detection. in Advanced Ground
Penetrating Radar, 2003. Proceedings of the 2nd International Workshop on. 2003.
16. Dong, X. and M.C. Vuran, Spatio-temporal Soil Moisture Measurement with WUSNs,
2010, IEEE.
17. Daniels, D.J., Physics of Propagation, in EM Detection of Concealed Targets2009.
18. Willis, S. and C.J. Kikkert. Design of a Long-Range Wireless Sensor Node. in Circuits
and Systems, 2006. APCCAS 2006. IEEE Asia Pacific Conference on. 2006.
19. Dinh, T.L., et al., Design and Deployment of a Remote Robust Sensor Network:
Experiences from an Outdoor Water Quality Monitoring Network. 2007: p. 799-806.
20. Stoyanova, T., et al., A Practical RF Propagation Model for Wireless Sensor Networks,
in Third International Conference on Sensor Technologies and Applications2009, IEEE.
21. Cuiñas, I., et al., Modelling and Measuring Reflection Due to Flat Dielectric Surfaces at
5.8 GHz. IEEE TRANSACTIONS ON ANTENNAS AND PROPAGATION, 2007.
Vol. 55(April 2007).

REFERENCES Page 53
Muhammad Iqbal Dalel (n6459544) Page 53
22. Landron, O., M.J. Feuerstein, and T.S. Rappaport, A Comparison of Theoretical and
Empirical Reflection Coefficients for Typical Exterior Wall Surfaces in a Mobile Radio
Environment. IEEE TRANSACTIONS ON ANTENNAS AND PROPAGATION,
1996. Vol. 44(March 1996).
23. Curtis, J.O., j. Charles A. Weiss, and J.B. Everett, Effect of Soil Composition on
Complex Dielectric Properties, 1995, US Army Corps of Engineer.
24. Curtis, J.O., A Durable Laboratory Apparatus for the Measurement of Soil Dielectric
Properties. IEEE TRANSACTIONS ON INSTRUMENTATION AND
MEASUREMENT, 2001. Vol. 50(October 2001).
25. W.G.Fano and V. Trainotti, Dielectric Properties of Soils. 2001 Annual Report
Conference on Electrical Insulation and Dielectric Phenomena, 2001.
26. Hipp, J.E., Soil Electromagnetic Parameters as Functions of Frequency, Soil Density,
And Soil Moisture. PROCEEDINGS OF THE IEEE, 1974. Vol. 62(January 1974).
27. Sipus, Z., S. Skokif, and J. Bartolit, MEASUREMENTS OF ELECTROMAGNETIC
PARAMETERS OF SOIL, in 17 International Conference on Applied Electromagnetics
and Communications2003.
28. Waymond R. Scott, j. and Glenn S. Smith, Measured Electrical Constitutive Parameters
of Soil as Functions of Frequency and Moisture Content. IEEE TRANSACTIONS ON
GEOSCIENCE AND REMOTE SENSING, 1992. 30(May 1992).
29. ZAJÍČEK, L.R., Broadband Measurement of Complex Permittivity Using Reflection
Method and Coaxial Probes.pdf. 2008.
30. Cataldo, A., et al., A Noninvasive Resonance-Based Method for Moisture Content
Evaluation Through Microstrip Antennas. IEEE TRANSACTIONS ON
INSTRUMENTATION AND MEASUREMENT, 2009. Vol. 58(May 2009).
31. Cataldo, A., et al. A Non-Invasive Approach for Moisture Measurements through Patch
Antennas. in Instrumentation and Measurement Technology Conference Proceedings,
2008. IMTC 2008. IEEE. 2008.
32. Oh, Y. and Y.-G. Koo, Analysis of Wave Reflection from Open-ended Coaxial Lines and
Application to the Measurement of Soil Moisture and Salinity. 1998.
33. Or, D. and S.B. Jone, Time Domain Reflectometry (TDR) Applications in Earth
Sciences, 2002, IEEE.
34. Reader, H.C., et al., TIME DOMAIN METHODS FOR SOIL MOISTURE
DETERMINATION, in Antennas and Propagation2002, IEEE.
35. Draper, C.S., et al., Remotely Sensed Soil Moisture over Australia from AMSR-E. 2007.
36. Steelman, C.M. and A.L. Endres. Inference of vertical soil moisture distribution using
high-frequency CMP and reflection traveltime analysis. in Ground Penetrating Radar
(GPR), 2010 13th International Conference on. 2010.
37. Piuzzi, E., et al., An Improved Reflectometric Method for Soil Moisture Measurement
Exploiting an Innovative Triple-Short Calibration.pdf. IEEE TRANSACTIONS ON
INSTRUMENTATION AND MEASUREMENT, 2010. Vol. 59(October 2010).
38. www.decagon.com.au. 2012.
39. http://www.agmoisture.com/index.html. 2012.
40. http://www.sentek.com.au/home/default.asp, 2012.
41. http://www.specsensors.com/. 2012.
42. http://www.vernier.com/products/sensors/sms-bta/. 2012.
43. http://www.stevenswater.com/. 2012.
44. http://www.lutron.com.tw/. 2012.
45. http://www.aquapro-sensors.com/. 2012.
46. Adamo, F., et al., An Acoustic Method for Soil Moisture Measurement. IEEE
TRANSACTIONS ON INSTRUMENTATION AND MEASUREMENT, 2004. Vol.
53(August 2004).
47. Adamo, F., et al. Design and Development of a sensor prototype for Soil Moisture
Measurement: First Experimental Results. in Instrumentation and Measurement
Technology Conference Proceedings, 2007. IMTC 2007. IEEE. 2007.
48. http://www.libelium.com/products/waspmote. 2012.

REFERENCES Page 54
Muhammad Iqbal Dalel (n6459544) Page 54
49. System), A.A.S.R.I. ASRIS Australian Soil Classification. 2010 [cited 2010 June 12];
Available from: http://www.asris.csiro.au/index_other.html.
50. Rappaport, T.S., Wireless Communications Principles and Practice Second Edition. 2
ed. Prentice Hall Communications Engineering and Emerging Technologies Series, ed.
T.S. Rappaport2009: Prentice Hall.
51. Attenuation in Vegetation, in ITU-R P.833-6 2007, International Telecommunication
Union: Geneva.
52. Bello, J.C.R.D., G.L. Siqueira, and H.L. Bertoni, Theoretical Analysis and Measurement
Results of Vegetation Effects on Path Loss for Mobile Cellular Communication Systems.
IEEE Transactions on Vehicular Technology, 2000. Vol. 49(No. 4): p. 1285 - 1293.