non-destructive testing on concrete - ci · pdf filenon-destructive testing on concrete z. j....
TRANSCRIPT
NON-DESTRUCTIVE TESTING ON CONCRETE
Z. J. Li*, The Hong Kong University of Science and Technology, Hong Kong SAR
28th Conference on OUR WORLD IN CONCRETE & STRUCTURES: 28 - 29 August 2003, Singapore
Article Online Id: 100028004
The online version of this article can be found at:
http://cipremier.com/100028004
This article is brought to you with the support of
Singapore Concrete Institute
www.scinst.org.sg
All Rights reserved for CI‐Premier PTE LTD
You are not Allowed to re‐distribute or re‐sale the article in any format without written approval of
CI‐Premier PTE LTD
Visit Our Website for more information
www.cipremier.com

28th Conference on OUR WORLD IN CONCRETE & STRUCTURES: 28 - 29 August 2003, Singapore
NON-DESTRUCTIVE TESTING ON CONCRETE
Z. J. Li*, The Hong Kong University of Science and Technology, Hong Kong SAR
Abstract
Nondestructive testing on concrete can be defined as the measurement, inspection, or analysis of concrete materials or structures without destroying the integrity of concrete materials and structures.
Nondestructive testing on concrete is helpful for the evaluation of the quality of fresh and hardened concretes without destroying the samples. It is very useful for condition assessments, maintaining and repamng the existing concrete constructions. Nondestructive testing on concrete can be used to make reliability evaluation and to assess the integrity of a concrete structure and to monitor the conditions of a construction. Nondestructive testing on concrete also can act for the quality control of fresh concrete, optimal maintenance of existing concrete buildings, and building diagnostics to inspect systems to prevent premature failure. In general, nondestructive testing on concrete can make a significant contribution in evaluating and guaranteeing a concrete structure safety.
In this paper, several novel nondestructive test methods on concrete are introduced. These methods include: newly developed electrical resistivity measurement method for hydration process monitoring of fresh concrete, acoustic emission technique for corrosion and crack detection in hardened concrete, and infrared thermograph technique for debonding detection of an external finishing on a concrete structure surface. The principle and application of these novel methods are stressed in the paper.
Introduction
Nondestructive Testing (NDT) is a well-developed technology and proved to be the effective way to insure safety and quality with low cost in civil engineering [1]. In fact, most of the successful NDT techniques in civil engineering (NDT -CE) are transferred from that correspondence employed in metallurgy. However, as the materials and structures involved in civil engineering are complex, special requirements are needed and different situations are met in civil engineering. It must cause significant difference between NDT -CE and NDT in metallurgy.
Nowadays, the NDT -CE is not as popular as used in metal industries, partly because of the custom of the construction engineers, partly of the NDT techniques itself, which need
37

to be modified to fit the conditions in civil engineering and need interdisciplinary cooperation, partly of lack of training of the NDT-CE operators. NDT -CE measurements are helpful for the assessment of the stability of old and new constructions (buildings and bridges) and for alteration of existing structures. NDT -CE is very useful for condition assessments, maintaining and repairing the existing constructions, especially for those invaluable monuments. NDT -CE could be used to make reliability evaluation and to assess the integrity of a construction and to monitor the conditions of a construction as a whole or a part of it. NDT -CE also can act for the quality control of new constructions, optimal maintenance of existing buildings, and building diagnostics to inspect systems to prevent premature failure. NDT -CE could estimate properties and performance of materials and structures. NDT -CE can localize and measure the defects or damages inside a structure for repairing or removing. It also can be used to find the position of the pre-stressed elements to avoid it being destroyed by accidentally drilling. In general, NDT -CE can make a significant contribution to evaluating and guaranteeing a building safety and to protect invaluable monuments in low cost, rapid and simple operation.
It is said that many NDT methods have been offered but none of these are satisfactory. It is partly true because that NDT encounters some problems in the area of civil engineering. Concrete, the most widely used building material, is an inhomogeneous, porous, highly variable material. The density and modulus of concrete vary from place to place. The average values of them depend on the material type and proportions, vary with water content, curing conditions and pore size, with the cement mix, with the type, shape, orientation, size and distribution of aggregate. In addition they vary with the states of the reinforcement for reinforced concrete. Another problem about the NDT application is the tested object, a building or a structure, usually very large. On the point of view of the NDT-CE techniques themselves, in fact, any NDT technique can perform excellently, but in the meantime suffers its own limitations essentially.
Generally speaking, to apply NDE-CE techniques better, it needs thoroughly to understand the problem of the structures or materials to be tested. It is most important in practices to select correct NDT -CE techniques, and to understand the basis of the testing techniques and devices used as well. Usually, it needs interdisciplinary cooperation. It also depends on how advanced techniques it used. Besides, it usually requires prior knowledge ofthe specimen and calibrations ofthe instrument and elaborate experience of operators.
Recently, the NDT -CE techniques are much advanced and good achievements are reached. This mainly gets benefits from the great development of digital electronics and computer technology. Measurements are mostly automatically performed by the computer controlled instruments and the testing results are analyzed also automatically by the instruments and are displayed in a form man can easily understand rather than only a trace on an oscilloscope screen. The analyzing and displaying process usually called digital signal processing. Significant improvements had been achieved in the past few years in ultrasonic pulse echo testing, in application of radar and the impact echo technique, in data analysis and in the interpretation and simulation of test results.
38

In this paper, several NDT techniques, including non-contacting resistivity measurement method [2], acoustic emission technique [3], and infrared thennograph technique [4], are discussed on their principle and their application.
New non-contacting resistivity measurement technique
The schematic of non-contacting resistance measurement for cement-based materials is shown in Fig. l.(a). Itcan be seen that the novel method has no electrodes. The cementbased specimen is a ring with a rectangular section (Fig. 1. (b)). The specimen ring acts as a secondary of the transformer.
toroidal voltage measurement
(a)
(b)
transfonner core
A
J
Fig. 1. Schematic of resistance measurement
(a) schematic set-up (b) specimen mould
When an AC voltage is applied on the primary of trans fonner, a toroidal voltage (V) will be inducted in the secondary, i.e. in specimen ring. Subsequently, a toroidal current (I) will be occurred inside the specimen ring. Supposing the impedance of specimen ring is Z, we have
Z=V/1 (1)
39
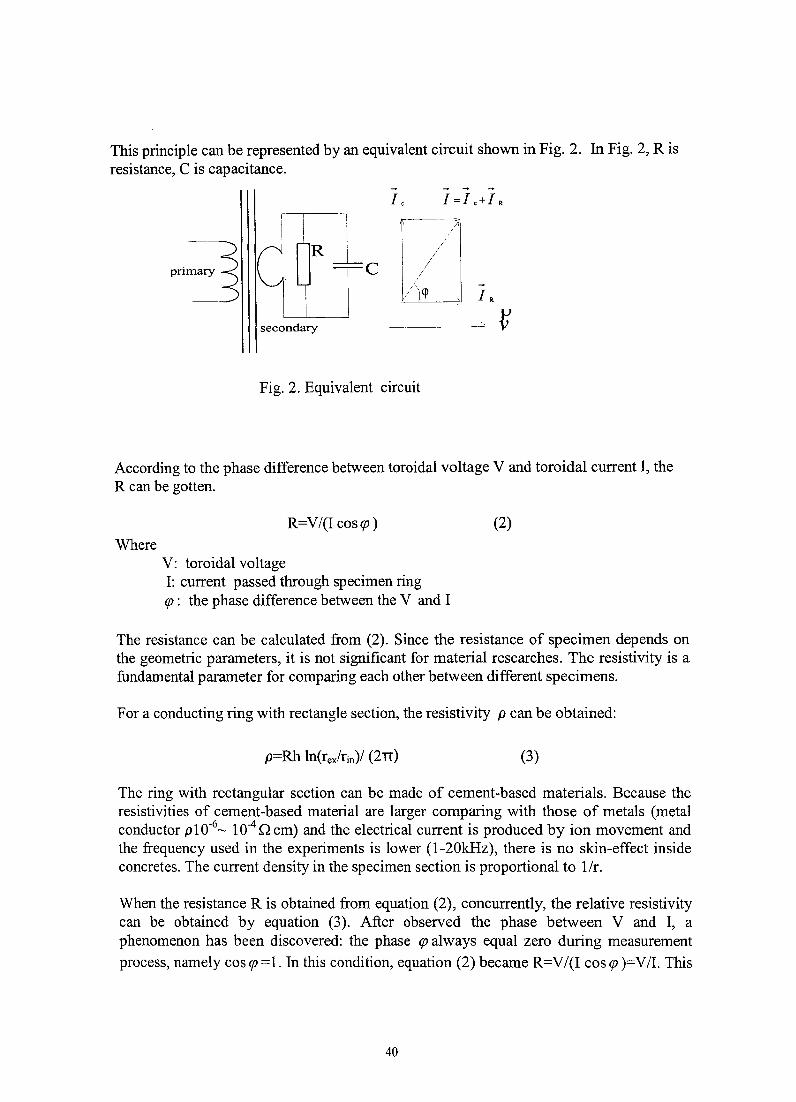
This principle can be represented by an equivalent circuit shown in Fig. 2. In Fig. 2, R is resistance, C is capacitance.
IRl ~:1 -C l/
/W ~I IR secondary
Fig. 2. Equivalent circuit
According to the phase difference between toroidal voltage V and toroidal current I, the R can be gotten.
R=V/(I cos<p) (2)
Where V: toroidal voltage I: current passed through specimen ring <p: the phase difference between the V and I
The resistance can be calculated from (2). Since the resistance of specimen depends on the geometric parameters, it is not significant for material researches. The resistivity is a fundamental parameter for comparing each other between different specimens.
For a conducting ring with rectangle section, the resistivity p can be obtained:
p=Rh In(rex/rin)/ (211) (3)
The ring with rectangular section can be made of cement-based materials. Because the resistivities of cement-based material are larger comparing with those of metals (metal conductor pI 0-6 ~ 10-4 n cm) and the electrical current is produced by ion movement and the frequency used in the experiments is lower (I-20kHz), there is no skin-effect inside concretes. The current density in the specimen section is proportional to 1Ir.
When the resistance R is obtained from equation (2), concurrently, the relative resistivity can be obtained by equation (3). After observed the phase between V and I, a phenomenon has been discovered: the phase <p always equal zero during measurement
process, namely cos<p =1. In this condition, equation (2) became R=V/(I cos <p )=V/I. This
40

simplified the procedures of measurement, only V and I are needed to calculate the resistances. The causes of cp =0 are the specimen shape of a ring.
If using this system to monitor resistivity of cement-based paste for studying hydration process, the paste has to be cast in the mould. The geometric shape of mould is shown in the Fig. 1(b). Then to set the mould cast to the position as showed in Fig1 (a). Some results of resistivity measurements for OPC pastes and OPC mortars in different water-cement ratios (w/c) were measured. The relevant curves are given in Fig. 3 and 4.
~ a u
] 0 '-" >. ...... . -;> .-...... {/) .-{/) (!)
P::
1000
800
600
400
200
a a 500 1000 1500 2000 2500 3000
Time (minute)
Fig. 3. Resistivity of cement paste VS. time
w/c: 1---0.30; 2---0.40; 3---0.50
a u
] 0 >. ...... . -;> .-...... {/) .-{/) (!)
P::
1200
1000 I
800 2
600
400 3
200 0
0 500 1000 1500 2000 2500 3000
Fig. 4. Resistivity of mortar VS. time
Cementsand= 1. W/c: 1---0.35; 2---0.50; 3---0.70
In Fig. 3, three curves represent three paste specimens with w/c of 0.3, 0.4, and 0.5. It can be seen that the resistivity of cement paste is largely influenced by w/c and the higher w/c leads to a lower resistivity. Similar behavior can be observed in Fig. 4 for mortar speCImens.
41
Detection of steel rebar corrosion in concrete using acoustic emission method
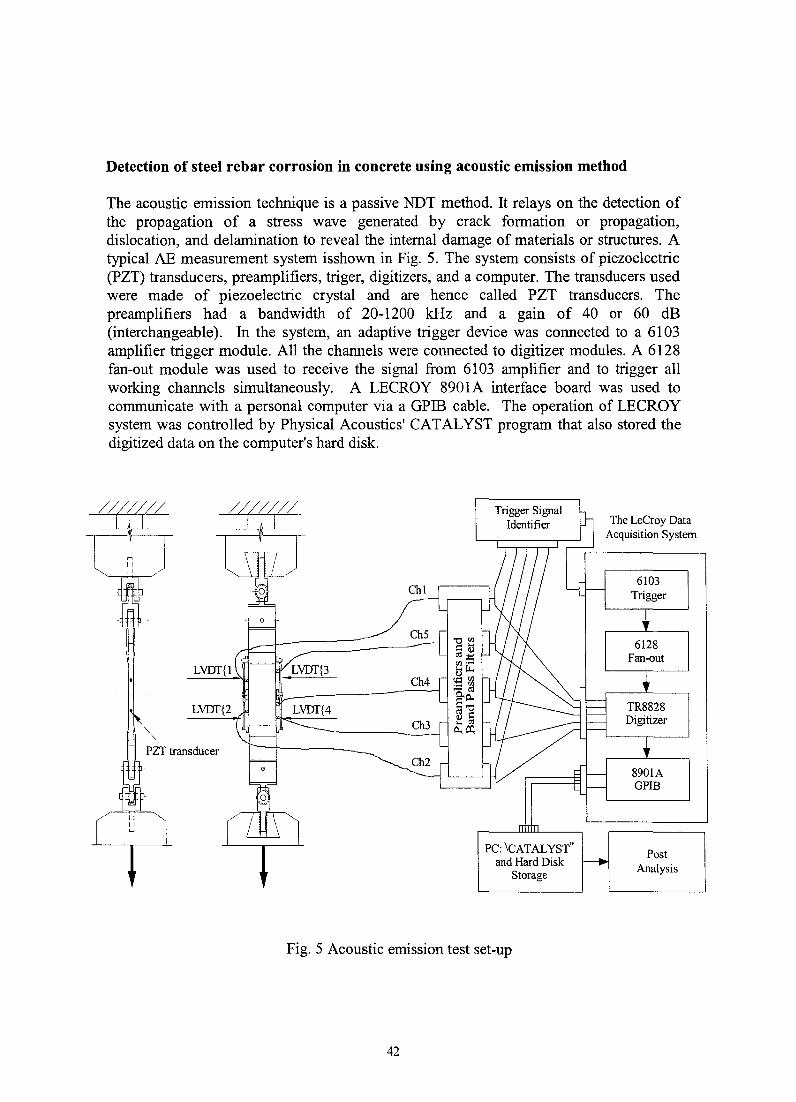
The acoustic emission technique is a passive NDT method. It relays on the detection of the propagation of a stress wave generated by crack formation or propagation, dislocation, and delamination to reveal the internal damage of materials or structures. A typical AE measurement system isshown in Fig. 5. The system consists of piezoelectric (PZT) transducers, preamplifiers, triger, digitizers, and a computer. The transducers used were made of piezoelectric crystal and are hence called PZT transducers. The preamplifiers had a bandwidth of 20-1200 kHz and a gain of 40 or 60 dB (interchangeable). In the system, an adaptive trigger device was connected to a 6103 amplifier trigger module. All the channels were connected to digitizer modules. A 6128 fan-out module was used to receive the signal from 6103 amplifier and to trigger all working channels simultaneously. A LECROY 8901A interface board was used to communicate with a personal computer via a GPIB cable. The operation of LECROY system was controlled by Physical Acoustics' CATALYST program that also stored the digitized data on the computer's hard disk.
PZT transducer
LVDT{4
Trigger Signal Identifier
PC: \CATAL YST" and Hard Disk
Storage
Fig. 5 Acoustic emission test set-up
42
The LeCroy Data Acquisition System
6103 Trigger
6128 Fan-out
TR8828 Digitizer
8901 A GPIB
Post Analysis

The application of AE technique to detect corrosion is relatively new. The principle of this application is that under the expansion of the corroded product, microcracks will developed at the interface and the bulk matrix. These microcracks will generate a stress wave. The stress wave will propagate along medium and reach the outer surface. By placing the AE transducer on the surface, the occurrence of microcracks can be detected. Since these microcracks are caused by corrosion products, the signals detected can be used to interpret the activity of corrosion.
The mathematical model for calculating the stress caused by rebar corrosion at rebarconcrete interface can be simplified as a shrink-fit model. First, let us assuming that the rebar can freely expand due to corrosion with an increase of r in radius direction. Then, we try to put the rebar back into the hole that it occupied before. Due to corrosion expansion, the rebar now is too big to fit freely in the hole of concrete. To let the rebar fit back into concrete, pressures have to be applied to both surrounding concrete and rebar. Let us consider surrounding concrete first. This situation can be treated as internal hole under pressure in a unbounded medium. According to the solution of elasticity, the displacement caused by internal pressure p along radius direction is,
(4)
where p is pressure, a is the radius of hole and IlC is the shear modulus of surrounding concrete (interface). For the rebar, it can be treated as an inclusion with pressure on outsider. The displacement along radius direction can be written as
us = - p(k-l)a r 4J.1
(5)
where k is Kolosou constant, it has the values of,
3-v k=
l+v k = 3-4v
Compatibility requires that
for plane stress
for plane strain
lu;1 + IU:I = l1a (6)
Thus we can obtain the pressure expression as
(7)
The stress produced at surrounding concrete interface is than derived as
43

4 f.1sf.1c l1a (JBB = ( )
2f.1s + ks -1 f.1c a
= C l1a (8)
a For steel, the shear modulus is about 81 GPa and Kolosou constant is around 2. For
concrete, its shear modulus is about 12 GPa. Thus the value of Cis 2.23 x 10¹⁰. For l1a/a equaling 0.0001, the stress produced is 2.23 MPa. Noted that the stress is in fact the shear stress in the interface and this value is large enough to create a microcrack. And the stress wave generated by the micro crack can be detected by acoustic emission transducer. Thus, it proved that the sensitivity of the detection of the AE technique to rebar corrosion is very high. (0.0001 of radius oflO mm is only 1 /lm!) .
To verify the concept, an experiment was conducted. The experiment setup is shown in the following Figure. A concrete block was cast with three reinforcing bars. One was placed on the top and two on bottom. On the up surface of concrete block, a pool of plexiglass was built. The electrolyte with 15% NaCl was used to accelerate the corrosion process. The experiment underwent three-day wet and four-day dry process. The top reinforcing bar would be corroded during experiment. The two re-bars at bottom were used to increase the cathode to anode ratio and thus speed up the corrosion process.
15% NaCl eletrolyte
To AE system
PreamPlifiP
Fig.6 Experimental set-up for accelerated corrosion test
44
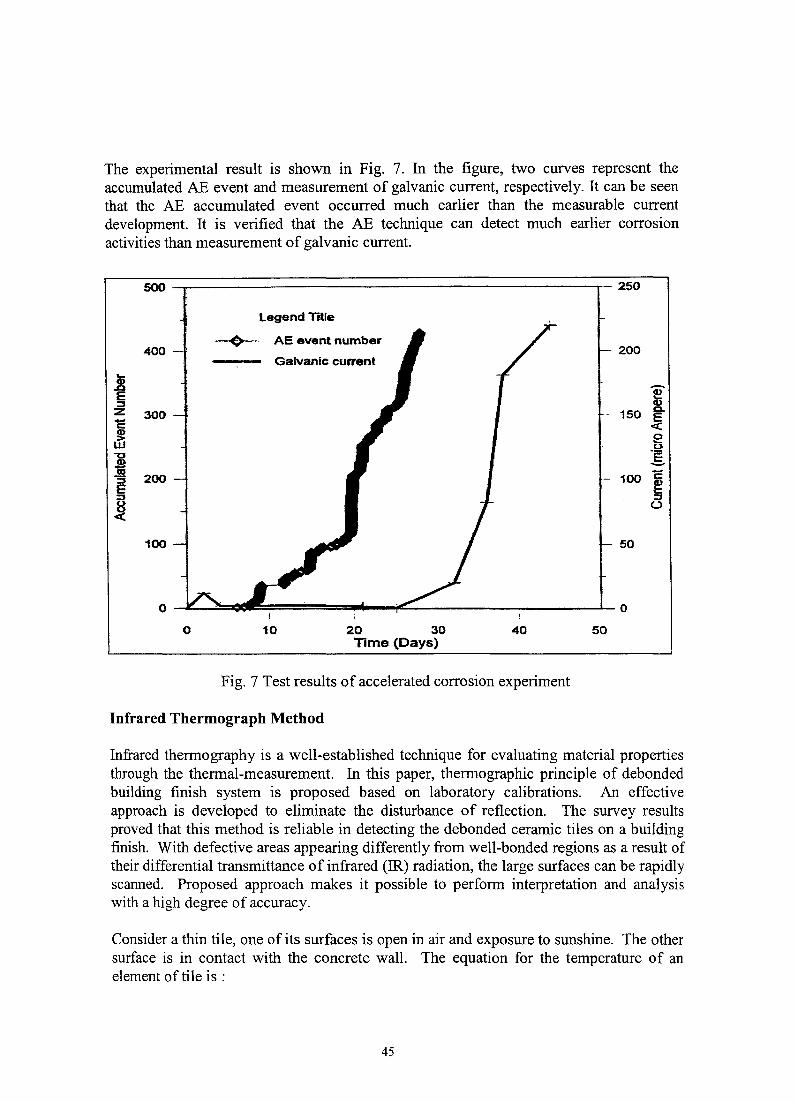
The experimental result is shown in Fig. 7. In the figure, two curves represent the accumulated AE event and measurement of galvanic current, respectively. It can be seen that the AE accumulated event occurred much earlier than the measurable current development. It is verified that the AE technique can detect much earlier corrosion activities than measurement of galvanic current.
500 250
legend TRle
--0(>- AE event number 400 - 200
Galvanic current '-
.! ~ E ::l CD :z 300 150 c.. - E -c < ~ e w .2 "0 g J!! m
200 -- 100 C "5 ~ E
::l ::l
~ (,)
100 50
o ~~~~~========~--~~------------------~O o 10 20 30 40 50
Time (Days)
Fig. 7 Test results of accelerated corrosion experiment
Infrared Thermograph Method
Infrared thermography is a well-established technique for evaluating material properties through the thermal-measurement. In this paper, thermographic principle of debonded building finish system is proposed based on laboratory calibrations. An effective approach is developed to eliminate the disturbance of reflection. The survey results proved that this method is reliable in detecting the debonded ceramic tiles on a building finish. With defective areas appearing differently from well-bonded regions as a result of their differential transmittance of infrared (IR) radiation, the large surfaces can be rapidly scanned. Proposed approach makes it possible to perform interpretation and analysis with a high degree of accuracy.
Consider a thin tile, one of its surfaces is open in air and exposure to sunshine. The other surface is in contact with the concrete wall. The equation for the temperature of an element of tile is :
45
dT Edt = H - K(T -Yo) ( 9 )
where B is the heat capacitance per unit area of the tile; H is a heat flow onto the tile/air surface due to sunlight; K is the thermal conductivity between the tile and the wall. In the most simplified model TO is the wall temperature, which remains constant because of its large thermal capacitance. In a more sophisticated model the temperature of the thick wall varies across the thickness section of the wall which is in contact with tile on one surface, and with room ambient on other. The temperature variation of the wall is such that its surface on the tile side will follow the change of the tile temperature, while the temperature of its indoor surface remains constant. Since the heat flow is determined by the temperature gradient, an equivalent temperature To can be found such that K (T - To) is equal to the actual heat flow from tiles to the wall.
The values of Band K may vary across the plane of the tiles due to the variation of tile/waH boundary conditions, thus causing temperature variation that can be detected by a thermal camera. Here the lateral thermal conduction, and the thermal conduction of surface/air are ignored. These factors can be ignored only within a short period of time when the tile temperature is transient. Over a longer period (several hours), the thermal conduction to air and lateral conduction will result in a uniform temperature distribution all over the tiles, and the defects behind the tiles will not be easily detected. Therefore, it is important that the thermograph measurements should be carried out within the period of transient.
(a) Case 1: Heating Process ofthe Building
Suppose that the tiles are at To when t = 0, this would be the condition in the morning before the sunrise where H = O. As heat stimulation is quickly imposed on the tile wall, in real situations this could be due to sunrise, building shadow movement, or clearing up of clouds, the time-dependent temperature can be obtained by solving the equation below with the proper initial conditions, as
H -~I T=1'o+-(1-e B ) (10)
K It is seen that the time variable in the exponential depends on KIB, and the steady state is To+HIK. In practice, within t = 5BIK , T(t) will reach 99% of its steady value. This steady value, is actually only quasi-steady because the lateral thermal conduction and air conduction are not considered. A quasi-steady state thermograph should therefore be valid during a period from t = 5B/K to a time at which the lateral conduction dominates. A debonding defect is a hollow space between tile and wall. The hollow space could be filled either with water due to rain or moisture condensation, or simply with air. However, the two fillings, water and air, have different effects on the thermal properties, namely Band K, of a tile system. A water-filled cavity will probably lead to a larger K because of the improved thermal contact and of similar heat conductivity with cement. On the other hand, the thermal capacitance (B) will increase if the water is considered as part ofthe tile system. Comprehensively, the influence from K is larger than that from B and thus the surface of a tile with water underneath would show a lower temperature than
46
well-bonded tile during heating transient period. An air pocket (void) with its poor thermal conductivity will lead to a reduced K and a similar B value in a tile system. The surface temperature of a tile portion with a underling air pocket will then be higher than the rest of the intact ones during transient stage.
(b) Case 2: Cooling Process of the Building Case 2 is the opposite of case 1, i.e., a heat stimulation has been applied for a long period, and is then slowly withdrawn, which would be the condition of the sunset. The initial temperature is then TO +HIK when tiles are still in quasi-steady state. The solution to the equation is then
H _!"t T=1'a+KeB (11)
Due to lower thermal conductivity, an air-filled defect will cause a faster decrease, or a lower local temperature, while a water-filled hole will have a higher temperature because of its larger thermal capacitance and higher thermal conductivity.
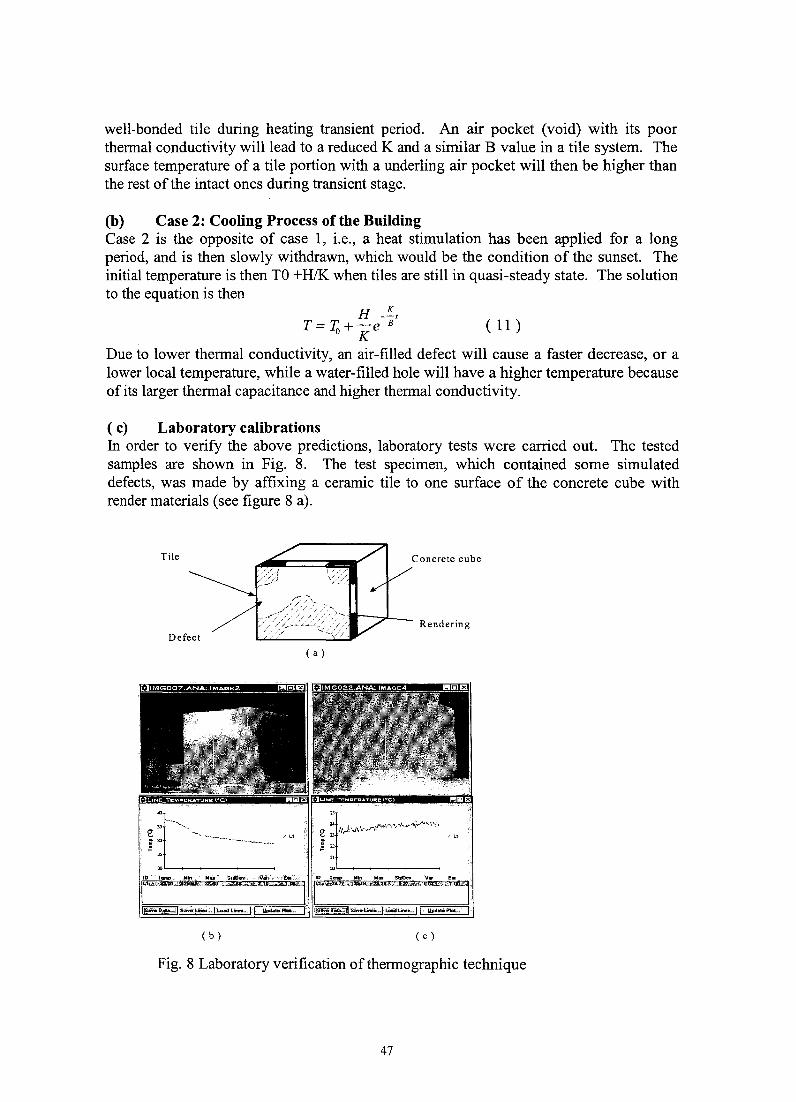
( c) Laboratory calibrations In order to verify the above predictions, laboratory tests were carried out. The tested samples are shown in Fig. 8. The test specimen, which contained some simulated defects, was made by affixing a ceramic tile to one surface of the concrete cube with render materials (see figure 8 a).
Tile Concrete cube
Rendering
( a )
(b) ( c )
Fig. 8 Laboratory verification of thermographic technique
47

Before testing, the upper half of the specimen was kept dry and the lower half was filled with water. An external thermal source (infrared lights) was applied to the tile side of the specimen. A sensitive IR thermographic system, which can identify temperature differences as small as 0.070C, and convert the IR radiation into digital signals, was used to take the images. The images were taken continuously with interval of one minute. It can been seen from the line profile that the surface temperature of the defect area filled with water was lower, while those filled with air was higher than that of sound bonded area on top portion of the tile (see Fig. 5b). Once the thermal source was withdrawn, the tile sample would start to cool off. After half an hour, it was founded that the surface temperature of the bottom half (wet) in the IR image was higher than that of the top half (see Fig. 5c). This was due to the fact that the moist areas. From this simple test, the principle of thermographic detection on debonding of external finishes was been proved.
Conclusions (l).NDT is a useful tool for concrete quality assessment; (2) Non-contacting electrical resistivity measurement can bes used to monitor young
concrete (3) Acoustic emission method developed is efficient to detect early corrosion (4) The infrared thermographic technique can be used to detect the debonding of
external finishes.
Acknowledgement
The financial support from Hong Kong Research Grant Council under HKUST6226/01E is greatly appreciated.
References 1. Schickert, G., "NDT-CE symposium Berlin 1995: a concluding review", Proceedings of Non-Destructive Testing in Civil Engineering (NDT - CE), Vol. 1: 757 - 776, Berlin Germany, Sept. 26 - 28, 1995.
2. Li, Z.J., Wei, X. S., and Li, W. L., " Preliminary interpretation of Portland cement hydration process using resistivity measurements ", ACI Materials Journal, 100 (3): 253-257,2003.
3. Li, Z. J., Li, F. M., Zdunek, A., Landis, E., and Shah, S.P., "Application of acoustic emission to detection ofrebar corrosion in concrete", ACI Materials Journal, 95(1): 68-76, 1998.
4. Li, Z.J., Yao, W., Lee, S., Lee, c., and Yang, Z.Y., "Application of infrared thermography technique in building finish evaluation", J. of Nondestructive Evaluation, 19(1): 11-19,2000.
48