nola du toit kate bachtell catherine haggerty
DESCRIPTION
Where Poor Children Live: Household Structure through the Eyes of Children. Nola du Toit Kate Bachtell Catherine Haggerty. Background. Household structure is important for child well-being Married two-parent families are best for child wellbeing = more resources, more stable - PowerPoint PPT PresentationTRANSCRIPT
Nola du Toit
Kate Bachtell
Catherine Haggerty
Where Poor Children Live: Household Structure through the Eyes of Children
2
Background
• Household structure is important for child well-being
• Married two-parent families are best for child wellbeing = more resources, more stable
• Children in single parent and cohabiting homes do less well
(Waldfogel et al 2010, Manning and Brown 2006, Amato 2005, McClanahan and Sandefur
1994)
3
Background
• Most examine relationships of parents• Single, two-parent, married, cohabiting,
step, etc…
• What about other people in the home?• Grandparents, uncles, aunts, roommates,
etc.
4
Overall Research Agenda
• Purpose of our research
• Zoom in on low-income communities
• Determine how many children live with other adults in the home
• Who are other adults living with children?
• Do they matter for child well-being?
5
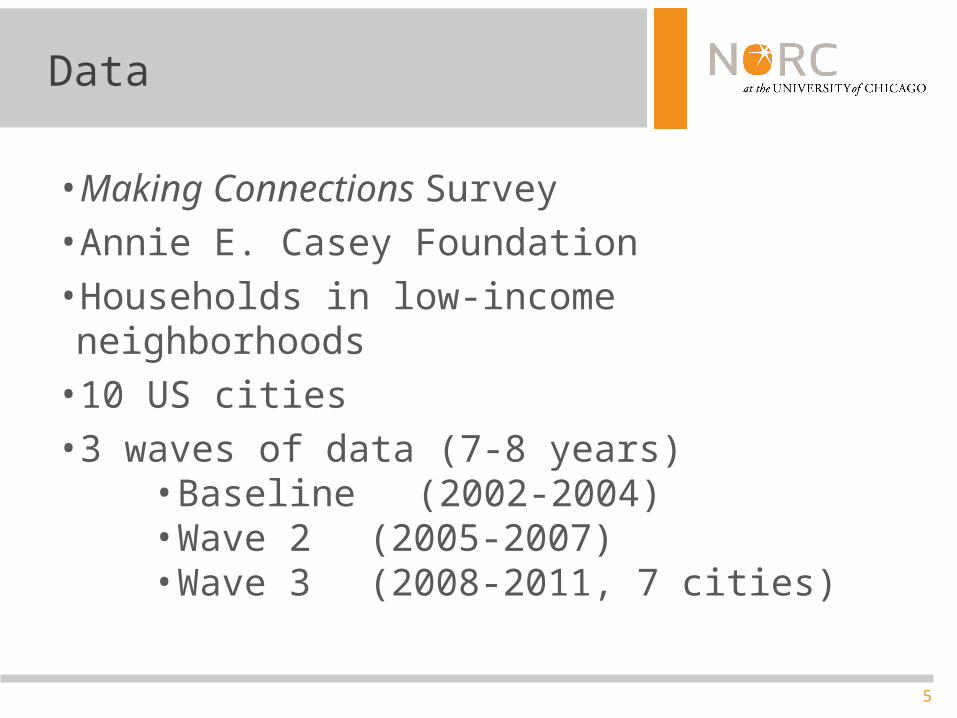
Data
• Making Connections Survey• Annie E. Casey Foundation• Households in low-income neighborhoods• 10 US cities• 3 waves of data (7-8 years)
• Baseline (2002-2004)• Wave 2 (2005-2007)• Wave 3 (2008-2011, 7 cities)
6
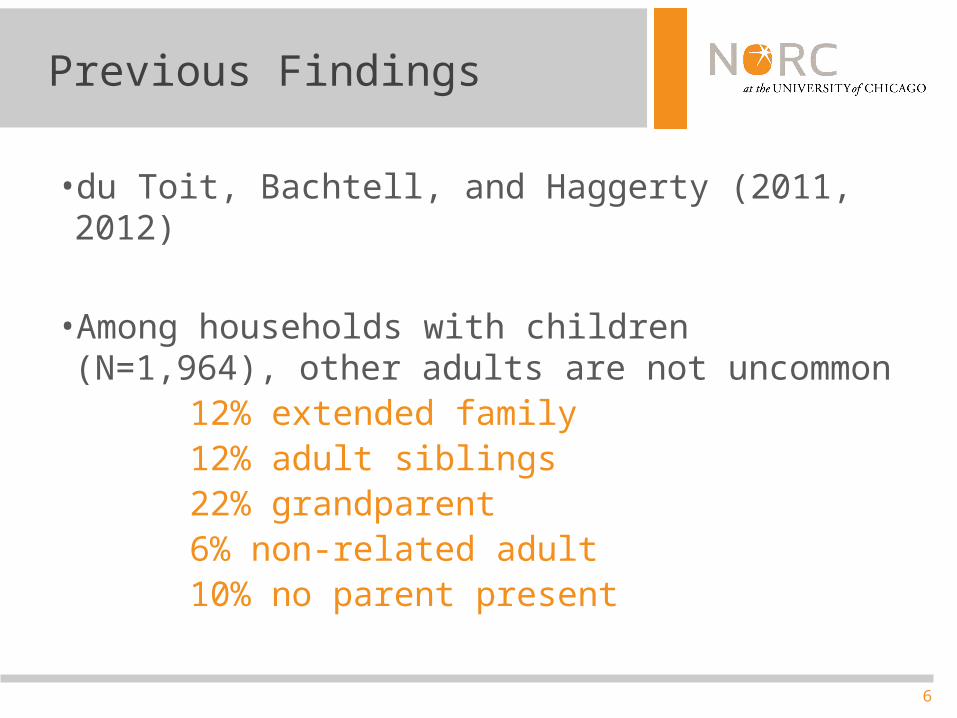
Previous Findings
• du Toit, Bachtell, and Haggerty (2011, 2012)
• Among households with children (N=1,964), other adults are not uncommon
12% extended family12% adult siblings22% grandparent6% non-related adult10% no parent present
7
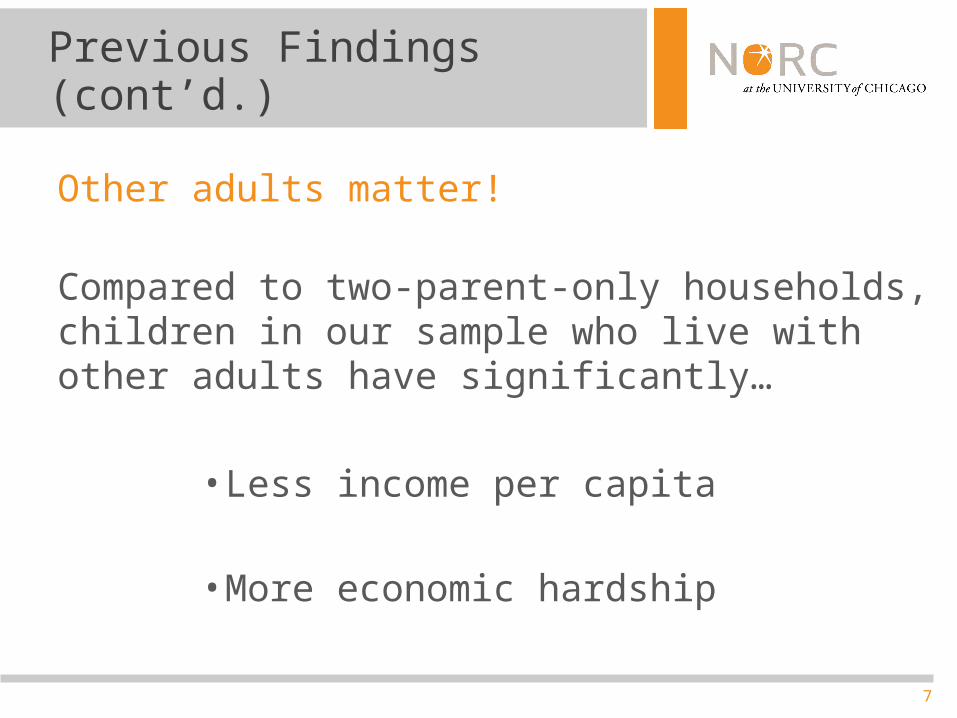
Previous Findings (cont’d.)
Other adults matter!
Compared to two-parent-only households, children in our sample who live with other adults have significantly…
• Less income per capita
• More economic hardship
8
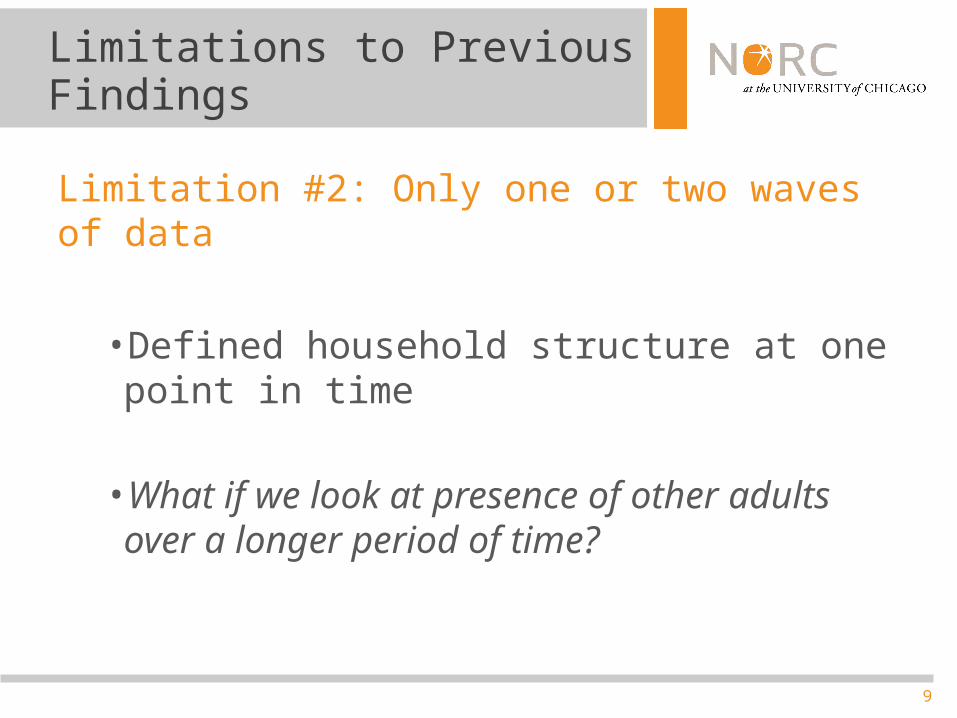
Limitations to Previous Findings
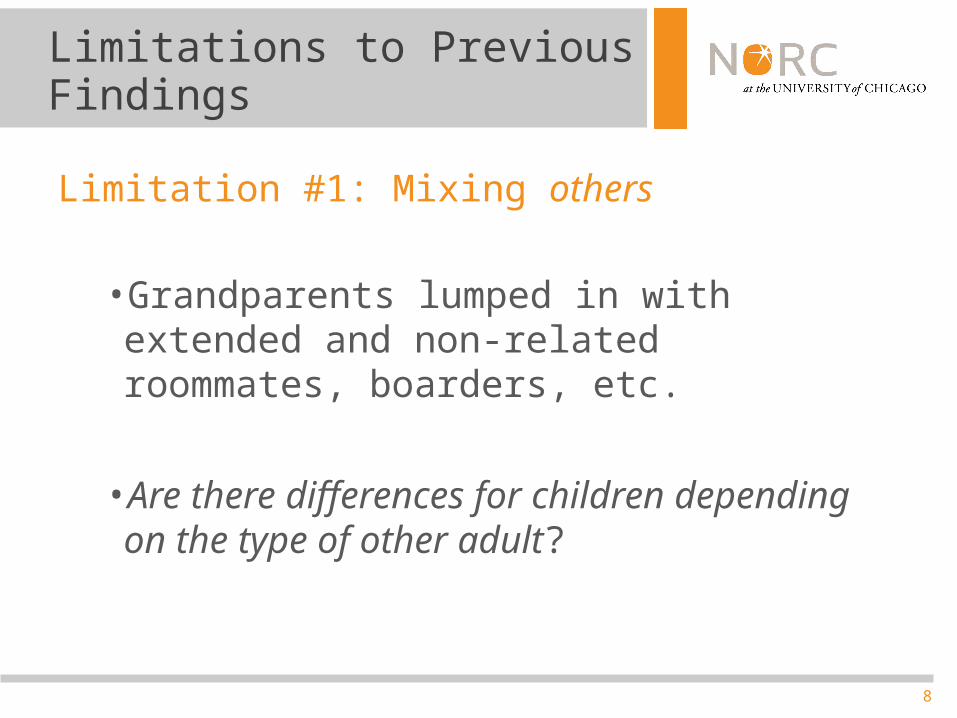
Limitation #1: Mixing others
• Grandparents lumped in with extended and non-related roommates, boarders, etc.
• Are there differences for children depending on the type of other adult?
9
Limitations to Previous Findings
Limitation #2: Only one or two waves of data
• Defined household structure at one point in time
• What if we look at presence of other adults over a longer period of time?
10
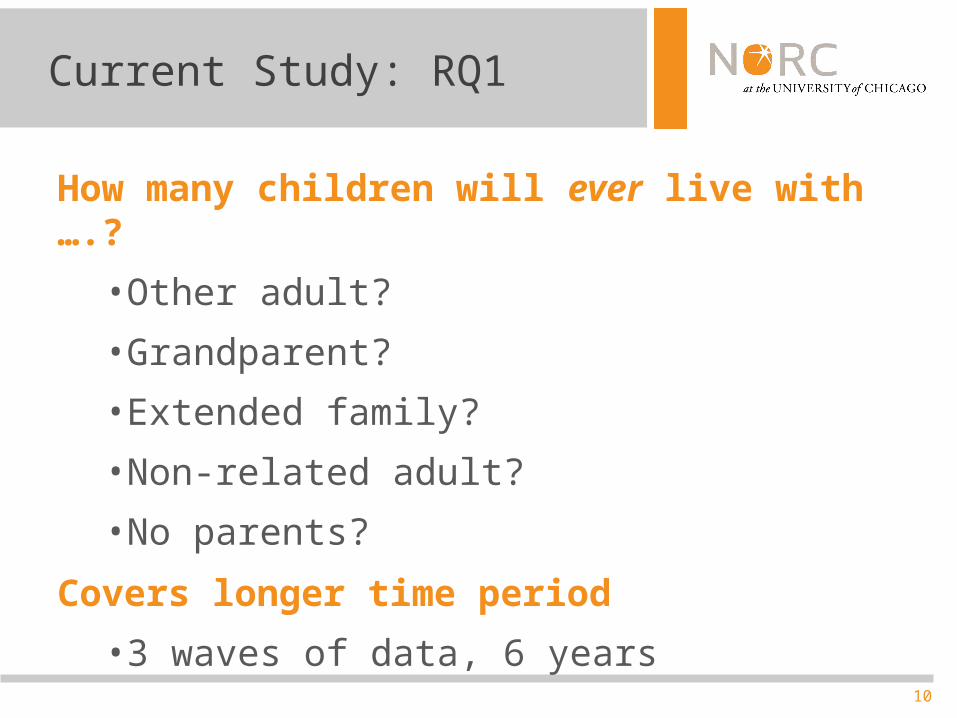
Current Study: RQ1
How many children will ever live with ….?
• Other adult?
• Grandparent?
• Extended family?
• Non-related adult?
• No parents?
Covers longer time period
• 3 waves of data, 6 years
11
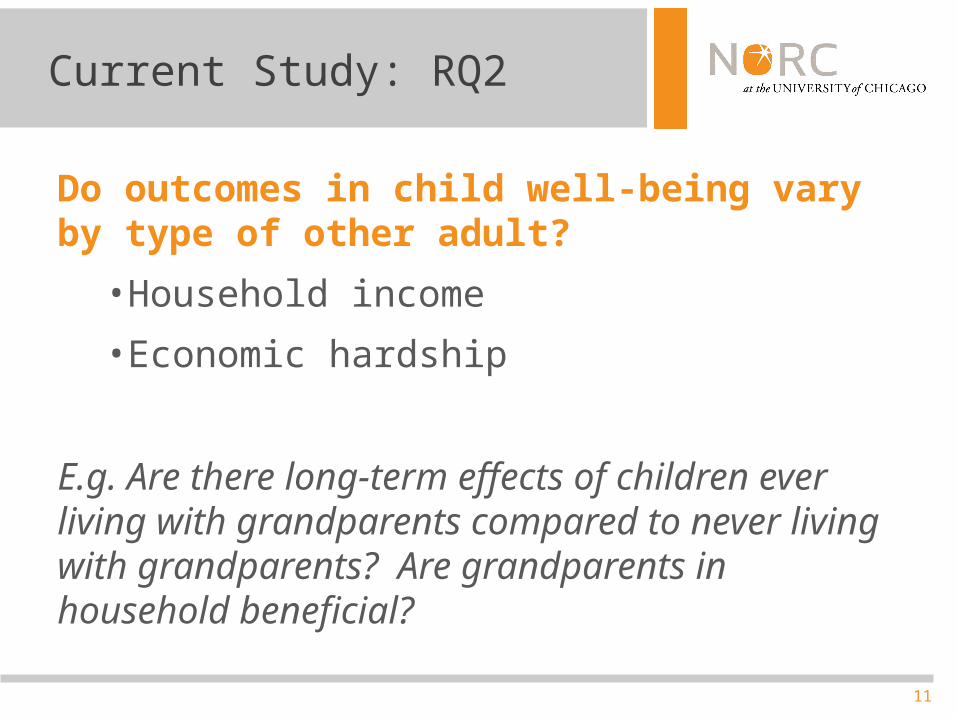
Current Study: RQ2
Do outcomes in child well-being vary by type of other adult?
• Household income
• Economic hardship
E.g. Are there long-term effects of children ever living with grandparents compared to never living with grandparents? Are grandparents in household beneficial?
12
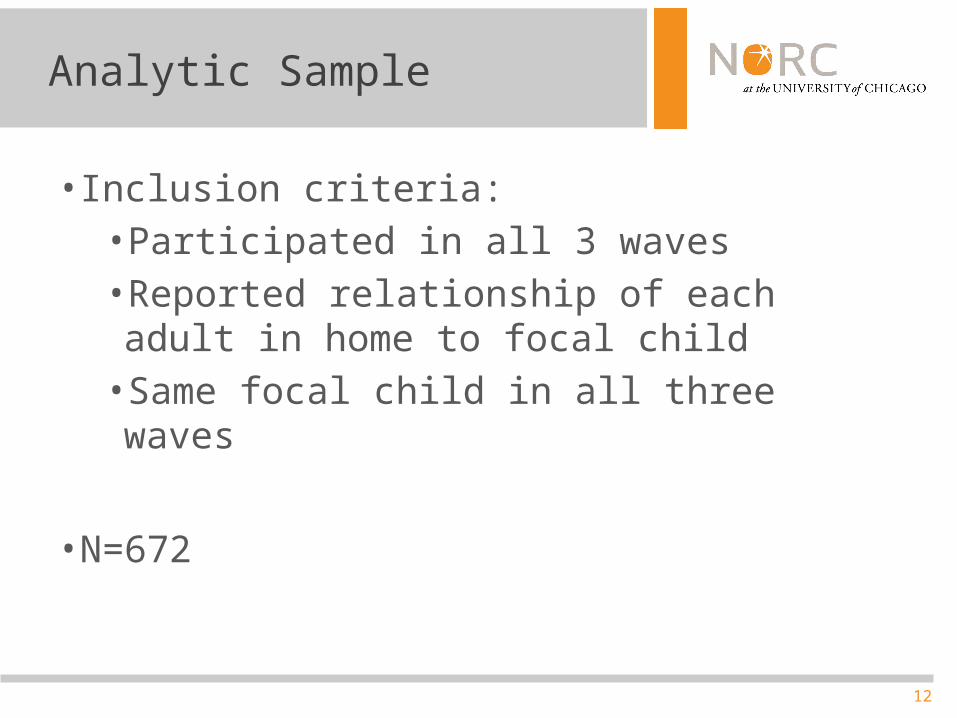
Analytic Sample
• Inclusion criteria:• Participated in all 3 waves• Reported relationship of each adult in home to focal child
• Same focal child in all three waves
• N=672
13
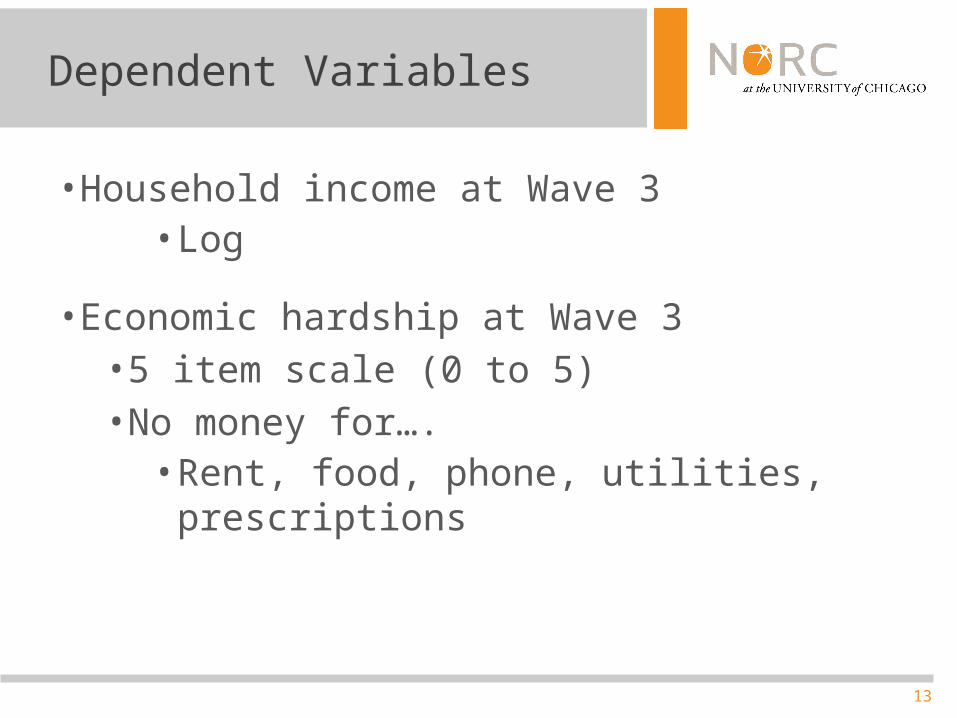
Dependent Variables
• Household income at Wave 3• Log
• Economic hardship at Wave 3• 5 item scale (0 to 5)• No money for….
• Rent, food, phone, utilities, prescriptions
14
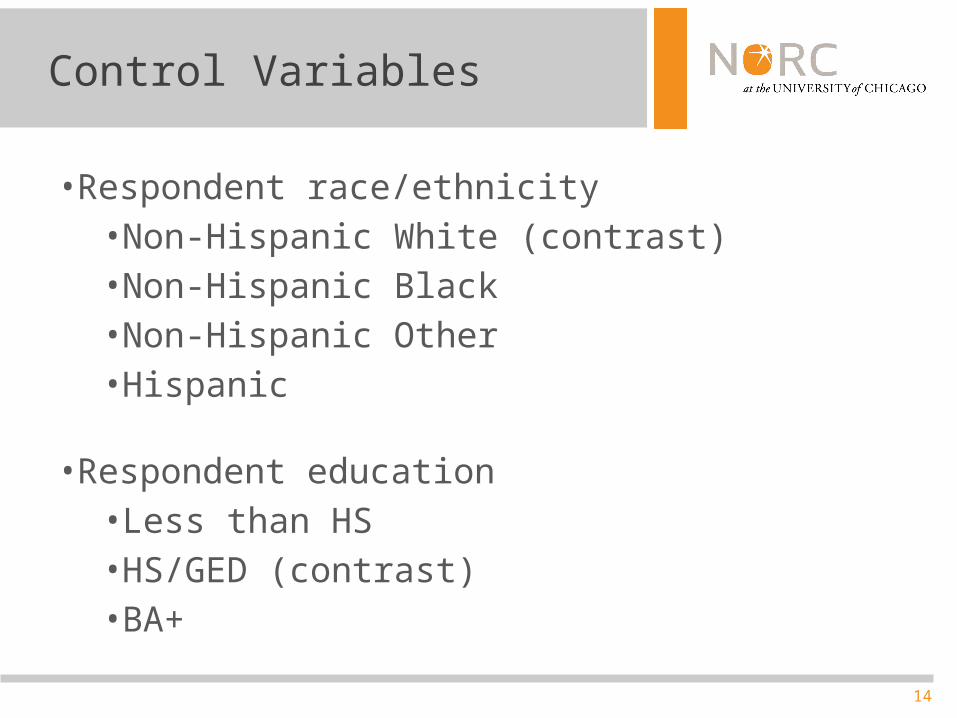
Control Variables
• Respondent race/ethnicity• Non-Hispanic White (contrast)• Non-Hispanic Black• Non-Hispanic Other• Hispanic
• Respondent education• Less than HS• HS/GED (contrast)• BA+
15
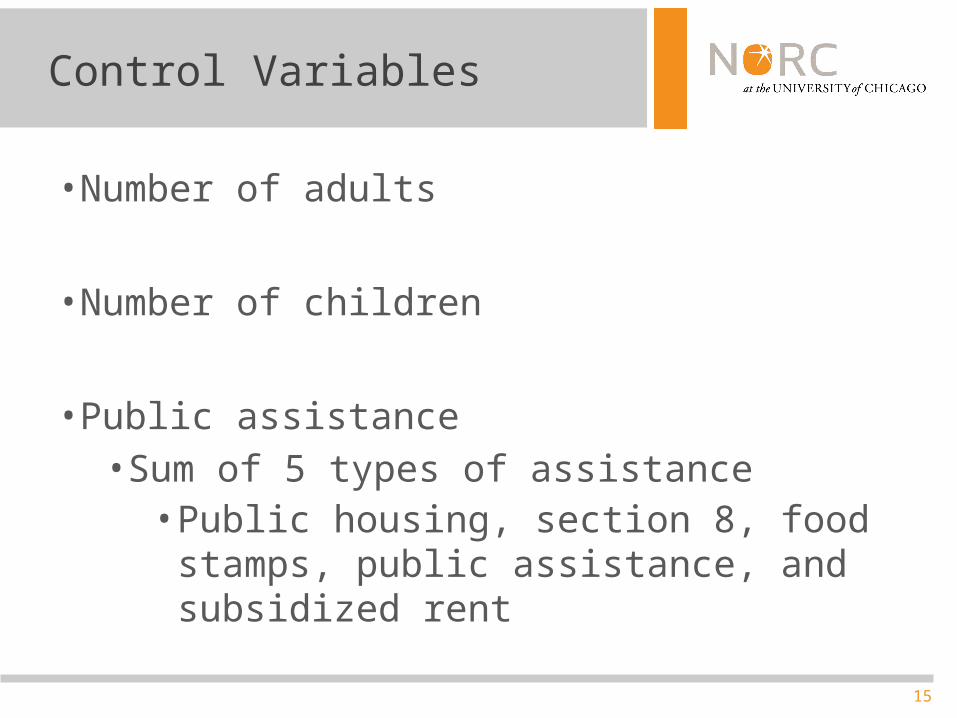
Control Variables
• Number of adults
• Number of children
• Public assistance• Sum of 5 types of assistance
• Public housing, section 8, food stamps, public assistance, and subsidized rent
16
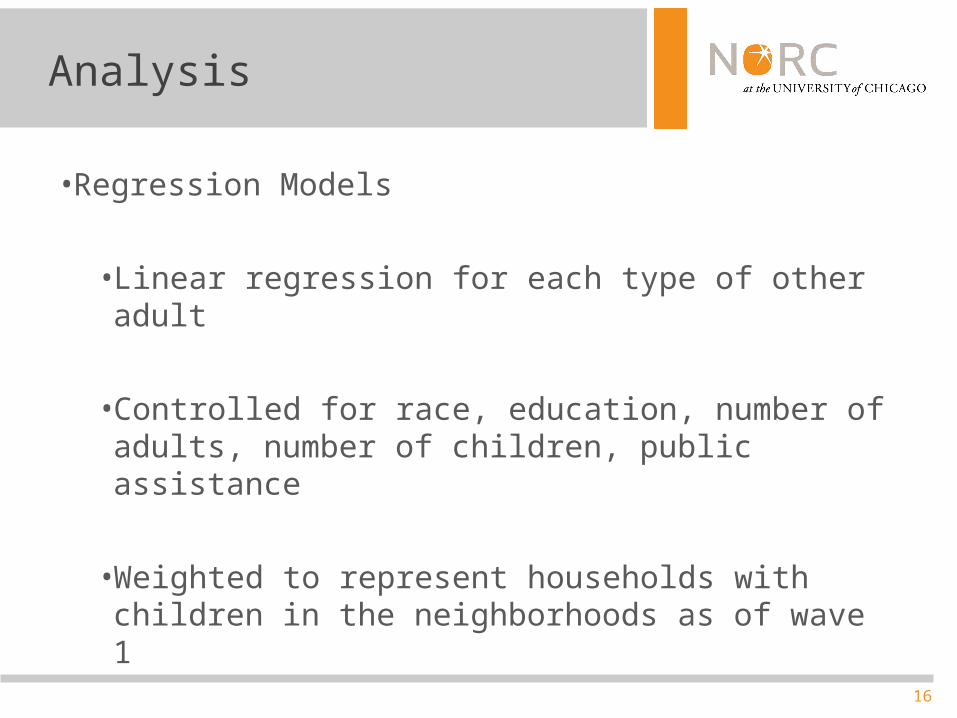
Analysis
• Regression Models
• Linear regression for each type of other adult
• Controlled for race, education, number of adults, number of children, public assistance
• Weighted to represent households with children in the neighborhoods as of wave 1
17
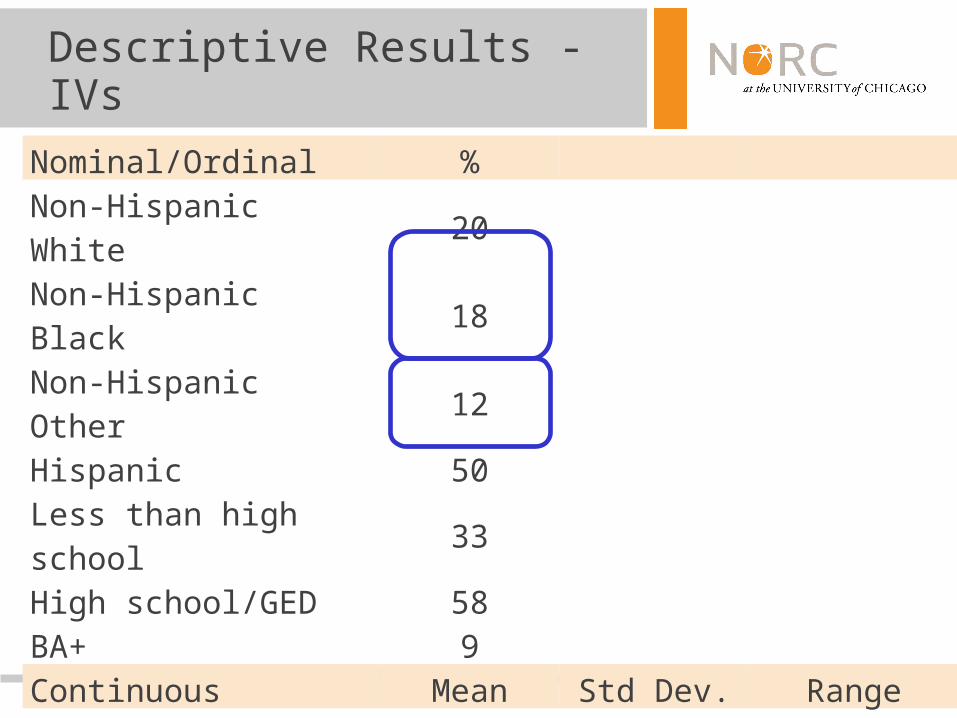
Descriptive Results - IVs
Nominal/Ordinal %Non-Hispanic White 20Non-Hispanic Black 18Non-Hispanic Other 12Hispanic 50Less than high school 33High school/GED 58BA+ 9Continuous Mean Std Dev. RangeNumber of adults 1.92 4.41 1-6Number of children 2.19 5.88 1-12Public assistance usage 0.48 1.60 0-4
18
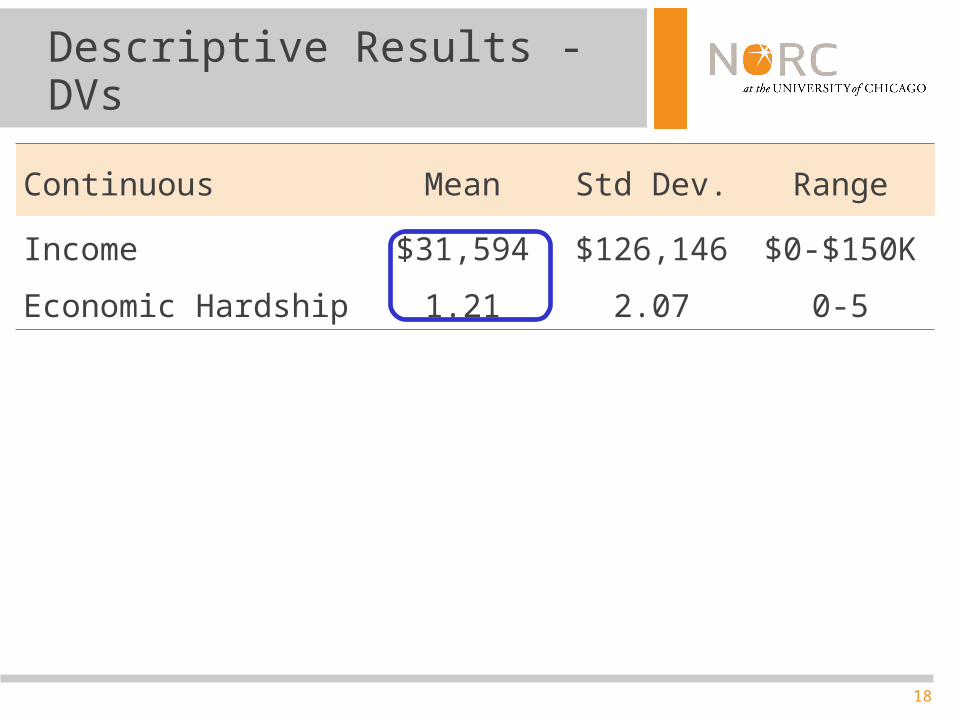
Descriptive Results - DVs
Continuous Mean Std Dev. Range
Income $31,594 $126,146 $0-$150K
Economic Hardship 1.21 2.07 0-5
19
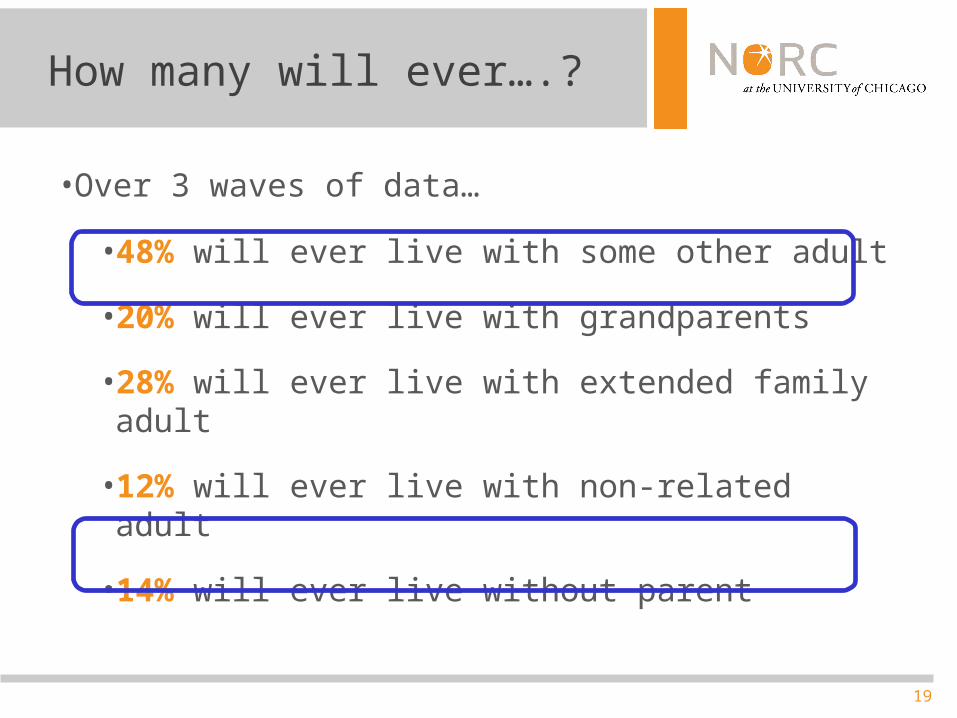
How many will ever….?
• Over 3 waves of data…
• 48% will ever live with some other adult
• 20% will ever live with grandparents
• 28% will ever live with extended family adult
• 12% will ever live with non-related adult
• 14% will ever live without parent
20
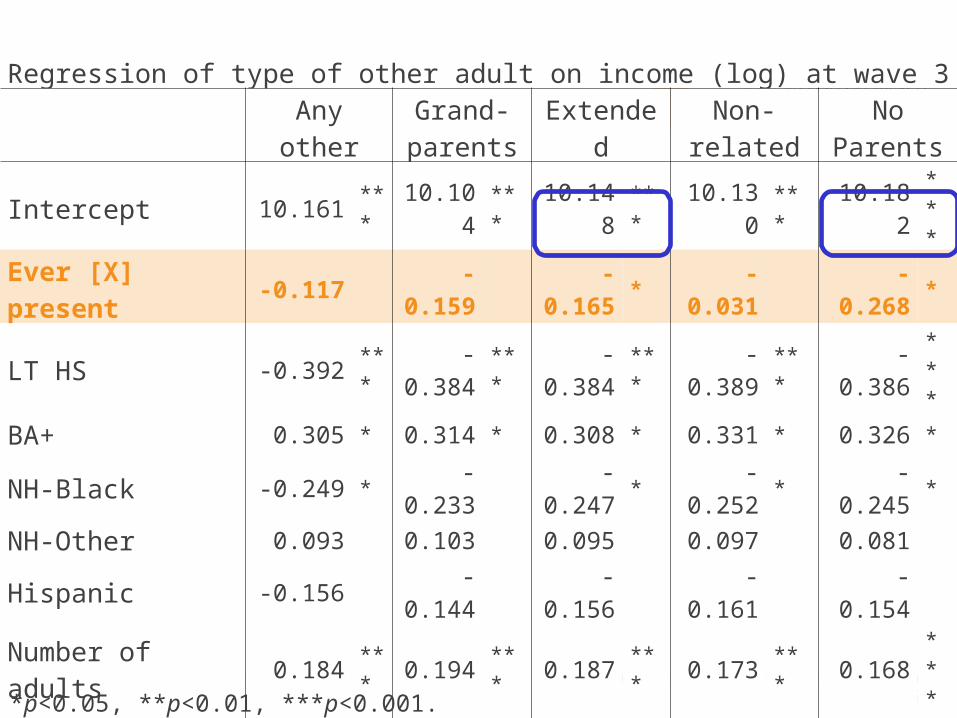
Regression of type of other adult on income (log) at wave 3
Any otherGrand-parents
ExtendedNon-
relatedNo
Parents
Intercept 10.161 *** 10.104 *** 10.148 *** 10.130 *** 10.182 ***
Ever [X] present -0.117 -0.159 -0.165 * -0.031 -0.268 *
LT HS -0.392 *** -0.384 *** -0.384 *** -0.389 *** -0.386 ***
BA+ 0.305 * 0.314 * 0.308 * 0.331 * 0.326 *
NH-Black -0.249 * -0.233 -0.247 * -0.252 * -0.245 *
NH-Other 0.093 0.103 0.095 0.097 0.081
Hispanic -0.156 -0.144 -0.156 -0.161 -0.154
Number of adults 0.184 *** 0.194 *** 0.187 *** 0.173 *** 0.168 ***
Number of children -0.008 -0.008 -0.009 -0.006 -0.012
Public assistance -0.442 *** -0.438 *** -0.440 *** -0.443 *** -0.444 ***
F 25.80 *** 25.84 *** 26.03 *** 25.44 *** 26.39 ***
R2 0.260 0.260 0.261 0.257 0.264
df 9 9 9 9 9
*p<0.05, **p<0.01, ***p<0.001.
21
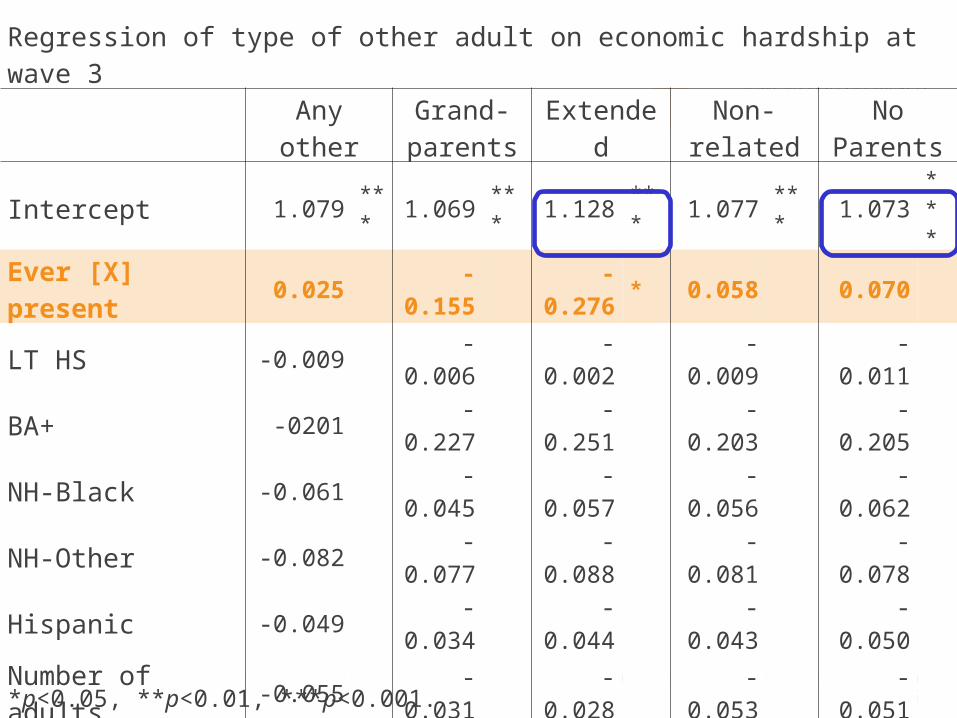
Regression of type of other adult on economic hardship at wave 3
Any otherGrand-parents
ExtendedNon-
relatedNo
Parents
Intercept 1.079 *** 1.069 *** 1.128 *** 1.077 *** 1.073 ***
Ever [X] present 0.025 -0.155 -0.276 * 0.058 0.070
LT HS -0.009 -0.006 -0.002 -0.009 -0.011
BA+ -0201 -0.227 -0.251 -0.203 -0.205
NH-Black -0.061 -0.045 -0.057 -0.056 -0.062
NH-Other -0.082 -0.077 -0.088 -0.081 -0.078
Hispanic -0.049 -0.034 -0.044 -0.043 -0.050
Number of adults -0.055 -0.031 -0.028 -0.053 -0.051
Number of children 0.084 0.081 0.077 0.084 0.085
Public assistance 0.230 *** 0.236 ** 0.234 *** 0.231 *** 0.231 ***
F 2.71 ** 2.85 ** 3.33 *** 2.72 ** 2.73 **
R2 0.036 0.037 0.043 0.035 0.035
df 9 9 9 9 9
*p<0.05, **p<0.01, ***p<0.001.
22
Findings
• After controlling for race/ethnicity, education, household size, and public assistance….
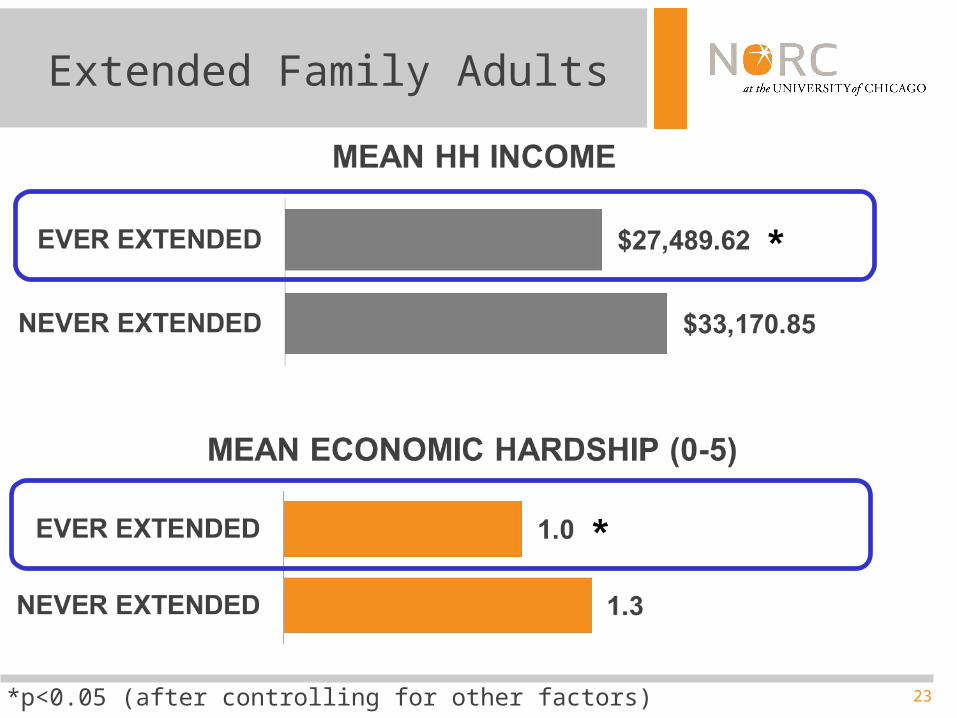
• Ever living with extended family adults or without parents lower household income than never living with extended or without parents
• Ever living with extended family adults lower mean economic hardship than never living with extended
23
Extended Family Adults
*p<0.05 (after controlling for other factors)
24
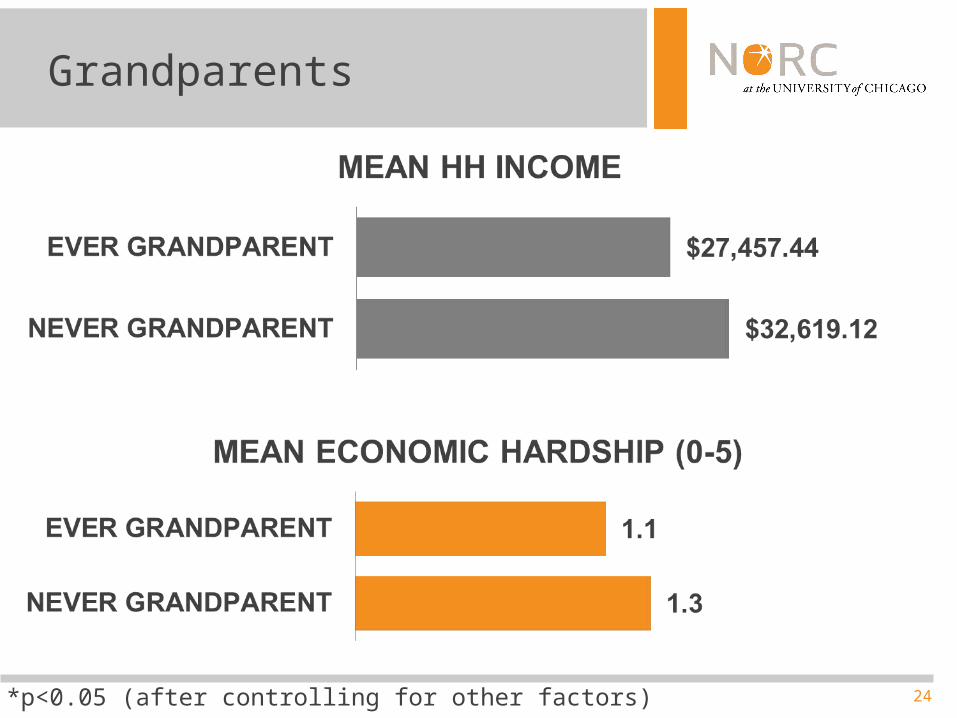
Grandparents
*p<0.05 (after controlling for other factors)
25
Limitations
• Sample size
• Do not know if other adults are living with focal child or focal child is living with other adults
• Lacking information about why other adults are present
26
Conclusions
• Many children live with adults who are not their parents
• The presence of these other adults matter• Effect can be good, can be bad…
• The absence of parents matters
• Need more research on differences in types of adults
• Economic and non-economic contributions
Thank You!
Nola du Toit: [email protected]
Kate Bachtell: [email protected]
Catherine Haggerty: [email protected]