noise and vibration study: mod pendine range june 2016
TRANSCRIPT

QINETIQ LTD
MINISTRY OF DEFENCE LAND RANGES - NOISE AND VIBRATION STUDY
MOD PENDINE RANGE
JUNE 2016
VOLUME 1: FINAL REPORT
51897M-SEC-00168-05
QINETIQ LTD
MINISTRY OF DEFENCE LAND RANGES - NOISE AND VIBRATION STUDY
MOD PENDINE RANGE DOCUMENT REFERENCE: 51897M-SEC-00168-05
REVIEW AND AUTHORISATION
Authored By Ian Arthurs BSc (Hons), MSc, MIOA
Position Senior Consultant
Signature
Date 21/06/2016
Reviewed By Rick Methold BEng (Hons), CEng, FIOA
Position Director
Signature
Date 21/06/2016
Checked By Matthew Tomes BSc (Hons), MSc, MIOA
Position Senior Consultant
Signature
Date 21/06/2016
Approved By Rick Methold BEng (Hons), CEng, FIOA
Position Director
Signature
Date 21/06/2016
AMENDMENT HISTORY
Issue Status Description Date
01 Draft Draft Report issued to QinetiQ for comment 29/09/2015
02 Final Final Report 21/12/2015
03 Final Final Report 15/03/2016
04 Final Final Report 03/06/2016
05 Final Final Report 21/06/2016
This report has been prepared using all reasonable skill and care within the resources agreed by the client. No responsibility is accepted for matters outside the terms and scope of the agreement under which this report has been prepared. Similarly no responsibility in any form is accepted for third party use of this report or parts thereof, the contents of which are confidential to the client.
This is Volume 1 of 3 of the MOD Pendine Range Final Report. This volume should be read in conjunction with Volumes 2 and 3.

51897m-SEC-00168-05 1 June 2016
CONTENTS PAGE NO.
1. INTRODUCTION 2
Background 2 Scope 2
2. ASSESSMENT CRITERIA 4
Introduction 4 Building Damage Thresholds 4 The Control of Noise at Work Regulations 2005 5
3. MONITORING METHODOLOGY 7
Study Location 7 Site Selection Process 7 Selected Monitoring Equipment 8 Synchronous Detection Technique 8
4. MONITORING SUMMARY 10
Summary of Range Activities and Data Capture 10 Summary of Data Capture 11
5. RESULTS AND DISCUSSION 12
Introduction 12 Causal Link 12 Sound / Air Overpressure and Vibration Magnitudes 14 Meteorological Data 16
6. CONCLUSIONS 17
7. REFERENCES 19
APPENDIX A – FIGURES
APPENDIX B - TABLES
51897m-SEC-00168-05 2 June 2016
1. INTRODUCTION
Background
1.1.1 There is a public perception that Test, Evaluation, Demilitarisation, and Training support activities (the Range Activities) at the Ministry of Defence (MOD) Land Ranges operated by QinetiQ can produce noise and vibration that may be damaging to property through airborne or seismic shock waves.
1.1.2 Southdowns Environmental Consultants Ltd (Southdowns) has been appointed by QinetiQ, on behalf of the MOD, to undertake an independent investigation into whether, and to what extent, Range Activities result in potentially damaging effects to building structures at locations surrounding the Land Ranges.
1.1.3 QinetiQ provides Test and Evaluation (T&E) and Training Support services to MOD under a 25-year contract – the Long Term Partnering Agreement (LTPA).
1.1.4 The initial requirements for the monitoring study were presented in ‘Pendine Noise and Vibration Monitoring Study (NVMS) - System Requirements Document (SRD) [1] produced on behalf of the MOD by QinetiQ.
1.1.5 The Single Statement of User Need, set out in the SRD states:
‘The User requires a competent independent study to ascertain whether Test, Evaluation, Demilitarisation, and Training support activities (the Range activities) cause excessive noise or vibration that could possibly cause damage or exceed legal limits and their effect on local communities and at specific locations through airborne or seismic shock waves’
1.1.6 Further consideration was given to the main study aims, the associated risks and study limitations and, following further communication with QinetiQ, the final study scope and key objectives were agreed. These are set out in Section 1.2 below.
Scope
1.2.1 The study comprised the long-term continuous measurement of airborne sound pressure levels, air over pressure and ground-borne vibration caused by Range Activities at a series of locations within and around the LTPA Land Ranges. The resulting measurement dataset has been analysed and where possible, a causal link between on-Range Activities and measured magnitudes of sound and vibration at surrounding off-Range locations determined.
1.2.2 Where a causal link has been determined from the analysis, then the magnitudes of measured sound / air overpressure and ground-borne vibration have been assessed against appropriate criteria to establish the likely risk of: potential building damage.
1.2.3 The following key objectives have been identified to achieve the overarching aims of the study:
Establishment of relevant metrics, criteria and thresholds for building damage, through the review of contemporary research and published literature;
Selection of appropriate monitoring equipment and systems;
Development of a detailed methodology for the undertaking of a large scale monitoring programme;

51897m-SEC-00168-05 3 June 2016
Selection of suitable monitoring locations;
Design and implementation of data management procedures to maintain data quality;
Collation and analysis of large quantities of data;
Determination of the magnitude of sound pressure and vibration exposures from Range Activities;
Development of a robust technique for defining causal link; and
Reporting of suitable information to the client and other external parties.
1.2.4 The monitoring commenced in the vicinity of the Pendine Range on 3rd November 2014 for a period of six months at 10 off-Range monitoring locations. In addition, two monitoring systems were installed within the confines of the MOD Pendine Land Range. The monitoring equipment was set-up with a synchronous trigger system which allowed for simultaneous triggering between the on-Range and off-Range monitoring locations, allowing data capture at the off-Range monitoring locations at the precise time of an activity on the Range.
1.2.5 The assessment criteria and thresholds adopted for this study are summarised in Section 2 of this report. The monitoring study methodology is presented in Section 3. Details of the Range Activities and the data captured are presented in Section 4. The results of the monitoring study are presented and discussed in Section 5 and finally, the study conclusions are presented in Section 6.

51897m-SEC-00168-05 4 June 2016
2. ASSESSMENT CRITERIA
Introduction
2.1.1 An independent review of published available contemporary research and guidance has been undertaken to ensure that appropriate assessment indicators and effect thresholds were identified and adopted for the interpretation and assessment of the collated dataset.
2.1.2 The following series of review objectives were established to achieve the overall aim:
develop an understanding of the acoustic effects of activities which are undertaken on MOD Land Ranges;
identify the acoustic characteristics which may cause adverse effects leading to structural damage;
provide best practice guidance for the measurement of acoustic effects from military Land Range Activities at receptor locations distant from Range operations; and
develop an understanding of the magnitudes at which such acoustic related effects are likely to cause structural damage to property and potential damage to hearing.
2.1.3 The review drew on previous similar studies undertaken in the UK and overseas, as well as
relevant British Standards and academic literature, to provide context and technical commentary on the key considerations for the monitoring study.
2.1.4 The primary focus of the review was associated with potential building damage associated with sound pressure, air overpressure and ground-borne vibration generated by Range Activities. Human responses associated with the non-auditory adverse effects of noise and vibration including disturbance, annoyance and sleep disturbance fall outside the scope of the review.
2.1.5 The findings of the research are presented in full in Southdowns report ‘Criteria for the Assessment of Potential Building Damage Effects from Military Test Activities’ - reference [2].
Building Damage Thresholds
2.2.1 The findings of the independent review have been used to establish relevant thresholds for the onset of building damage for ground-borne vibration and air overpressure. The thresholds, presented in Table 2.1 and Table 2.2 for ground-borne vibration and air overpressure respectively, have been adopted for the main study, to assess the potential effects from Range Activities, on properties and their occupants in the vicinity of Pendine Range.

51897m-SEC-00168-05 5 June 2016
TRANSIENT VIBRATION THRESHOLDS FOR THE ON-SET OF COSMETIC DAMAGE
TYPE OF BUILDING MAXIMUM
DISPLACEMENT
PEAK COMPONENT PARTICLE VELOCITY IN FREQUENCY RANGE OF
PREDOMINANT PULSE
Less than 4 Hz
Less than 4Hz
4 Hz to 15 Hz 15 Hz and
above
Reinforced or framed structures Industrial and heavy commercial
buildings - -
50 mms-1 at 4 Hz and above
Unreinforced or light framed structures. Residential or light
commercial type
0.6 mm zero to peak
-
15 mms-1 at 4 Hz increasing to 20 mms-1 at
15 Hz
20 mms-1 at 15 Hz
increasing to 50 mms-1 at 40 Hz and
above
Precautionary Thresholds
Adopted
Any building
0.6 mm zero to peak
12.5 mms-1
Vulnerable Structures
6 mms-1
TABLE 2.1: GROUND-BORNE VIBRATION THRESHOLDS FOR ON-SET OF COSMETIC DAMAGE TO BUILDINGS
Notes: [1] – further information on the derivation of these values is provided in Reference [2].
Air Overpressure Threshold Scale
dB LZpeak Categorisation
180 Onset of structural damage
171 General window breakage
151 Some window breakage
140 Reasonable threshold to prevent glass and plaster damage
134 USBM ‘Safe’ maximum
120 Secondary vibration effects including rattling windows and objects
TABLE 2.2: AIR OVERPRESSURE THRESHOLDS FOR DAMAGE AND OTHER EFFECTS ON BUILDING STRUCTURES
Notes: [1] – further information on the derivation of these values is provided in Reference [2].
The Control of Noise at Work Regulations 2005
2.3.1 In addition to the consideration of potential damage to building structures, the study has also considered the potential for Range Activities to exceed statutory limits, which include the

51897m-SEC-00168-05 6 June 2016
thresholds set out in the Control of Noise at Work Regulations 2005, as referenced in the Pendine SRD [1].
2.3.2 The Control of Noise at Work Regulations 2005 (CNWR) [3] came into effect on the 6th April 2006 and describe the various obligations on employers and employees to ensure that the risk of hearing damage in the workplace is minimised. The Regulations are based around two action levels and an exposure limit value, which are reproduced in Table 2.3.
Lower exposure action values daily or weekly personal exposure of 80 dB(A)[1]
peak sound pressure of 135 dB(C)[2]
Upper exposure action values daily or weekly personal exposure of 85 dB(A) [1]
peak sound pressure of 137 dB(C) [2]
Exposure limit values daily or weekly personal exposure of 87 dB(A) [1]
peak sound pressure of 140 dB(C) [2]
TABLE 2.3: SUMMARY OF ACTION AND EXPOSURE LIMIT VALUES FROM THE CNWR 2005 Notes: [1] - The daily or weekly personal exposure is the level of exposure to noise of a person, averaged over a working day or week; and [2] - The peak sound pressure is the maximum value of the C-weighted sound pressure, to which a person is exposed during the working day.
2.3.3 The above action values and exposure limits are used to determine the risk to hearing and
when action should be taken to reduce an employee's exposure to noise.

51897m-SEC-00168-05 7 June 2016
3. MONITORING METHODOLOGY
Study Location
3.1.1 The MOD Pendine Land Range is located on the southwest coast of Wales, approximately 12 miles southwest of the town of Carmarthen. It provides the MOD with a key facility for test, evaluation and training support activities and is the UK and NATO European Regional Test Centre (ERTC) and is a recognised facility for the accreditation of small arms and cannon ammunition.
3.1.2 The Range covers a land area of approximately 20 km2 which includes a 9 km section of shoreline with the sea danger area stretching over approximately 18 km2. It also includes an Air Danger Area which extends up to 23,000 ft.
3.1.3 The Pendine Land Range is divided into three areas; West, Central and East. The separate areas have different facilities, sub divided into smaller individual test site areas, providing a total of 18 available Ranges.
3.1.4 The central section of the Range features a 1500m Long Test Track (LTT) facility which allows for high-speed dynamic trials.
3.1.5 The eastern end of the Range consists of long range small arms and static trial ranges, including a smaller test track, although it is understood to be rarely utilised.
Site Selection Process
3.2.1 Locations for the monitoring study were selected on the basis of both acoustic and non-acoustic considerations, having regard to appropriate published guidance documents. The practicalities of installing, securing and maintaining the monitoring equipment were also key considerations.
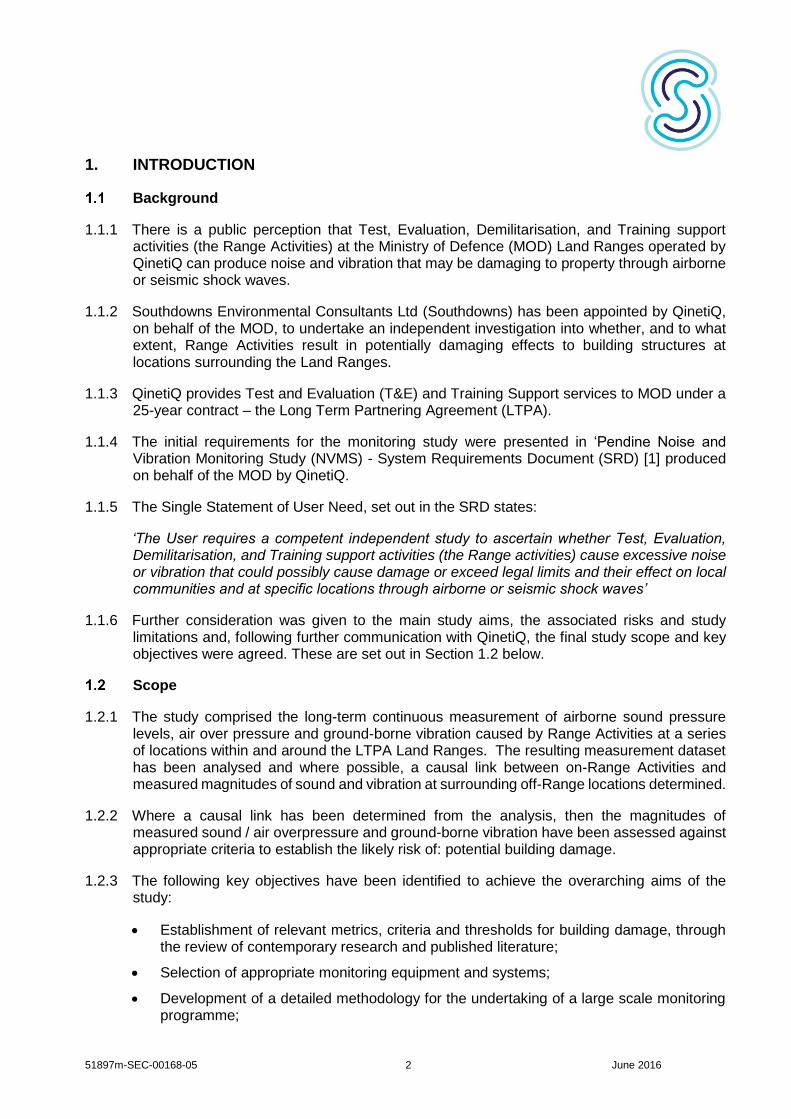
3.2.2 Following the completion of the site selection process, 10 off-Range locations and 2 on-Range locations were selected. The monitoring locations are presented in Table 3.1 overleaf and Figure A1 of Appendix A.
3.2.3 Full details of the site selection process for the monitoring locations are provided in Volume 2 – Technical Appendices: Detailed Methodology [4].
51897m-SEC-00168-05 8 June 2016
Monitoring Location Identification Code
Area /Region
Approximate Distance to Range (PEN_R1) (km)
PEN_R1 On-Range N/A
PEN_R2 On-Range N/A
PEN_OS1 Laugharne 3.7
PEN_OS2 Laugharne 0.6
PEN_OS3 Laugharne 3.1
PEN_OS4 Laugharne 4.0
PEN_OS5 Llanstephan 6.2
PEN_OS6 Ferryside 8.0
PEN_OS7 Kidwelly 7.8
PEN_OS8 Ferryside 11.8
PEN_OS9 Plashett 1.9
PEN_OS10 Pendine 5.6
TABLE 3.1: MONITORING LOCATIONS
Selected Monitoring Equipment
3.3.1 The selected monitoring equipment deployed for the main study was based on the SINUS Samurai monitoring system. The system comprises an industrial PC running Windows 7 and features a synchronous triggering function which has allowed for simultaneous triggering between separate monitoring locations. Data collected during the monitoring study was stored locally on Solid State Drives (SSD) installed within each of the monitoring stations, and then uploaded to a dedicated secure central data server on a daily basis via a File Transfer Protocol (FTP).
3.3.2 Each monitoring station comprised of:
SINUS Swing 4-channel noise and vibration monitoring station; and
Uninterruptible Power Supply (UPS) system (up to 48 hours of power backup).
3.3.3 Connected accessories to each of the SINUS noise and vibration monitoring station include:
G.R.A.S. 41CN Outdoor Microphone System;
SINUS tri-axial geophone;
Garmin Global Positioning System (GPS) receiver; and
Thies Clima Sensor (at selected monitoring locations).
Synchronous Detection Technique
3.4.1 A feature of the monitoring system deployed was the use of a GPS clock to synchronise the time base across all monitoring systems at both on-Range and off-Range locations. Combined with this was the use of a networked synchronous triggering system which allowed for simultaneous triggering between on-Range, and all off-Range monitoring locations. To ensure data capture, the trigger threshold for all three on-Range monitors was set at 75 dB LpAF. When this trigger level, at one of the on-Range monitors was exceeded, a trigger command was transmitted to the off-Range monitoring systems via the internet,

51897m-SEC-00168-05 9 June 2016
which allowed for data to be captured at the monitoring locations at the precise time of an on-Range Activity occurrence. In addition to the main triggering system, each off-Range monitor was also configured to trigger following a localised (non Range related) noise event.
3.4.2 A 5 second pre-trigger audio capture, followed by a post trigger audio capture of 30 seconds was set up for the on-Range systems. The off-Range monitors were set with a 5 second pre-trigger capture, followed by a post-trigger capture of audio for up to 120 seconds, which allowed for small delays implicit in the triggering system and also delays expected due to the propagation of air overpressure and/or ground-borne vibration over the longer distances involved. The hardware was programmed to ensure that any trigger activity was captured from both the microphone and geophone sensors simultaneously, to allow side by side comparison of sound pressure and ground-borne vibration in the time domain.
3.4.3 The introduction of a synchronised time base and networked triggering system allowed for a clear link to be established between on-Range Activities and magnitudes of sound / air overpressure and vibration at off-Range locations, which is a principle aim of the monitoring study. An overview of the synchronous trigger system process is displayed graphically in Figure A2 of Appendix A.
3.4.4 Full details of the monitoring equipment and data management systems are provided in Volume 2 – Technical Appendices: Detailed Methodology [4].

51897m-SEC-00168-05 10 June 2016
4. MONITORING SUMMARY
Summary of Range Activities and Data Capture
4.1.1 The full Pendine Range firing records, as provided by QinetiQ Ltd between 3rd November 2014 and 3rd May 2015 are presented in Volume 3: Technical Appendices – Results [5].
4.1.2 During the monitoring study, there were a total of 3,282 events which triggered the on-Range monitors (1,719 captured by PEN_R1 and 1,563 captured by PEN_R2).
4.1.3 Of the 3,282 triggered events, 3,149 were attributable to non-firing activities on the Range including local vehicle movements, wind noise on the microphone, local maintenance works, Range alarms and vehicle sirens.
4.1.4 Of the 133 (3,282 – 3,149) Range triggered events, 30 triggered more than one of the on-Range monitors, capturing a total of 103 individual Range Activities.
4.1.5 The trials undertaken on the Range during the monitoring period were categorised as Static activities, Dynamic activities, Small Arms & Cannon Fire and ‘Military’ training.
4.1.6 The ‘Small Arms & Cannon Fire’ and ‘Military’ training activities were considered unlikely to trigger the on-Range monitoring systems. Playback of the audio waveform indicated that triggered activities which occurred during notified ‘Small Arms & Cannons Trials’ and ‘Military’ training activities were in fact attributable to extraneous activities (including vehicle movements and wind noise on the microphone) and therefore these activities have been excluded from further consideration in this study accordingly.
4.1.7 During the monitoring study, the Range logs recorded a total of 149 Static and Dynamic Activities were expected to trigger the on-Range monitoring systems, with 149 individual activities recorded, of these, 46 (149 – 103) were not captured by Range monitors.
4.1.8 Of the 46 Range Activities not captured by the on-Range monitors, 42 were not captured because they did not exceed the trigger threshold level (TNE), whilst 4 were not captured due to equipment outages.
4.1.9 Of the 103 individual triggered Range Activities, the number captured at an individual off-Range monitor ranged between 89 and 66, as displayed in Table 5.1 below. The number of Range Activities not captured at an off-Range location was influenced by a variety of reasons including: unforeseen delays in installing the ADSL services at off-Range locations, previously agreed hosts deciding to withdraw from the monitoring study, ADSL outages and on-Range network outages.
4.1.10 The on-Range network outages were responsible for 13 Range Activities not being captured at off-Range locations between 13th and 15th January 2016. Following a review of the Range firing logs as presented in Volume 3: Technical Appendices – Results, it is noted that the type and size of the 13 Range Activities not captured are considered to be typical Range Activities, and are therefore represented by other activities captured during the study.
4.1.11 Where the on-Range monitors were not triggered it was found that the off-Range monitors were also not triggered locally by sound / air overpressure from the Range Activity.

51897m-SEC-00168-05 11 June 2016
4.1.12 A summary of the quantities of captured on-Range and off-Range Activities during the monitoring study is presented in Table B1 of Appendix B.
Summary of Data Capture
4.2.1 Full details of scheduled equipment maintenance works (including telecommunications and data management system maintenance) and known system outages experienced during the monitoring study are presented in Volume 2- Technical Appendices – Detailed Methodology [4], whilst Tables B2 to B7 of Appendix B provide summarised schedules of Range Activities captured at each of the individual off-Range monitoring locations respectively.

51897m-SEC-00168-05 12 June 2016
5. RESULTS AND DISCUSSION
Introduction
5.1.1 The dataset collected during the monitoring study has been processed, using appropriate methodologies and statistical techniques, to determine causal links and to assess the magnitude of the measured values. These methodologies and techniques are described in full in Volume 2 – Technical Appendices – Detailed Methodology [4], which includes worked examples of a selection of confirmed Range Activities captured during the monitoring study. In addition, examples of non-Range (or ‘extraneous’) activities are presented to enable a direct comparison with those known to be associated with Range Activities.
5.1.2 Section 5.2 below presents a summary of the testing undertaken to test for any causal link between on-Range and off-Range triggered activities, while Section 5.3 presents a summary of the results for the on-Range and off-Range triggered activities and a summary of activities concluded not to be associated with the Range.
5.1.3 The full study results for sound pressure / air overpressure and vibration including time histories, sound spectrograms and calculated statistical results are presented in Volume 3 –Technical Appendices – Results [5].
Test for Causal Link
5.2.1 The classification of the test for a causal link used herein provides a measure of the probability that an activity at a primary location has given rise to a measured response at a secondary location.
5.2.2 Automated signal processing techniques were used to determine an initial indication of causality at all monitoring locations for all captured Range Activities. The magnitude of causality presented in the results has been categorised accordingly:
positive causality (PC) – statistical evidence indicates a reasonable likelihood that an on-Range Activity has caused an off-Range effect (i.e. probable causality);
uncertain causality (UC) – insufficient statistical evidence to confirm that the on-Range Activity has caused an off-Range effect (i.e. possible causality);
no causality (NC) – little or no statistical evidence to suggest that the on-Range Activity has caused an off-Range effect (i.e. unlikely causality).
5.2.3 Activities which fall into positive causality (PC) have been included in the data set for assessing magnitudes of sound / air overpressure at off-Range locations, as it is accepted that the measured effect is most likely to be due to Range Activities.
5.2.4 Activities which fall into the uncertain causality (UC) category have also been included in the assessment nevertheless, as it is accepted that the measured effect could be due to Range Activities.
5.2.5 For activities which identified no causality (NC) following the initial application of the signal processing techniques, further manual analytical interrogation of the data set was applied in each case to determine whether a causal link could be established.

51897m-SEC-00168-05 13 June 2016
5.2.6 Where causality was subsequently established, the individual Range Activities were included in the assessment of sound / air overpressure magnitudes from Range Activities.
5.2.7 A summary of the distribution of confirmed Range Activities detected at the off-Range monitoring locations is presented graphically in Figure A3 in Appendix A, which identifies the proportion of the activities that have been assessed to have: positive, uncertain or no causality. These results are also tabulated in Table 5.1.
Off-Range Location
Total On-Range
Activities[1] Captured
Total Off-Range
Activities[1] Captured
No. of Activities Captured % Activities Captured
No
Ca
us
ali
ty
Un
ce
rta
in C
au
sa
lity
Po
sit
ive C
au
sali
ty
No
Ca
us
ali
ty
Un
ce
rta
in C
au
sa
lity
Po
sit
ive C
au
sali
ty
PEN_OS1 103 88 10 18 60 11% 20% 69%
PEN_OS2 103 89 9 17 63 10% 19% 71%
PEN_OS3 103 81 7 10 64 9% 12% 79%
PEN_OS4 103 74 10 15 49 14% 20% 66%
PEN_OS5 103 89 8 13 68 9% 15% 76%
PEN_OS6 103 87 7 15 65 8% 17% 75%
PEN_OS7 103 80 10 22 48 13% 28% 59%
PEN_OS8 103 87 9 14 64 10% 16% 74%
PEN_OS9 103 69 12 17 40 17% 25% 57%
PEN_OS10 103 78 12 32 34 15% 41% 44%
TABLE 5.1: DISTRIBUTION OF ACTIVITIES INTO CAUSAL CATEGORIES Notes:
[1] number of individual static and dynamic activities captured.
5.2.8 The results indicate that Range Activities which showed ‘No-Causality’ varied between 8% (PEN_OS6) and 17% (PEN_OS9) across the individual off-Range monitoring locations, when using a combination of signal processing techniques and manual interrogation of the data set.
5.2.9 Between 44% (PEN_OS10) and 79% (PEN_OS3) of the confirmed on-Range Activities have been classified as ‘Positive Causality’ across all of the off-Range monitoring locations.
5.2.10 The off-Range monitoring location where the highest number of activities were categorised as ‘Uncertain Causality’ was at PEN_OS10.
5.2.11 The lower confirmed causality at PEN_OS10 is most likely to be due to a combination of meteorological effects (including the effects of the prevailing wind direction) as it is the only monitoring location to the west of the Range.
5.2.12 PEN_OS3 is shown to exhibit the lowest proportion of ‘Uncertain Causality’ whilst the number of ‘No Causality’ activities is similar to a number of other off Range locations.

51897m-SEC-00168-05 14 June 2016
5.2.13 The study has therefore identified a confirmed causal link between Range Activities and measured effects at off-Range monitoring locations, for up to 79% of the triggered Range Activities. So this means if those activities falling into the ‘Uncertain Causality’ category are included for a cautious assessment then up to 91% (PEN_OS3) of the on-Range Activities show a causal link at off-Range monitoring locations. Activities falling into the ‘No Causality’ category have not been included in the assessment.
Sound / Air Overpressure and Vibration Magnitudes
5.3.1 The dataset (Positive and Uncertain Causality) has been processed to calculate absolute sound / air overpressure and vibration values both on-Range and off-Range monitoring locations.
5.3.2 The sound / air overpressure and vibration levels measured at PEN_OS1 to PEN_OS10, which are directly attributable to on-Range Activities are presented fully in Volume 3: Technical Appendices – Results [5].
5.3.3 Sound / air overpressure levels are presented graphically in Figures A4 to A33 of Appendix A and summarised in Tables B2 to B7 of Appendix B
Summary of Range Activity Results
5.3.4 The results indicate that the highest Z-weighted (or linear) sound pressure level resulting from a static Range Activity, measured at an off-Range location during the monitoring study was 134 dB LZpeak, which was measured at the PEN_OS3. This falls below the adopted study threshold to prevent glass and plaster damage of 140 dB LZpeak, by approximately 6 dB.
5.3.5 The highest c-weighted sound pressure level from a static Range Activity, measured at an off-Range location was 127dB LCpeak, which falls below the CNWR lower exposure action value of 135 dB LCpeak.
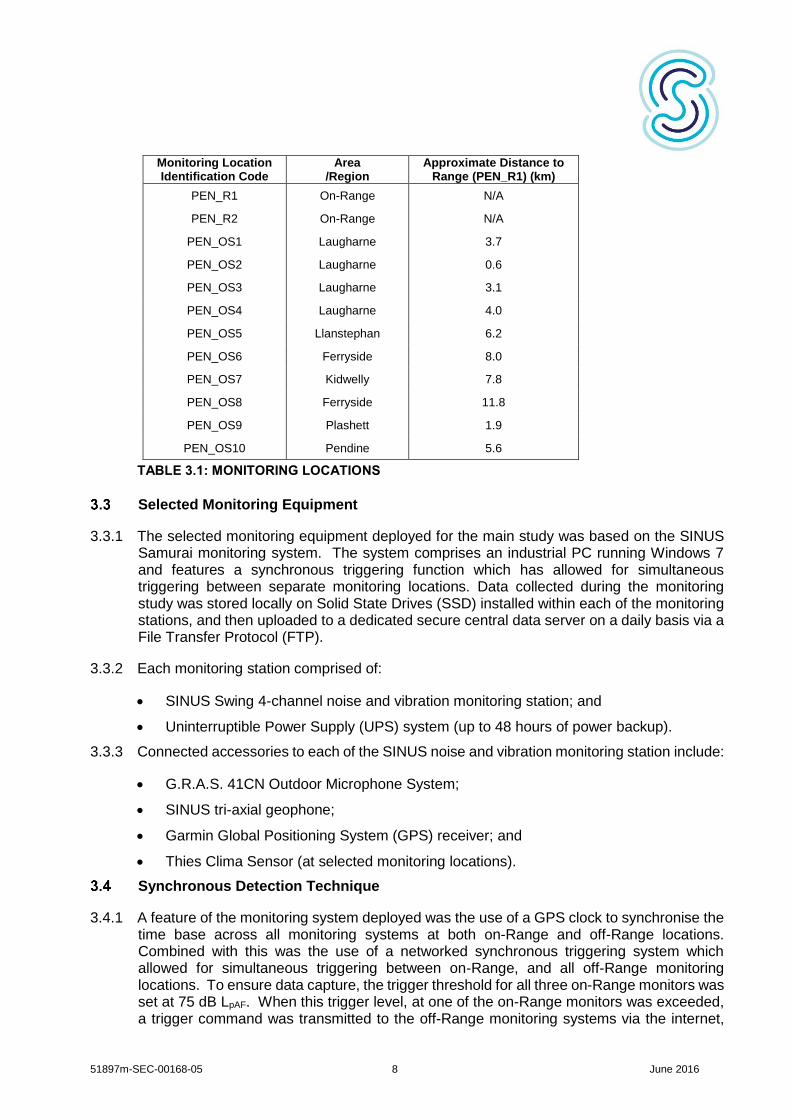
5.3.6 The results also indicate that the highest sound pressure level from a dynamic Range Activity, measured at an off-Range location during the monitoring study was 124 dB LZpeak, which was measured at PEN_OS2. This is above the threshold at which secondary vibration effects may occur but falls below all the building damage thresholds presented in Table 2.2.
5.3.7 Detailed analysis of the results has shown that the vibration signals captured at off-Range locations arrived at a similar time to the sound pressure waves, indicating that the vibration generated by Range Activities at off-Range locations was a result of a coupling effect between the sound / air overpressure wave and the ground at the point of measurement, rather than from direct ground-borne propagation of vibration from the source of Range Activity. An example of this is shown graphically in Figure A36 of Appendix A for PEN_OS2 with the signal arriving around 7 seconds after the on-Range event was triggered. If the measured vibration was associated with ground-borne propagation then a pronounced difference in arrival times would be observed with the vibration signal arriving in advance of the sound pressure signal. Further details are provided in Volume 2 – Technical Appendices – Detailed Methodology, Chapter 4 [4].
5.3.8 Notwithstanding that the vibration measured is considered to be attributable to the air overpressure coupling (as opposed to ground-borne vibration), the highest component

51897m-SEC-00168-05 15 June 2016
velocity level measured at an off-Range location during the static Range Activities was 0.87 mms-1, which was measured on the z-axis at PEN_OS3. This falls considerably below the ground-borne vibration thresholds for the on-set of cosmetic damage as set out in Table 2.1.
5.3.9 Table B11 of Appendix B presents the distribution of maximum component velocities per each orthogonal axis. A total of 51% of events across all monitoring stations (Range and Off-Range) observed a maximum velocity level on the z-axis (vertical) compared to 33% on the y-axis and 16% on the x-axis.
5.3.10 A vibration level of 3.65 mms-1 was measured at PEN_OS7 during a static Range Activity, however, further interrogation of the data set revealed that this was due to localised activity which occurred during the same time period.
5.3.11 The highest vibration level measured at an off-Range location during the dynamic Range Activities was 0.29 mms-1, which was measured at PEN_OS2. This falls considerably below the ground-borne vibration thresholds for the on-set of cosmetic damage as set out in Table 2.1.
5.3.12 The maximum displacement levels for both static and dynamic activities fell below the threshold of 0.6 mm zero to peak at frequencies below 4 Hz, with the highest measured level being 0.01 mm. A displacement level of 0.06 mm was measured at PEN_OS7, however this was not found to be as a consequence of a Range Activity.
Summary of Off-Range Locally Triggered Activities
5.3.13 A summary of locally triggered measurements (triggered activities not associated with Range Activities e.g. birdsong, aircraft, road traffic) are presented in Volume 3: Technical Appendices – Results [5]. The table presents the highest LCpeak, LZpeak and PPV values measured at each off-Range monitoring location between 3rd November 2014 and 31st May 2015.
5.3.14 The results indicate that the highest number of off-Range triggered activity caused by local activities was 1,121, at PEN_OS8. These were mainly attributable to the close proximity of the property to the West Wales railway line, confirmed by audio playback of the triggered activities.
5.3.15 The lowest number of off-Range triggered activities which were caused by local activity was 11, at PEN_OS9.
5.3.16 The highest level measured at any off-Range location, which occurred as a result of localised activity was 135.7 dB LZpeak, which was measured at PEN_OS1 and was confirmed to be attributable to local fireworks.
5.3.17 Fireworks were also responsible for the highest measured levels at PEN_OS4, PEN_OS7, PEN_OS8 and PEN_OS 10.
5.3.18 The highest vibration levels measured as a result of off-Range local activity ranged from 0.00034 mms-1 at PEN_OS6 to 0.90 mms-1, at PEN_OS10.

51897m-SEC-00168-05 16 June 2016
Meteorological Data
5.4.1 Meteorological monitoring data was collated at the following five monitoring locations during the monitoring study:
PEN_R1, On-Range;
PEN_OS4, Laugharne;
PEN_OS6, Ferryside;
PEN_OS7, Kidwelly; and
PEN_OS10, Pendine.
5.4.2 The results of the meteorological monitoring data including wind speed (ms-1), wind direction, air temperature (°C), relative humidity (%), atmospheric pressure (mBar) and rain rate (mm/h) for each of the five locations gathered during the monitoring study are presented fully in Volume 3 -Technical Appendices – Results [5].
5.4.3 The results of the meteorological data collated at the On-Range location (PEN_R1) during the monitoring study are summarised in Table B8 of Appendix B and discussed in the following sub-sections.
5.4.4 Wind speeds measured On-Range during the Range Activities presented in this report were found to average 3.7 ms-1 with maximum and minimum levels of 14.8 ms-1 and 0.2 ms-1
respectively.
5.4.5 The average air temperature measured on-Range during the Range Activities presented in this report was 7.3°C with maximum and minimum levels of 14.7 °C and 0.9°C respectively.
5.4.6 The average relative humidity measured on-Range during the Range Activities presented in this report was 83.9% with maximum and minimum levels of 100 % and 59.6 % respectively.
5.4.7 The average rain rate measured on-Range during the Range Activities presented in this report was 0.3 mm/h with maximum and minimum levels of 10.9 mm/h and 0.0 mm/h
respectively.
5.4.8 A review of the meteorological data presented in Volume 3 -Technical Appendices – Results [5] indicates Range Activity data capture has occurred under a range of meteorological conditions over a six month period, including conditions which are likely to have enhanced sound pressure propagation over large distances.

51897m-SEC-00168-05 17 June 2016
6. CONCLUSIONS
6.1.1 The sound pressure level and vibration monitoring commenced in the vicinity of the Pendine Range on 3rd November 2014 for a period of 6 months at 10 no. off-Range monitoring locations. In addition, 2 no. on-Range monitoring systems were installed within the confines of the MOD Pendine Land Range. The monitoring equipment was set-up with a synchronised triggering system which enabled simultaneous triggering between the on-Range and off-Range monitoring locations, allowing data capture at the off-Range monitoring locations at the precise time of an activity at the Range.
6.1.2 Activity data capture has occurred under a range of meteorological conditions over a six month period, including conditions which are likely to have enhanced sound pressure propagation over large distances.
6.1.3 In total, 103 individual static and dynamic Range Activities were captured by the on-Range monitors. Of these, the maximum number of activities captured at a single off-Range location was 89, whilst the minimum was 66 at another.
6.1.4 Analytical and statistical functions were developed to analyse the recorded signals captured to determine whether a causal link exists between activities occurring on-Range and the signals captured at off-Range locations.
6.1.5 The study has tested and confirmed a ‘probable’ causal link between Range Activities and measured effects at off-Range monitoring locations, for up to 79% of the triggered activities. If those activities also falling into the ‘possible’ causal link category are included, then up to 91% (PEN_OS3) of the Range Activities would confirm a causal link at off-Range monitoring locations.
6.1.6 The results of the study indicate, 96 % (N = 822) of the Range Activity data points captured at off-Range monitoring locations remained below the adopted study threshold for secondary vibration effects including ratting of objects of 120 dB LZpeak.
6.1.7 Of the remaining 4% (N = 33), the highest measured sound pressure level at an off-Range location which was attributable to a Range Activity was 134 dB LZpeak. This falls below the adopted study threshold to prevent glass and plaster damage of 140 dB LZpeak.
6.1.8 There is no evidence of appreciable ground-borne vibration (propagation of vibration through the ground) being received at any of the off-Range monitoring locations.
6.1.9 Vibration measured as a result of the coupling between the air overpressure and the ground did not exceeded the ground-borne vibration thresholds adopted for this study for the on-set of cosmetic damage at any off-Range locations.
6.1.10 Whilst not considered to be directly relevant in cases where vibration propagated through the ground is minimal or absent, nor when building damage risk is the sole consideration, the maximum level at any location also does not exceed the threshold of 134 dB LZpeak recommended by the USBM for blasting regime design purposes as a ‘safe’ maximum.
6.1.11 None of the measurements that relate to confirmed Range Activity at off-Range locations exceeded the lower action value of 135 dB LCpeak, set out in The Control of Noise at Work Regulations 2005.

51897m-SEC-00168-05 18 June 2016
6.1.12 The magnitudes of sound / air overpressure and vibration resulting from the on-Range Activities catalogued during the monitoring period are unlikely to have resulted in damage to building structures at locations surrounding the Range when compared to the thresholds derived and adopted for this study.
6.1.13 The Range Activities observed during the study period have been described by QinetiQ as being representative of typical activities undertaken on the Pendine Range, relating to scheduling, type, size and frequency of firing.
6.1.14 As such, based upon consideration of the data gathered and assessment thresholds derived, the continuation of Range Activities under the same conditions of operation and management by QinetiQ, would lead to the conclusion that any building damage as a result of activities at the Pendine Range is improbable.

51897m-SEC-00168-05 19 June 2016
7. REFERENCES
1. A.K. Waters. 2012 Pendine Noise & Vibration Monitoring Study (NVMS), System Requirements Document. QINETIQ/12/02298/1.0/ 2012.
2. Southdowns Environmental Consultants Ltd. 2016. Criteria for the Assessment of Potential Building Damage Effects from Range Activities. 1897m-SEC-00151-03.
3. Controlling Noise at Work (2005). The Control of Noise at Work Regulations 2005. Guidance on Regulations
4. Southdowns Environmental Consultants Ltd. 2016. Volume 2 – Technical Appendices: Detailed Methodology. 1897m-SEC-00168-04.
5. Southdowns Environmental Consultants Ltd. 2016. Volume 3: Technical Appendices – Results. 1897m-SEC-00168-04.

APPENDIX A: FIGURES

FIGURE A1: MONITORING LOCATIONS
PEN_R1
PEN_OS1
PEN_OS10
PEN_OS2
PEN_OS4
PEN_OS3
PEN_OS8
PEN_OS6
PEN_OS7
PEN_OS9
PEN_OS5
Key
Noise & Vibration Monitoring Station Noise, Vibration & Meteorological Station
PEN_R2

FIGURE A2: SYNCHRONOUS TRIGGER SYSTEM PROCESS

FIGURE A3: DISTRIBUTION OF ACTIVITIES INTO CAUSAL CATEGORIES Notes:
[1] total number of Range Activities captured at each off-Range monitoring location represented by black markers; [2] ‘No Causality’ or NC represented by blue bars [3] ‘Uncertain Causality’ or UC represented by orange bars; [4] ‘Positive Causality’ or PC represented by grey bars.
0
10
20
30
40
50
60
70
80
90
100
PEN_OS1 PEN_OS2 PEN_OS3 PEN_OS4 PEN_OS5 PEN_OS6 PEN_OS7 PEN_OS8 PEN_OS9 PEN_OS10
No.
Of
Events
Monitoring Location
No. Events in Causal Category NC
No. Events in Causal Category CU
No. Events in Causal Category PC
Total Events

FIGURE A4: SUMMARY OF LZPEAK VALUES, PEN_OS1, LAUGHARNE, 3RD NOVEMBER 2014 – 3RD MAY 2015 Note: Highest daily levels presented

FIGURE A5 : SUMMARY OF LCPEAK VALUES, PEN_OS1, LAUGHARNE, 3RD NOVEMBER 2014 – 3RD MAY 2015 Note: Highest daily levels presented

FIGURE A6: SUMMARY PPV VALUES, PEN_OS1, LAUGHARNE, 3RD NOVEMBER 2014 – 3RD MAY 2015 Note: Highest daily levels presented
0
0.5
1
1.5
2
2.5
3
3.5
4
4.5
5
5.5
6
6.5
710/1
1/2
014
17/1
1/2
014
24/1
1/2
014
01/1
2/2
014
08/1
2/2
014
15/1
2/2
014
22/1
2/2
014
29/1
2/2
014
05/0
1/2
015
12/0
1/2
015
19/0
1/2
015
26/0
1/2
015
02/0
2/2
015
09/0
2/2
015
16/0
2/2
015
23/0
2/2
015
02/0
3/2
015
09/0
3/2
015
16/0
3/2
015
23/0
3/2
015
30/0
3/2
015
06/0
4/2
015
13/0
4/2
015
20/0
4/2
015
27/0
4/2
015
Pe
ak C
om
po
ne
nt P
art
icle
Ve
locity, m
m/s
Event Date
PEN_OS1, Laugharne
PPV
VulnerableStructures CosmeticDamage LowerThreshold

FIGURE A7 : SUMMARY OF LZPEAK VALUES, PEN_OS2, LAUGHARNE, 3RD NOVEMBER 2014 – 3RD MAY 2015 Note: Highest daily levels presented

FIGURE A8 : SUMMARY OF LCPEAK VALUES, PEN_OS2, LAUGHARNE, 3RD NOVEMBER 2014 – 3RD MAY 2015 Note: Highest daily levels presented
FIGURE A9 : SUMMARY PPV VALUES, PEN_OS2, LAUGHARNE, 3RD NOVEMBER 2014 – 3RD MAY 2015 Note: Highest daily levels presented
0
0.5
1
1.5
2
2.5
3
3.5
4
4.5
5
5.5
6
6.5
7
10/1
1/2
014
17/1
1/2
014
24/1
1/2
014
01/1
2/2
014
08/1
2/2
014
15/1
2/2
014
22/1
2/2
014
29/1
2/2
014
05/0
1/2
015
12/0
1/2
015
19/0
1/2
015
26/0
1/2
015
02/0
2/2
015
09/0
2/2
015
16/0
2/2
015
23/0
2/2
015
02/0
3/2
015
09/0
3/2
015
16/0
3/2
015
23/0
3/2
015
30/0
3/2
015
06/0
4/2
015
13/0
4/2
015
20/0
4/2
015
27/0
4/2
015
Pe
ak C
om
po
ne
nt P
art
icle
Ve
locity, m
m/s
Event Date
PEN_OS2, Laugharne
PPV
VulnerableStructures CosmeticDamage LowerThreshold

FIGURE A10 : SUMMARY OF LZPEAK VALUES, PEN_OS3, LAUGHARNE, 3RD NOVEMBER 2014 TO 3RD MAY 2015 Note: Highest daily levels presented

FIGURE A11 : SUMMARY OF LCPEAK VALUES, PEN_OS3, LAUGHARNE, 3RD NOVEMBER 2014 – 3RD MAY 2015 Note: Highest daily levels presented
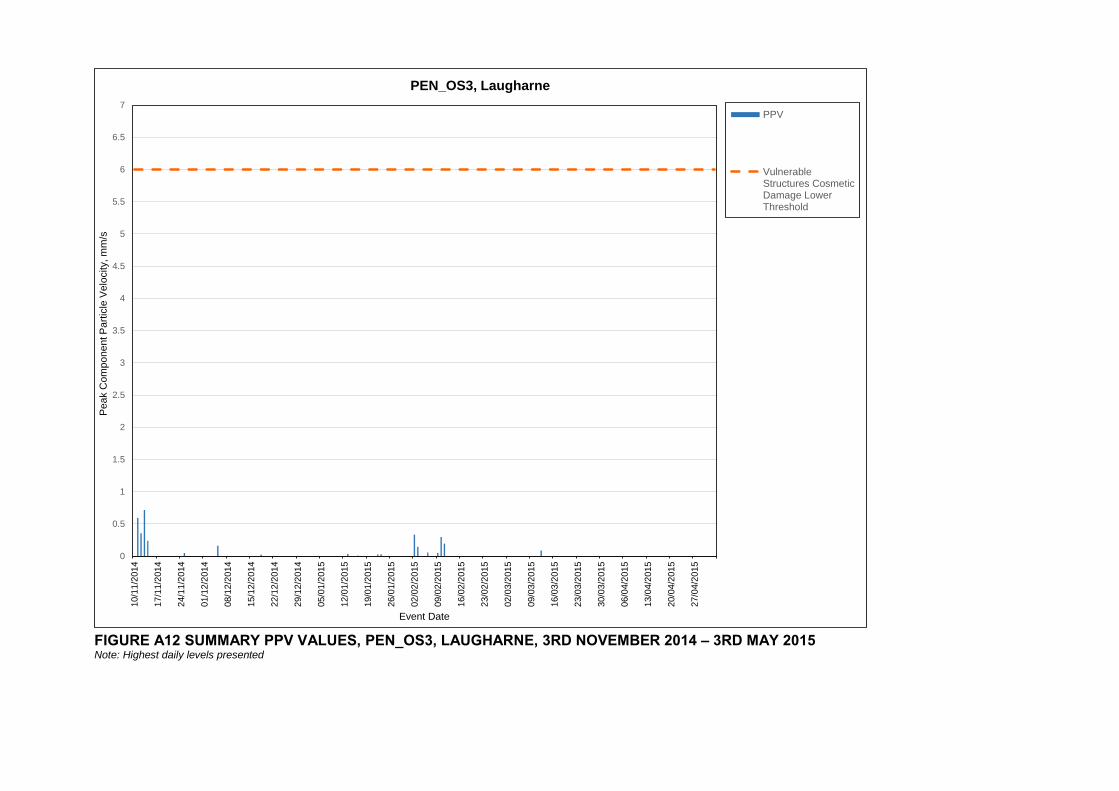
FIGURE A12 SUMMARY PPV VALUES, PEN_OS3, LAUGHARNE, 3RD NOVEMBER 2014 – 3RD MAY 2015 Note: Highest daily levels presented
0
0.5
1
1.5
2
2.5
3
3.5
4
4.5
5
5.5
6
6.5
7
10/1
1/2
014
17/1
1/2
014
24/1
1/2
014
01/1
2/2
014
08/1
2/2
014
15/1
2/2
014
22/1
2/2
014
29/1
2/2
014
05/0
1/2
015
12/0
1/2
015
19/0
1/2
015
26/0
1/2
015
02/0
2/2
015
09/0
2/2
015
16/0
2/2
015
23/0
2/2
015
02/0
3/2
015
09/0
3/2
015
16/0
3/2
015
23/0
3/2
015
30/0
3/2
015
06/0
4/2
015
13/0
4/2
015
20/0
4/2
015
27/0
4/2
015
Pe
ak C
om
po
ne
nt P
art
icle
Ve
locity, m
m/s
Event Date
PEN_OS3, Laugharne
PPV
VulnerableStructures CosmeticDamage LowerThreshold

FIGURE A13 : SUMMARY OF LZPEAK VALUES, PEN_OS4, LAUGHARNE, 3RD NOVEMBER 2014 TO 3RD MAY 2015 Note: Highest daily levels presented

FIGURE A14 : SUMMARY OF LCPEAK VALUES, PEN_OS4, LAUGHARNE, 3RD NOVEMBER 2014 – 3RD MAY 2015 Note: Highest daily levels presented
30
35
40
45
50
55
60
65
70
75
80
85
90
95
100
105
110
115
120
125
130
135
140
145
150
155
160
165
170
175
180
18510/1
1/2
014
17/1
1/2
014
24/1
1/2
014
01/1
2/2
014
08/1
2/2
014
15/1
2/2
014
22/1
2/2
014
29/1
2/2
014
05/0
1/2
015
12/0
1/2
015
19/0
1/2
015
26/0
1/2
015
02/0
2/2
015
09/0
2/2
015
16/0
2/2
015
23/0
2/2
015
02/0
3/2
015
09/0
3/2
015
16/0
3/2
015
23/0
3/2
015
30/0
3/2
015
06/0
4/2
015
13/0
4/2
015
20/0
4/2
015
27/0
4/2
015
Pre
ssu
re L
eve
l, L
Cp
ea
kd
B r
e.
2 x
10
-5P
a
Event Date
PEN_OS4, Laugharne
Static Event
Dynamic Event
Lower CNWR ActionValue
Upper CNWR ActionValue
CNWR ExposureLimit

FIGURE A15 : SUMMARY PPV VALUES, PEN_OS4, LAUGHARNE, 3RD NOVEMBER 2014 – 3RD MAY 2015 Note: Highest daily levels presented
0
0.5
1
1.5
2
2.5
3
3.5
4
4.5
5
5.5
6
6.5
7
10/1
1/2
014
17/1
1/2
014
24/1
1/2
014
01/1
2/2
014
08/1
2/2
014
15/1
2/2
014
22/1
2/2
014
29/1
2/2
014
05/0
1/2
015
12/0
1/2
015
19/0
1/2
015
26/0
1/2
015
02/0
2/2
015
09/0
2/2
015
16/0
2/2
015
23/0
2/2
015
02/0
3/2
015
09/0
3/2
015
16/0
3/2
015
23/0
3/2
015
30/0
3/2
015
06/0
4/2
015
13/0
4/2
015
20/0
4/2
015
27/0
4/2
015
Pe
ak C
om
po
ne
nt P
art
icle
Ve
locity, m
m/s
Event Date
PEN_OS4, Laugharne
PPV
VulnerableStructures CosmeticDamage LowerThreshold
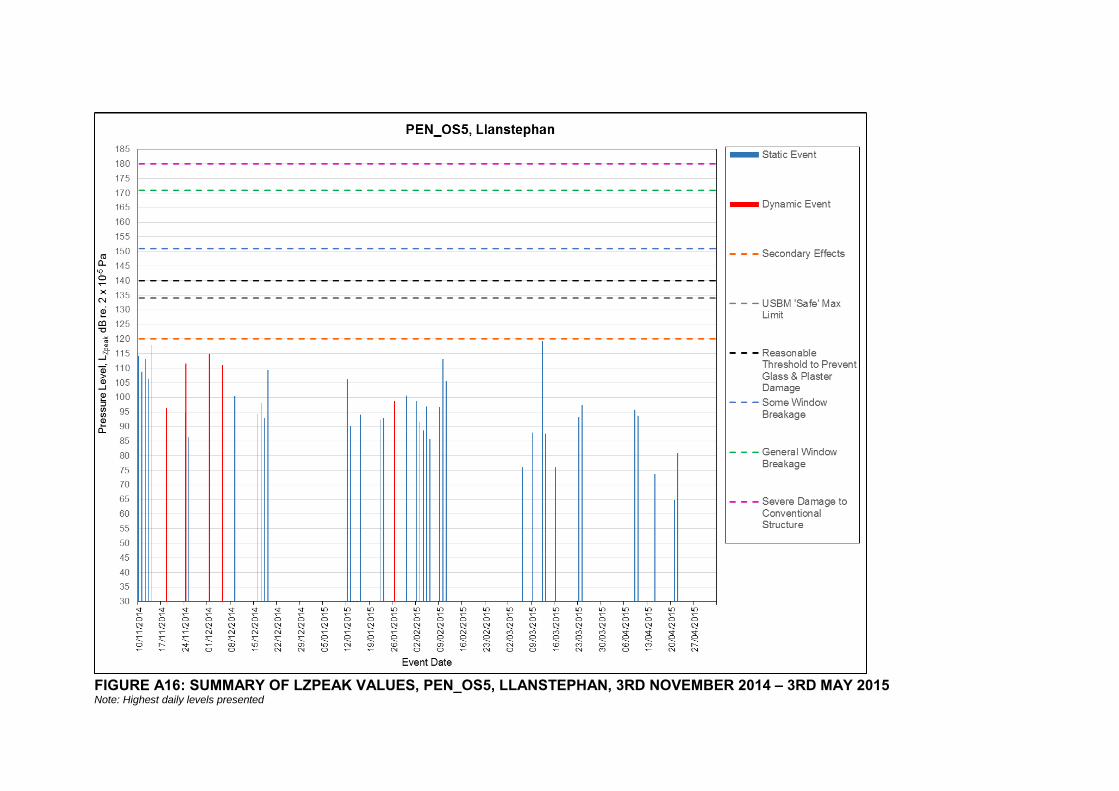
FIGURE A16: SUMMARY OF LZPEAK VALUES, PEN_OS5, LLANSTEPHAN, 3RD NOVEMBER 2014 – 3RD MAY 2015 Note: Highest daily levels presented

FIGURE A17 : SUMMARY OF LCPEAK VALUES, PEN_OS5, LLANSTEPHAN, 3RD NOVEMBER 2014 – 3RD MAY 2015 Note: Highest daily levels presented

FIGURE A18 : SUMMARY PPV VALUES, PEN_OS5, LLANSTEPHAN, 3RD NOVEMBER 2014 – 3RD MAY 2015 Note: Highest daily levels presented
0
0.5
1
1.5
2
2.5
3
3.5
4
4.5
5
5.5
6
6.5
710/1
1/2
014
17/1
1/2
014
24/1
1/2
014
01/1
2/2
014
08/1
2/2
014
15/1
2/2
014
22/1
2/2
014
29/1
2/2
014
05/0
1/2
015
12/0
1/2
015
19/0
1/2
015
26/0
1/2
015
02/0
2/2
015
09/0
2/2
015
16/0
2/2
015
23/0
2/2
015
02/0
3/2
015
09/0
3/2
015
16/0
3/2
015
23/0
3/2
015
30/0
3/2
015
06/0
4/2
015
13/0
4/2
015
20/0
4/2
015
27/0
4/2
015
Pe
ak C
om
po
ne
nt P
art
icle
Ve
locity, m
m/s
Event Date
PEN_OS5, Llanstephan
PPV
VulnerableStructures CosmeticDamage LowerThreshold

FIGURE A19 : SUMMARY OF LZPEAK VALUES, PEN_OS6, FERRYSIDE, 3RD NOVEMBER 2014 – 3RD MAY 2015 Note: Highest daily levels presented

FIGURE A20 SUMMARY OF LCPEAK VALUES, PEN_OS6, FERRYSIDE, 3RD NOVEMBER 2014 – 3RD MAY 2015 Note: Highest daily levels presented

FIGURE A21 : SUMMARY PPV VALUES PEN_OS6, FERRYSIDE, 3RD NOVEMBER 2014 – 3RD MAY Note: Highest daily levels presented
0
0.5
1
1.5
2
2.5
3
3.5
4
4.5
5
5.5
6
6.5
7
10/1
1/2
014
17/1
1/2
014
24/1
1/2
014
01/1
2/2
014
08/1
2/2
014
15/1
2/2
014
22/1
2/2
014
29/1
2/2
014
05/0
1/2
015
12/0
1/2
015
19/0
1/2
015
26/0
1/2
015
02/0
2/2
015
09/0
2/2
015
16/0
2/2
015
23/0
2/2
015
02/0
3/2
015
09/0
3/2
015
16/0
3/2
015
23/0
3/2
015
30/0
3/2
015
06/0
4/2
015
13/0
4/2
015
20/0
4/2
015
27/0
4/2
015
Pe
ak C
om
po
ne
nt P
art
icle
Ve
locity, m
m/s
Event Date
PEN_OS6, Ferryside
PPV
VulnerableStructures CosmeticDamage LowerThreshold

FIGURE A22 SUMMARY OF LZPEAK VALUES, PEN_OS7, KIDWELLY, 3RD NOVEMBER 2014 – 3RD MAY 2015 Note: Highest daily levels presented
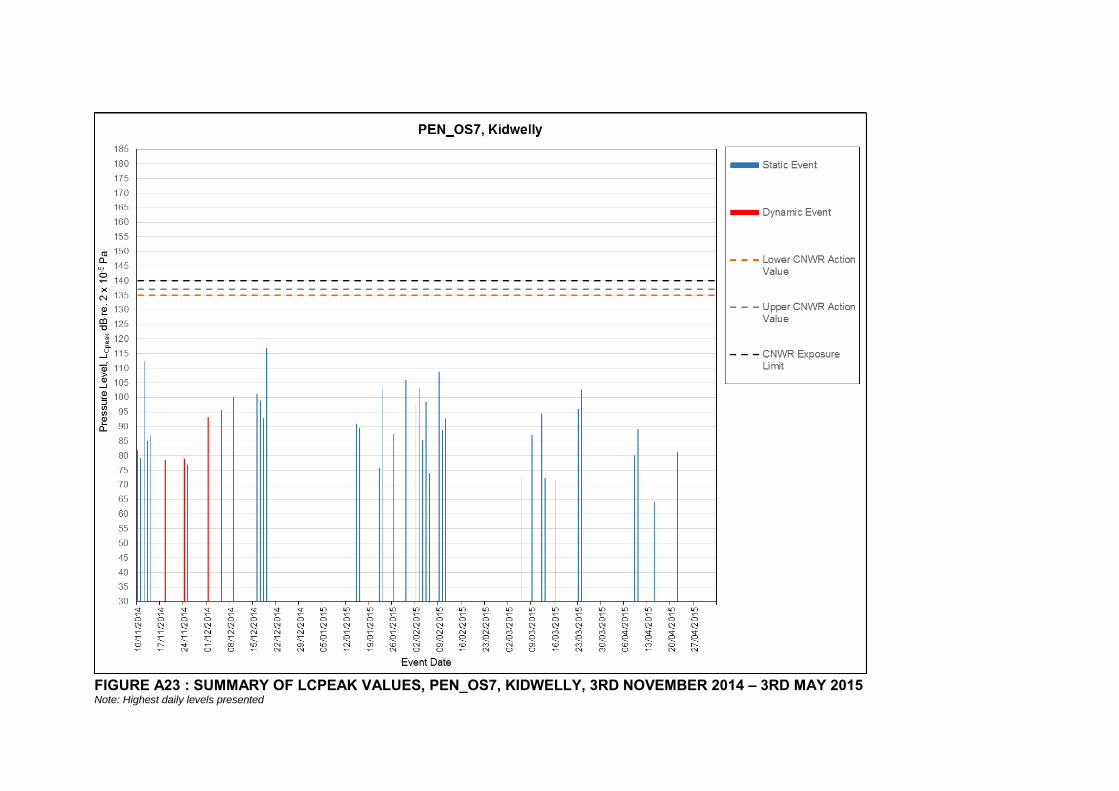
FIGURE A23 : SUMMARY OF LCPEAK VALUES, PEN_OS7, KIDWELLY, 3RD NOVEMBER 2014 – 3RD MAY 2015 Note: Highest daily levels presented

FIGURE A24 SUMMARY PPV VALUES PEN_OS7, KIDWELLY, 3RD NOVEMBER 2014 – 3RD MAY 2015 Note: Highest daily levels presented
0
0.5
1
1.5
2
2.5
3
3.5
4
4.5
5
5.5
6
6.5
7
10/1
1/2
014
17/1
1/2
014
24/1
1/2
014
01/1
2/2
014
08/1
2/2
014
15/1
2/2
014
22/1
2/2
014
29/1
2/2
014
05/0
1/2
015
12/0
1/2
015
19/0
1/2
015
26/0
1/2
015
02/0
2/2
015
09/0
2/2
015
16/0
2/2
015
23/0
2/2
015
02/0
3/2
015
09/0
3/2
015
16/0
3/2
015
23/0
3/2
015
30/0
3/2
015
06/0
4/2
015
13/0
4/2
015
20/0
4/2
015
27/0
4/2
015
Pe
ak C
om
po
ne
nt P
art
icle
Ve
locity, m
m/s
Event Date
PEN_OS7, Kidwelly
PPV
VulnerableStructures CosmeticDamage LowerThreshold

FIGURE A25 : SUMMARY OF LZPEAK VALUES, PEN_OS8, FERRYSIDE, 3RD NOVEMBER 2014 – 3RD MAY 2015 Note: Highest daily levels presented
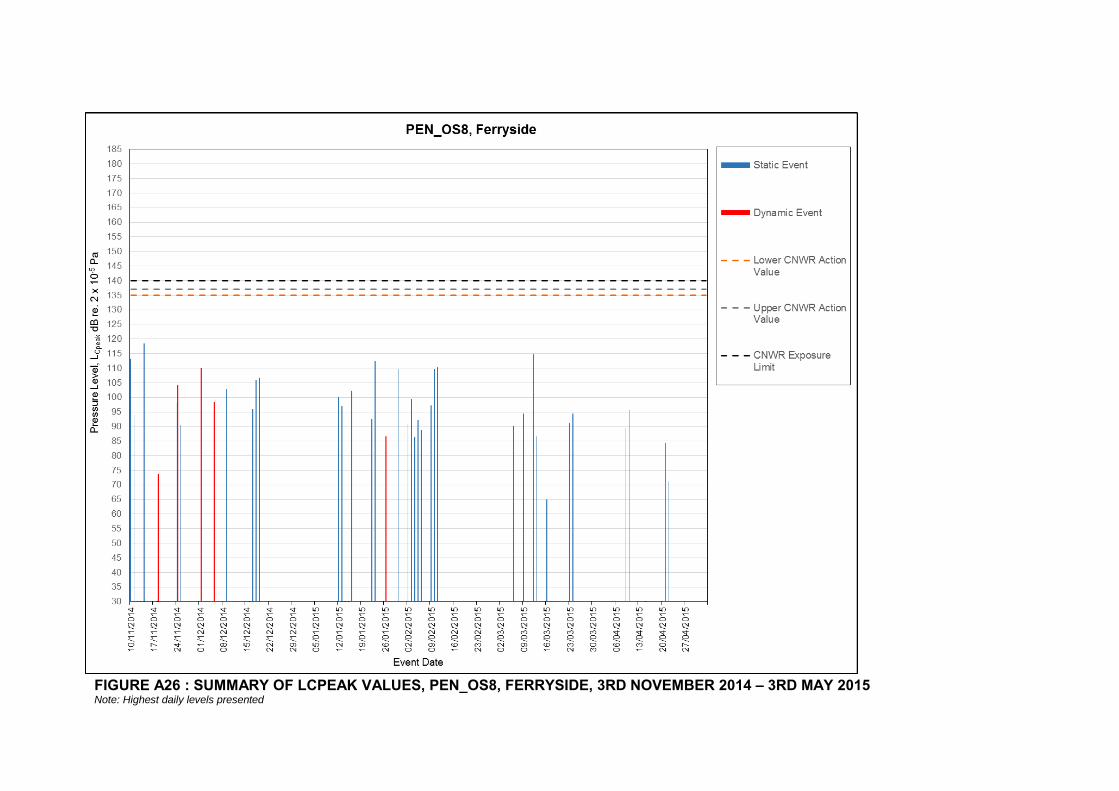
FIGURE A26 : SUMMARY OF LCPEAK VALUES, PEN_OS8, FERRYSIDE, 3RD NOVEMBER 2014 – 3RD MAY 2015 Note: Highest daily levels presented

FIGURE A27 SUMMARY PPV VALUES, PEN_OS8, FERRYSIDE, 3RD NOVEMBER 2014 – 3RD MAY Note: Highest daily levels presented
0
0.5
1
1.5
2
2.5
3
3.5
4
4.5
5
5.5
6
6.5
7
10/1
1/2
014
17/1
1/2
014
24/1
1/2
014
01/1
2/2
014
08/1
2/2
014
15/1
2/2
014
22/1
2/2
014
29/1
2/2
014
05/0
1/2
015
12/0
1/2
015
19/0
1/2
015
26/0
1/2
015
02/0
2/2
015
09/0
2/2
015
16/0
2/2
015
23/0
2/2
015
02/0
3/2
015
09/0
3/2
015
16/0
3/2
015
23/0
3/2
015
30/0
3/2
015
06/0
4/2
015
13/0
4/2
015
20/0
4/2
015
27/0
4/2
015
Pe
ak C
om
po
ne
nt P
art
icle
Ve
locity, m
m/s
Event Date
PEN_OS8, Ferryside
PPV
VulnerableStructures CosmeticDamage LowerThreshold

FIGURE A28 : SUMMARY OF LZPEAK VALUES, PEN_OS9, PLASHETT, 3RD NOVEMBER 2014 – 3RD MAY 2015 Note: Highest daily levels presented

FIGURE A29 : SUMMARY OF LCPEAK VALUES, PEN_OS9, PLASHETT, 3RD NOVEMBER 2014 – 3RD MAY 2015 Note: Highest daily levels presented

FIGURE A30 : SUMMARY PPV VALUES, PEN_OS9, PLASHETT, 3RD NOVEMBER 2014 – 3RD MAY 2015 Note: Highest daily levels presented
0
0.5
1
1.5
2
2.5
3
3.5
4
4.5
5
5.5
6
6.5
7
10/1
1/2
014
17/1
1/2
014
24/1
1/2
014
01/1
2/2
014
08/1
2/2
014
15/1
2/2
014
22/1
2/2
014
29/1
2/2
014
05/0
1/2
015
12/0
1/2
015
19/0
1/2
015
26/0
1/2
015
02/0
2/2
015
09/0
2/2
015
16/0
2/2
015
23/0
2/2
015
02/0
3/2
015
09/0
3/2
015
16/0
3/2
015
23/0
3/2
015
30/0
3/2
015
06/0
4/2
015
13/0
4/2
015
20/0
4/2
015
27/0
4/2
015
Pe
ak C
om
po
ne
nt P
art
icle
Ve
locity, m
m/s
Event Date
PEN_OS9, Plashett
PPV
VulnerableStructures CosmeticDamage LowerThreshold

FIGURE A31: SUMMARY LZPEAK VALUES, PEN_OS10, PENDINE, 3RD NOVEMBER 2014 – 3RD MAY 2015 Note: Highest daily levels presented

FIGURE A32 : SUMMARY LCPEAK VALUES, PEN_OS10, PENDINE, 3RD NOVEMBER 2014 – 3RD MAY 2015 Note: Highest daily levels presented

FIGURE A33 : SUMMARY PPV VALUES, PEN_OS10, PENDINE, 3RD NOVEMBER 2014 – 3RD MAY 2015 Note: Highest daily levels presented
0
0.5
1
1.5
2
2.5
3
3.5
4
4.5
5
5.5
6
6.5
710/1
1/2
014
17/1
1/2
014
24/1
1/2
014
01/1
2/2
014
08/1
2/2
014
15/1
2/2
014
22/1
2/2
014
29/1
2/2
014
05/0
1/2
015
12/0
1/2
015
19/0
1/2
015
26/0
1/2
015
02/0
2/2
015
09/0
2/2
015
16/0
2/2
015
23/0
2/2
015
02/0
3/2
015
09/0
3/2
015
16/0
3/2
015
23/0
3/2
015
30/0
3/2
015
06/0
4/2
015
13/0
4/2
015
20/0
4/2
015
27/0
4/2
015
Pe
ak C
om
po
ne
nt P
art
icle
Ve
locity, m
m/s
Event Date
PEN_OS10, Pendine
PPV
VulnerableStructures CosmeticDamage LowerThreshold

FIGURE A34: ANALYSIS OF MEASURED VIBRATION AND AIR OVERPRESSURE SIGNAL ARRIVAL TIMES AT AN OFF-RANGE LOCATION Notes: [1] Green line indicates start of the measured events and red line indicates end of measured event
Nois
e
Pre
ssure
, P
a
Vib
ration
-axis
, m
m/s
0 10 20 30 40 50 60
Time (s)
0
-0.2
0.2
0
5
-5

APPENDIX B: TABLES

TABLE B1: SUMMARY QUANTITIES OF TRIGGERED ACTIVITIES DURING MONITORING STUDY Notes: [1] Sum of the static and dynamic Range Activities captured by both Range monitors presented in brackets; [2] Extraneous activities include those attributable to non-firing activities (i.e. local vehicle movements, wind noise on the microphone, local maintenance works, aircraft activity, alarm / sirens); and [3] Number of individual Range Activities expected to cause a Range trigger are those associated with the quantities of reported activities in the Range logs.
Monitor ID
Total No. of On-Range Triggered Activities
No of Range Static and Dynamic
Activities Expected to Trigger Range
Monitors
No of On-Range Triggered Activities Caused by Range
Static and Dynamic Activities
No of On-Range Triggered Events Caused by Non-Range Activities
No of individual Triggered Range
Static and Dynamic Activities Captured
by Off-Range Monitors
No of Off-Range Triggered Activities
Caused by Local Activity
PEN_R1 1,719 149[3]
34 1,686 n/a n/a
PEN_R2 1,563 99 1,474 n/a n/a
TOTAL 3,282 103 (133)[1] 3,160[2] n/a n/a
PEN_OS1 n/a n/a n/a n/a 85 69
PEN_OS2 n/a n/a n/a n/a 86 435
PEN_OS3 n/a n/a n/a n/a 79 298
PEN_OS4 n/a n/a n/a n/a 73 27
PEN_OS5 n/a n/a n/a n/a 89 171
PEN_OS6 n/a n/a n/a n/a 87 26
PEN_OS7 n/a n/a n/a n/a 76 47
PEN_OS8 n/a n/a n/a n/a 77 1,121
PEN_OS9 n/a n/a n/a n/a 66 17
PEN_OS10 n/a n/a n/a n/a 76 61

TABLE B2: SUMMARY OF DATA CAPTURE – NOVEMBER 2014 Notes: TNE = Trigger Threshold Not Exceeded; Green shaded cells denote Positive Causality (PC) – reasonable likelihood that an on-Range Activity has caused an off-Range effect (i.e. positive causality); Yellow shaded cells denote Uncertain Causality (UC) – insufficient statistical evidence to confirm that the on-Range Activity has caused an off-Range effect (i.e. uncertain causality); Blue shaded cells denote No Causality (NC) – little or no evidence to suggest that the on-Range Activity has caused an off-Range effect (i.e. no causality); and X = Activity not captured. See Volume 2 – Technical Appendices – Detailed Methodology, Chapter 3: Equipment Outages and Scheduled Maintenance for full details
Nov-14
Measured LZpeak Values at On-Range Locations, dB re 10-5
Pa Southdowns Generated Trigger ID
Measured LZpeak Values at Off-Range Locations, dB re. 2 x 10⁻⁵ Pa
Day Time PEN_R1 PEN_R2
PE
N_O
S1
PE
N_O
S2
PE
N_O
S3
PE
N_O
S4
PE
N_O
S5
PE
N_O
S6
PE
N_O
S7
PE
N_O
S8
PE
N_O
S9
PE
N_O
S1
0
10 14:30 123 138 11-S1-35, S2-69 117 128
Not In
sta
lled
110 117 87 115
Not In
sta
lled
95
10 15:21 127 146 11-S1-36, S2-70 109 130 114 124 87 120 102
11 15:04 122 137 11-S1-41 110 127 133 104 91 85 95 96
11 15:31 126 142 11-S1-42 113 131 134 109 102 91 102 102
12 13:37 TNE 103 11-S2-111 73 94 97 100 106 95
12 14:08 TNE 101 11-S2-104 112 107 132 113 125 119
13 10:30 121 113 11-S1-49, S2-118 109 127 127 79 81 89 87 107
13 11:26 128 138 11-S1-50, S2-122 114 131 133 106 93 98 94 109
14 11:13 121 TNE 11-S1-65 112 125 129 113 121 98 120 106
14 14:39 121 TNE 11-S1-66 124 108 123
14 15:12 125 TNE 11-S1-68 117 129 118 82 105 125 105
18 11:56 129 TNE 11-S1-165 88 124 103 80 82 82 78 112
18 15:43 TNE TNE 11-S1-200 97 118 96 82 84 115
24 13:46 127 TNE 11-S1-186 102 123 106 95 104 87 107 107
24 14:48 136 TNE 11-S1-187 95 123 106 112 111 89 114 113
25 12:07 105 TNE 11-S1-189 102 109 102 86 97 82 98 85

Dec-14
Measured LZpeak Values at On-Range Locations, dB re 10-5
Pa Southdowns Generated Trigger ID
Measured LZpeak Values at Off-Range Locations, dB re. 2 x 10⁻⁵ Pa
Day Time PEN_R1 PEN_R2
PE
N_O
S1
PE
N_O
S2
PE
N_O
S3
PE
N_O
S4
PE
N_O
S5
PE
N_O
S6
PE
N_O
S7
PE
N_O
S8
PE
N_O
S9
PE
N_O
S1
0
01 15:21 95 118 12-S1-2; S2-9 76 116 86 84 111 108 102 107 103 97
05 11:39 133 120 12-S1-22; S2-45 76 116 86 84 111 108 102 107 103 97
09 12:45 TNE 112 12-S2-82 84 89 92 94 97 99 103 99 97 87
09 15:40 TNE 117 12-S2-61 86 95 93 102 100 106 99 104 101 95
16 11:12 TNE 114 12-S2-110 66 81 89 80 91 100 107 104 67 73
16 13:23 TNE 111 12-S2-111 68 88 92 81 92 97 104 101 78 78
16 15:02 TNE 110 12-S2-204 84 91 98 99 94 99 103 99 81 81
17 11:13 TNE 109 12-S2-116 65 81 98 88 92 100 101 96 83 83
17 13:41 TNE 111 12-S2-117 81 78 87 94 98 99 104 101 77 82
18 14:31 TNE 137 12-S2-124 77 99 92 101 93 109 97 108 106 103
19 10:17 TNE 124 12-S2-127 72 89 95 90 109 115 124 114 82 72
TABLE B3: SUMMARY OF DATA CAPTURE – DECEMBER 2014 Notes: TNE = Trigger Threshold Not Exceeded; Green shaded cells denote Positive Causality (PC) – reasonable likelihood that an on-Range Activity has caused an off-Range effect (i.e. positive causality); Yellow shaded cells denote Uncertain Causality (UC) – insufficient statistical evidence to confirm that the on-Range Activity has caused an off-Range effect (i.e. uncertain causality); Blue shaded cells denote No Causality (NC) – little or no evidence to suggest that the on-Range Activity has caused an off-Range effect (i.e. no causality); and X = Activity not captured. See Volume 2 – Technical Appendices – Detailed Methodology, Chapter 3: Equipment Outages and Scheduled Maintenance for full details.
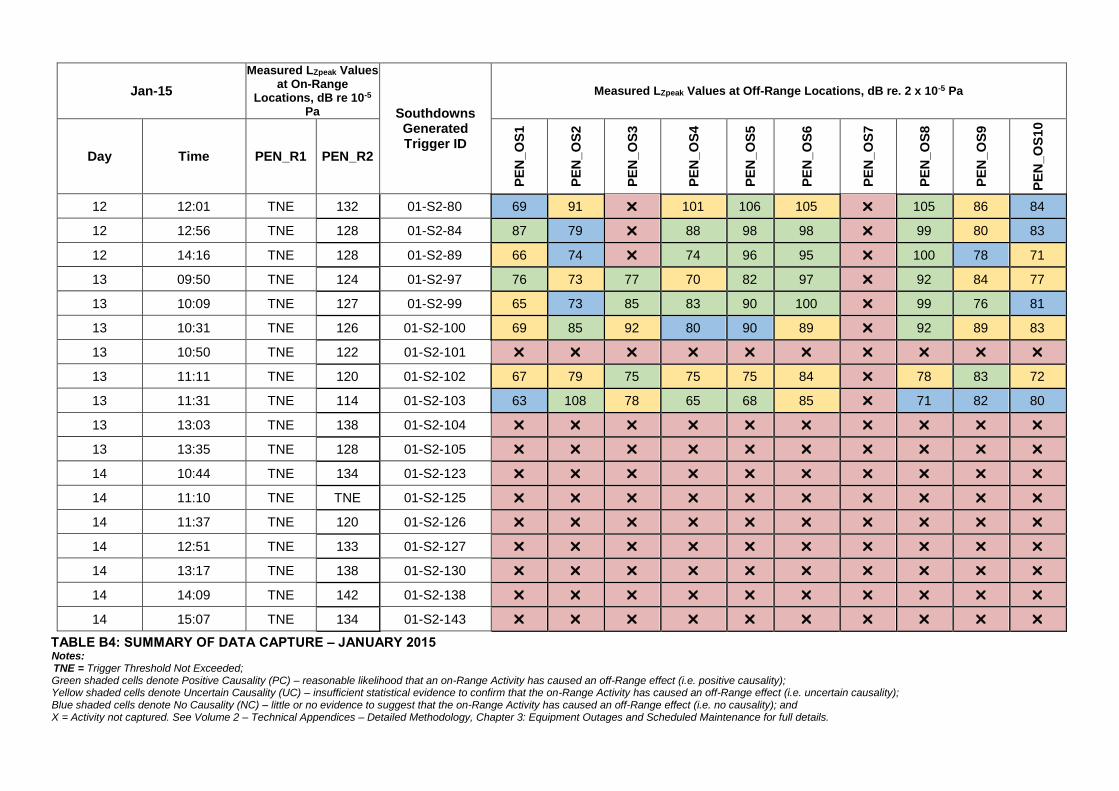
TABLE B4: SUMMARY OF DATA CAPTURE – JANUARY 2015 Notes: TNE = Trigger Threshold Not Exceeded; Green shaded cells denote Positive Causality (PC) – reasonable likelihood that an on-Range Activity has caused an off-Range effect (i.e. positive causality); Yellow shaded cells denote Uncertain Causality (UC) – insufficient statistical evidence to confirm that the on-Range Activity has caused an off-Range effect (i.e. uncertain causality); Blue shaded cells denote No Causality (NC) – little or no evidence to suggest that the on-Range Activity has caused an off-Range effect (i.e. no causality); and X = Activity not captured. See Volume 2 – Technical Appendices – Detailed Methodology, Chapter 3: Equipment Outages and Scheduled Maintenance for full details.
Jan-15
Measured LZpeak Values at On-Range
Locations, dB re 10-5 Pa Southdowns
Generated Trigger ID
Measured LZpeak Values at Off-Range Locations, dB re. 2 x 10⁻⁵ Pa
Day Time PEN_R1 PEN_R2
PE
N_O
S1
PE
N_O
S2
PE
N_O
S3
PE
N_O
S4
PE
N_O
S5
PE
N_O
S6
PE
N_O
S7
PE
N_O
S8
PE
N_O
S9
PE
N_O
S1
0
12 12:01 TNE 132 01-S2-80 69 91 101 106 105 105 86 84
12 12:56 TNE 128 01-S2-84 87 79 88 98 98 99 80 83
12 14:16 TNE 128 01-S2-89 66 74 74 96 95 100 78 71
13 09:50 TNE 124 01-S2-97 76 73 77 70 82 97 92 84 77
13 10:09 TNE 127 01-S2-99 65 73 85 83 90 100 99 76 81
13 10:31 TNE 126 01-S2-100 69 85 92 80 90 89 92 89 83
13 10:50 TNE 122 01-S2-101
13 11:11 TNE 120 01-S2-102 67 79 75 75 75 84 78 83 72
13 11:31 TNE 114 01-S2-103 63 108 78 65 68 85 71 82 80
13 13:03 TNE 138 01-S2-104
13 13:35 TNE 128 01-S2-105
14 10:44 TNE 134 01-S2-123
14 11:10 TNE TNE 01-S2-125
14 11:37 TNE 120 01-S2-126
14 12:51 TNE 133 01-S2-127
14 13:17 TNE 138 01-S2-130
14 14:09 TNE 142 01-S2-138
14 15:07 TNE 134 01-S2-143
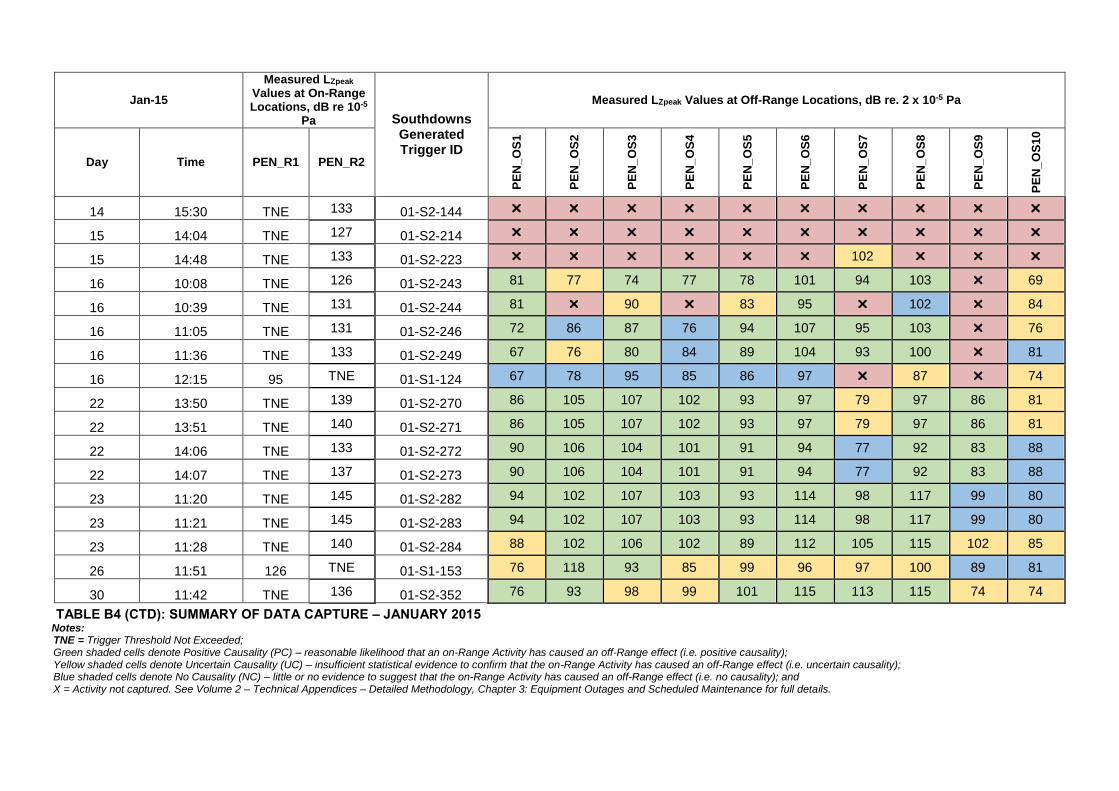
TABLE B4 (CTD): SUMMARY OF DATA CAPTURE – JANUARY 2015 Notes: TNE = Trigger Threshold Not Exceeded; Green shaded cells denote Positive Causality (PC) – reasonable likelihood that an on-Range Activity has caused an off-Range effect (i.e. positive causality); Yellow shaded cells denote Uncertain Causality (UC) – insufficient statistical evidence to confirm that the on-Range Activity has caused an off-Range effect (i.e. uncertain causality); Blue shaded cells denote No Causality (NC) – little or no evidence to suggest that the on-Range Activity has caused an off-Range effect (i.e. no causality); and X = Activity not captured. See Volume 2 – Technical Appendices – Detailed Methodology, Chapter 3: Equipment Outages and Scheduled Maintenance for full details.
Jan-15
Measured LZpeak Values at On-Range Locations, dB re 10-5
Pa Southdowns Generated Trigger ID
Measured LZpeak Values at Off-Range Locations, dB re. 2 x 10⁻⁵ Pa
Day Time PEN_R1 PEN_R2
PE
N_O
S1
PE
N_O
S2
PE
N_O
S3
PE
N_O
S4
PE
N_O
S5
PE
N_O
S6
PE
N_O
S7
PE
N_O
S8
PE
N_O
S9
PE
N_O
S1
0
14 15:30 TNE 133 01-S2-144
15 14:04 TNE 127 01-S2-214
15 14:48 TNE 133 01-S2-223 102
16 10:08 TNE 126 01-S2-243 81 77 74 77 78 101 94 103 69
16 10:39 TNE 131 01-S2-244 81 90 83 95 102 84
16 11:05 TNE 131 01-S2-246 72 86 87 76 94 107 95 103 76
16 11:36 TNE 133 01-S2-249 67 76 80 84 89 104 93 100 81
16 12:15 95 TNE 01-S1-124 67 78 95 85 86 97 87 74
22 13:50 TNE 139 01-S2-270 86 105 107 102 93 97 79 97 86 81
22 13:51 TNE 140 01-S2-271 86 105 107 102 93 97 79 97 86 81
22 14:06 TNE 133 01-S2-272 90 106 104 101 91 94 77 92 83 88
22 14:07 TNE 137 01-S2-273 90 106 104 101 91 94 77 92 83 88
23 11:20 TNE 145 01-S2-282 94 102 107 103 93 114 98 117 99 80
23 11:21 TNE 145 01-S2-283 94 102 107 103 93 114 98 117 99 80
23 11:28 TNE 140 01-S2-284 88 102 106 102 89 112 105 115 102 85
26 11:51 126 TNE 01-S1-153 76 118 93 85 99 96 97 100 89 81
30 11:42 TNE 136 01-S2-352 76 93 98 99 101 115 113 115 74 74

TABLE B5: SUMMARY OF DATA CAPTURE – FEBRUARY 2015 Notes: TNE = Trigger Threshold Not Exceeded; Green shaded cells denote Positive Causality (PC) – reasonable likelihood that an on-Range Activity has caused an off-Range effect (i.e. positive causality); Yellow shaded cells denote Uncertain Causality (UC) – insufficient statistical evidence to confirm that the on-Range Activity has caused an off-Range effect (i.e. uncertain causality); Blue shaded cells denote No Causality (NC) – little or no evidence to suggest that the on-Range Activity has caused an off-Range effect (i.e. no causality); and X = Activity not captured. See Volume 2 – Technical Appendices – Detailed Methodology, Chapter 3: Equipment Outages and Scheduled Maintenance for full details.
Feb-15 Measured LZpeak Values at On-Range Locations,
dB re 10-5 Pa Southdowns Generated
Trigger ID
Measured LZpeak Values at Off-Range Locations, dB re. 2 x 10⁻⁵ Pa
Day Time PEN_R1 PEN_R2
PE
N_O
S1
PE
N_O
S2
PE
N_O
S3
PE
N_O
S4
PE
N_O
S5
PE
N_O
S6
PE
N_O
S7
PE
N_O
S8
PE
N_O
S9
PE
N_O
S1
0
02 12:06 TNE 137 02-S2-2 82 106 108 99 99 102 103 100 91 81
03 10:42 125 135 02-S1-10 & S2-13 96 127 122 106 90 100 79 104 107 105
03 14:44 116 134 02-S1-12 & S2-19 74 106 97 83 88 96 92 94 87 108
03 15:25 98 100 02-S1-13 & S2-22 92 94 95 96 92 101 103 99 90 95
04 11:48 TNE 133 02-S1-22 & S2-32 74 102 98 84 87 91 89 94 82 95
04 15:10 TNE 133 02-S2-36 76 111 101 86 89 95 90 95 86 94
05 10:59 TNE 134 02-S2-42 73 116 97 87 97 96 104 100 92 94
05 13:17 116 135 02-S1-29 & S2-47 72 112 102 82 93 96 90 98 90 94
05 15:22 115 135 02-S1-30 & S2-50 75 107 100 83 85 97 95 94 90 100
06 10:45 123 136 02-S1-34 96 122 115 109 86 90 76 98 109 111
09 10:37 TNE 135 02-S2-71 80 106 98 94 94 108 115 104 81 102
09 12:41 TNE 134 02-S2-76 88 106 99 89 97 102 106 105 86 95
09 15:07 116 136 02-S1-92 & S2-82 90 115 112 103 95 100 113 104 98 105
10 12:22 TNE TNE 02-S1-100 & S2-94 108 125 126 121 108 110 96 109 106 107
10 15:04 TNE 135 02-S1-103 & S2-100 107 123 128 117 102 103 82 101 106 113
11 11:44 120 135 02-S2-104 106 118 125 116 106 112 92 114 102 87
11 12:03 TNE 137 02-S2-107 85 106 96 97 91 97 87 100 90 87
11 12:04 TNE 106 02-S2-108 85 106 96 97 91 97 87 100 90 87
11 13:36 TNE 106 02-S2-111 90 105 102 98 90 103 96 104 88 84

Feb-15 Measured LZpeak Values at On-Range Locations,
dB re 10-5 Pa Southdowns Generated
Trigger ID
Measured LZpeak Values at Off-Range Locations, dB re. 2 x 10⁻⁵ Pa
Day Time PEN_R1 PEN_R2
PE
N_O
S1
PE
N_O
S2
PE
N_O
S3
PE
N_O
S4
PE
N_O
S5
PE
N_O
S6
PE
N_O
S7
PE
N_O
S8
PE
N_O
S9
PE
N_O
S1
0
11 13:38 TNE 109 02-S2-112 89 104 98 97 92 99 84 101 88 82
11 13:40 TNE 111 02-S2-113 87 104 97 93 96 104 98 104 89 85
11 13:42 107 111 02-S1-110 87 104 97 93 96 104 98 104 89 85
11 14:14 107 111 02-S2-114 86 106 96 94 87 99 90 99 86 80
11 14:16 TNE 108 02-S2-115 90 104 95 95 86 98 89 98 89 80
TABLE B5 (CTD): SUMMARY OF DATA CAPTURE – FEBRUARY 2015 Notes: TNE = Trigger Threshold Not Exceeded; Green shaded cells denote Positive Causality (PC) – reasonable likelihood that an on-Range Activity has caused an off-Range effect (i.e. positive causality); Yellow shaded cells denote Uncertain Causality (UC) – insufficient statistical evidence to confirm that the on-Range Activity has caused an off-Range effect (i.e. uncertain causality); Blue shaded cells denote No Causality (NC) – little or no evidence to suggest that the on-Range Activity has caused an off-Range effect (i.e. no causality); and X = Activity not captured. See Volume 2 – Technical Appendices – Detailed Methodology, Chapter 3: Equipment Outages and Scheduled Maintenance for full details.

Mar-15 Measured LZpeak Values at On-Range Locations,
dB re 10-5 Pa
Southdowns Generated Trigger ID
Measured LZpeak Values at Off-Range Locations, dB re. 2 x 10⁻⁵ Pa
Day Time PEN_R1 PEN_R2
PE
N_O
S1
PE
N_O
S2
PE
N_O
S3
PE
N_O
S4
PE
N_O
S5
PE
N_O
S6
PE
N_O
S7
PE
N_O
S8
PE
N_O
S9
PE
N_O
S1
0
06 10:48 TNE 107 03-S2-142 80 98 88 92 76 68 76 102 98 93
09 10:30 TNE 96 03-S2-168 85 97 99 95 88 100 93 102 96 90
12 10:21 TNE 109 03-S1-134 97 104 103 100 103 107 73 104 89 90
12 14:20 104 TNE 03-S2-178 103 122 117 115 119 124 106 124 102 101
13 15:02 TNE 129 03-S1-213 77 102 93 97 88 82 91 95 86 102
23 10:06 102 TNE 03-S2-198 83 90 98 97 93 97 102 99 86 79
24 12:02 TNE TNE 03-S2-208 73 101 95 92 97 105 110 104 89 83
TABLE B6: SUMMARY OF DATA CAPTURE – MARCH 2015 Notes: TNE = Trigger Threshold Not Exceeded; Green shaded cells denote Positive Causality (PC) – reasonable likelihood that an on-Range Activity has caused an off-Range effect (i.e. positive causality); Yellow shaded cells denote Uncertain Causality (UC) – insufficient statistical evidence to confirm that the on-Range Activity has caused an off-Range effect (i.e. uncertain causality); Blue shaded cells denote No Causality (NC) – little or no evidence to suggest that the on-Range Activity has caused an off-Range effect (i.e. no causality); and X = Activity not captured. See Volume 2 – Technical Appendices – Detailed Methodology, Chapter 3: Equipment Outages and Scheduled Maintenance for full details.
Mar-15
Measured LZpeak Values at On-Range Locations, dB re 10-5
Pa Southdowns
Generated Trigger ID
Measured LZpeak Values at Off-Range Locations, dB re. 2 x 10⁻⁵ Pa
Day Time PEN_R1 PEN_R2
PE
N_O
S1
PE
N_O
S2
PE
N_O
S3
PE
N_O
S4
PE
N_O
S5
PE
N_O
S6
PE
N_O
S7
PE
N_O
S8
PE
N_O
S9
PE
N_O
S1
0
09 15:33 TNE 116 04-S2-9 94 106 112 107 96 99 85 95 91
Not In
sta
lled
09 15:34 TNE 124 04-S2-11 94 106 112 107 96 99 85 95 91
10 12:14 TNE 141 04-S2-15 95 109 107 106 94 96 93 96 91
10 12:15 TNE 144 04-S2-15 95 109 107 106 94 96 93 96 91
15 15:03 TNE 140 04-S2-30 62 80 67 81 74 82 76 84 81
21 12:32 TNE 140 04-S2-58 68 93 80 72 65 74 73 84 75
22 12:56 TNE 89 04-S2-65 74 101 95 88 81 97 78 66 90
22 14:28 TNE 111 04-S1-136 & S2-68 78 90 92 84 72 103 78 77 78
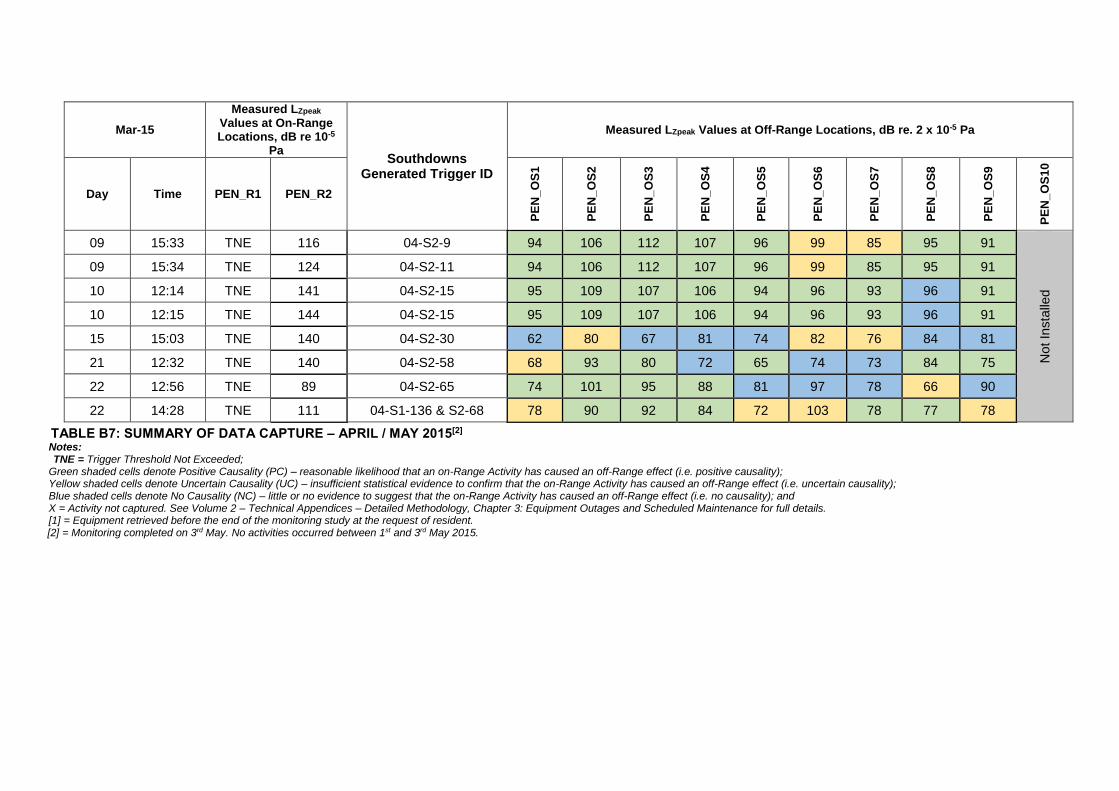
TABLE B7: SUMMARY OF DATA CAPTURE – APRIL / MAY 2015[2] Notes: TNE = Trigger Threshold Not Exceeded;
Green shaded cells denote Positive Causality (PC) – reasonable likelihood that an on-Range Activity has caused an off-Range effect (i.e. positive causality); Yellow shaded cells denote Uncertain Causality (UC) – insufficient statistical evidence to confirm that the on-Range Activity has caused an off-Range effect (i.e. uncertain causality); Blue shaded cells denote No Causality (NC) – little or no evidence to suggest that the on-Range Activity has caused an off-Range effect (i.e. no causality); and X = Activity not captured. See Volume 2 – Technical Appendices – Detailed Methodology, Chapter 3: Equipment Outages and Scheduled Maintenance for full details. [1] = Equipment retrieved before the end of the monitoring study at the request of resident.
[2] = Monitoring completed on 3rd May. No activities occurred between 1st and 3rd May 2015.

Month Wind Speed (m/s) Temperature (°C) Relative Humidity (%) Rain Rate (mm/h)
November 1.7 (0.2 - 3.9) 11.1 (8.7 - 13.2) 85.8 (77.0 - 99.0) 0.0 (0.0 - 0.0)
December 3.2 (0.2 - 5.6) 9.6 (7.7 - 12.4) 85.9 (66.0 - 100.0) 0.0 (0.0 - 0.0)
January 4.9 (0.5 - 14.8) 5.6 (0.9 - 10.3) 86.5 (69.0 - 100.0) 1.0 (0.3 - 10.9)
February 3.2 (1.0 - 6.7) 4.8 (1.2 - 7.0) 80.8 (62.5 - 100.0) 0.0 (0.0 - 0.0)
March 4.2 (2.5 - 6.5) 7.9 (5.3 - 9.3) 87.4 (73.0 - 97.0) 0.0 (0.0 - 0.0)
April 3.7 (2.5 - 5.2) 14.1 (12.9 - 14.7) 64.2 (59.6 - 72.6) 0.0 (0.0 - 0.0)
Summary 3.7 (0.2 - 14.8) 7.3 (0.9 - 14.7) 83.9 (59.6 - 100.0) 0.3 (0.0 - 10.9)
TABLE B8: SUMMARY OF METEOROLOGICAL DATA DURING RANGE ACTIVITIES Notes: [1] – average presented outside of parenthesis with the range presented within; and [2] - based on data collated from the meteorological station installed on-Range at Brill Gate (PEN_R1). Full data presented in Volume 3 -Technical Appendices – Results.

Monitoring Location ID
NEQ / Calibre - Static Firing Events
<0.5kg 0.6 – 1kg 1.1 – 2.5kg
LCpeak LZpeak PPV
mms-1
Maximum Displacement
mm [3]
LCpeak LZpeak PPV
mms-1
Maximum Displacement
mm [3]
LCpeak LZpeak PPV
mms-1
Maximum Displacement
mm [3]
PEN_R1 - - - - 103 104 0.233 0.005 103 107 0.270 0.002
PEN_R2 135 137 0.535 0.002 141 142 0.509 0.004 144 145 1.175 0.010
PEN_OS1 68 70 0.029 0.000 85 92 0.078 0.000 102 104 0.067 0.001
PEN_OS2 90 99 0.035 0.001 108 108 0.058 0.001 107 109 0.228 0.005
PEN_OS3 77 80 0.000 0.000 94 99 0.051 0.000 105 112 0.068 0.000
PEN_OS4 72 72 0.016 0.000 93 99 0.021 0.000 104 107 0.074 0.001
PEN_OS5 89 93 0.026 0.000 94 98 0.028 0.000 94 97 0.036 0.000
PEN_OS6 108 109 0.037 0.000 105 107 0.039 0.000 110 114 0.033 0.000
PEN_OS7 93 97 0.047 0.001 101 107 0.139 0.002 103 105 0.966 0.016
PEN_OS8 106 108 0.166 0.002 102 103 0.420 0.006 113 117 0.550 0.008
PEN_OS9 74 75 0.002 0.000 87 96 0.013 0.000 94 102 0.033 0.000
PEN_OS10 94 103 0.014 0.000 83 93 0.019 0.000 83 87 0.082 0.001
TABLE B9: SUMMARY OF TRIGGERED STATIC (0.5 – 2.5KG) FIRING EVENTS, PENDINE RANGE 3RD NOVEMBER 2014 – 3RD MAY 2015 Notes: [1] “-“ indicates where no event has been recorded for the NEQ category; [2] All events presented fall into Positive Causality or Uncertain Causality categories; and [3] Maximum Displacement <4Hz
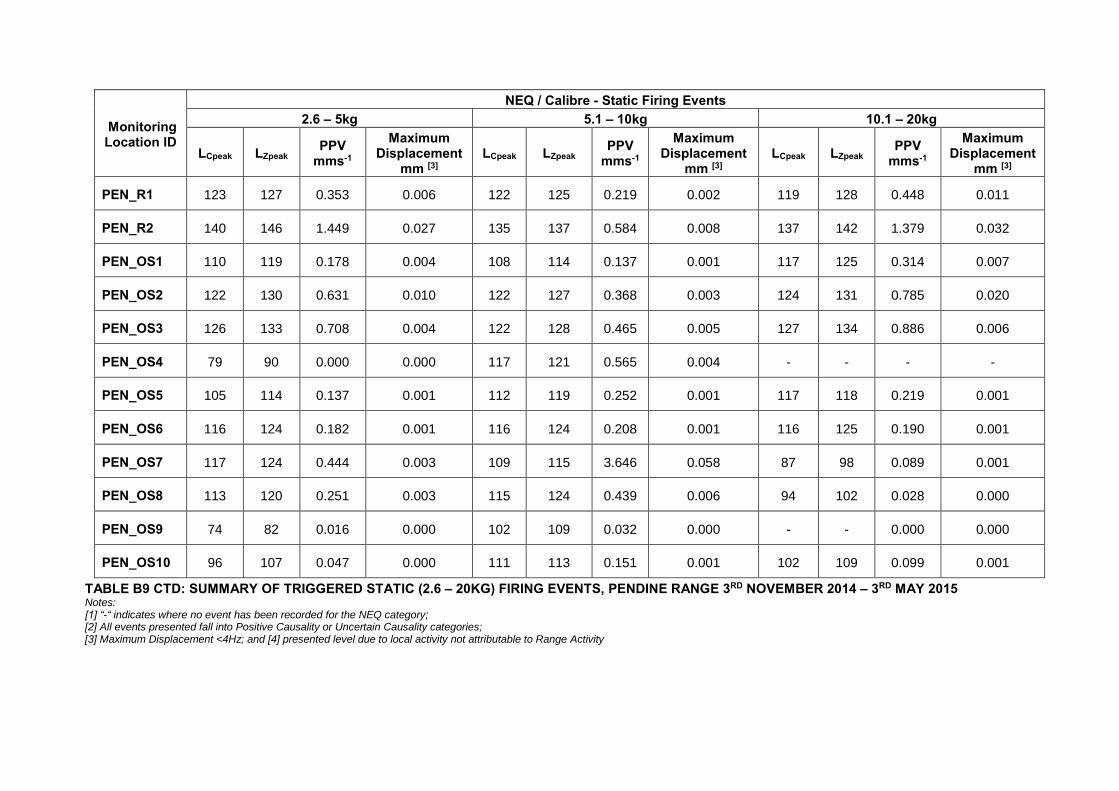
Monitoring Location ID
NEQ / Calibre - Static Firing Events
2.6 – 5kg 5.1 – 10kg 10.1 – 20kg
LCpeak LZpeak PPV
mms-1
Maximum Displacement
mm [3] LCpeak LZpeak
PPV mms-1
Maximum Displacement
mm [3] LCpeak LZpeak
PPV mms-1
Maximum Displacement
mm [3]
PEN_R1 123 127 0.353 0.006 122 125 0.219 0.002 119 128 0.448 0.011
PEN_R2 140 146 1.449 0.027 135 137 0.584 0.008 137 142 1.379 0.032
PEN_OS1 110 119 0.178 0.004 108 114 0.137 0.001 117 125 0.314 0.007
PEN_OS2 122 130 0.631 0.010 122 127 0.368 0.003 124 131 0.785 0.020
PEN_OS3 126 133 0.708 0.004 122 128 0.465 0.005 127 134 0.886 0.006
PEN_OS4 79 90 0.000 0.000 117 121 0.565 0.004 - - - -
PEN_OS5 105 114 0.137 0.001 112 119 0.252 0.001 117 118 0.219 0.001
PEN_OS6 116 124 0.182 0.001 116 124 0.208 0.001 116 125 0.190 0.001
PEN_OS7 117 124 0.444 0.003 109 115 3.646 0.058 87 98 0.089 0.001
PEN_OS8 113 120 0.251 0.003 115 124 0.439 0.006 94 102 0.028 0.000
PEN_OS9 74 82 0.016 0.000 102 109 0.032 0.000 - - 0.000 0.000
PEN_OS10 96 107 0.047 0.000 111 113 0.151 0.001 102 109 0.099 0.001
TABLE B9 CTD: SUMMARY OF TRIGGERED STATIC (2.6 – 20KG) FIRING EVENTS, PENDINE RANGE 3RD NOVEMBER 2014 – 3RD MAY 2015 Notes: [1] “-“ indicates where no event has been recorded for the NEQ category; [2] All events presented fall into Positive Causality or Uncertain Causality categories; [3] Maximum Displacement <4Hz; and [4] presented level due to local activity not attributable to Range Activity

Monitoring Location ID
NEQ / Calibre - Dynamic Firing Events
0 – 10kg 10.1 – 20kg Unclassified firing activity
(Static/Dynamic)
LCpeak LZpeak PPV
mms-1
Maximum Displacement
mm [3] LCpeak LZpeak
PPV mms-1
Maximum Displacement
mm [3] LCpeak LZpeak
PPV mms-1
Maximum Displacement
mm [3]
PEN_R1 124 129 0.355 0.000 130 136 1.019 0.000 97 102 0.443 0.000
PEN_R2 109 118 0.129 0.002 118 120 0.136 0.002 130 132 0.319 0.002
PEN_OS1 88 97 0.021 0.000 95 104 0.034 0.000 87 86 0.047 0.000
PEN_OS2 117 124 0.294 0.008 116 123 0.290 0.007 84 91 0.063 0.002
PEN_OS3 92 103 0.000 0.000 96 106 0.236 0.003 0 0 0.000 0.000
PEN_OS4 100 100 0.029 0.000 76 84 0.007 0.000 90 101 0.000 0.000
PEN_OS5 103 115 0.060 0.001 103 112 0.059 0.000 91 106 0.087 0.000
PEN_OS6 107 119 0.100 0.001 101 111 0.030 0.000 97 105 0.022 0.000
PEN_OS7 93 102 0.035 0.001 96 102 0.038 0.000 - - - -
PEN_OS8 110 119 0.200 0.002 104 114 0.129 0.002 100 105 0.138 0.002
PEN_OS9 103 110 0.035 0.000 94 103 0.024 0.000 75 86 0.005 0.000
PEN_OS10 103 112 0.087 0.001 102 113 0.122 0.001 67 71 0.011 0.000
TABLE B9 CTD: SUMMARY OF TRIGGERED DYNAMIC FIRING EVENTS, PENDINE RANGE 3RD NOVEMBER 2014 – 3RD MAY 2015 Notes: [1] “-“ indicates where no event has been recorded for the NEQ category; [2] All events presented fall into Positive Causality or Uncertain Causality categories; and [3] Maximum Displacement <4Hz

Monitoring Location ID
No of Off-Range Triggered Events Caused by Local
Activity[1]
LZpeak[2] LCpeak
[3]
Max Component PPV mms-1
Comments / Cause of Max Event
PEN_OS1 69 96- 136 94 - 134 0.17 Maximum event attributable to local fireworks
PEN_OS2 435 95 - 132 94 - 124 0.42 Maximum event attributable to wind & rain noise -
heavy storm
PEN_OS3 298 92 - 133 92 - 125 0.54 Maximum event attributable to wind & rain noise -
storm
PEN_OS4 23 98 - 125 98 - 125 0.13 Maximum event attributable to local fireworks
PEN_OS5 160 91 - 118 90 - 117 0.07 Maximum event attributable to Farming activity
PEN_OS6 26 99- 132 99 - 129 0.00 Maximum event attributable to wind & rain - storm
PEN_OS7 43 97 - 120 97 - 119 0.02 Maximum event attributable to local fireworks
PEN_OS8 1,121 97 - 132 97 - 132 0.28 Maximum event attributable to fireworks. High number of off-Range triggered event exceedances attributable
to proximity to West Wales railway line
PEN_OS9 11 95 - 121 94 - 114 0.33 Maximum event attributable to wind & rain noise -
heavy storm
PEN_OS10 61 94 - 131 93 - 130 0.75 Maximum event attributable to –fireworks.
TABLE B10: SUMMARY OF LOCALLY TRIGGERED EXTRANEOUS EVENTS AT OFF-RANGE LOCATIONS, 3RD NOVEMBER 2014 – 3RD MAY 2015 Notes: [1] indicates the number of triggers attributable to events in the vicinity of individual off-Range monitoring locations (not Range firing events) e.g. wind noise, road traffic, train movements, fireworks; [2] presents the range of LZPeak levels attributable to triggered events caused by local activity; and [3] presents the range of LCPeak levels attributable to triggered events caused by local activity.

Monitoring Location ID
No. Events Maximum in Component Axis % Events Maximum in Component Axis
x y z x y z
PEN_R1 0 11 18 0% 38% 62%
PEN_R2 2 2 83 2% 2% 95%
PEN_OS1 15 30 37 18% 37% 45%
PEN_OS2 3 0 80 4% 0% 96%
PEN_OS3 2 5 18 8% 20% 72%
PEN_OS4 1 29 18 2% 60% 38%
PEN_OS5 9 21 56 10% 24% 65%
PEN_OS6 4 35 43 5% 43% 52%
PEN_OS7 14 53 5 19% 74% 7%
PEN_OS8 5 50 20 7% 67% 27%
PEN_OS9 32 12 20 50% 19% 31%
PEN_OS10 40 14 15 58% 20% 22%
Total 127 262 413 16% 33% 51%
TABLE B11: DISTRIBUTION OF MAXIMUM COMPONENT VELOCITY PER AXIS