noaa technical memorandum oar pmel-1 · noaa technical memorandum oar pmel-132 tacoma, ... king...
TRANSCRIPT

UNITED STATESDEPARTMENT OF COMMERCE
Carlos M. GutierrezSecretary
NATIONAL OCEANIC ANDATMOSPHERIC ADMINISTRATION
VADM Conrad C. Lautenbacher, Jr.Under Secretary for Oceansand Atmosphere/Administrator
Office of Oceanic and Atmospheric Research
Richard W. SpinradAssistant Administrator
NOAA Technical Memorandum OAR PMEL-132
TACOMA, WASHINGTON, TSUNAMI HAZARD MAPPING PROJECT:MODELING TSUNAMI INUNDATION FROM TACOMA AND
Angie J. Venturato1
Chris C. Chamberlin1
Diego Arcas
Joint Institute for the Study of the Atmosphere and Ocean (JISAO)University of Washington, Seattle, WA
Pacific Marine Environmental LaboratorySeattle, WA
Pacific Marine Environmental LaboratorySeattle, WAJanuary 2007
1
2
Vasily V. TitovHarold O. Mofjeld2
Frank I. González
1
1
2
SEATTLE FAULT EARTHQUAKES
NOTICE
Mention of a commercial company or product does not constitute an endorsement byNOAA/OAR. Use of information from this publication concerning proprietary productsor the tests of such products for publicity or advertising purposes is not authorized.
Contribution No. 2981 from NOAA/Pacific Marine Environmental Laboratory
Also available from the National Technical Information Service (NTIS)(http://www.ntis.gov)
ii

Contents iii
Contents
1. Background . . . . . . . . . . . . . . . . . . . . . . . . . . . . . 12. Study Area . . . . . . . . . . . . . . . . . . . . . . . . . . . . . 13. Tsunami Sources . . . . . . . . . . . . . . . . . . . . . . . . . 2
3.1 Seattle Fault Scenario . . . . . . . . . . . . . . . . . . . . . . 33.2 Tacoma Fault Scenarios . . . . . . . . . . . . . . . . . . . . . 4
4. Tsunami Model . . . . . . . . . . . . . . . . . . . . . . . . . . 74.1 Digital Elevation Model Development . . . . . . . . . . . . . 74.2 Model Setup . . . . . . . . . . . . . . . . . . . . . . . . . . . 8
5. Discussion of Modeling Results . . . . . . . . . . . . . . . . . 95.1 Seattle Fault Scenario . . . . . . . . . . . . . . . . . . . . . . 10
Offshore Dynamics . . . . . . . . . . . . . . . . . . . . . . . . 10Inundation Details . . . . . . . . . . . . . . . . . . . . . . . . 10
5.2 Tacoma Fault Scenario . . . . . . . . . . . . . . . . . . . . . . 13Offshore Dynamics . . . . . . . . . . . . . . . . . . . . . . . . 13Inundation Details . . . . . . . . . . . . . . . . . . . . . . . . 15
5.3 Rosedale-Dominant Tacoma Fault Scenario . . . . . . . . . . 15Offshore Dynamics . . . . . . . . . . . . . . . . . . . . . . . . 15Inundation Details . . . . . . . . . . . . . . . . . . . . . . . . 16
6. Summary and Conclusions . . . . . . . . . . . . . . . . . . . . 177. Acknowledgments . . . . . . . . . . . . . . . . . . . . . . . . . 198. References . . . . . . . . . . . . . . . . . . . . . . . . . . . . . 19Appendix A: Modeling Products . . . . . . . . . . . . . . . . . . . 22Appendix B: Data Credit . . . . . . . . . . . . . . . . . . . . . . . 23


Tacoma, Washington, Tsunami Hazard Mapping Project:
Modeling tsunami inundation from Tacoma and Seattle Faultearthquakes
Angie J. Venturato1, Diego Arcas1, Vasily V. Titov1, Harold O. Mofjeld2, Chris D.Chamberlin1, Frank I. Gonzalez2
Abstract. As part of a tsunami hazard mapping project funded by the National TsunamiHazard Mitigation Program, the NOAA Center for Tsunami Research (formerly known as the NOAACenter for Tsunami Inundation Mapping Efforts) modeled tsunami inundation for the at-risk coastalcommunity of Tacoma, Washington. Three tsunamigenic moment magnitude 7.3 earthquake sourcescenarios within the lower Puget Sound region were investigated: one along the Seattle Fault, andtwo along the Tacoma fault based on the most recent geophysical evidence. A high-resolutiontsunami model was applied to estimate tsunami propagation in the southern Puget Sound regionand inundation along the greater Tacoma area. These model results (Appendix A) were provided tothe State of Washington for use in tsunami hazard maps to assist in the design of evacuation plansfor the at-risk study area.
1. Background
Puget Sound has a rich history of natural hazards, including large earth-quakes, landslides, and delta failures. Geologic and historic evidence haveshown that some of these past events have generated tsunamis (Johnson etal., 1999; Brocher et al., 2004; Sherrod et al., 2004). A 2002 workshop re-viewed these historic events and recommended potential sources for tsunamiinundation modeling to further assess the coastal hazard (Gonzalez et al.,2003). These recommendations included sources for the Tacoma region.
Though historic tsunamis within the region suggest a higher recurrencerate for a landslide source (Table 1, Fig. 1), workshop participants suggestedthat the “worst-case” scenario would likely have a seismic trigger (Gonzalezet al., 2003). Therefore, this study focuses on tsunamigenic earthquakesfrom Seattle and Tacoma fault sources based on the parameters establishedby workshop participants and further refined by Tom Brocher and Tom Prattfrom the U.S. Geological Survey.
2. Study Area
The study area (Fig. 2) covers the coastal communities of Tacoma, Ruston,Gig Harbor, northern University Place, and the Puyallup Nation reservationin Pierce County and Federal Way, southern Vashon and Maury Islands ofKing County, Washington. Dash Point State Park and several regional parks(including Point Defiance, Titlow Beach, Sunrise Beach, and Ruston Way)lie along the shores of the study area. The region also supports several
1Joint Institute for the Study of the Atmosphere and Ocean (JISAO), University ofWashington, Box 357941, Seattle, WA 98195-4235, USA
2NOAA, Pacific Marine Environmental Laboratory, 7600 Sand Point Way NE, Seattle,WA 98115
2 Venturato et al.
recreational marinas, a major commercial port, two state ferry terminals,and the Tacoma Narrows Bridge.
Maritime activity in Commencement Bay includes eight privately ownedmarine terminals and the publicly owned Port of Tacoma. The Port ofTacoma, the sixth largest commercial port in North America and the majoreconomic engine for Pierce County (Port of Tacoma, 2005), lies at the edgeof the Puyallup River delta. Eight waterways along the delta (Fig. 2b) aremaintained by the U.S. Army Corps of Engineers. A public esplanade linesthe western side of Thea Foss Waterway where several local outdoor eventstake place.
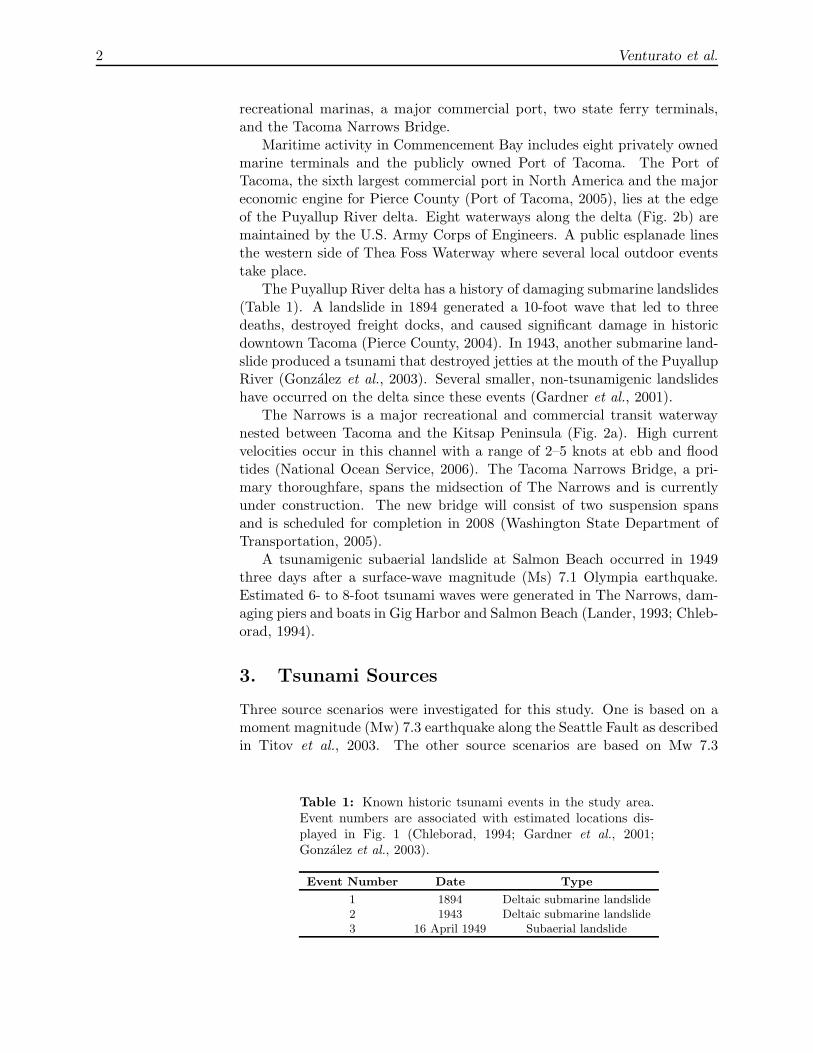
The Puyallup River delta has a history of damaging submarine landslides(Table 1). A landslide in 1894 generated a 10-foot wave that led to threedeaths, destroyed freight docks, and caused significant damage in historicdowntown Tacoma (Pierce County, 2004). In 1943, another submarine land-slide produced a tsunami that destroyed jetties at the mouth of the PuyallupRiver (Gonzalez et al., 2003). Several smaller, non-tsunamigenic landslideshave occurred on the delta since these events (Gardner et al., 2001).
The Narrows is a major recreational and commercial transit waterwaynested between Tacoma and the Kitsap Peninsula (Fig. 2a). High currentvelocities occur in this channel with a range of 2–5 knots at ebb and floodtides (National Ocean Service, 2006). The Tacoma Narrows Bridge, a pri-mary thoroughfare, spans the midsection of The Narrows and is currentlyunder construction. The new bridge will consist of two suspension spansand is scheduled for completion in 2008 (Washington State Department ofTransportation, 2005).
A tsunamigenic subaerial landslide at Salmon Beach occurred in 1949three days after a surface-wave magnitude (Ms) 7.1 Olympia earthquake.Estimated 6- to 8-foot tsunami waves were generated in The Narrows, dam-aging piers and boats in Gig Harbor and Salmon Beach (Lander, 1993; Chleb-orad, 1994).
3. Tsunami Sources
Three source scenarios were investigated for this study. One is based on amoment magnitude (Mw) 7.3 earthquake along the Seattle Fault as describedin Titov et al., 2003. The other source scenarios are based on Mw 7.3
Table 1: Known historic tsunami events in the study area.Event numbers are associated with estimated locations dis-played in Fig. 1 (Chleborad, 1994; Gardner et al., 2001;Gonzalez et al., 2003).
Event Number Date Type
1 1894 Deltaic submarine landslide2 1943 Deltaic submarine landslide3 16 April 1949 Subaerial landslide

Tacoma, Washington, Tsunami Hazard Mapping Project 3
Figure 1: Seattle and Tacoma fault segments used for the study (Brocher et al., 2004). Published faulttraces, co-seismic deformation, and known historic tsunami events are also displayed (Sherrod et al., 2004;Johnson et al., 1999, 2004; Gonzalez et al., 2003; Gardner et al., 2001).
earthquakes along the Tacoma Fault provided by Brocher and Pratt basedon recent fault scarps detected through LIDAR mapping (Sherrod et al.,2004). The detailed structure of both the Seattle and Tacoma faults areunder much debate; however, tsunamigenesis depends primarily on surfacedisplacement, which is fairly well determined by recent work in the field toprovide reasonable assessments of these fault structures (Pratt et al., 1997;Johnson et al., 1999; Sherrod et al., 2004).
Brocher et al. (2004) suggest that the Seattle and Tacoma faults arelinked, such that a seismic event on one fault may trigger movement onthe other. Recent field evidence suggests displacements occurred along bothfaults approximately 1100 years ago (Sherrod et al., 2004). Though the sce-narios are constrained by these measured vertical displacements, this dualitywas not considered in this study. Each fault model is described in detail inthe following subsections.
3.1 Seattle Fault Scenario
The Seattle Fault scenario is based on six segments of varying length, strike,and slip (Table 2). The length and strike parameters are well within the

4 Venturato et al.
Figure 2: Study area of the tsunami hazard mapping project for Tacoma, Washington (a). Details of the(b) Puyallup Delta region and (c) Gig Harbor. Seven sites were selected to delineate time series of tsunamiwave heights and current speeds (Fig. 6).
range of possibilities described in Gonzalez et al., 2003. The slip distribu-tion was constrained to match vertical displacement estimates at RestorationPoint, Alki Point, and West Point (Fig. 1) from a Seattle Fault earthquakein A.D. 900–930 (Bucknam et al., 1992; Atwater, 1999). Table 3 providesa comparison of the computed model displacement (Fig. 3) with field esti-mates.
3.2 Tacoma Fault Scenarios
The Tacoma Fault scenarios were prepared by Tom Pratt and Tom Brocher.Two scenarios of equal probability are considered due to geophysical ev-idence (Brocher et al., 2004; Sherrod et al., 2004). The west end (faultsegment T1) of both scenarios is based on a prominent geophysical linea-ment that extends through Case Inlet as evidenced by seismic tomographyand trenching (Sherrod et al., 2004). The eastern end from Case Inlet toDumas Bay is less defined, with at least three fault lines found north and
Tacoma, Washington, Tsunami Hazard Mapping Project 5
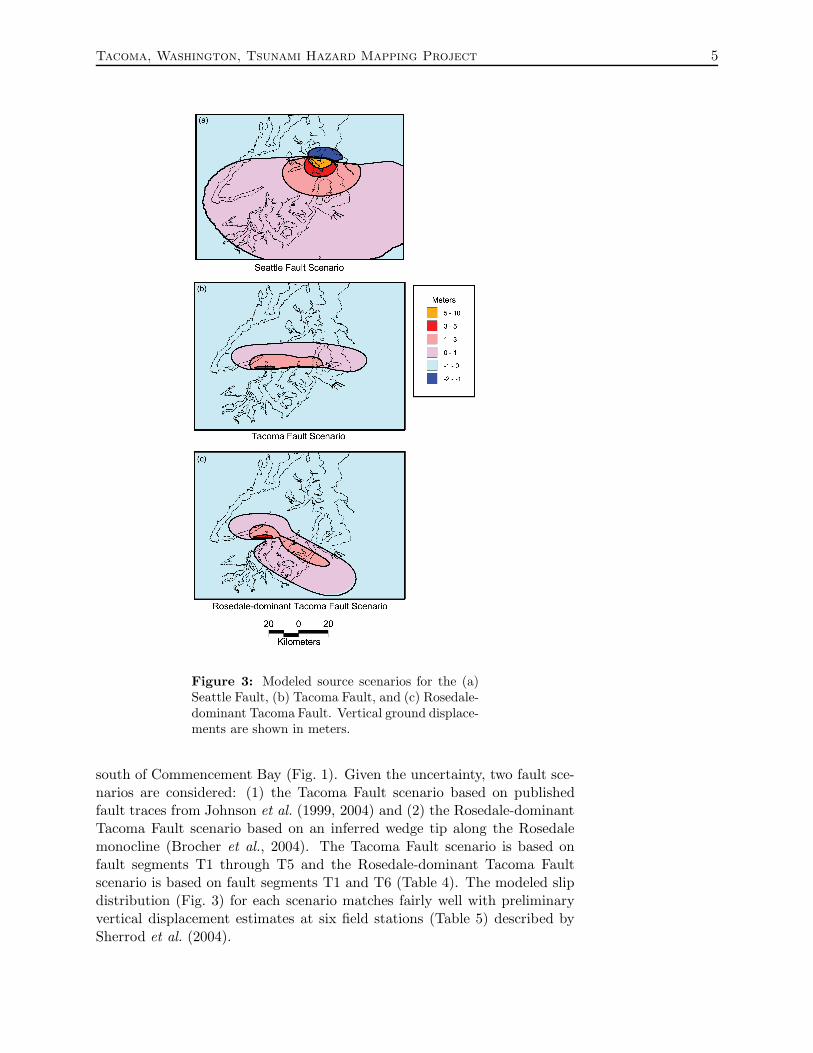
Figure 3: Modeled source scenarios for the (a)Seattle Fault, (b) Tacoma Fault, and (c) Rosedale-dominant Tacoma Fault. Vertical ground displace-ments are shown in meters.
south of Commencement Bay (Fig. 1). Given the uncertainty, two fault sce-narios are considered: (1) the Tacoma Fault scenario based on publishedfault traces from Johnson et al. (1999, 2004) and (2) the Rosedale-dominantTacoma Fault scenario based on an inferred wedge tip along the Rosedalemonocline (Brocher et al., 2004). The Tacoma Fault scenario is based onfault segments T1 through T5 and the Rosedale-dominant Tacoma Faultscenario is based on fault segments T1 and T6 (Table 4). The modeled slipdistribution (Fig. 3) for each scenario matches fairly well with preliminaryvertical displacement estimates at six field stations (Table 5) described bySherrod et al. (2004).
6 Venturato et al.
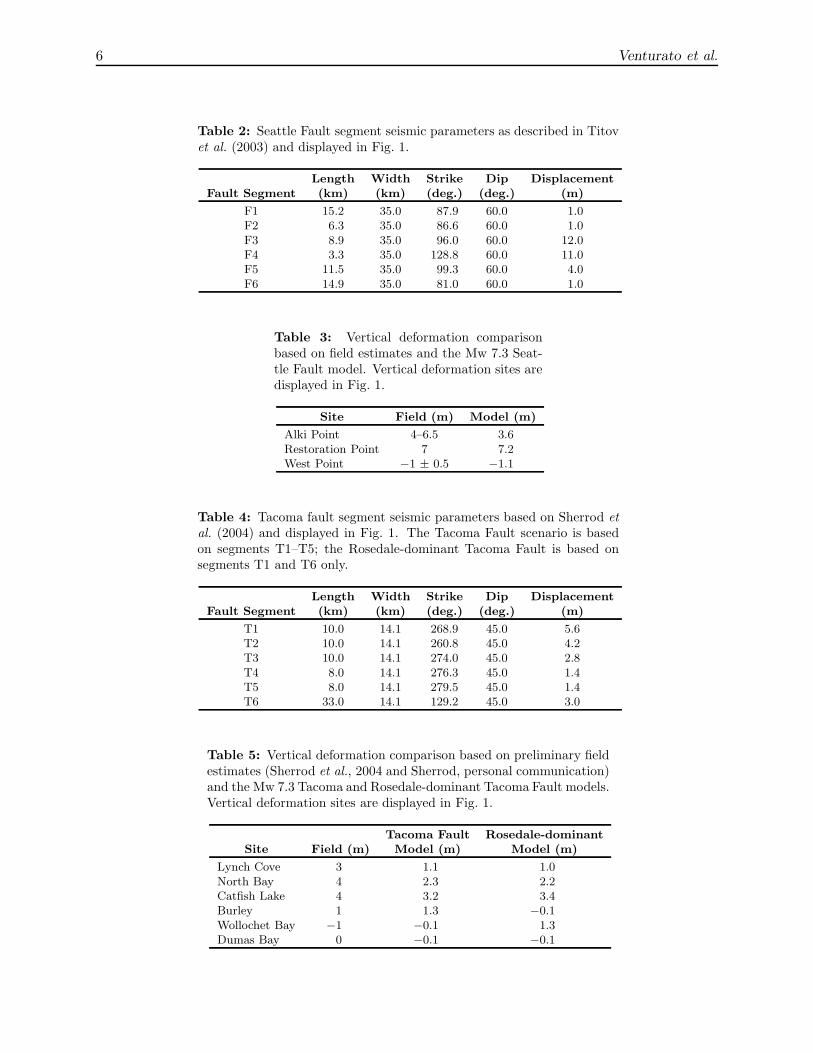
Table 2: Seattle Fault segment seismic parameters as described in Titovet al. (2003) and displayed in Fig. 1.
Length Width Strike Dip DisplacementFault Segment (km) (km) (deg.) (deg.) (m)
F1 15.2 35.0 87.9 60.0 1.0F2 6.3 35.0 86.6 60.0 1.0F3 8.9 35.0 96.0 60.0 12.0F4 3.3 35.0 128.8 60.0 11.0F5 11.5 35.0 99.3 60.0 4.0F6 14.9 35.0 81.0 60.0 1.0
Table 3: Vertical deformation comparisonbased on field estimates and the Mw 7.3 Seat-tle Fault model. Vertical deformation sites aredisplayed in Fig. 1.
Site Field (m) Model (m)
Alki Point 4–6.5 3.6Restoration Point 7 7.2West Point −1 ± 0.5 −1.1
Table 4: Tacoma fault segment seismic parameters based on Sherrod etal. (2004) and displayed in Fig. 1. The Tacoma Fault scenario is basedon segments T1–T5; the Rosedale-dominant Tacoma Fault is based onsegments T1 and T6 only.
Length Width Strike Dip DisplacementFault Segment (km) (km) (deg.) (deg.) (m)
T1 10.0 14.1 268.9 45.0 5.6T2 10.0 14.1 260.8 45.0 4.2T3 10.0 14.1 274.0 45.0 2.8T4 8.0 14.1 276.3 45.0 1.4T5 8.0 14.1 279.5 45.0 1.4T6 33.0 14.1 129.2 45.0 3.0
Table 5: Vertical deformation comparison based on preliminary fieldestimates (Sherrod et al., 2004 and Sherrod, personal communication)and the Mw 7.3 Tacoma and Rosedale-dominant Tacoma Fault models.Vertical deformation sites are displayed in Fig. 1.
Tacoma Fault Rosedale-dominantSite Field (m) Model (m) Model (m)
Lynch Cove 3 1.1 1.0North Bay 4 2.3 2.2Catfish Lake 4 3.2 3.4Burley 1 1.3 −0.1Wollochet Bay −1 −0.1 1.3Dumas Bay 0 −0.1 −0.1
Tacoma, Washington, Tsunami Hazard Mapping Project 7
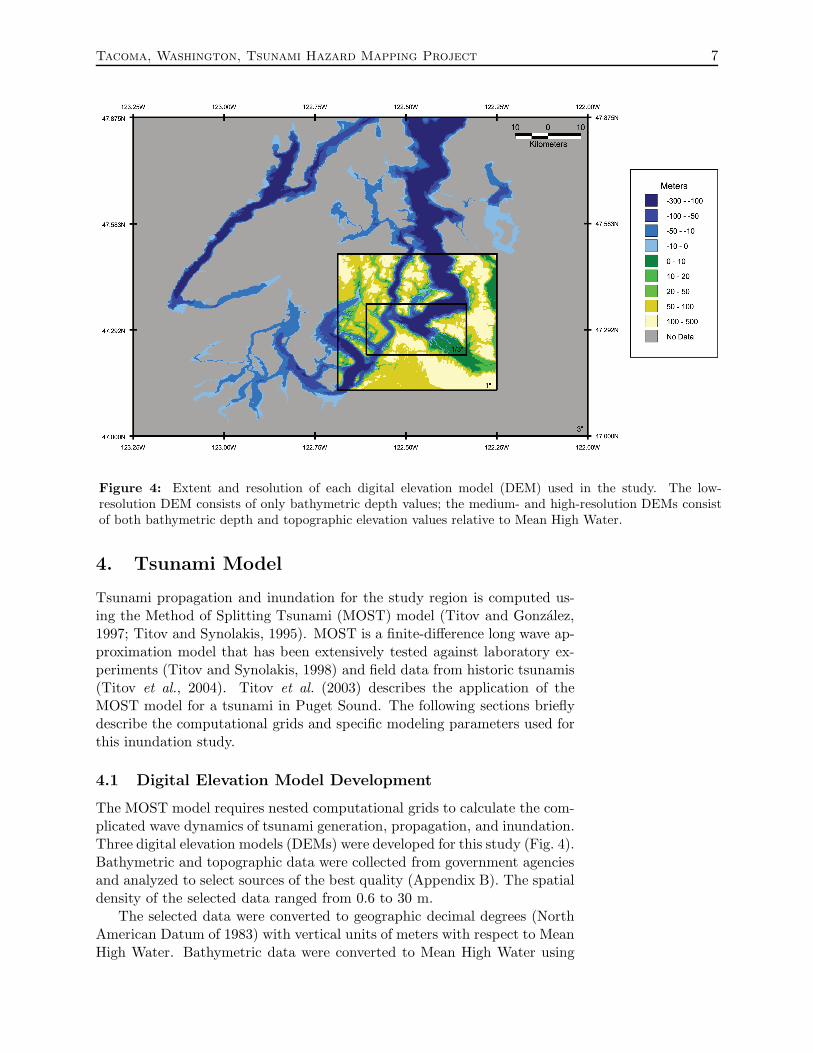
Figure 4: Extent and resolution of each digital elevation model (DEM) used in the study. The low-resolution DEM consists of only bathymetric depth values; the medium- and high-resolution DEMs consistof both bathymetric depth and topographic elevation values relative to Mean High Water.
4. Tsunami Model
Tsunami propagation and inundation for the study region is computed us-ing the Method of Splitting Tsunami (MOST) model (Titov and Gonzalez,1997; Titov and Synolakis, 1995). MOST is a finite-difference long wave ap-proximation model that has been extensively tested against laboratory ex-periments (Titov and Synolakis, 1998) and field data from historic tsunamis(Titov et al., 2004). Titov et al. (2003) describes the application of theMOST model for a tsunami in Puget Sound. The following sections brieflydescribe the computational grids and specific modeling parameters used forthis inundation study.
4.1 Digital Elevation Model Development
The MOST model requires nested computational grids to calculate the com-plicated wave dynamics of tsunami generation, propagation, and inundation.Three digital elevation models (DEMs) were developed for this study (Fig. 4).Bathymetric and topographic data were collected from government agenciesand analyzed to select sources of the best quality (Appendix B). The spatialdensity of the selected data ranged from 0.6 to 30 m.
The selected data were converted to geographic decimal degrees (NorthAmerican Datum of 1983) with vertical units of meters with respect to MeanHigh Water. Bathymetric data were converted to Mean High Water using

8 Venturato et al.
Table 6: Vertical control. Values are withrespect to Mean Lower Low Water based onthe Tacoma National Ocean Service secondarywater-level control station 944-6484.
Datum Meters
TIDE22 (Local datum) 5.901Mean High Water 3.336Mean Sea Level 2.094North American Vertical Datum 1988 0.758Port datum (Local datum) 0.137Mean Lower Low Water 0.000
Table 7: Quantitative root mean square (RMS) error estimate of the DEMs. Estimated RMSerror was calculated based on source references (Hess and Smith, 2004; Snyder, 1987) and methodsdescribed in Venturato (2005). The total error is the sum of the quantitative values. Subjectiveinterpretation due to combining multiple data sources adds unknown error to the DEMs.
Horizontal Error Range Vertical Error RangeError Type (m) (m)
Projection/datum conversion 0.15–0.25 0.03–0.20Comparison with vertical control benchmarks N/A 0.27–1.81Comparison with original data sources 0.67–10 0.35–0.98Total known quantitative error 0.82–10.25 0.65–2.99
local datum conversions from the U.S. Army Corps of Engineers, the Portof Tacoma, and the vertical datum conversion tool known as VDatum (Hessand White, 2004). Topographic data were converted to Mean High Waterusing tidal and geodetic benchmark information from the National OceanService. Table 6 provides more information about vertical datum conversionvalues.
A shoreline file representing the Mean High Water line was generatedbased on data from the Washington State Department of Ecology and thePort of Tacoma. Piers with open pile foundations were removed from theshoreline data since tsunami waves can propagate under them.
DEMs of 1/3-, 1-, and 3-arc-second resolution for tsunami inundation,propagation, and generation regions, respectively, were developed using De-launey triangulation and natural neighbor interpolation. Though assessingthe quality of a DEM based on multiple data sources is difficult, an at-tempt to quantify some factors of error (Table 7) were made using methodsdescribed in Venturato (2005).
4.2 Model Setup
The 1/3-, 1-, and 3-arc-second DEMs were converted to ASCII raster gridsand then sub-sampled to 1-, 3-, and 9-arc-second grids to ease the computa-tional load on the MOST model. Since the grids are based on a “bald-earth”(Venturato et al., 2005), a bottom friction coefficient is used in the model.The Manning parameter for this study was set to 0.055.

Tacoma, Washington, Tsunami Hazard Mapping Project 9
Figure 5: Maximum inundation (a, c, e) and maximum wave speeds (b, d, f) for each source scenario.The Seattle Fault scenario has the most inundation and highest currents. The Tacoma Fault scenario hassignificant inundation in the Port of Tacoma region, but with smaller amplitudes. The Rosedale-dominantTacoma Fault scenario depicts the least inundation and lowest current speeds.
5. Discussion of Modeling Results
All three scenarios create significant vertical displacements along their re-spective fault surfaces. The Seattle Fault scenario creates the most intensecurrents and inundation (Figs. 5, 6) within the study area due to the largedisplacement of water in the deepest and widest region of Puget Sound. TheTacoma Fault scenario causes less inundation overall since much less wa-ter is displaced in the narrower and shallower regions of Carr Inlet, ColvosPassage, and East Passage. The Rosedale-dominant Tacoma Fault scenariocauses the least amount of inundation in the study region due to relativelysmall displacements in the regional channels.
Most inundation occurs within low-lying, relatively flat regions of thestudy area such as the Port of Tacoma harbor in Commencement Bay. Min-imal inundation occurs along steep topographical slopes. Consequently, theinundation is determined primarily by local topography rather than offshorewave dynamics. This correlates well with previous observations of long pe-riod tsunami waves, which lose their energy via bottom friction over long
10 Venturato et al.
penetration distances (Titov et al., 2003). The following sections providemore details on the offshore wave dynamics and inundation of each tsunami-genic scenario.
Due to constraints of the inundation grid, the model does not cover thefull extent of wave propagation in the upper Puyallup River; subsequently,the wave reflects off the edge of the grid boundary leading to potentiallynonphysical inundation within the City of Fife and Puyallup Nation territory.
5.1 Seattle Fault Scenario
Offshore Dynamics
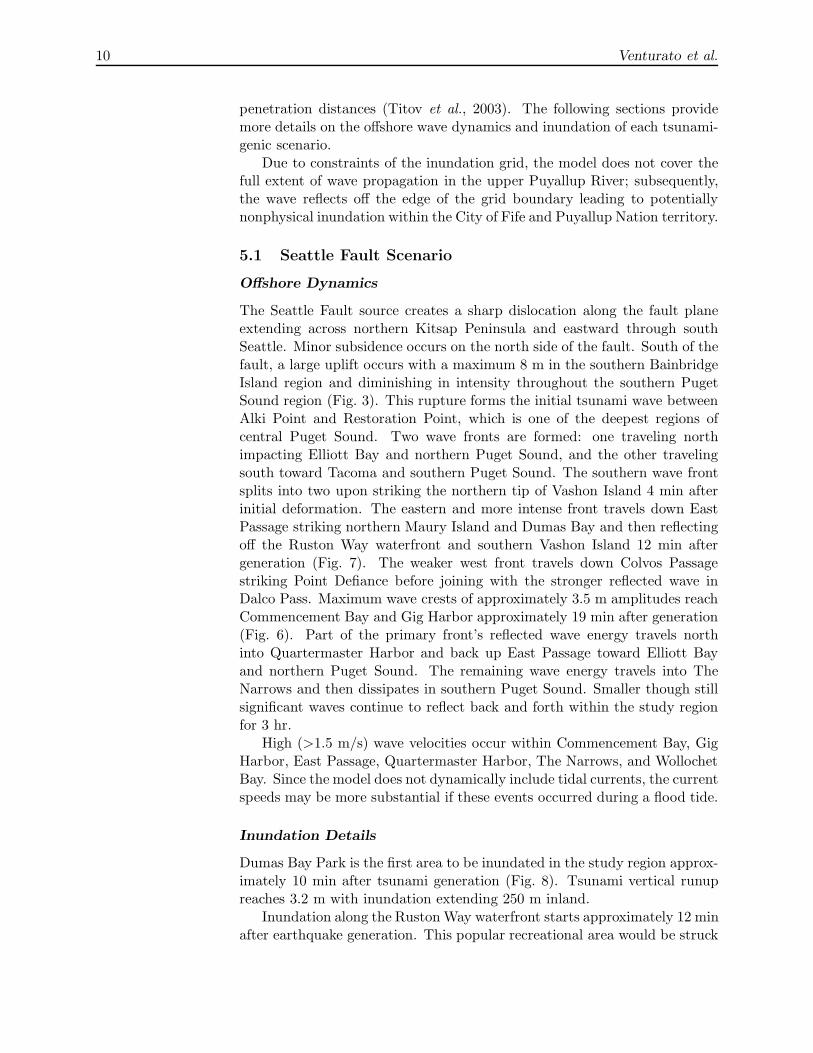
The Seattle Fault source creates a sharp dislocation along the fault planeextending across northern Kitsap Peninsula and eastward through southSeattle. Minor subsidence occurs on the north side of the fault. South of thefault, a large uplift occurs with a maximum 8 m in the southern BainbridgeIsland region and diminishing in intensity throughout the southern PugetSound region (Fig. 3). This rupture forms the initial tsunami wave betweenAlki Point and Restoration Point, which is one of the deepest regions ofcentral Puget Sound. Two wave fronts are formed: one traveling northimpacting Elliott Bay and northern Puget Sound, and the other travelingsouth toward Tacoma and southern Puget Sound. The southern wave frontsplits into two upon striking the northern tip of Vashon Island 4 min afterinitial deformation. The eastern and more intense front travels down EastPassage striking northern Maury Island and Dumas Bay and then reflectingoff the Ruston Way waterfront and southern Vashon Island 12 min aftergeneration (Fig. 7). The weaker west front travels down Colvos Passagestriking Point Defiance before joining with the stronger reflected wave inDalco Pass. Maximum wave crests of approximately 3.5 m amplitudes reachCommencement Bay and Gig Harbor approximately 19 min after generation(Fig. 6). Part of the primary front’s reflected wave energy travels northinto Quartermaster Harbor and back up East Passage toward Elliott Bayand northern Puget Sound. The remaining wave energy travels into TheNarrows and then dissipates in southern Puget Sound. Smaller though stillsignificant waves continue to reflect back and forth within the study regionfor 3 hr.
High (>1.5 m/s) wave velocities occur within Commencement Bay, GigHarbor, East Passage, Quartermaster Harbor, The Narrows, and WollochetBay. Since the model does not dynamically include tidal currents, the currentspeeds may be more substantial if these events occurred during a flood tide.
Inundation Details
Dumas Bay Park is the first area to be inundated in the study region approx-imately 10 min after tsunami generation (Fig. 8). Tsunami vertical runupreaches 3.2 m with inundation extending 250 m inland.
Inundation along the Ruston Way waterfront starts approximately 12 minafter earthquake generation. This popular recreational area would be struck

Tacoma, Washington, Tsunami Hazard Mapping Project 11
Figure 6: Time series of tsunami wave heights and current speeds at select sites of the study region.Figure 1 displays the associated site locations.

12 Venturato et al.
Figure 7: Modeled tsunami propagation in Puget Sound from the Seattle Fault scenario. Snapshots are in15-min intervals with wave amplitudes in meters.
with an initial maximum 3.2-m wave overtopping several piers and inundat-ing the sole roadway along the waterfront.
Approximately 14 min after generation, the tsunami starts to inundatethe Port of Tacoma and the Thea Foss Waterway, building to a 3.5-m wavethat overtops port facilities, the public esplanade, and adjacent low-lyingneighborhoods as harbor channels and the Puyallap River flood. The totalinundation area extends over 5 km inland along the Puyallup River delta.
Inundation occurs at both State ferry terminals approximately 18 minafter tsunami generation. The Tahlequah terminal at the southern point ofVashon Island is hit with an initial 3.3-m wave with speeds ranging from5–7 m/s and overtopping the dock and staging area. A 3.9-m wave strikesthe Point Defiance terminal and marina at speeds of approximately 3 m/s.Inundation extends 80 m inland on a slag fill peninsula, an EnvironmentalProtection Agency Superfund site (Washington State Department of Trans-portation, 2006), flooding the main marina access road northeast of theterminal.
The tsunami wave arrives at Gig Harbor approximately 19 min after

Tacoma, Washington, Tsunami Hazard Mapping Project 13
Figure 8: Modeled tsunami inundation in the study region from the Seattle Fault scenario. Snapshots arein 10-min intervals starting near the time of initial inundation at the Port of Tacoma. Wave heights are inmeters with respect to Mean High Water.
generation. Tsunami vertical runups above 2 m occur along the northern-most tip of the harbor, inundating a local park. Current speeds are 1–2 m/swithin the harbor, and reach above 5 m/s at the harbor entrance.
High current speeds ranging from 2–3 m/s also occur in the Narrows(Fig. 6). The initial wave reaches Titlow Park approximately 20 min aftertsunami generation. The southern half of Titlow Park and a rail line arecompletely inundated with maximum wave runups reaching 3 m.
5.2 Tacoma Fault Scenario
Offshore Dynamics
The Tacoma Fault scenario creates a moderate uplift north of the fault planewith minimal subsidence (<0.5 m) south of the fault. The sharpest dislo-cation (3.4 m) occurs along the western edge of the fault, with diminishingintensity eastward. Much of the dislocation occurs on land and the shallowregions of Lynch Cove, North Bay, and Burley Lagoon. Smaller ruptures(0.7–2 m) along the eastern edge of the fault form the primary tsunamiwave energy within Colvos Passage, Quartermaster Harbor, and East Pas-sage (Fig. 3).
The initial displacement splits the wave energy into northbound and

14 Venturato et al.
Figure 9: Modeled tsunami propagation in Puget Sound from the Tacoma Fault scenario. Snapshots arein 15-min intervals with wave heights in meters.
southbound fronts. The southbound front in Colvos Passage strikes PointDefiance 5 min after tsunami generation and subsequently splits further intoa 0.5-m wave traveling into Dalco Pass, a 0.7-m wave into Gig Harbor, anda 0.8-m wave down The Narrows (Fig. 6).
The southbound front in East Passage creates a 1-m wave crest thatstrikes Dumas Bay 3 min after generation before joining the wave in DalcoPass and a smaller wave from Quartermaster Harbor before reaching Com-mencement Bay. Part of the combined wave energy is reflected off the Rustonwave waterfront and travels back into East Passage. The remaining waveenergy strikes the Port of Tacoma with a wave crest of 0.6 m approximately10 min after generation.
The wave traveling down The Narrows reaches Fox Island 15 min aftergeneration and then splits into a wave front traveling up Hale Passage andanother toward Nisqually Reach dissipating in south Puget Sound (Fig. 9).Wave crests of 0.8 m amplitudes reach Wollochet Bay 20 min after gener-ation. Smaller wave activity is witnessed throughout the study region forapproximately 1.5 hr.

Tacoma, Washington, Tsunami Hazard Mapping Project 15
High current speeds (>1.5 m/s) occur at the entrance to Gig Harbor,both ferry terminals, Port of Tacoma waterways, and the recreational areaof Dumas Bay.
Inundation Details
Dumas Bay Park is inundated approximately 3 min after tsunami generationwith vertical runups reaching 3.5 m (Fig. 5). The waterfront promenadealong the north side of Point Defiance Park is struck 5 min after generationwith maximum vertical runups reaching 2 m.
Inundation along both ferry terminals occur approximately 7 min aftergeneration with runups reaching 1.5 m and current speeds ranging from 2–3 m/s. Gig Harbor is struck next at 8 min with maximum vertical runupsreaching 2 m and inundating the local boat marina. Inundation along theRuston Way waterfront starts approximately 8 min after generation withthe highest runup values of 2.4 m inundating the promenade and roadway.
The tsunami hits the Thea Foss Waterway and Port of Tacoma with aninitial 0.6-m wave 10 min after generation. The initial wave front does notovertop port facilities; instead, the wave crest builds up in the waterwaysand begins overflowing port banks at 15 min. Resonance in the waterwaysand Puyallup River continue to overflow the channels, and the port andpublic esplanade are slowly inundated over a period of 3 hr (Fig. 10). Themajority of the port has runup values around 1 m, though maximum verticalrunups reach 3 m at the termini of Blair and Thea Foss waterways and alongPuyallup River banks. The total inundation area extends over 3 km inland.
Current speeds are relatively low in The Narrows, ranging from 0.2–0.4 m/s (Fig. 6). The initial wave crest inundates Titlow Park approximately12 min after generation with maximum runups reaching 2.5 m and washingover the rail line.
5.3 Rosedale-Dominant Tacoma Fault Scenario
Offshore Dynamics
The Rosedale-dominant Tacoma Fault scenario creates moderate uplift(3.6 m) north of the fault plane. Like the Tacoma Fault scenario, the sharpestdislocation occurs primarily on land and shallow waters along the westernedge of the fault. A smaller rupture (1.3 m) on the 33-km fault segment alongthe Rosedale monocline initiates the primary water displacement within CarrInlet, Wollochet Bay, Hale Passage, and The Narrows (Fig. 3).
Within the primary rupture zone, high currents (>1.5 m/s) occur withinWollochet Bay and along the shores of Titlow Park. Moderate current speeds(0.5–1.2 m/s) occur within Hale Passage and The Narrows. Most of theinitial tsunami energy is directed toward Nisqually Reach traveling into CaseInlet and Dana Passage (Fig. 2) where it dissipates in the shallow waters ofsouthwestern Puget Sound. A strong wave also strikes Burley lagoon at theterminus of Carr Inlet within 10 min of generation (Fig. 11).
Remaining wave energy travels north up The Narrows with the initialwave front diminishing from 0.8 to 0.4 m before reaching the entrance to
16 Venturato et al.
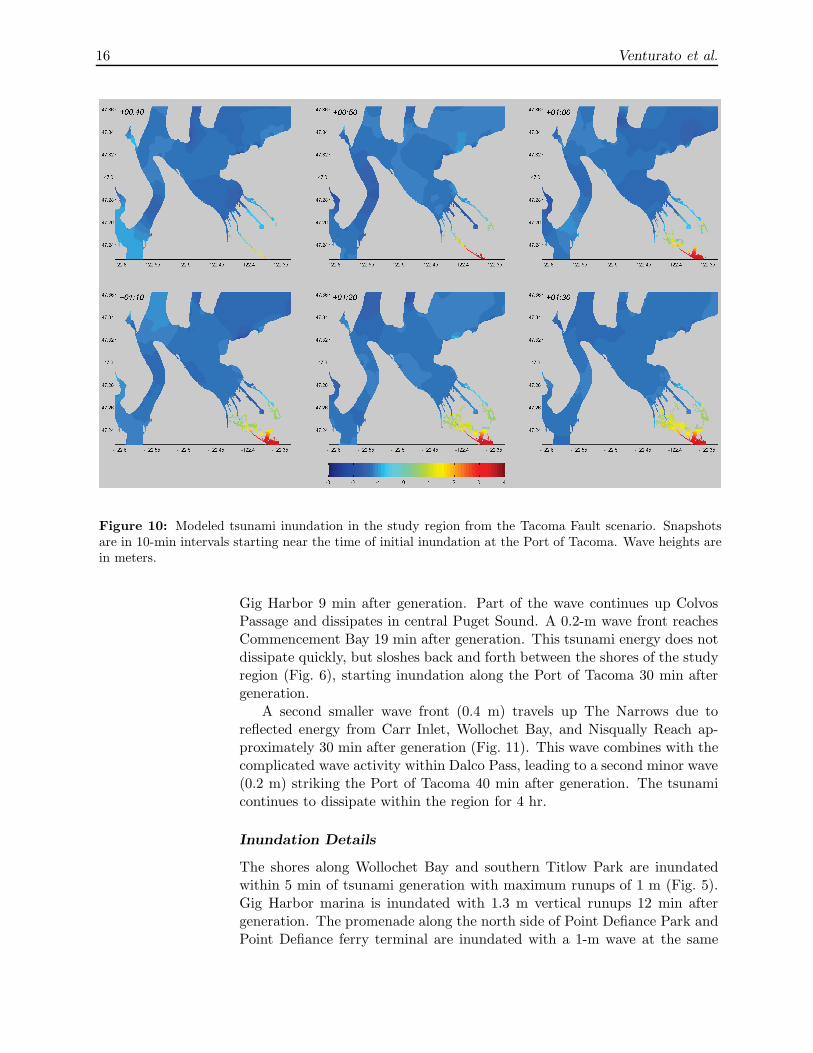
Figure 10: Modeled tsunami inundation in the study region from the Tacoma Fault scenario. Snapshotsare in 10-min intervals starting near the time of initial inundation at the Port of Tacoma. Wave heights arein meters.
Gig Harbor 9 min after generation. Part of the wave continues up ColvosPassage and dissipates in central Puget Sound. A 0.2-m wave front reachesCommencement Bay 19 min after generation. This tsunami energy does notdissipate quickly, but sloshes back and forth between the shores of the studyregion (Fig. 6), starting inundation along the Port of Tacoma 30 min aftergeneration.
A second smaller wave front (0.4 m) travels up The Narrows due toreflected energy from Carr Inlet, Wollochet Bay, and Nisqually Reach ap-proximately 30 min after generation (Fig. 11). This wave combines with thecomplicated wave activity within Dalco Pass, leading to a second minor wave(0.2 m) striking the Port of Tacoma 40 min after generation. The tsunamicontinues to dissipate within the region for 4 hr.
Inundation Details
The shores along Wollochet Bay and southern Titlow Park are inundatedwithin 5 min of tsunami generation with maximum runups of 1 m (Fig. 5).Gig Harbor marina is inundated with 1.3 m vertical runups 12 min aftergeneration. The promenade along the north side of Point Defiance Park andPoint Defiance ferry terminal are inundated with a 1-m wave at the same

Tacoma, Washington, Tsunami Hazard Mapping Project 17
Figure 11: Modeled tsunami propagation in Puget Sound from the Rosedale-dominant Tacoma Faultscenario. Snapshots are in 15-min intervals with wave heights in meters.
time. The Tahlequah ferry terminal receives minor inundation and currentspeeds at both terminals are small (<0.3 m/s).
Inundation at the Port of Tacoma begins 30 min after generation astsunami energy builds up in the Puyallup River overtopping its banks. Theregion around the river is slowly flooded with average vertical runups of0.5 m (Fig. 12). This flooding starts to spill into Thea Foss Waterway 2 hrafter the earthquake, just as another round of minor tsunami waves reachesthe waterway. This causes resonant activity within the waterway that buildsup, eventually overflowing the channel and causing minor inundation (0.3 m)along the Thea Foss esplanade 3 hr after the earthquake. The remainingwaterways do not contribute to the inundation.
6. Summary and Conclusions
This project studied local tsunami inundation and regional propagation ef-fects in the greater Tacoma and Gig Harbor region based on three mod-eling scenarios simulating tsunamigenic earthquakes along the Seattle and
18 Venturato et al.
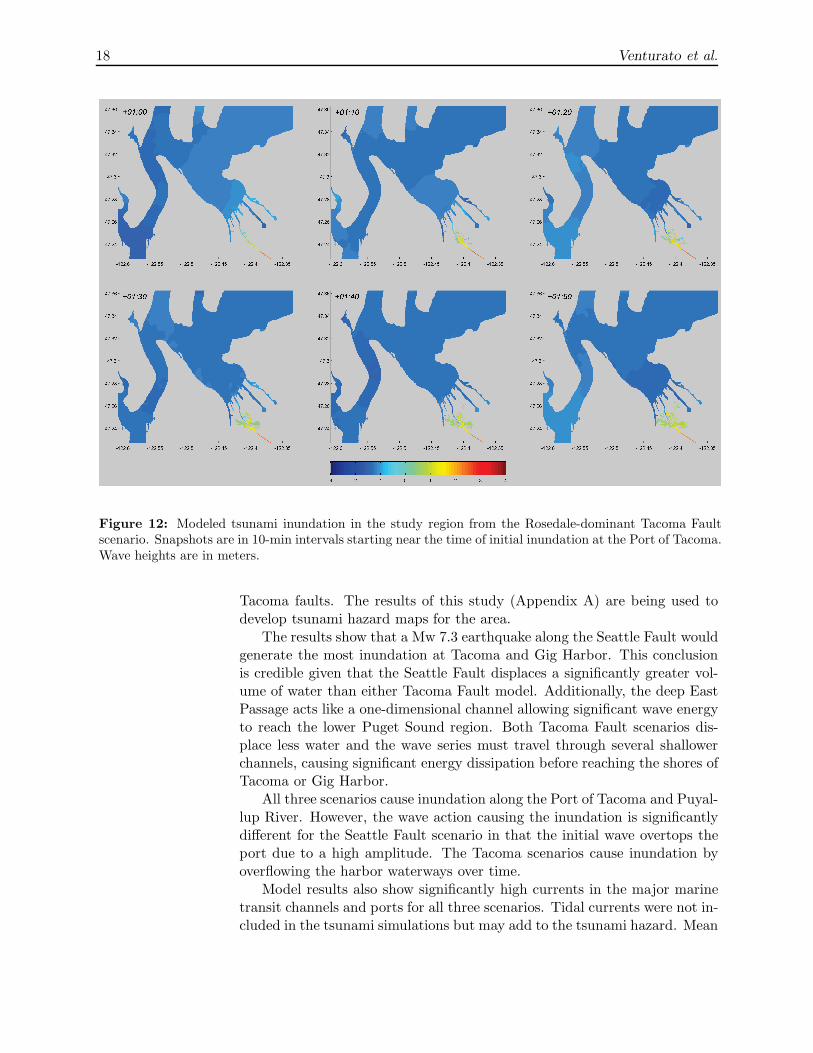
Figure 12: Modeled tsunami inundation in the study region from the Rosedale-dominant Tacoma Faultscenario. Snapshots are in 10-min intervals starting near the time of initial inundation at the Port of Tacoma.Wave heights are in meters.
Tacoma faults. The results of this study (Appendix A) are being used todevelop tsunami hazard maps for the area.
The results show that a Mw 7.3 earthquake along the Seattle Fault wouldgenerate the most inundation at Tacoma and Gig Harbor. This conclusionis credible given that the Seattle Fault displaces a significantly greater vol-ume of water than either Tacoma Fault model. Additionally, the deep EastPassage acts like a one-dimensional channel allowing significant wave energyto reach the lower Puget Sound region. Both Tacoma Fault scenarios dis-place less water and the wave series must travel through several shallowerchannels, causing significant energy dissipation before reaching the shores ofTacoma or Gig Harbor.
All three scenarios cause inundation along the Port of Tacoma and Puyal-lup River. However, the wave action causing the inundation is significantlydifferent for the Seattle Fault scenario in that the initial wave overtops theport due to a high amplitude. The Tacoma scenarios cause inundation byoverflowing the harbor waterways over time.
Model results also show significantly high currents in the major marinetransit channels and ports for all three scenarios. Tidal currents were not in-cluded in the tsunami simulations but may add to the tsunami hazard. Mean

Tacoma, Washington, Tsunami Hazard Mapping Project 19
High Water is used as a background level for the inundation model, with theassumption that tides interact linearly with the propagating tsunami wave.
This study provides a good first step toward analyzing the impact oftsunamigenic earthquakes within Puget Sound on Tacoma and Gig Harbor.However, this study does not consider tsunamigenic landslides that occurdue to earthquakes or other mechanisms. Lower Puget Sound has a historyof tsunamigenic subaerial and submarine landslides along the Puyallup deltaand The Narrows (Fig. 1, Table 1). Slope stability maps also suggest a highprobability of subaerial or submarine landslides within the study region.Gonzalez et al. (2003) suggest that a deltaic submarine landslide associatedwith a major earthquake would produce a credible “worst-case” scenario forthe study region.
The results of this study led to recommendations for future research intsunamigenic hazards within lower Puget Sound:
• Research the inclusion of dynamic tidal interaction with the model.
• Characterize the geometry of potential deltaic and non-deltaic land-slides within the study region.
• Review the tsunamigenic sources for the hazard every few years asnew research adds to the understanding of the Seattle-Tacoma faultstructures and their possible relationship.
7. Acknowledgments
This research was funded by the National Tsunami Hazard Mitigation Pro-gram via a grant from the Washington State Emergency Management Di-vision. This publication is partially funded by the Joint Institute for theStudy of the Atmosphere and Ocean (JISAO) under NOAA CooperativeAgreement No. NA17RJ1232, Contribution #1338.
The authors thank George Crawford (Washington State Emergency Man-agement Division), Tim Walsh (Washington State Department of NaturalResources), Tom Brocher (U.S. Geological Survey), Brian Sherrod (U.S. Ge-ological Survey), Tom Pratt (U.S. Geological Survey), and Craig Weaver(U.S. Geological Survey) for assistance with the tsunamigenic sources forthis study.
We also thank Rene Rodriguez (University of Washington), Jon Kulju(Port of Tacoma), and Lonnie Reid-Pell (U.S. Army Corps of Engineers) forassistance with data sources and processing.
8. References
Atwater, B.F. (1999): Radiocarbon dating of a Seattle earthquake to A.D. 900–930.Seis. Res. Lett., 70, 232.
Brocher, T.M., R.J. Blakely, and R.E. Wells (2004): Interpretation of the SeattleUplift, Washington, as a Passive-Roof Duplex. Bull. Seis. Soc. Am., 94(4),1379–1401.

20 Venturato et al.
Bucknam, R.C., E. Hemphill-Haley, and E.B. Leopold (1992): Abrupt uplift withinthe past 1700 years at southern Puget Sound, Washington. Science, 258, 1611–1614.
Chleborad, A.F. (1994): Modeling and analysis of the 1949 Narrows landslide,Tacoma, Washington. Bull. Assoc. Eng. Geol., 31, 305–327.
Gardner, J.V., E.J. van den Ameele, G. Gelfenbaum, W. Barnhardt, H. Lee, and S.Palmer (2001): Mapping southern Puget Sound delta fronts after 2001 earth-quake. Eos Trans., Am. Geophys. Union, 82(42), 485, 488–489.
Gonzalez, F.I., B.L. Sherrod, B.F. Atwater, A.P. Frankel, S.P. Palmer, M.L. Holmes,R.E. Karlin, B.E. Jaffe, V.V. Titov, H.O. Mofjeld, and A.J. Venturato (2003):Puget Sound Tsunami Sources—2002 Workshop Report. NOAA OAR SpecialReport, 34 pp.
Hess, K.W., and S.A. White (2004): VDatum for Puget Sound: Generation of thegrid and population with tidal datums and sea surface topography. NOAATech. Memo. NOS CS 4, 27 pp.
Johnson, S.Y., R.J. Blakely, W.J. Stephenson, S.V. Dadisman, and M.A. Fiser(2004): Active shortening of the Cascadia forearc and implications for seismichazards of the Puget Lowland. Tectonics, 23, TC1011.
Johnson, S.Y., S.V. Dadisman, J.R. Childs, and W.D. Stanley (1999): Active tec-tonics of the Seattle fault and central Puget Sound, Washington—Implicationsfor earthquake hazards. Geol. Soc. Am. Bull., 111, 1042–1053.
Lander, J.F., P.A. Lockridge, and M.J. Kozuch (1993): Tsunamis affecting thewest coast of the United States 1806–1992. NGDC Key to Geophysical RecordDocumentation 29, NOAA, 242 pp.
National Ocean Service (2006): Predicted Tidal Currents for The Narrows. http://tidesandcurrents.noaa.gov/
Pierce County (2004): Pierce County Hazard Mitigation Plan. Pierce County De-partment of Emergency Management, Section 4.
Port of Tacoma (2005): Economic Impact of the Port of Tacoma. Port of TacomaCommission, 42 pp.
Pratt, T.L., S. Johnson, C. Potter, W. Stephenson, and C. Finn (1997): Seismicreflection images beneath Puget Sound, western Washington State: The PugetLowland thrust sheet hypothesis. J. Geophys. Res., 102(B12), 27,469–27,489.
Sherrod, B.L., T.M. Brocher, C.S. Weaver, R.C. Bucknam, R.J. Blakely, H.M.Kelsey, A.R. Nelson, R. Haugerud (2004): Holocene fault scarps near Tacoma,Washington. Geology, 32(1), 9–12.
Snyder, J.P. (1987): Map Projections—A working manual. USGS ProfessionalPaper 1395, 383 pp.
Titov, V.V., F.I. Gonzalez, E.N. Bernard, M.C. Eble, H.O. Mofjeld, J.C. Newman,and A.J. Venturato (2004): Real-time tsunami forecasting: Challenges andsolutions. Nat. Haz., 35(1), 41–58.
Titov, V.V., F.I. Gonzalez, H.O. Mofjeld, and A.J. Venturato (2003): NOAA TIMESeattle Tsunami Mapping Project: Procedures, Data Sources, and Products.NOAA Tech. Memo. OAR PMEL-124, 21 pp.
Titov, V.V. and F.I. Gonzalez (1997): Implementation and testing of the Methodof Splitting Tsunami (MOST) model. NOAA Tech. Memo. ERL PMEL-112,11 pp.
Titov, V.V., and C.E. Synolakis (1998): Numerical modeling of tidal wave runup.J. Waterw. Port Coast. Ocean Eng., 124(4), 157–171.
Titov, V.V., and C.E. Synolakis (1995): Modeling of breaking and non-breakinglong wave evolution and runup using VTCS-2. J. Waterw. Port Coast. Ocean.Eng., 121(6), 306–316.
Venturato, A.J. (2005): A digital elevation model for Seaside, Oregon: Procedures,data sources, and analyses. NOAA Tech. Memo. OAR PMEL-129, 17 pp.

Tacoma, Washington, Tsunami Hazard Mapping Project 21
Washington State Department of Transportation (2006): Point Defiance and Tahle-quah Ferry Terminal Feasibility Study. http://www.wsdot.wa.gov/Projects/
Washington State Department of Transportation (2005): The Tacoma NarrowsBridge Project Folio. http://www.tacomanarrowsbridge.com/

22 Venturato et al.
Appendix A: Modeling Products
Model results, metadata, and documentation were provided to the Wash-ington State Division of Geology and Earth Resources and the WashingtonState Military Department Emergency Management Division, which are re-sponsible for redistribution of these products. A list of the data series isprovided in Table A1. All geospatial data are in ESRI ArcGIS© formatwith the following parameters:
• Projection: State Plane Coordinate System Zone 5626 (WashingtonSouth)
• XY Units: feet
• Z Units: meters or meters/second
• Horizontal Datum: North American Datum of 1983
• Vertical Datum: Mean High Water
Table A1: Product summary.
Item Name Type
0 Presentations, Product Report, Grid Report Documentation1 sea animation, tac animation,
tacrd animationAnimations of tsunami propagation and
inundation
2 DEMs, Legends, Shoreline, Timeseries sites,Model Grids, Source Scenarios
Geospatial data in ESRI ArcGIS© shapefileor ASCII Raster format
3 hi res images, low res images Images for use in maps or generaldistribution
4 wa tacoma FGDC-compliant metadata5 tac timeseries Tsunami time series at selected points of
interest

Tacoma, Washington, Tsunami Hazard Mapping Project 23
Appendix B: Data Credit
NOAA National Geodetic Survey (2004): Vertical Geodetic Control Data.Silver Spring, Maryland. http://www.ngs.noaa.gov/
NOAA National Geophysical Data Center (2002): NOS Hydrographic Data-base, GEODAS Version 4.1.18. Boulder, Colorado. http://ngdc.noaa.gov/
NOAA National Ocean Service (2004): Regional Water-Level Station Bench-marks. Silver Spring, Maryland. http://tidesandcurrents.noaa.gov/benchmarks/
NOAA National Ocean Service Coastal Survey Development Laboratory(2004): VDatum Transformation Tool Version 1.06. Silver Spring,Maryland. http://nauticalcharts.noaa.gov/csdl/vdatum.htm
Port of Tacoma: 2002 Topographic contours. http://www.portoftacoma.com/
U.S. Army Corps of Engineers (2001): Tacoma Harbor, Blair Waterway,and Hylebos Waterway Condition Surveys. Seattle, Washington. http://www.nws.usace.army.mil/
U.S. Geological Survey EROS Data Center (1999): Seamless Data Distri-bution System National Elevation Dataset. Boulder, Colorado. http://seamless.usgs.gov/
U.S. Geological Survey (2001): Multibeam Mapping of the Major Deltasof Southern Puget Sound, Washington, Open-File Report OF01-266.Menlo Park, California. http://geopubs.wr.usgs.gov/open-file/of01-266/
Washington State Department of Ecology (2001): Washington State MarineShorelines. Olympia, Washington. http://www.ecy.wa.gov/services/gis/