nltha and pushover analysis for steel frames with flag ... · braced steel frame building models...
TRANSCRIPT

NLTHA and Pushover Analysis for Steel Frames
with Flag-shaped Hysteretic Braces
J.B. McInerney University of Cambridge, UK
J.C. Wilson McMaster University, Canada
SUMMARY:
In this study, non-linear time history and pushover analysis of 1, 2, 4, and 8 storey chevron-braced steel frame
models was carried out for braces having flag-shaped and bilinear hysteresis characteristics. For the NLTHA
each frame was subjected to an ensemble of ground motions to determine their mean responses. The NLTHA
revealed that frames with flag-shaped braces experienced lower residual drifts and those with bilinear braces
experienced lower accelerations. However, the behaviour of the frames was generally governed by the backbone
curve of the brace hysteresis defined by a post-yielding stiffness parameter, a normalized yield force, and a
normalized stiffness. Increasing these parameters generally decreased interstorey drift and increased base shear
– trends also evident from the pushover analyses. An energy dissipation parameter had relatively little effect on
the response – further supporting the utility of pushover analyses.
Keywords: Flag-shaped hysteresis, bilinear hysteresis, braced steel frame, NLTHA, pushover analysis
1. INTRODUCTION
In this study, non-linear time history analyses (NLTHA) and pushover analyses of four chevron-
braced steel frame building models were carried out using the programs Ruaumoko®
(Carr 2007) and
SAP2000® (Computers and Structures 2009) respectively. The braces were modelled to emulate flag-
shaped and bilinear hysteretic energy dissipation devices (EDD). In actual braces the flag-shaped
hysteresis can be implemented using shape-memory alloy components (Krumme et al. 1995) or steel
and aramid components (Christopoulos et al. 2008). Braces active in both tension and compression
(T-C) and tension only (T-O) were modelled. For the NLTHA each frame model was subjected to
twenty earthquake ground motions and the responses were summarized via several response indices
including mean normalized maximum interstorey drift and mean normalized maximum base shear.
Similar studies by others investigating the seismic response of steel frames with fluid viscous damping
braces (Dicleli and Mehta 2007) and SMA braces (McCormick et al. 2007) have been conducted. In
this paper, the results for interstorey drift and base shear are highlighted. Pushover analysis was also
carried out to investigate drift and base shear and to evaluate its efficacy in comparison to NLTHA.
2. PARAMETRIC STUDY
2.1. Non-linear Time History Analyses
For the NLTHA, four chevron-braced steel frames were analysed using Ruaumoko®. These were the
same frames used by Dicleli and Mehta (2007) and are shown in Fig. 2.1. The frames were
proportioned to provide a decreasing lateral strength as the number of stories increased, allowing the
frames to exhibit non-linear behaviour under moderate to high intensity ground motions. Beams and
columns were modeled to exhibit elasto-plastic behaviour by defining potential plastic moment hinges
with corresponding yield values located at the ends of the beams and columns where moments were
greatest. Potential plastic axial force behaviour was also accommodated in the beams and columns.
The braces were modelled to exhibit only axial T-C or T-O behaviour and were fully described by a
set of hysteretic parameters.

Figure 2.1. Frame models (after Dicleli and Mehta 2007)
Fig. 2.2 illustrates the bilinear and flag-shaped hystereses and their defining parameters. The bilinear
hysteresis is uniquely defined by three parameters: a normalized yield force parameter η, a normalized
initial stiffness parameter θ, and a post-yield stiffness parameter α. The flag-shaped (e.g. SMA)
hysteresis is uniquely defined by the same three parameters η, θ, α, plus an energy-dissipation
parameter β that describes the depth of the flag loop. The parametric study was defined by
Figure 2.2. Idealized hysteresis for braces with bilinear (left) and flag-shaped (right) and normalized yield force
and stiffness parameters (after Christopoulos et al. 2002)
establishing four values for the normalized brace yield force η; three values for the normalized initial
stiffness of the brace θ; two values for the post-yielding stiffness parameter α; and two values for the
energy-dissipation parameter β. For the flag-shaped braces, this resulted in a total of 48 unique brace
models for each frame and bracing type. For the bilinear hysteretic braces, this resulted in a total of 24
unique brace models for each frame and bracing type, as there was no energy-dissipation parameter.
Since each of the four frames was studied comprising T-C and T-O braces, a total of 576 unique
models were defined. Each frame was subjected to an ensemble of twenty ground motions to
determine their mean responses (and standard deviations) as measured by several response indices.
Therefore, a total of 11,520 NLTH analyses were conducted using Ruaumoko®.
The force at first yield and the stiffness were assigned a range of values over which the hysteresis is
effective in controlling response. These are reported here as normalized values η and θ, respectively.
Force at first yield is normalized by dividing by the weight of the frame W (=1638kN and was evenly
distributed to each storey level) giving η values ranging from about 0.03 to 0.34 of W. Stiffnesses
were normalized by dividing by the initial lateral stiffness of the un-braced 1-storey frame
(=22.3kN/mm) giving θ values ranging from about 2 to 22. Values of α were taken to be 0.0 (elasto-
plastic) and 0.25. A lower limit on β is 0.0 which creates a non-linear elastic hysteresis. An upper
limit on the value of β is 1.0 which ensures the recentring quality of the hysteresis. In this study
values for β were taken to be 0.5 and 1.0. Table 2.1 summarizes the models and system values used in
this study.
The earthquake ensemble used in this study was comprised of 20 California ground motions and was
the same used by Christopoulos et al. (2002). Each record was scaled to minimize the square of the
Typical EDD
Arrangement
Load
Displacement
θ
αθ 1
1
Load
Displacement
θ
αθ 1
βη 1 η η

error between a smooth target spectrum and its own 5% damped response spectrum at five period
values: 0.1, 0.25, 0.5, 1.0, and 2.0s. This resulted in a mean of the twenty scaled spectra that matched
the target spectrum reasonably well over the 0.1s to 2.0s range. A value of 5% inherent damping was
used throughout this study. The initial elastic periods of the frames ranged from 0.13s to 1.42s as
summarized in Table 2.2.
For a single ground motion, the response index of interest was recorded for each storey in each frame.
These maximum values were averaged to obtain a mean maximum value for that particular frame and
ground motion. This was done so that response index comparisons could more easily be made
between different frames. Because of its nature, base shear did not have values for each storey level,
only values for each frame. The 20 mean maximum values for each frame (one for each of the 20
ground motions) were then averaged to give a final single mean maximum value for the frame
characterized by a unique combination of the η, θ, α, and β parameter set. Only samples of the drift
and base shear results are presented here. Interstorey drift and base shear, which were normalized
using storey height h (=3.6m) and frame weight respectively, are key design indices and limiting them
in buildings is seismically advantageous. Sample results from the same study for residual interstorey
drift and acceleration can be found in McInerney and Wilson (2012) and complete results for the entire
NLTHA are provided in McInerney (2010).
Table 2.1. Summary listing of all model and system values in the parametric study
Frame Bracing for each frame Hysteretic parameters for each frame
Hysteresis Configuration α β η θ
1-Storey
2-Storey
4-Storey
8-Storey
Flag-Shaped
& Bilinear
T-C & T-O
0.0
0.25
0.5
1.0
0.03
0.12
0.21
0.34
2.24
5.60
22.39
2.2. Pushover Analysis
The static pushover analysis of the same frames as those in the NLTHA was conducted using
SAP2000®. Plastic hinges were incorporated into the model similar to the NLTHA. The frames were
monotonically loaded one-way and so only the α, η, and θ hysteretic brace parameters were needed to
fully describe the behaviour of the braces. This also meant that the frames with bilinear hysteretic
braces and the frames with flag-shaped hysteretic braces were described by the same pushover curve.
For each of the four frames, T-C and T-O braces were used along with the same three values for θ,
four values for η, and two values for α as in the NLTHA, making a total of 192 pushover analyses.
The Equivalent Static Force Method (ESFM) outlined in the National Building Code of Canada
(NBCC), suggests an inverted triangular loading pattern for use in the seismic analysis and design of
multi-storey buildings (NRC 2005). This pattern approximates first mode loading during an
earthquake and was used in the pushover analyses. Eqn. 2.1 gives the equivalent static force, Fx, to be
placed laterally at each storey level, x, in the building:
F� =
�V − F��W�h�
∑ W�h� ���
(2.1)
where V is the base shear to be used, Wx is the weight of level x, and hx is the height from ground to
level x. Ft is a force to be placed at the uppermost level of the building (of n storeys) to emulate the
effect of higher modes on the response and is defined in Eqn. 2.2:
F� = 0.07T�V ≤ 0.25V (2.2)
where Ta is the fundamental period of the building. The NBCC specifies that if the fundamental
period of the building is less than or equal to 0.7s then Ft is to be zero. Table 2.2 gives a summary of
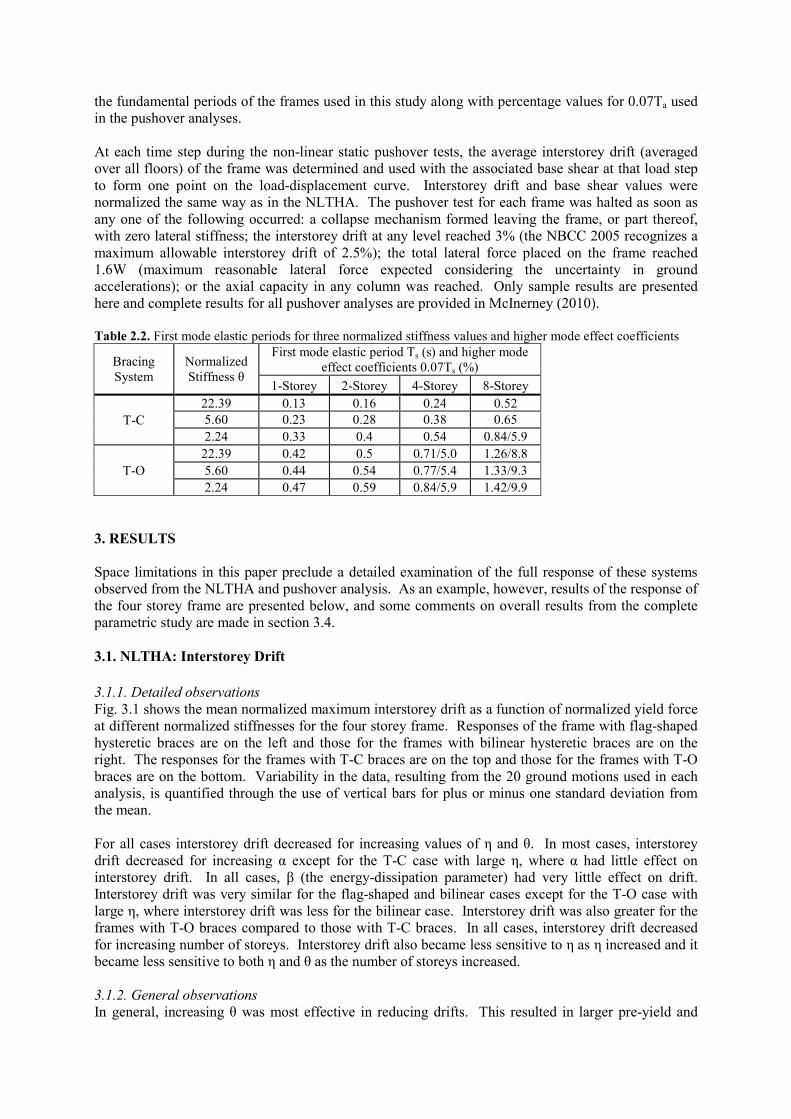
the fundamental periods of the frames used in this study along with percentage values for 0.07Ta used
in the pushover analyses.
At each time step during the non-linear static pushover tests, the average interstorey drift (averaged
over all floors) of the frame was determined and used with the associated base shear at that load step
to form one point on the load-displacement curve. Interstorey drift and base shear values were
normalized the same way as in the NLTHA. The pushover test for each frame was halted as soon as
any one of the following occurred: a collapse mechanism formed leaving the frame, or part thereof,
with zero lateral stiffness; the interstorey drift at any level reached 3% (the NBCC 2005 recognizes a
maximum allowable interstorey drift of 2.5%); the total lateral force placed on the frame reached
1.6W (maximum reasonable lateral force expected considering the uncertainty in ground
accelerations); or the axial capacity in any column was reached. Only sample results are presented
here and complete results for all pushover analyses are provided in McInerney (2010).
Table 2.2. First mode elastic periods for three normalized stiffness values and higher mode effect coefficients
Bracing
System
Normalized
Stiffness θ
First mode elastic period Ts (s) and higher mode
effect coefficients 0.07Ts (%)
1-Storey 2-Storey 4-Storey 8-Storey
T-C
22.39 0.13 0.16 0.24 0.52
5.60 0.23 0.28 0.38 0.65
2.24 0.33 0.4 0.54 0.84/5.9
T-O
22.39 0.42 0.5 0.71/5.0 1.26/8.8
5.60 0.44 0.54 0.77/5.4 1.33/9.3
2.24 0.47 0.59 0.84/5.9 1.42/9.9
3. RESULTS
Space limitations in this paper preclude a detailed examination of the full response of these systems
observed from the NLTHA and pushover analysis. As an example, however, results of the response of
the four storey frame are presented below, and some comments on overall results from the complete
parametric study are made in section 3.4.
3.1. NLTHA: Interstorey Drift
3.1.1. Detailed observations
Fig. 3.1 shows the mean normalized maximum interstorey drift as a function of normalized yield force
at different normalized stiffnesses for the four storey frame. Responses of the frame with flag-shaped
hysteretic braces are on the left and those for the frames with bilinear hysteretic braces are on the
right. The responses for the frames with T-C braces are on the top and those for the frames with T-O
braces are on the bottom. Variability in the data, resulting from the 20 ground motions used in each
analysis, is quantified through the use of vertical bars for plus or minus one standard deviation from
the mean.
For all cases interstorey drift decreased for increasing values of η and θ. In most cases, interstorey
drift decreased for increasing α except for the T-C case with large η, where α had little effect on
interstorey drift. In all cases, β (the energy-dissipation parameter) had very little effect on drift.
Interstorey drift was very similar for the flag-shaped and bilinear cases except for the T-O case with
large η, where interstorey drift was less for the bilinear case. Interstorey drift was also greater for the
frames with T-O braces compared to those with T-C braces. In all cases, interstorey drift decreased
for increasing number of storeys. Interstorey drift also became less sensitive to η as η increased and it
became less sensitive to both η and θ as the number of storeys increased.
3.1.2. General observations
In general, increasing θ was most effective in reducing drifts. This resulted in larger pre-yield and

post-yield lateral stiffness of the frames. The T-C braces were more effective than the T-O braces in
Flag-Shaped Bilinear
β = 0.5 β = 1.0
Ten
sion-C
om
pre
ssio
n α =
0.0
α
= 0
.25
Ten
sion-O
nly
α =
0.0
α
= 0
.25
Figure 3.1. NLTHA: Mean normalized maximum interstorey drift plotted as a function of normalized yield
force η of the bracing for the 4-storey frame
reducing interstorey drifts. Also, the braces with flag-shaped hystereses tended to be just as effective
in reducing drifts as the braces with bilinear hystereses.
0.0
0.4
0.8
1.2
1.6
0 0.1 0.2 0.3 0.4
Inte
rsto
rey
Dri
ft (
%)
0.0
0.4
0.8
1.2
1.6
0 0.1 0.2 0.3 0.4
0.0
0.4
0.8
1.2
1.6
0 0.1 0.2 0.3 0.4
0.0
0.4
0.8
1.2
1.6
0 0.1 0.2 0.3 0.4
Inte
rsto
rey
Dri
ft (
%)
0.0
0.4
0.8
1.2
1.6
0 0.1 0.2 0.3 0.4
0.0
0.4
0.8
1.2
1.6
0 0.1 0.2 0.3 0.4
0.0
0.4
0.8
1.2
1.6
0 0.1 0.2 0.3 0.4
Inte
rsto
rey
Dri
ft (
%)
0.0
0.4
0.8
1.2
1.6
0 0.1 0.2 0.3 0.4
0.0
0.4
0.8
1.2
1.6
0 0.1 0.2 0.3 0.4
0.0
0.4
0.8
1.2
1.6
0 0.1 0.2 0.3 0.4
Inte
rsto
rey
Dri
ft (
%)
η
0.0
0.4
0.8
1.2
1.6
0 0.1 0.2 0.3 0.4
η
0.0
0.4
0.8
1.2
1.6
0 0.1 0.2 0.3 0.4
η
θ = 2.2 θ = 5.6 θ = 22.4

3.2. NLTHA: Base Shear
3.2.1. Detailed observations
Fig. 3.2 shows mean normalized maximum base shear as a function of normalized yield force at
Flag-Shaped Bilinear
β = 0.5 β = 1.0
Ten
sion-C
om
pre
ssio
n α =
0.0
α
= 0
.25
Ten
sion-O
nly
α =
0.0
α
= 0
.25
Figure 3.2. NLTHA: Mean normalized maximum base shear plotted as a function of normalized yield force
η of the bracing for the 4-storey frame
0.1
0.3
0.5
0.7
0.9
0 0.1 0.2 0.3 0.4
Bas
e S
hea
r
0.1
0.3
0.5
0.7
0.9
0 0.1 0.2 0.3 0.4
0.1
0.3
0.5
0.7
0.9
0 0.1 0.2 0.3 0.4
0.1
0.3
0.5
0.7
0.9
0 0.1 0.2 0.3 0.4
Bas
e S
hea
r
0.1
0.3
0.5
0.7
0.9
0 0.1 0.2 0.3 0.4
0.1
0.3
0.5
0.7
0.9
0 0.1 0.2 0.3 0.4
0.1
0.3
0.5
0.7
0.9
0 0.1 0.2 0.3 0.4
Bas
e S
hea
r
0.1
0.3
0.5
0.7
0.9
0 0.1 0.2 0.3 0.4
0.1
0.3
0.5
0.7
0.9
0 0.1 0.2 0.3 0.4
0.1
0.3
0.5
0.7
0.9
0 0.1 0.2 0.3 0.4
Bas
e S
hea
r
η
0.1
0.3
0.5
0.7
0.9
0 0.1 0.2 0.3 0.4
η
0.1
0.3
0.5
0.7
0.9
0 0.1 0.2 0.3 0.4
η
θ = 2.2 θ = 5.6 θ = 22.4

different normalized stiffnesses for the four storey frame. In most cases, base shear increased for
increasing values of η. For α=0.0, θ had little effect on base shear except for the T-C case for the
lower storey frames with large η where base shear decreased for increasing θ. For α=0.25, base shear
increased for increasing values of θ in most cases. In all cases, base shear increased for increasing α,
and β had no effect on base shear. Base shear was similar for the flag-shaped and bilinear cases except
for the T-O case with α=0.25 and large η, where base shear was slightly less for the bilinear case.
Base shears were lower for the frames with T-O braces compared to the T-C case accept for very small
η, where they tended to be similar for both of these cases. Base shear tended to decrease for
increasing number of storeys. The sensitivity of base shear to η tended to remain constant with
increasing number of storeys. For the α=0.0 case, base shear became less sensitive to θ with
increasing number of storeys and for the α=0.25 case, the sensitivity of base shear to θ remained
constant.
3.2.2. General observations
For the case where α=0.0, decreasing η was most effective in reducing base shears. For the case
where α=0.25, decreasing θ was most effective in reducing base shears. The frames with T-O braces
tended to be more effective in reducing base shears compared to the frames with T-C braces. The
braces with flag-shaped hystereses were just as effective in reducing base shear as the braces with
bilinear hystereses.
3.3. Pushover Analysis
3.3.1. Illustration of yielding sequence of frame
As an example, Fig. 3.3 illustrates the final pre-collapse state of a particular 4-storey frame with T-C
braces during its pushover analysis. The displaced shape shown is exaggerated five times. The lateral
loading at this final state was 75kN, 150kN, 225kN, and 300kN at the top of the first, second, third,
and fourth storeys, respectively. The circles on the braces indicate that axial yielding has occurred
while those on the columns and beams indicate flexural yielding or hinging. For this particular
analysis, the sequence of yielding was as follows: [1] braces at the two lower storeys, [2] braces at the
third storey, [3] braces at the fourth storey, [4] beam at the second storey, [5] column bases at the first
storey, [6] beam at the third storey, and [7] beam at the fourth storey. The final hinge formation that
created a collapse state (not shown on the figure) was characterized by hinging at the tops of the
second storey columns.
Figure 3.3. Pushover analysis: Final pre-collapse state of 4-storey frame with T-C braces, η=0.12, θ=5.6, and
α=0.0 (sequence of brace yielding and hinge formation shown in square brackets)
[3] [3]
[7] [7]
[2] [2]
[6] [6]
[1] [1]
[4] [4]
[1] [1]
[5] [5]
225kN
150kN
75kN
300kN

3.3.2. Detailed observations
Fig. 3.4 summarizes the pushover results for the four storey frame: normalized lateral load (or
equivalently, normalized base shear) as a function of mean normalized interstorey drift at different
normalized yield forces. Results for each normalized stiffness value are shown in different columns.
Mean normalized interstorey drift decreased and normalized base shear increased for increasing values
of η. For α=0.0, θ had little effect on interstorey drift or base shear except for large η where
interstorey drift decreased and base shear increased for increasing θ. For α=0.25, interstorey drift
decreased and base shear increased for increasing θ. Interstorey drift decreased and base shear
increased for increasing α. Interstorey drift was lower for the frames with T-C braces and base shear
was lower for the frames with T-O braces except for the α=0.0 case with small η where drift and base
shear were essentially the same for the frames with T-C and T-O braces. In most cases, interstorey
drift and base shear tended to decrease for increasing number of storeys. For α=0.0, the sensitivity of
interstorey drift and base shear to η remained constant with increasing θ and number of storeys; while
for α=0.25, the sensitivity of interstorey drift and base shear to η decreased with increasing θ and
number of storeys. Interstorey drift and base shear were also less sensitive to η and θ for the T-O case
compared to the T-C case.
3.3.3. General observations
In general, the first yield was characterized by yielding of the braces, and subsequent yields were
characterized by the flexural hinging in the columns and beams. However, the sequence in which the
plastic hinges formed became increasingly complex as the number of storeys – and hence the number
of plastic hinges – increased. For α=0.0, increasing η was most effective in minimizing interstorey
drift; while for α=0.25, increasing θ was most effective in minimizing interstorey drift. For α=0.0,
decreasing η was most effective in minimizing base shear; while for α=0.25, decreasing θ was most
effective in minimizing base shear. The T-C braces were more effective in reducing interstorey drifts
than the T-O braces, and the T-O braces were more effective in reducing base shear compared to the
T-C braces.
3.4. Summary of Results of Parametric Study
The seismic responses of the frames were more significantly affected by η (the yield force parameter)
and θ (the initial stiffness parameter) than by α (the post-yielding stiffness parameter) or β (the energy
dissipation parameter). In fact, β had little effect on response. Increasing α, η, or θ tended to decrease
interstorey drift but also had the effect of increasing base shear. This trend was clearly evident in both
the NLTHA and pushover results. The NLTHA also revealed that the frames with bilinear braces
tended to have lower storey accelerations and the frames with flag-shaped braces tended to have lower
residual drifts. It is obviously not possible to deduce this trend from the pushover analyses. However,
the responses of the frames with flag-shaped hysteretic braces, as measured by interstorey drift and
base shear, were very similar to those frames with the bilinear hysteretic braces, further illustrating the
dominance of the hysteresis backbone and the potential of pushover analyses.
The frames with T-O braces, in most cases, did not perform as well as the frames with T-C braces.
However, the frames with T-O braces were more effective in reducing base shears. The trend of
reduced base shear and increased drift for the T-O case was evident in both the NLTHA and pushover
analysis results. For the frames in this study, response index values tended to decrease for increasing
number of storeys. The pushover analyses also highlighted the less obvious trend of reduced
sensitivity of interstorey drift and base shear to η for large α and θ, evident in the NLTHA results.

θ=2.2 θ=5.6 θ=22.4 T
ensi
on-C
om
pre
ssio
n α =
0.0
α
= 0
.25
Ten
sion-O
nly
α =
0.0
α
= 0
.25
Figure 3.4. Pushover Analysis: Mean normalized base shear plotted as a function of mean normalized
interstorey drift for the 4-storey frame
4. CONCLUSIONS
The following conclusions are drawn regarding the overall behaviour and utility of chevron braces
with either bilinear or flag-shaped hysteretic characteristics in enhancing, and the ability of pushover
0.0
0.4
0.8
1.2
1.6
0.0 0.6 1.2 1.8 2.4 3.0
Bas
e S
hea
r
0.0
0.4
0.8
1.2
1.6
0.0 0.6 1.2 1.8 2.4 3.0
0.0
0.4
0.8
1.2
1.6
0.0 0.6 1.2 1.8 2.4 3.0
0.0
0.4
0.8
1.2
1.6
0.0 0.6 1.2 1.8 2.4 3.0
Bas
e S
hea
r
0.0
0.4
0.8
1.2
1.6
0.0 0.6 1.2 1.8 2.4 3.0
0.0
0.4
0.8
1.2
1.6
0.0 0.6 1.2 1.8 2.4 3.0
0.0
0.4
0.8
1.2
1.6
0.0 0.6 1.2 1.8 2.4 3.0
Bas
e S
hea
r
0.0
0.4
0.8
1.2
1.6
0.0 0.6 1.2 1.8 2.4 3.0
0.0
0.4
0.8
1.2
1.6
0.0 0.6 1.2 1.8 2.4 3.0
0.0
0.4
0.8
1.2
1.6
0.0 0.6 1.2 1.8 2.4 3.0
Bas
e S
hea
r
Interstorey Drift (%)
0.0
0.4
0.8
1.2
1.6
0.0 0.6 1.2 1.8 2.4 3.0
Interstorey Drift (%)
0.0
0.4
0.8
1.2
1.6
0.0 0.6 1.2 1.8 2.4 3.0
Interstorey Drift (%)
η=0.03 η=0.12 η=0.21 η=0.34

analysis to predict, the seismic performance of low-to-mid-rise steel frame structures:
1. The hysteretic seismic behaviour of chevron braced frames is largely governed by the backbone
curve of the brace hysteresis. This was evidenced by the strong effect of α, η, and θ, and the very
weak effect of β on the response of the frames showing the utility of pushover analyses in helping to
predict seismic response.
2. Increasing α, η, or θ tended to decrease interstorey drift and increase base shear.
3. The flag-shaped and bilinear brace systems performed with equal efficiency in controlling
interstorey drift and base shear of the frame structures. However, the flag-shaped braces were found
to be more effective in reducing residual interstorey drift and the bilinear braces were more effective
in reducing accelerations. This suggests that mixed bracing systems could possibly be used to
advantage, where flag-shaped braces could be used to control residual displacements and bilinear
braces to reduce accelerations.
4. T-C braces were generally more effective in reducing interstorey drift and T-O braces were more
effective in reducing base shear.
5. The pushover analysis successfully predicted many of the trends evident from the NLTHA.
Although not done in this study, these trends could be used to help determine advantageous brace
parameter values suitable for parametric study.
ACKNOWLEDGEMENTS
The authors wish to acknowledge the support of the Natural Sciences and Engineering Research Council of
Canada (NSERC).
REFERENCES Carr, A.J. (2007). Ruaumoko
®, Inelastic dynamic analysis program. Department of Civil Engineering, University
of Canterbury, Christchurch, New Zealand.
Computers and Structures Inc. (CSI). (2009). SAP2000®, Berkeley, CA.
Christopoulos, C., Filiatrault, A., and Folz, B. (2002). Seismic response of self-centring hysteretic SDOF
systems. Earthquake Engineering and Structural Dynamics, 31, 1131-1150.
Christopoulos, C., Tremblay, R., Kim, H.-J., and Lacerte, M. (2008). Self-centering energy dissipative bracing
system for the seismic resistance of structures: development and validation. Journal of Structural
Engineering, 134:1, 96-107.
Dicleli, M and Mehta, A. (2007). Effect of near-fault ground motion and damper characteristics on the seismic
performance of chevron braced steel frames. Earthquake Engineering and Structural Dynamics, 36, 927-
948.
Krumme, R., Hayes, J., and Sweeney, S. (1995). Structural damping with shape-memory alloys: one class of
device. Proceedings of SPIE-The International Society for Optical Engineering, Smart Structures and
Materials: Passive Damping, March 1-2, San Diego, CA, 2445, 225-240.
McCormick, J., Desroches, R., Fugazza, D., and Auricchio, F. (2007). Seismic assessment of concentrically
braced steel frames with shape memory alloy braces. Journal of Structural Engineering, 133:6, 862-870.
McInerney, J.B. (2010). Seismic Response of Steel Frames with Bilinear and Flag-Shaped Hysteretic Braces.
MASc thesis, Department of Civil Engineering, McMaster University, Hamilton, Canada.
McInerney, J.B., and Wilson, J.C. (2012). Measuring the effectiveness of seismic control of steel frames using
braces with bilinear and flag-shaped hysteretic characteristics. New Zealand Society for Earthquake
Engineering Annual Technical Conference, April 13-15, Christchurch, New Zealand. paper 043.
National Research Council of Canada (NRC). (2005). National Building Code of Canada (NBCC).