correlation of damage of steel moment-resisting frames to ... · ruaumoko (carr, 2003). the novelty...
TRANSCRIPT

Correlation of Damage of Steel Moment-Resisting Frames to a Vector-valued Ground Motion Parameter Set that includes Energy Demands: Collaborative Research of the
University of Texas at Austin (UT) and Applied Insurance Research (AIR).
AWARD No. 03HQGR0106
Dr. Lance Manuel and Mr. Sridhar Baldava Dept. of Civil Engineering
University of Texas at Austin Austin, TX 78712
512/232-5691 (phone) 512/471-7259 (fax)
[email protected] [email protected]
in collaboration with
Dr. Paolo Bazzurro and Dr. Nicolas Luco (AIR)
Keywords: Structural building response; strong ground motion; probabilistic seismic hazard; loss estimation.

INVESTIGATIONS UNDERTAKEN
This study investigates the correlation of structural response measures with different combinations of ground motion parameters that include energy-based quantities. The final purpose is to improve the prediction of structural behavior during earthquakes. A more accurate assessment of seismic performance of buildings is of paramount importance for designing new safer structures and for evaluating whether existing ones should be retrofitted to guarantee an acceptable level of safety to occupants. In addition, better performance assessment capabilities will enable one to improve the prediction of earthquake-generated losses. The availability of reliable loss estimates is crucial to different stakeholders such as owners, tenants, insurance and reinsurance companies, and public organizations for post-earthquake emergency resource management.
This study is empirical in nature. We consider 140 real ground motion recordings from earthquakes
of engineering interest – namely intermediate- to large-magnitudes events (with moment magnitude, M, between 5.7 and 7.5) recorded at moderate distances (taken here to be less than 36km from the causative fault). This ground motion dataset is applied to low-rise (3-story), a mid-rise (9-story), and a high-rise (20-story) steel moment-resisting frame (SMRF) buildings designed for Los Angeles conditions as part of Phase II of the SAC Project (FEMA-355C, 2000). To distinguish between the performance of older-vintage SMRF buildings before and after retrofitting, we consider both a brittle model (that allows for beam-column connection fracture, a phenomenon widely observed in the 1994 Northridge earthquake) and a ductile model (that mimics the behavior of a retrofitted SMRF building). The response of these buildings to the 140 records is computed via nonlinear dynamic analysis using the computer program, Ruaumoko (Carr, 2003).
The novelty of this study is two-fold:
1. We intend to investigate the predictive power of different combinations of ground motion parameters that include both conventional elastic spectral parameters (e.g., spectral acceleration, Sa, at the initial fundamental frequency of the structure and at higher modes) as well as energy-based parameters (e.g., input energy). (Uang and Bertero, 1990.)
2. We intend to predict not one single response measure (e.g., the roof drift or the maximum inter-story drift over the height of the building) but a vector of measures (e.g., the peak inter-story drifts at all stories) whose components will, in general, be correlated. The knowledge of more than one measure, simultaneously, of building performance is expected to improve the accuracy of performance and loss assessments.
RESULTS Task 1: Select near-source and "ordinary" earthquake ground motion records relevant to the Southern California region. We selected the 140 ground motion records described in Tables 1 and 2 from the Pacific Earthquake Engineering Research (PEER) database. The distribution by magnitude, M, and distance, R, of the selected ground motions is summarized in the scatter plot shown in Figure 1. The selection of records was guided by the following criteria:
• With few exceptions, preference was given to records obtained from the Southern California region. Records from the 1999 Chi-Chi earthquake were excluded.
• Since smaller events are not expected to cause significant structural damage to engineered structures, priority in selection of ground motions was given to records from events with moment magnitude as large as possible. As a result, the database has no records from magnitudes smaller than 5.7.
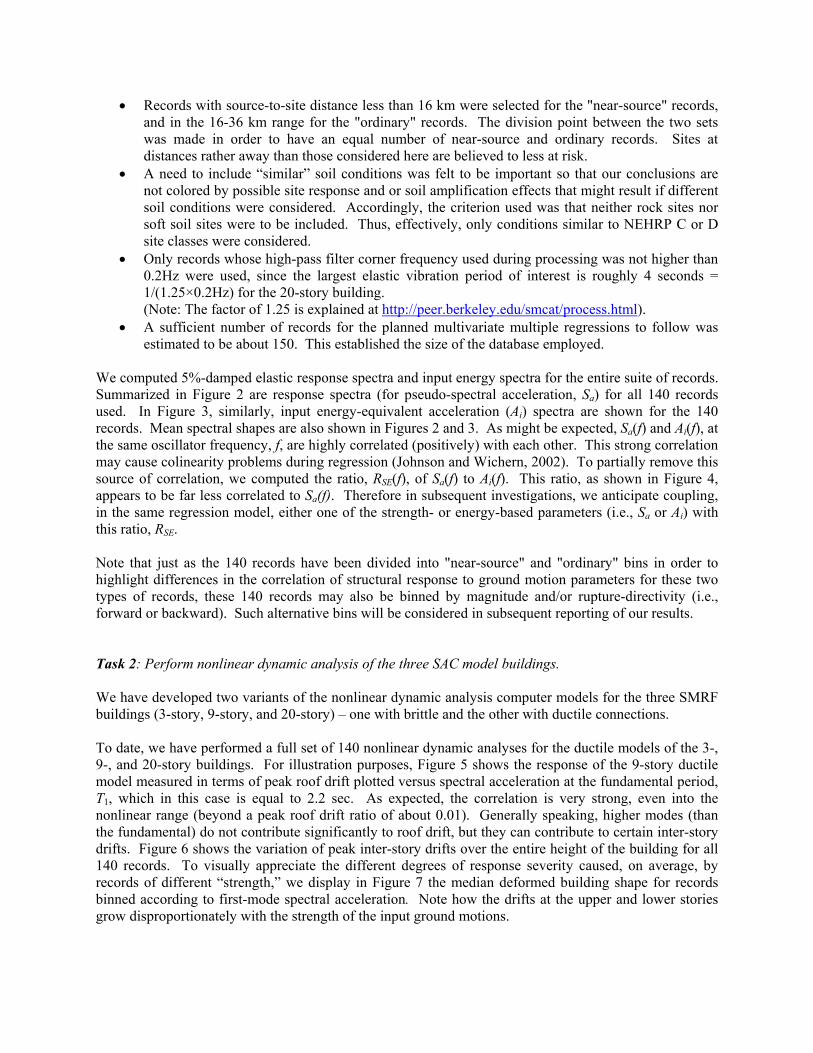
• Records with source-to-site distance less than 16 km were selected for the "near-source" records, and in the 16-36 km range for the "ordinary" records. The division point between the two sets was made in order to have an equal number of near-source and ordinary records. Sites at distances rather away than those considered here are believed to less at risk.
• A need to include “similar” soil conditions was felt to be important so that our conclusions are not colored by possible site response and or soil amplification effects that might result if different soil conditions were considered. Accordingly, the criterion used was that neither rock sites nor soft soil sites were to be included. Thus, effectively, only conditions similar to NEHRP C or D site classes were considered.
• Only records whose high-pass filter corner frequency used during processing was not higher than 0.2Hz were used, since the largest elastic vibration period of interest is roughly 4 seconds = 1/(1.25×0.2Hz) for the 20-story building. (Note: The factor of 1.25 is explained at http://peer.berkeley.edu/smcat/process.html).
• A sufficient number of records for the planned multivariate multiple regressions to follow was estimated to be about 150. This established the size of the database employed.
We computed 5%-damped elastic response spectra and input energy spectra for the entire suite of records. Summarized in Figure 2 are response spectra (for pseudo-spectral acceleration, Sa) for all 140 records used. In Figure 3, similarly, input energy-equivalent acceleration (Ai) spectra are shown for the 140 records. Mean spectral shapes are also shown in Figures 2 and 3. As might be expected, Sa(f) and Ai(f), at the same oscillator frequency, f, are highly correlated (positively) with each other. This strong correlation may cause colinearity problems during regression (Johnson and Wichern, 2002). To partially remove this source of correlation, we computed the ratio, RSE(f), of Sa(f) to Ai(f). This ratio, as shown in Figure 4, appears to be far less correlated to Sa(f). Therefore in subsequent investigations, we anticipate coupling, in the same regression model, either one of the strength- or energy-based parameters (i.e., Sa or Ai) with this ratio, RSE. Note that just as the 140 records have been divided into "near-source" and "ordinary" bins in order to highlight differences in the correlation of structural response to ground motion parameters for these two types of records, these 140 records may also be binned by magnitude and/or rupture-directivity (i.e., forward or backward). Such alternative bins will be considered in subsequent reporting of our results. Task 2: Perform nonlinear dynamic analysis of the three SAC model buildings. We have developed two variants of the nonlinear dynamic analysis computer models for the three SMRF buildings (3-story, 9-story, and 20-story) – one with brittle and the other with ductile connections. To date, we have performed a full set of 140 nonlinear dynamic analyses for the ductile models of the 3-, 9-, and 20-story buildings. For illustration purposes, Figure 5 shows the response of the 9-story ductile model measured in terms of peak roof drift plotted versus spectral acceleration at the fundamental period, T1, which in this case is equal to 2.2 sec. As expected, the correlation is very strong, even into the nonlinear range (beyond a peak roof drift ratio of about 0.01). Generally speaking, higher modes (than the fundamental) do not contribute significantly to roof drift, but they can contribute to certain inter-story drifts. Figure 6 shows the variation of peak inter-story drifts over the entire height of the building for all 140 records. To visually appreciate the different degrees of response severity caused, on average, by records of different “strength,” we display in Figure 7 the median deformed building shape for records binned according to first-mode spectral acceleration. Note how the drifts at the upper and lower stories grow disproportionately with the strength of the input ground motions.
The nonlinear dynamic analyses for the brittle variants of the SMRF buildings are currently in progress. A major difficulty in completing these analyses has been the less-than-satisfactory performance of the Ruaumoko software in describing brittle connection behavior. With the aid of its developer, Dr. Athol Carr, we are currently improving the Ruaumoko library element that models brittle connections in SMRF buildings. Task 3: Perform multivariate multiple linear regression (MMLR) analysis of vector of response measures on different combinations of ground motion parameters. This task is where the bulk of the remaining work will be concentrated until the end of the project. To date, for the ductile 9-story building, we have performed a MMLR analysis of the vector of peak inter-story drifts using three different regression models that include the spectral acceleration values at (i) the first natural frequency, Sa(f1); (ii) at the first two natural frequencies, Sa(f1) and Sa(f2); and (iii) at the first three natural frequencies, Sa(f1), Sa(f2), and Sa(f3). In lieu of Sa(f2) and Sa(f3), the ratios Sa(f2)/Sa(f1) and Sa(f3)/Sa(f2) have also been utilized in order to avoid the effects of colinearity on the regression that are introduced by strong correlation between more than one spectral parameter (as described above under Task 1 for Sa(f) and Ai(f)). Figure 8 shows the story drifts predicted by the regression model that includes Sa(f1). The values of Sa(f1) considered are the medians of the same five bins of records considered for Figure 7. Note that these regression predictions compare well with the average deformed shape empirically predicted by the records binned according to Sa(f1). Although not shown here, the MMLR analysis results for the models that include Sa(f2)/Sa(f1) and Sa(f3)/Sa(f2) suggest that the contribution from the second and third mode spectral values is significant when predicting peak inter-story drift ratios at some but not all of the nine stories. NON-TECHNICAL SUMMARY
For design and performance assessments of new and existing structures in seismic areas, it is important to identify ground motion parameters that correlate to structural response and, in turn, to damage and monetary loss. Once this correlation is established, engineers can more accurately evaluate the likelihood of exceeding different specified levels of response/performance for a structure at a given site, and can then also estimate the likelihood that the structure will either collapse or suffer intermediate levels of structural damage. This study is investigating if advantages exist from using combinations of spectral and energy-based parameters to predict the structural response of low-, mid-, and high-rise steel buildings. REPORTS PUBLISHED None to date. AVAILABILITY OF SEISMIC DATA The ground motion records used in this study (Tables 1 and 2) were obtained from the Pacific Earthquake Engineering Research (PEER) database. These records are in ASCII format. The database is available online at http://peer.berkeley.edu/smcat/index.html. The contact name for PEER is: Parshaw Vaziri, PEER Director of PR & Outreach, Tel: 510-231-9550 or 510-301-1889.

REFERENCES Carr, A. J., “Ruaumoko User Manual,” University of Canterbury, New Zealand, 2003. FEMA-355C, “State of the Art Report on Systems Performance of Steel Moment Frames Subject to Earthquake Ground Shaking,” Federal Emergency Management Agency, September 2000. Johnson, R. A. and D. W. Wichern, “Applied Multivariate Statistical Analysis,” 5th Edition, Prentice-Hall., Inc., 2002. Uang, C.-M. and V. V. Bertero, “Evaluation of Seismic Energy in Structures,” Earthquake Engineering and Structural Dynamics, Vol. 19, pp. 77-90, 1990.

EQID EQNAME STANAME YEAR Mw Clst Dis X GM Site Code
NEHRP Filename Max fcHP Min fcLP # Strike
0048 Coyote Lake Gilroy Array #2 1979 5.74 8.45 -1 IQD D COYOTELK\G02050 0.2 40 1 336
0048 Coyote Lake Gilroy Array #3 1979 5.74 6.9 -1 IHD D COYOTELK\G03050 0.2 40 2 336
0048 Coyote Lake Gilroy Array #4 1979 5.74 5.22 -1 AHD D COYOTELK\G04270 0.2 25 3 336
0048 Coyote Lake Gilroy Array #6 1979 5.74 3.15 -1 IKB C COYOTELK\G06230 0.2 25 4 336
0102 Chalfant Valley-01 Zack Brothers Ranch 1986 5.77 6.22 1 AAD - CHALFANT\B-ZAK270 0.11 30 5 48
0113 Whittier Narrows-01 Garvey Res. - Control Bldg 1987 5.99 12.69 0.28 APB - WHITTIER\A-GRV060 0.2 40 6 280
0113 Whittier Narrows-01 Norwalk - Imp Hwy, S Grnd 1987 5.99 15.82 -0.36 IHD - WHITTIER\A-NOR090 0.15 40 7 280
0101 N. Palm Springs Cabazon 1986 6.06 7.84 0.53 AHD - PALMSPR\CAB180 0.15 40 8 287
0101 N. Palm Springs Morongo Valley 1986 6.06 12.07 -0.07 AHC C PALMSPR\MVH045 0.08 50 9 287
0025 Parkfield Cholame - Shandon Array #12 1966 6.19 14.35 -1 IQD C PARKF\C12050 0.2 20 10 143
0025 Parkfield Cholame - Shandon Array #5 1966 6.19 4.98 -0.98 IHC D PARKF\C05085 0.2 17.4 11 143
0025 Parkfield Cholame - Shandon Array #8 1966 6.19 8.96 -0.99 IQD D PARKF\C08050 0.2 20 12 143
0025 Parkfield Temblor pre-1969 1966 6.19 9.84 -1 IJA C PARKF\TMB205 0.2 14.7 13 143
0090 Morgan Hill Anderson Dam (Downstream) 1984 6.19 3.26 -0.61 AFD C MORGAN\AND250 0.1 30 14 148
0090 Morgan Hill Gilroy - Gavilan Coll. 1984 6.19 14.84 -0.98 AFB C MORGAN\GIL067 0.1 30 15 148
0090 Morgan Hill Gilroy Array #2 1984 6.19 13.69 -0.98 IQD D MORGAN\G02000 0.2 31 16 148
0090 Morgan Hill Gilroy Array #3 1984 6.19 13.02 -0.98 IHD D MORGAN\G03000 0.1 32 17 148
0090 Morgan Hill Gilroy Array #4 1984 6.19 11.54 -0.98 AHD D MORGAN\G04270 0.1 25 18 148
0090 Morgan Hill Gilroy Array #6 1984 6.19 9.87 -0.98 IKB C MORGAN\G06000 0.1 27 19 148
0090 Morgan Hill Gilroy Array #7 1984 6.19 12.07 -0.98 AHB D MORGAN\GMR000 0.1 30 20 148
0090 Morgan Hill Halls Valley 1984 6.19 3.48 0.02 IFC D MORGAN\HVR150 0.2 26 21 148
0103 Chalfant Valley-02 Zack Brothers Ranch 1986 6.19 6.17 -0.63 AAD - CHALFANT\A-ZAK270 0.1 33 22 148
0064 Victoria, Mexico Cerro Prieto 1980 6.33 6.37 0.95 AVA C VICT\CPE045 0.2 62.5 23 130
0064 Victoria, Mexico Chihuahua 1980 6.33 11.5 0.95 IQD D VICT\CHI102 0.2 22 24 130
0076 Coalinga-01 Pleasant Valley P.P. - bldg 1983 6.36 11.83 -0.37 AHD - COALINGA\H-PVB045 0.2 20 25 145
0076 Coalinga-01 Pleasant Valley P.P. - yard 1983 6.36 11.83 -0.37 AHD - COALINGA\H-PVY045 0.2 31 26 145
0050 Imperial Valley-06 Aeropuerto Mexicali 1979 6.53 1.36 0.05 I-D D IMPVALL\H-AEP045 0.05 -11 27 143
0050 Imperial Valley-06 Agrarias 1979 6.53 1.17 -0.05 IQD - IMPVALL\H-AGR003 0.05 -11 28 143
0050 Imperial Valley-06 Bonds Corner 1979 6.53 1.02 0.16 AQD D IMPVALL\H-BCR140 0.1 40 29 143
0050 Imperial Valley-06 Brawley Airport 1979 6.53 10.13 0.95 AQD D IMPVALL\H-BRA225 0.1 40 30 143
0050 Imperial Valley-06 Calexico Fire Station 1979 6.53 12.16 0.33 AQD D IMPVALL\H-CXO225 0.2 40 31 143
0050 Imperial Valley-06 EC Meloland Overpass FF 1979 6.53 1.78 0.51 IDD D IMPVALL\H-EMO000 0.1 40 32 143
0050 Imperial Valley-06 El Centro Array #10 1979 6.53 7.88 0.66 AQD D IMPVALL\H-E10050 0.1 40 33 143
0050 Imperial Valley-06 El Centro Array #11 1979 6.53 14.16 0.68 AQD D IMPVALL\H-E11140 0.2 40 34 143
0050 Imperial Valley-06 El Centro Array #4 1979 6.53 5.45 0.7 IQD D IMPVALL\H-E04140 0.1 40 35 143
0050 Imperial Valley-06 El Centro Array #5 1979 6.53 2.31 0.73 IQD D IMPVALL\H-E05140 0.1 40 36 143
0050 Imperial Valley-06 El Centro Array #6 1979 6.53 0.33 0.72 IQD D IMPVALL\H-E06140 0.1 40 37 143
0050 Imperial Valley-06 El Centro Array #7 1979 6.53 2.27 0.72 AQD D IMPVALL\H-E07140 0.1 40 38 143
0050 Imperial Valley-06 El Centro Array #8 1979 6.53 5.57 0.72 AQD D IMPVALL\H-E08140 0.1 40 39 143
0050 Imperial Valley-06 El Centro Differential Array 1979 6.53 6.8 0.69 IQD D IMPVALL\H-EDA270 0.1 40 40 143
0050 Imperial Valley-06 El Centro Imp. Co. Cent 1979 6.53 9.02 0.73 AQD D IMPVALL\H-ECC002 0.1 35 41 143
0050 Imperial Valley-06 Holtville Post Office 1979 6.53 6.06 0.5 AQD D IMPVALL\H-HVP225 0.1 40 42 143
0050 Imperial Valley-06 Parachute Test Site 1979 6.53 15.32 0.95 AQD C IMPVALL\H-PTS225 0.1 40 43 143
0050 Imperial Valley-06 SAHOP Casa Flores 1979 6.53 11.35 0.13 I-C D IMPVALL\H-SHP000 0.2 -11 44 143
0116 Superstition Hills-02 Parachute Test Site 1987 6.54 0.95 -0.8 AQD C SUPERST\B-PTS225 0.12 20 45 127

0116 Superstition Hills-02 Westmorland Fire Sta 1987 6.54 13.03 -0.73 ADD D SUPERST\B-WSM090 0.1 35 46 127
0127 Northridge-01 Canoga Park - Topanga Can 1994 6.69 14.7 -0.25 --D D NORTHR\CNP106 0.05 30 47 122
0127 Northridge-01 Canyon Country - W Lost Cany 1994 6.69 12.44 -0.15 --D D NORTHR\LOS000 0.1 30 48 122
0127 Northridge-01 Jensen Filter Plant 1994 6.69 5.43 -0.1 --D C NORTHR\JEN022 0.2 -11 49 122
0127 Northridge-01 Newhall - Fire Sta 1994 6.69 5.92 -0.5 AQD D NORTHR\NWH090 0.12 23 50 122
0127 Northridge-01 Northridge - 17645 Saticoy St 1994 6.69 12.09 0.15 --D D NORTHR\STC090 0.1 30 51 122
0127 Northridge-01 Rinaldi Receiving Sta 1994 6.69 6.53 0.08 --C D NORTHR\RRS228 11 -11 52 122
0127 Northridge-01 Sepulveda VA 1994 6.69 8.44 0.19 --D D NORTHR\SPV270 0.1 -11 53 122
0127 Northridge-01 Sylmar - Converter Sta 1994 6.69 5.35 -0.07 --D D NORTHR\SCS052 11 -11 54 122
0127 Northridge-01 Sylmar - Converter Sta East 1994 6.69 5.19 -0.03 --D D NORTHR\SCE018 11 -11 55 122
0127 Northridge-01 Sylmar - Olive View Med FF 1994 6.69 5.3 0.08 AQD C NORTHR\SYL090 0.12 23 56 122
0129 Kobe, Japan KJMA 1995 6.9 0.84 -0.28 --B C KOBE\KJM000 0.05 -11 57 230
0118 Loma Prieta Capitola 1989 6.93 15.23 -0.01 AQC D LOMAP\CAP000 0.2 40 58 128
0118 Loma Prieta Corralitos 1989 6.93 3.85 0.12 APB C LOMAP\CLS000 0.2 40 59 128
0118 Loma Prieta Gilroy - Historic Bldg. 1989 6.93 10.97 0.5 BQD - LOMAP\GOF090 0.2 38 60 128
0118 Loma Prieta Saratoga - W Valley Coll. 1989 6.93 9.31 -0.5 AQD C LOMAP\WVC000 0.1 38 61 128
0123 Cape Mendocino Petrolia 1992 7.01 9.59 0.03 IMD D CAPEMEND\PET000 0.07 23 62 340
0138 Duzce, Turkey Duzce 1999 7.14 11.42 0.08 A-D D DUZCE\DZC180 0.08 50 63 265
0125 Landers Joshua Tree 1992 7.28 10.13 -0.11 AGC C LANDERS\JOS000 0.07 23 64 355
0125 Landers Morongo Valley 1992 7.28 15.26 -0.16 AHC C LANDERS\MVH000 11 -11 65 355
0046 Tabas, Iran Dayhook 1978 7.35 13.94 -0.01 ABB - TABAS\DAY280 0.1 -11 66 330
0046 Tabas, Iran Tabas 1978 7.35 1.2 0.62 ABC - TABAS\TAB074 0.05 -11 67 330
0136 Kocaeli, Turkey Arcelik 1999 7.51 11.67 0.28 B-B C KOCAELI\ARC000 0.07 50 68 274
0136 Kocaeli, Turkey Duzce 1999 7.51 9.35 -0.5 A-D D KOCAELI\DZC180 11 15 69 274
0136 Kocaeli, Turkey Yarimca 1999 7.51 2.96 0.11 B-D D KOCAELI\YPT060 0.07 50 70 274
Table 1. "Near-source" earthquake ground motion records selected from PEER database.

EQID EQNAME STANAME YEAR Mw Clst Dis X GM Site Code
NEHRP Filename Max fcHP Min fcLP # Strike
0048 Coyote Lake San Juan Bautista, 24 Polk St 1979 5.74 19.32 -1 AQD C COYOTELK\SJB213 0.2 20 1 336
0102 Chalfant Valley-01 Bishop - LADWP South St 1986 5.77 23.43 0 AQD - CHALFANT\B-LAD180 0.11 20 2 48
0102 Chalfant Valley-01 Lake Crowley - Shehorn Res. 1986 5.77 26.9 0 AAB - CHALFANT\B-SHE009 0.16 25 3 48
0101 N. Palm Springs San Jacinto Vall. Cem 1986 6.06 30.97 0.53 AQD D PALMSPR\H06270 0.2 31 4 287
0090 Morgan Hill Agnews State Hospital 1984 6.19 24.49 0.02 AQD D MORGAN\AGW240 0.2 13 5 148
0090 Morgan Hill Corralitos 1984 6.19 23.24 -0.71 APB C MORGAN\CLS220 0.2 24 6 148
0090 Morgan Hill Hollister Diff Array #1 1984 6.19 26.43 -0.98 IQD D MORGAN\HD1165 0.2 30 7 148
0090 Morgan Hill Hollister Diff Array #3 1984 6.19 26.43 -0.98 IQD D MORGAN\HD3165 0.2 30 8 148
0090 Morgan Hill Hollister Diff Array #4 1984 6.19 26.43 -0.98 IQD D MORGAN\HD4165 0.2 30 9 148
0090 Morgan Hill Hollister Diff Array #5 1984 6.19 26.43 -0.98 IQD D MORGAN\HD5165 0.2 30 10 148
0090 Morgan Hill Hollister Diff. Array 1984 6.19 26.43 -0.98 IQD D MORGAN\HDA165 0.2 23 11 148
0090 Morgan Hill San Juan Bautista, 24 Polk St 1984 6.19 27.15 -0.98 AQD C MORGAN\SJB213 0.1 21 12 148
0103 Chalfant Valley-02 McGee Creek - Surface 1986 6.19 29.2 -0.63 IQC - CHALFANT\A-MCG270 0.1 35 13 148
0064 Victoria, Mexico SAHOP Casa Flores 1980 6.33 31.25 0.95 I-C D VICT\SHP010 0.2 27 14 130
0064 Victoria, Mexico Victoria Hospital Sotano 1980 6.33 35.2 0.95 --D - VICT\HPB000 0.2 26 15 130
0076 Coalinga-01 Parkfield - Fault Zone 12 1983 6.36 30.53 0.6 IHC - COALINGA\H-PRK090 0.2 20 16 145
0076 Coalinga-01 Parkfield - Fault Zone 14 1983 6.36 30.79 0.6 IHC - COALINGA\H-Z14000 0.2 23 17 145
0076 Coalinga-01 Parkfield - Fault Zone 15 1983 6.36 30.82 0.6 IQB - COALINGA\H-Z15000 0.2 20 18 145
0076 Coalinga-01 Parkfield - Fault Zone 16 1983 6.36 29.08 0.6 IQC - COALINGA\H-Z16000 0.2 26 19 145
0076 Coalinga-01 Parkfield - Fault Zone 9 1983 6.36 32.84 0.6 IPB - COALINGA\H-Z09000 0.2 23 20 145
0076 Coalinga-01 Parkfield - Vineyard Cany 1E 1983 6.36 28.01 0.6 IQC - COALINGA\H-PV1000 0.2 23 21 145
0076 Coalinga-01 Parkfield - Vineyard Cany 2W 1983 6.36 31.87 0.6 IHC - COALINGA\H-VC2000 0.2 30 22 145
0076 Coalinga-01 Parkfield - Vineyard Cany 4W 1983 6.36 35.94 0.6 IMB - COALINGA\H-VC4000 0.2 27 23 145
0050 Imperial Valley-06 Calipatria Fire Station 1979 6.53 25 0.95 BQD D IMPVALL\H-CAL225 0.1 40 24 143
0050 Imperial Valley-06 Cerro Prieto 1979 6.53 23.3 -0.05 AVA C IMPVALL\H-CPE147 0.1 -11 25 143
0050 Imperial Valley-06 Chihuahua 1979 6.53 17.08 -0.05 IQD D IMPVALL\H-CHI012 0.05 -11 26 143
0050 Imperial Valley-06 Compuertas 1979 6.53 20.9 -0.05 IQD D IMPVALL\H-CMP015 0.2 -11 27 143
0050 Imperial Valley-06 Delta 1979 6.53 31.94 -0.05 IQD D IMPVALL\H-DLT262 0.05 -11 28 143
0050 Imperial Valley-06 El Centro Array #1 1979 6.53 20.31 0.76 AQD D IMPVALL\H-E01140 0.1 40 29 143
0050 Imperial Valley-06 El Centro Array #12 1979 6.53 19.65 0.66 IQD D IMPVALL\H-E12140 0.1 40 30 143
0050 Imperial Valley-06 El Centro Array #13 1979 6.53 23.69 0.71 AQD D IMPVALL\H-E13140 0.2 40 31 143
0050 Imperial Valley-06 Plaster City 1979 6.53 32.44 0.95 AQD D IMPVALL\H-PLS045 0.1 40 32 143
0050 Imperial Valley-06 Superstition Mtn Camera 1979 6.53 27.25 0.95 AGB C IMPVALL\H-SUP045 0.1 40 33 143
0050 Imperial Valley-06 Westmorland Fire Sta 1979 6.53 16.82 0.95 ADD D IMPVALL\H-WSM090 0.1 40 34 143
0116 Superstition Hills-02 Brawley Airport 1987 6.54 17.03 -0.9 AQD D SUPERST\B-BRA225 0.13 20 35 127
0116 Superstition Hills-02 El Centro Imp. Co. Cent 1987 6.54 18.2 -0.9 AQD D SUPERST\B-ICC000 0.1 38 36 127
0116 Superstition Hills-02 Wildlife Liquef. Array 1987 6.54 23.85 -0.86 IQD - SUPERST\B-IVW090 0.1 40 37 127
0030 San Fernando LA - Hollywood Stor FF 1971 6.61 22.77 -0.64 IPD D SFERN\PEL090 0.2 35 38 290
0127 Northridge-01 Lake Hughes #1 1994 6.69 35.81 -0.78 APC C NORTHR\L01000 0.12 23 39 122
0127 Northridge-01 Lake Hughes #12A 1994 6.69 21.36 -0.78 IHC C NORTHR\H12090 0.12 46 40 122
0127 Northridge-01 Lake Hughes #4 - Camp Mend 1994 6.69 31.66 -0.78 IGB C NORTHR\L04000 0.12 23 41 122
0127 Northridge-01 Lake Hughes #4B - Camp Mend 1994 6.69 31.69 -0.78 IGB C NORTHR\L4B000 0.12 23 42 122
0127 Northridge-01 Lake Hughes #9 1994 6.69 25.36 -0.78 AGA C NORTHR\L09000 0.08 -11 43 122
0127 Northridge-01 Pacific Palisades - Sunset 1994 6.69 24.08 0.22 --B C NORTHR\SUN190 0.05 30 44 122
0127 Northridge-01 Santa Susana Ground 1994 6.69 16.74 -0.76 --A C NORTHR\SSU000 11 -11 45 122

0127 Northridge-01 Stone Canyon 1994 6.69 29.21 -0.78 --- C NORTHR\SCR000 0.03 -11 46 122
0127 Northridge-01 Vasquez Rocks Park 1994 6.69 23.64 0.04 IBA C NORTHR\VAS000 0.08 -11 47 122
0129 Kobe, Japan Abeno 1995 6.9 24.75 -0.61 --D D KOBE\ABN000 0.05 40 48 230
0129 Kobe, Japan Tadoka 1995 6.9 31.59 -0.31 --D D KOBE\TDO000 0.05 40 49 230
0129 Kobe, Japan Yae 1995 6.9 27.68 -0.63 --D - KOBE\YAE000 0.05 -11 50 230
0118 Loma Prieta Agnews State Hospital 1989 6.93 24.57 -0.5 AQD D LOMAP\AGW000 0.2 30 51 128
0118 Loma Prieta Anderson Dam (Downstream) 1989 6.93 20.26 0.23 AFD C LOMAP\AND270 0.2 40 52 128
0118 Loma Prieta Anderson Dam (L Abut) 1989 6.93 20.26 0.23 AQA C LOMAP\ADL250 0.1 32 53 128
0118 Loma Prieta Coyote Lake Dam (Downst) 1989 6.93 20.8 0.44 IHD C LOMAP\CLD195 0.1 29 54 128
0118 Loma Prieta Gilroy Array #6 1989 6.93 18.33 0.5 IKB C LOMAP\G06000 0.2 31 55 128
0118 Loma Prieta Halls Valley 1989 6.93 30.49 -0.22 IFC D LOMAP\HVR000 0.2 22 56 128
0118 Loma Prieta UCSC 1989 6.93 18.51 -0.25 --B - LOMAP\UC2000 0.1 -11 57 128
0118 Loma Prieta UCSC Lick Observatory 1989 6.93 18.41 -0.24 AKA C LOMAP\LOB000 0.2 40 58 128
0118 Loma Prieta WAHO 1989 6.93 17.47 -0.08 AQD - LOMAP\WAH000 0.1 -11 59 128
0123 Cape Mendocino Fortuna - Fortuna Blvd 1992 7.01 18.45 0.78 IQD C CAPEMEND\FOR000 0.07 23 60 340
0123 Cape Mendocino Rio Dell Overpass - FF 1992 7.01 17.76 0.63 APC C CAPEMEND\RIO270 0.07 23 61 340
0125 Landers Barstow 1992 7.28 34.85 0.76 IQD C LANDERS\BRS000 0.07 23 62 355
0125 Landers Desert Hot Springs 1992 7.28 16.44 -0.16 AQD C LANDERS\DSP000 0.07 23 63 355
0125 Landers Mission Creek Fault 1992 7.28 20.59 -0.16 --- C LANDERS\MCF000 11 -11 64 355
0125 Landers North Palm Springs 1992 7.28 21.68 -0.16 AHD C LANDERS\NPS000 11 -11 65 355
0125 Landers Palm Springs Airport 1992 7.28 30.26 -0.16 IQD D LANDERS\PSA000 0.07 23 66 355
0125 Landers Yermo Fire Station 1992 7.28 23.28 0.76 AQD D LANDERS\YER270 0.07 23 67 355
0046 Tabas, Iran Boshrooyeh 1978 7.35 28.79 0.66 --C - TABAS\BOS079 0.04 20 68 330
0136 Kocaeli, Turkey Goynuk 1999 7.51 33.7 -0.33 --B - KOCAELI\GYN000 0.15 25 69 274
0136 Kocaeli, Turkey Iznik 1999 7.51 33.12 0.1 A-D D KOCAELI\IZN180 0.1 25 70 274
Table 2. "Ordinary" earthquake ground motion records selected from PEER database.
Figure 1. Magnitudes and distances for the 140 earthquake ground motion records considered.

Figure 2. Pseudo-spectral acceleration versus period for the 140 earthquake ground motion records considered.
Figure 3. Input energy-equivalent acceleration versus period for the 140 earthquake ground motion records considered.

Figure 4. Correlation coefficient between RSE(f) and Sa(f) for the ground motion records considered.
-0.2
0.0
0.2
0.4
0.6
0 1 2 3 4
Period (sec)
Cor
rela
tion
coef
ficie
nt b
etw
een
R SE
and
S a
Near-sourceOrdinaryALL

Figure 5. Roof drift response of the ductile 9-story building model to the 140 selected earthquake records (computed via nonlinear dynamic analysis).
Figure 6. Story drift response of the ductile 9-story building model to the 140 selected earthquake
records (computed via nonlinear dynamic analysis).

Figure 7. Median story drift response of the ductile 9-story building model for 5 bins of 28 earthquake records sorted according to first-mode spectral acceleration.
Figure 8. Median story drift response of the ductile 9-story building model, as predicted by the
regression of θi on Sa(f1), for the same five first-mode spectral acceleration values shown in Figure 7.