nitrogen application and different plant densities
TRANSCRIPT


OPEN ACCESS Asian Journal of Crop Science
ISSN 1994-7879DOI: 10.3923/ajcs.2018.141.150
Research ArticleNitrogen Application and Different Plant Densities Effectivenesson the Productivity of Parsley Crop
Khalid Ali Khalid
Department of Medicinal and Aromatic Plants, National Research Centre, 12 311, Dokki, Cairo, Egypt
AbstractBackground and Objective: Parsley is used for many purposes such as food and pharmaceutical industries. Nitrogen and plant densitiesplay important roles in various growth processes and synthesis of the constituents of different crops especially in arid and semi aridregions. The evaluation of morphological characters and active principals (essential oil) of parsley under N, plant density and theirinteraction had not been investigated before. So, this study aimed to investigate the effect of Nitrogen and plant density and theirinteraction on parsley crop productivity. Materials and Methods: Parsley plants were subjected to different nitrogen (N) doses (0, 100,150 and 200 kg haG1) with three plant densities (8, 12 and 20 plant mG2). Fresh and dry weights, fruit yield, essential oil composition andNPK content were measured. The averages of data were statistically analyzed using two-way analysis of variance (ANOVA-2) withsignificance level LSD at 0.05. Results: The greatest values of fresh and dry weights, fruit yield per plant were recorded with the treatmentof 200 kg haG1 (N)×8 Plant mG2 while the mass production (g mG2) were obtained with 200 kg haG1 (N) x20 Plant mG2. Plants treated with200 kg haG1 (N)×8 Plant mG2 resulted in the highest values of essential oil (%, mL PlantG1 and mL mG2), main constituents of essential oiland nutrient contents (NPK). Conclusion: Nitrogen treatment and plant densities caused different variations in fresh and dry weights, fruityield, essential oil composition and NPK content.
Key words: Parsley, nitrogen, plant densities, fruit yield, essential oil, nutrient content
Citation: Khalid Ali Khalid, 2018. Nitrogen application and different plant densities effectiveness on the productivity of parsley crop. Asian J. Crop Sci.,10: 141-150.
Corresponding Author: Khalid Ali Khalid, Department of Medicinal and Aromatic Plants, National Research Centre, 12311 Dokki, Cairo, EgyptTel: +201117727586
Copyright: © 2018 Khalid Ali Khalid. This is an open access article distributed under the terms of the creative commons attribution License, which permitsunrestricted use, distribution and reproduction in any medium, provided the original author and source are credited.
Competing Interest: The author has declared that no competing interest exists.
Data Availability: All relevant data are within the paper and its supporting information files.

Asian J. Crop Sci., 10 (3): 141-150, 2018
INTRODUCTION
Parsley (Petroselinum crispum Mill.) belongs to Apiaceaefamily, it is a biennial plant and cultivated in various places inthe world i.e., United States, Germany, France, Hungary andseveral other European countries for its aromatic andattractive leaves1. Fresh leaves and dried fruits are used forgarnishing such food dishes as meat, fish and vegetables. Alsoparsley has traditionally been used as an antispasmodic,carminative, diuretic, emmenagogue and stomachic1. Theessential oil of parsley fruits is widely used as a flavoring agentor fragrance in perfumes, soaps and creams1.
The reclaimed lands in Egypt located in arid or semi aridregions which characterized by poor elements especiallynitrogen (N) and unfavorable environmental conditionswhich negatively affect yield and production of aromaticplants including parsley as important economic crop2,3.Nitrogen plays very important roles in various synthesis ofthe constituents of different crops through the action ofseveral enzymes3. The essential oil of thyme (Thymus vulgaris)was significantly increased under various N treatments4.Seed and fruit yields of Nigella sativa L. and coriander(Coriandrum sativum L.) were positively increased withdifferent N doses5,6. The highest values of herb yield, essentialoil and major components of essential oil of Agastachefoeniculum Purch plant were recorded under the treatmentof 100 kg N per hectare7. Omidbaigi et al.8 studied the effectof five doses of N (0, 50, 100, 150 and 200 kg haG1) on herbyield and essential oil of Tagetes minuta, the treatment of200 kg haG1produced the highest values of fresh herb, dryherb, essential oil content(%) and essential oil constituentssuch as p-cymene, limonene, dihydrotagetone, (E)-tagetone, (Z)-tagetone, (Z)-ocimenone and (E)-ocimenone. Themaximum plant height, total biomass production andessential oil composition of lemon grass herb were recordedwith the dose of 50 kg N per hectare9. The N treatment at94 kg haG1 resulted in higher increases of davana (Artemisiapallens Wall) growth characters than untreated plants10.The greatest values of growth characters, essential oil yieldand NPK of dill (Anethum graveolens L.) crop were obtained with the treatment of 100 kg N per hectare11.Khalid3 reported that N caused significant increments in growth characters, essential oil percentages and nutrientcontents (NPK) of anise, coriander and sweet fennel grownin arid regions. Significant increases were found inessential oil and its major constituents of some spicesdue to N fertilization in arid zones12. The effects of Napplication on Schinus terebinthifolius Raddi were
investigated13, N levels (6, 36, 60, 84 and 114 kg haG1) resultedin significant changes in plant height, stem diameter,fresh mass, dry matter, essential oil content and majorconstituents of essential oil ("-pinene, limonene, sabinene, $-pinene, "-copaen and Z-zalvene). The level ofN (120 kg haG1) produced significantly stimulated of the growth, yield and NPK content of Zingiber officinale Rosc14.The highest amounts of black cumin essential oilcontent and the major constituents of essential oil (p-cymeneand "-thujene) were recorded under 100 kg N per hectare15.
Plant density (or spacing) is a non-monetary agronomicalpractice that determines the spatial distribution of plantswhich affects canopy structure, light intercept ion andradiation use efficiency and consequently, biomass productionof crops16. Fresh and dry mass and number of flowers per plantof chrysanthemum were significantly decreased as plantdensity increase17. The effects of plant density on strawberrywere investigated18, obtained results indicated that plantgrowth and yield per plant increased as plant densitydecreased. Growth characters (fresh and dry weights of herband dry weight of leaves) and essential oil content weresignificantly changed due to plant densities19. Decreasingplant densities produces a significant increase in essential oilcontent (%) and different changes in various essential oilconstituents of fennel plants20. Plant densities had anappreciable effect on the yield and chemical contents of bellpepper21. The densities of 20 and 60 marigold plants mG2
resulted in the highest values of herb dry weight, flowernumber, branch number, flower dry weight and amount ofessential oil extracted from dried flower22,23. Flower yield ofclary sage (Salvia sclarea L.) was significantly increased undernarrow spacing while essential oil content and yield were notaffected24. Basil plants were subjected to five plant densities,i.e., 10, 16, 20, 25 and 40 plants mG2, the highest leaf freshmass, leaf area and total plant fresh mass were produced25
from 40 plants mG2. Planting density significantly affectedgrowth, yield and essential oil composition of Saturejasahendica Bornm26. Significant increases were found in freshand dry biomass of peppermint (Mentha piperita) under thedecreasing of plant density while increasing the plant densityresulted in significant increments in essential oil yield27. Higherplant densities produced greater yield than low plant densitythrough an increase in biomass accumulation of soybean28.
Previous studies concerned the study of the effect of N ongrowth and chemical components on Apiaceae plants suchas anise, coriander and fennel in arid zones and did notmention the effect of N on parsley3,29. There is one study onthe effect of N on the morphological characteristics of parsleyplant under sandy soil and did not mention the chemicalingredients and the active substances30. On the other hand the
142

Asian J. Crop Sci., 10 (3): 141-150, 2018
evaluation of growth, yield and active principals (essential oil)of parsley under N, plant density and their interaction had notbeen investigated before. So, in this study, the effect of N,plant density and their interaction on growth, yield, essentialoil composition and nutrient contents of parsley plant grownin arid zones of Egypt were evaluated.
MATERIALS AND METHODS
Experimental: Experiments were carried out in arid land at theExperimental Farm of National Research Centre (NRC) locatedat Nubaria region, Egypt, during two successive seasons, 2015/2016 and 2016/2017. The area of Nubaria had been recentlyreclaimed and parsley had not cultivated before in this area.Physical and chemical properties of the soil used in this studywere determined according to Carter and Gregorich31 andMargenot et al.32 and data were presented in Table 1. Theexperimental area (plot) was 9 m² (3×3 m) containing 6 lines,the distance between hills were 20, 30 and 40 cm apart (20, 12and 8 plants mG2). Parsley seeds were sown during thesecond week of October in both seasons. Thinning for2 plants per hill was made 45 days after sowing. All agriculturepractices operations other than experimental treatments wereperformed according to the recommendations of the Ministryof Agriculture, Egypt. Plots were divided into three groups. Thefirst group was subjected to different levels of N (0.0, 100, 150and 200 kg haG1)×20 plants mG2, the second and third groupswere subjected to the same levels of N×12 or 8 plants mG2.The source of N was ammonium sulfate (21% N). Sprinklerirrigation was used in this trial.
Growth characters: Fresh and dry weights of aerial part andfruit yield were recorded during the fruiting stage, 230 daysafter sowing (230 DAS).
Essential oil isolation: Fresh fruits were collected, air driedand weighed to extract the essential oil, then 100 g from eachreplicate of all treatments was subjected to hydro-distillationfor 3 h using a Clevenger-type apparatus33. The essential oilcontent was calculated as a relative percentage (v/w). Totalessential oil per plant and per mG2 was calculated. Theessential oils extracted from parsley fruits were collected fromeach treatment and dried over anhydrous sodium sulfate toidentify the chemical constituents.
Gas chromatography-mass spectrometry (GC-MS): TheGC-MS analysis was carried out with an Agilent 5975 GC-MSDsystem. DB-5 column (60 m×0.25 mm, 0.25 mm filmthickness) was used with helium as carrier gas (0.8 mL minG1).
Table 1: Physical and chemical properties of soil used in this studyProperty ValuesPhysicalSand (%) 85.8Silt (%) 12.1Clay (%) 2.1ChemicalpH (1:2.5) 8.2EC (dS mG1) 1.3Soluble cations (mq LG1)Na 3.2K 0.1Ca 2.2Mg 0.5Soluble anions (mq LG1)Cl 3.4HCO3 4.5CO3 0.2SO4 1.3N (ppm) 0.6P (ppm) 1.1K (ppm) 1.7
The GC oven temperature was kept at 60EC for 10 min andprogrammed to reach 220EC at a rate of 4EC minG1 and thenkept constant at 220EC for 10 min followed by elevating thetemperature to 240EC at a rate of 1EC minG1. Split ratio wasadjusted at 40:1. The injector temperature was set at 250EC.Mass spectra were recorded at 70 eV. Mass range wasm/z 35-450.
GC analysis: The GC analysis was carried out using an Agilent6890N GC system using FID detector temperature of 300EC. Toobtain the same elution order with GC-MS, simultaneousauto-injection was done on a duplicate of the same column atthe same operational conditions. Relative percent amounts ofseparated compounds were calculated from FIDchromatograms.
Identification of components: Identification of essential oilcomponents was carried out by comparison of their relativeretention times with those of authentic samples or bycomparison of their retention index (RI) to series of n-alkanes.Computer matching was against commercial (Wiley GC/MSLibrary, Mass Finder 3 Library)34,35 and in-house BaÕer Libraryof essential oil constituents built up by genuine compoundsand components of known oils. Additionally, MS literaturedata36,37 were used for identification.
Determination of mineral content: Total nitrogen andphosphorus in leaves at the first and second seasons of eachtreatment were determined using the methods described bythe Association of Official Agricultural Chemists38. The samplesof leaves in the first and second harvests were dried, ground
143
Asian J. Crop Sci., 10 (3): 141-150, 2018
and K extracted by acid digestion32. Concentrations weredetermined by atomic absorption spectrophotometry using aPerkin-Elmer32.
Statistical analysis: In this experiment, 2 factors wereconsidered, plant densities (3 densities) and N (4 levels). Foreach treatment there were four replicates. The experimentaldesign followed a randomized complete block design usingSTAT-ITCF program (Statistica, ver. 7. 1, Statsoft Inc., Tulsa, OK)According to De-Smith39. Averages of data of both seasonswere analyzed using 2-way analysis of variance. Significantvalues were determined according to LSD (0.05)40.
RESULTS
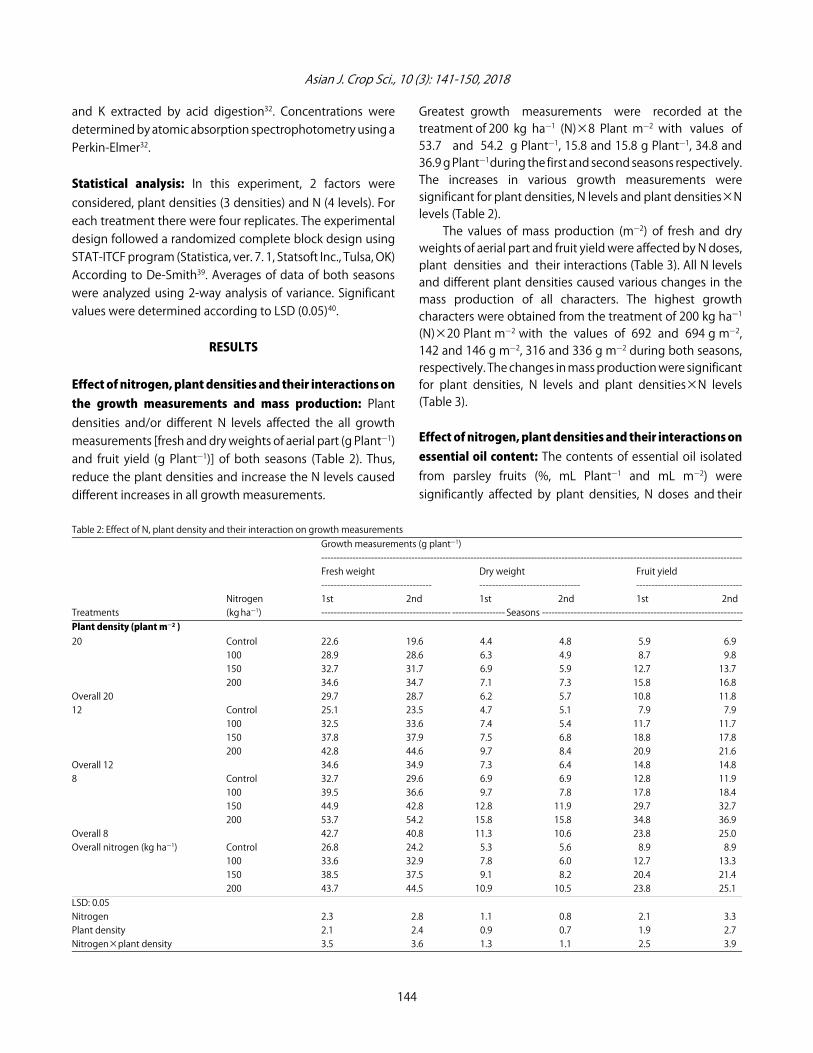
Effect of nitrogen, plant densities and their interactions onthe growth measurements and mass production: Plantdensities and/or different N levels affected the all growthmeasurements [fresh and dry weights of aerial part (g PlantG1)and fruit yield (g PlantG1)] of both seasons (Table 2). Thus,reduce the plant densities and increase the N levels causeddifferent increases in all growth measurements.
Greatest growth measurements were recorded at thetreatment of 200 kg haG1 (N)×8 Plant mG2 with values of 53.7 and 54.2 g PlantG1, 15.8 and 15.8 g PlantG1, 34.8 and36.9 g PlantG1 during the first and second seasons respectively.The increases in various growth measurements weresignificant for plant densities, N levels and plant densities×Nlevels (Table 2).The values of mass production (mG2) of fresh and dry
weights of aerial part and fruit yield were affected by N doses,plant densities and their interactions (Table 3). All N levelsand different plant densities caused various changes in themass production of all characters. The highest growthcharacters were obtained from the treatment of 200 kg haG1
(N)×20 Plant mG2 with the values of 692 and 694 g mG2,142 and 146 g mG2, 316 and 336 g mG2 during both seasons,respectively. The changes in mass production were significantfor plant densities, N levels and plant densities×N levels(Table 3).
Effect of nitrogen, plant densities and their interactions onessential oil content: The contents of essential oil isolatedfrom parsley fruits (%, mL PlantG1 and mL mG2) weresignificantly affected by plant densities, N doses and their
Table 2: Effect of N, plant density and their interaction on growth measurementsGrowth measurements (g plantG1)----------------------------------------------------------------------------------------------------------------------------------------Fresh weight Dry weight Fruit yield----------------------------------- -------------------------------- ----------------------------------
Nitrogen 1st 2nd 1st 2nd 1st 2ndTreatments (kg haG1) ----------------------------------------- ----------------- Seasons ---------------------------------------------------------------Plant density (plant mG2 )20 Control 22.6 19.6 4.4 4.8 5.9 6.9
100 28.9 28.6 6.3 4.9 8.7 9.8150 32.7 31.7 6.9 5.9 12.7 13.7200 34.6 34.7 7.1 7.3 15.8 16.8
Overall 20 29.7 28.7 6.2 5.7 10.8 11.812 Control 25.1 23.5 4.7 5.1 7.9 7.9
100 32.5 33.6 7.4 5.4 11.7 11.7150 37.8 37.9 7.5 6.8 18.8 17.8200 42.8 44.6 9.7 8.4 20.9 21.6
Overall 12 34.6 34.9 7.3 6.4 14.8 14.88 Control 32.7 29.6 6.9 6.9 12.8 11.9
100 39.5 36.6 9.7 7.8 17.8 18.4150 44.9 42.8 12.8 11.9 29.7 32.7200 53.7 54.2 15.8 15.8 34.8 36.9
Overall 8 42.7 40.8 11.3 10.6 23.8 25.0Overall nitrogen (kg haG1) Control 26.8 24.2 5.3 5.6 8.9 8.9
100 33.6 32.9 7.8 6.0 12.7 13.3150 38.5 37.5 9.1 8.2 20.4 21.4200 43.7 44.5 10.9 10.5 23.8 25.1
LSD: 0.05Nitrogen 2.3 2.8 1.1 0.8 2.1 3.3Plant density 2.1 2.4 0.9 0.7 1.9 2.7Nitrogen×plant density 3.5 3.6 1.3 1.1 2.5 3.9
144

Asian J. Crop Sci., 10 (3): 141-150, 2018
Table 3: Effect of N, plant density and their interaction on the mass productionMass production (g mG2)----------------------------------------------------------------------------------------------------------------------------------------Fresh weight Dry weight Fruit yield----------------------------------- -------------------------------- --------------------------------
Nitrogen 1st 2nd 1st 2nd 1st 2ndTreatments (kg haG1) ---------------------------- ------------------------------ Seasons ---------------------------------------------------------------Plant density (plant mG2 )20 Control 452 392 88 96 118 138
100 578 572 126 98 174 196150 654 634 138 118 254 274200 692 694 142 146 316 336
Overall 20 594 573 124 115 216 23612 Control 301 282 56 61 95 95
100 390 403 89 65 140 140150 464 454 90 82 226 214200 514 535 116 101 251 259
Overall 12 417 419 88 77 178 1778 Control 277 237 55 55 102 95
100 262 293 78 62 142 147150 316 342 102 95 238 262200 359 434 126 126 278 295
Overall 8 304 327 90 85 190 200Overall nitrogen (kg haG1) Control 343 304 66 71 105 109
100 410 423 98 75 152 161150 478 477 110 98 239 250200 522 554 128 124 282 297
LSD: 0.05Nitrogen 5.9 5.6 7.8 4.6 3.8 3.7Plant density 4.3 4.1 1.9 2.3 2.9 2.5Nitrogen×plant density 6.2 5.9 3.5 3.1 4.1 3.8
interactions (Table 4). Plants treated with various levels ofN X 8 Plant mG2 had higher essential oil contents than theuntreated plants (control) and other treatments in bothseasons. The greatest essential oil contents were due totreatments with 200 kg haG1 (N)×8 Plant mG2 with the valuesof 1.7 and 1.9%, 0.6 and 0.7 mL PlantG1, 4.8 and 5.6 mL mG2
during the first and second seasons, respectively.
Effect of nitrogen, plant densities and their interactions onessential oil constituents: Sixteen components weredetected by GC-MS analysis under nitrogen doses, variousplant densities and their interactions (Table 5, 6). Apiol,myristicin, "-pinene and $-pinene were identified as the maincomponents which reflected the highest values of essential oilisolated from parsley fruits. Increasing the N doses x reducingplant density resulted in an increase in main components ofessential oil. The highest amounts of main constituents wereobtained with the treatment of 150 kg haG1 (N)×8 Plant mG2
with the values of 31.5, 27.1, 11.5 and 13.1, respectively(Table 5). All detected compounds divided into four chemicalgroups, monoterpene hydrocarbons (MCH) and oxygenated
sesquiterpenes (SCHO) were the major groups whileoxygenated monoterpenes (MCHO) and sesquiterpeneshydrocarbons (SCH) formed the minor groups. The highestvalues of MCH (33.3%) and SCHO (62.3%) were produced withthe treatment of 150 kg haG1 (N)×8 Plant mG2. The greatestamount of SCH (6.1%) was produced with the treatment of100 kg haG1 (N)×12 Plant mG2. The treatments of 0.0 kg haG1
(N)×12 Plant mG2, 150 kg haG1 (N)×12 Plant mG2 and200 kg haG1 (N)×8 Plant mG2 produced the highest content(1.9%) of MCHO (Table 5). The changes in all constituents andchemical groups were significant for N×plant densities.Different increases and changes were found in the mainconstituents and various chemical groups due N doses. Thehighest amounts of apiol (31.3%), myristicin (26.9%), "-pinene(12.8%) and $-pinene (11.3%), MCHO (1.8%) and SCHO (61.6%)were recorded with the treatment of 150 kg haG1 (N) (Table 6).The level of 100 kg haG1 (N) produced the highest values ofMCH (31.6%) and SCH (4.9%) (Table 6). The changes in allidentified components and chemical groups wereinsignificant for N treatments except the camphene, $-pinene,myrcene, $-phellandrene, γ-terpinene, $-caryophyllene,trans-"-bergamotene and (Z)-$-farnesene were significant.
145

Asian J. Crop Sci., 10 (3): 141-150, 2018
Table 4: Effect of N, plant density and their interaction on the chemical contentsEssential oil ---------------------------------------------------------------------
Yield Nutrient content (%)------------------------------------------ ---------------------------------------------------------------------
Percentage mL plantG1 mL mG2 N P K--------------------- ------------------ ------------------ ------------------ ------------------ ------------------
Nitrogen 1st 2nd 1st 2nd 1st 2nd 1st 2nd 1st 2nd 1st 2ndTreatments (kg haG1) ------------------------------------------------------------------ Seasons ---------------------------------------------------------------------Plant density (Plant mG2)20 Control 0.5 0.6 0.1 0.1 0.8 0.8 0.1 0.1 0.3 0.2 0.5 0.7
100 0.6 0.7 0.1 0.1 2.0 2.0 0.2 0.2 0.4 0.3 0.6 0.8150 0.6 0.8 0.1 0.1 2.0 2.0 0.2 0.3 0.4 0.4 0.6 0.8200 0.7 0.9 0.1 0.2 2.0 4.0 0.3 0.4 0.4 0.5 0.6 0.8
Overall 20 0.6 0.8 0.1 0.1 2.0 2.0 0.2 0.3 0.4 0.4 0.6 0.812 Control 0.7 0.7 0.1 0.1 1.2 1.2 0.2 0.2 0.4 0.3 0.6 0.8
100 0.8 0.9 0.1 0.1 1.2 1.2 0.3 0.3 0.5 0.5 0.7 0.9150 1.1 1.2 0.2 0.2 2.4 2.4 0.4 0.4 0.6 0.6 0.7 1.1200 1.3 1.4 0.3 0.2 3.6 2.4 0.4 0.5 0.6 0.7 0.8 1.2
Overall 12 1.0 1.1 0.2 0.2 2.4 2.4 0.3 0.4 0.5 0.5 0.7 1.08 Control 0.9 0.8 0.1 0.1 0.8 0.8 0.3 0.3 0.6 0.4 1.1 1.3
100 1.2 1.4 0.2 0.3 1.6 2.4 0.5 0.5 0.8 0.7 1.4 1.5150 1.5 1.7 0.5 0.6 4.0 4.8 0.8 0.8 0.9 0.9 1.5 1.7200 1.7 1.9 0.6 0.7 4.8 5.6 0.9 1.1 1.2 1.1 1.7 1.9
Overall 8 1.3 1.5 0.4 0.4 3.2 3.2 0.6 0.7 0.9 0.8 1.4 1.6Overall nitrogen (kg haG1) Control 0.7 0.7 0.1 0.1 0.9 0.9 0.2 0.2 0.4 0.3 0.7 0.9
100 0.9 1.0 0.1 0.2 1.6 1.9 0.3 0.3 0.6 0.5 0.9 1.1150 1.1 1.2 0.3 0.3 2.8 3.1 0.5 0.5 0.6 0.6 0.9 1.2200 1.2 1.4 0.3 0.4 3.5 4.0 0.5 0.7 0.7 0.8 1.0 1.3
LSD: 0.05Nitrogen 0.2 0.2 0.1 0.1 0.3 0.3 0.2 0.1 0.2 0.2 0.2 0.2Plant density 0.1 0.1 0.1 0.1 0.2 0.2 0.1 0.1 0.1 0.1 0.1 0.1Nitrogen×plant density 0.3 0.3 0.1 0.1 0.2 0.2 0.1 0.1 0.2 0.2 0.2 0.2
Table 5: Effect of N x plant density the constituents of essential oil20 Plant mG2×N 12 Plant mG2×N 8 Plant mG2×N------------------------------------------ ----------------------------------------- ----------------------------------------- LSD
Number Components Class 0.0 100 150 200 0.0 100 150 200 0.0 100 150 200 0.051 "-Thujene MCH 0.9 0.8 0.7 0.6 1.7 0.8 0.9 1.7 0.8 0.9 0.8 0.7 0.22 "-Pinene MCH 12.3 12.4 12.6 12.5 12.4 12.5 12.7 12.6 12.5 12.8 13.1 12.9 0.13 Camphene MCH 1.5 1.3 1.2 0.5 1.3 0.4 0.7 0.7 1.6 1.7 1.9 1.7 0.24 Sabinene MCH 2.6 1.4 1.5 1.6 0.9 0.8 0.9 1.7 0.9 1.8 1.7 0.8 0.35 $-Pinene MCH 10.8 10.9 11.1 11.0 10.9 11.0 11.2 11.0 11.1 11.3 11.5 11.4 0.16 Myrcene MCH 1.8 1.9 1.8 1.6 0.8 1.1 1.3 1.5 1.7 1.9 0.6 0.9 0.27 $-Phellandrene MCH 1.5 1.6 1.5 1.5 2.1 1.9 0.7 1.1 1.9 1.8 1.8 1.4 0.48 γ-Terpinene MCH 1.8 1.3 1.4 1.6 0.4 1.7 0.6 1.5 0.9 0.8 1.9 1.7 0.29 Myrtenal MCHO 1.7 1.5 1.7 1.8 1.9 1.8 1.9 1.3 1.5 1.2 1.7 1.9 0.110 $-Caryophyllene SCH 1.6 1.5 1.8 1.8 2.2 1.6 1.5 2.8 1.8 0.7 0.9 1.5 0.511 Trans-"-Bergamotene SCH 1.8 1.9 1.6 1.6 1.9 2.3 2.1 1.9 1.7 1.8 0.8 1.5 0.412 (Z)-$-Farnesene SCH 0.7 1.7 1.5 1.4 1.8 2.2 2.4 0.6 0.9 0.8 0.7 0.9 0.613 Myristicin SCHO 26.4 26.5 26.7 26.6 26.5 26.7 26.9 26.8 26.7 26.9 27.1 27.0 0.114 Elemicin SCHO 1.4 1.5 1.2 1.9 1.6 1.9 2.1 1.6 1.9 2.1 1.8 1.7 0.615 Carotol SCHO 1.5 1.4 1.3 1.6 1.7 1.7 1.9 1.7 1.8 0.8 1.9 1.8 0.216 Apiol SCHO 30.6 30.7 30.9 31.1 30.7 30.8 31.3 31.1 30.9 31.1 31.5 31.4 0.1MCH 33.2 31.6 31.8 30.9 30.5 30.2 29.0 31.8 31.4 33.0 33.3 31.5 0.3MCHO 1.7 1.5 1.7 1.8 1.9 1.8 1.9 1.3 1.5 1.2 1.7 1.9 0.2SCH 4.1 5.1 4.9 4.8 5.9 6.1 6.0 5.3 4.4 3.3 2.4 3.9 0.7SCHO 59.9 60.1 60.1 61.2 60.5 61.1 62.2 61.2 61.3 60.9 62.3 61.9 0.3Total identified 98.9 98.3 98.5 98.7 98.8 99.2 99.1 99.6 98.6 98.4 99.7 99.2MCH: Monoterpene hydrocarbons, MCHO: Oxygenated monoterpenes, SCH: Sesquiterpene hydrocarbons, SCHO: Oxygenated sesquiterpenes
146
Asian J. Crop Sci., 10 (3): 141-150, 2018
Table 6: Effect of N or plant density the constituents of essential oilOverall-----------------------------------------------------------------------------------------N (kg haG1) Plant density (plant mG2) LSD----------------------------------------------- ---------------------------------- -----------------------------
Numbers Components Class 0.0 100 150 200 20 12 8 N Plant density 1 "-Thujene MCH 1.1 0.8 0.8 1.0 0.8 1.3 0.8 ns 0.12 "-Pinene MCH 12.4 12.6 12.8 12.7 12.5 12.6 12.8 ns ns3 Camphene MCH 1.5 1.1 1.3 1.0 1.1 0.8 1.7 0.2 0.54 Sabinene MCH 1.5 1.3 1.4 1.4 1.8 1.1 1.3 ns 0.45 $-Pinene MCH 10.8 11.1 11.3 11.1 11.0 11.0 11.3 0.2 0.66 Myrcene MCH 1.4 1.6 1.2 1.3 1.8 1.2 1.3 0.1 0.57 $-Phellandrene MCH 1.8 1.8 1.3 1.3 1.5 1.5 1.7 0.3 0.38 γ-Terpinene MCH 1.0 1.3 1.3 1.6 1.5 1.1 1.3 0.3 0.59 Myrtenal MCHO 1.7 1.5 1.8 1.7 1.6 1.7 1.6 ns ns10 $-Caryophyllene SCH 1.9 1.3 1.4 2.0 1.7 2.0 1.2 0.3 0.511 .trans-"-Bergamotene SCH 1.8 2.0 1.5 1.7 1.7 2.1 1.5 0.3 0.512 (Z)-$-Farnesene SCH 1.1 1.6 1.5 1.0 1.3 1.8 0.8 0.2 0.413 Myristicin SCHO 26.5 26.7 26.9 26.8 26.6 26.7 26.9 ns ns14 Elemicin SCHO 1.6 1.8 1.7 1.7 1.5 1.8 1.9 ns ns15 Carotol SCHO 1.7 1.3 1.7 1.7 1.5 1.8 1.6 ns ns16 Apiol SCHO 30.7 30.9 31.3 31.2 30.8 31.0 31.2 ns nsMCH 31.5 31.6 31.4 31.4 32.0 30.6 32.2 ns nsMCHO 1.7 1.5 1.8 1.7 1.6 1.7 1.6 ns nsSCH 4.8 4.9 4.4 4.7 4.7 5.9 3.5 ns nsSCHO 60.5 60.7 61.6 61.4 60.4 61.3 61.6 ns nsTotal identified 98.5 98.7 99.2 99.2 98.8 99.5 98.9MCH: Monoterpene hydrocarbons, MCHO: Oxygenated monoterpenes, SCH: Sesquiterpene hydrocarbons, SCHO: Oxygenated sesquiterpenes
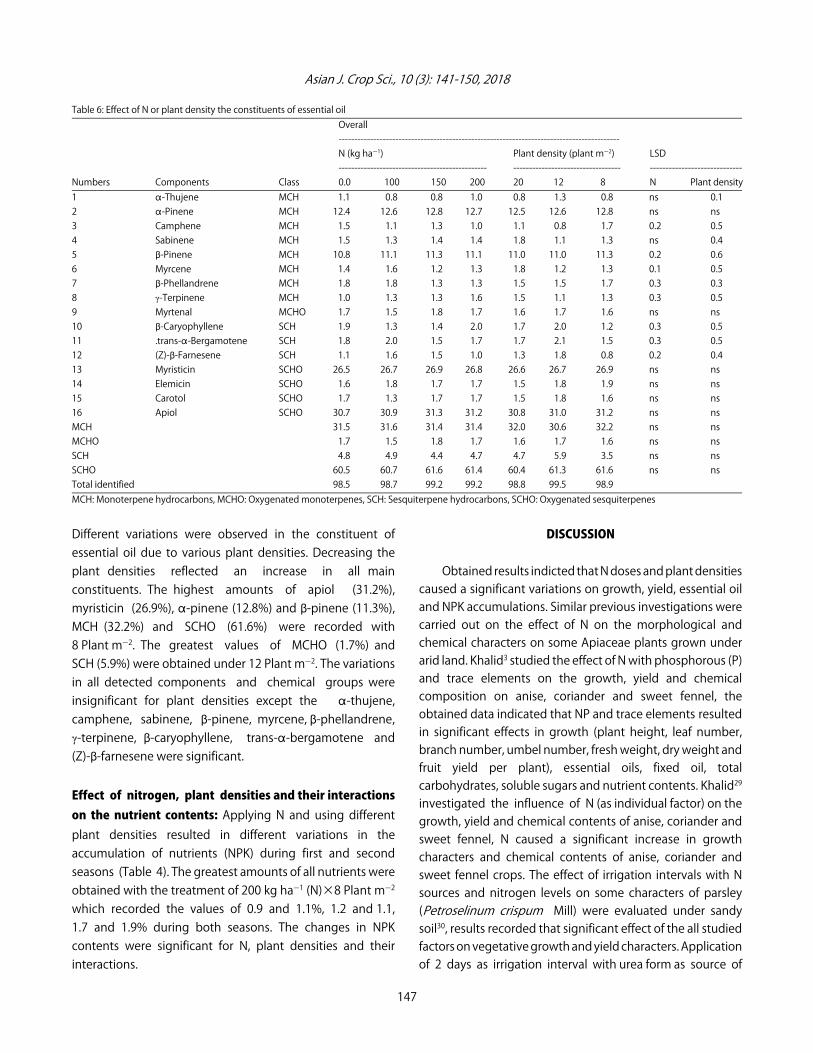
Different variations were observed in the constituent ofessential oil due to various plant densities. Decreasing theplant densities reflected an increase in all mainconstituents. The highest amounts of apiol (31.2%), myristicin (26.9%), "-pinene (12.8%) and $-pinene (11.3%),MCH (32.2%) and SCHO (61.6%) were recorded with8 Plant mG2. The greatest values of MCHO (1.7%) andSCH (5.9%) were obtained under 12 Plant mG2. The variationsin all detected components and chemical groups wereinsignificant for plant densities except the "-thujene,camphene, sabinene, $-pinene, myrcene, $-phellandrene,γ-terpinene, $-caryophyllene, trans-"-bergamotene and(Z)-$-farnesene were significant.
Effect of nitrogen, plant densities and their interactionson the nutrient contents: Applying N and using differentplant densities resulted in different variations in theaccumulation of nutrients (NPK) during first and secondseasons (Table 4). The greatest amounts of all nutrients wereobtained with the treatment of 200 kg haG1 (N)×8 Plant mG2
which recorded the values of 0.9 and 1.1%, 1.2 and 1.1,1.7 and 1.9% during both seasons. The changes in NPKcontents were significant for N, plant densities and theirinteractions.
DISCUSSION
Obtained results indicted that N doses and plant densitiescaused a significant variations on growth, yield, essential oiland NPK accumulations. Similar previous investigations werecarried out on the effect of N on the morphological andchemical characters on some Apiaceae plants grown underarid land. Khalid3 studied the effect of N with phosphorous (P)and trace elements on the growth, yield and chemicalcomposition on anise, coriander and sweet fennel, theobtained data indicated that NP and trace elements resultedin significant effects in growth (plant height, leaf number,branch number, umbel number, fresh weight, dry weight andfruit yield per plant), essential oils, fixed oil, totalcarbohydrates, soluble sugars and nutrient contents. Khalid29
investigated the influence of N (as individual factor) on thegrowth, yield and chemical contents of anise, coriander andsweet fennel, N caused a significant increase in growthcharacters and chemical contents of anise, coriander andsweet fennel crops. The effect of irrigation intervals with Nsources and nitrogen levels on some characters of parsley(Petroselinum crispum Mill) were evaluated under sandysoil30, results recorded that significant effect of the all studiedfactors on vegetative growth and yield characters. Applicationof 2 days as irrigation interval with urea form as source of
147
Asian J. Crop Sci., 10 (3): 141-150, 2018
nitrogen and 200 kg N haG1, produced the highest meanvalues of plant height, number of branches/plant, number ofleaflets/plant, fresh weight of plants mG2 and fresh weight of5 plants. On the other way our present investigationconcentrated on the effect of the interactions between N andplant densities on growth, yield and chemical composition ofparsley which has not been studied before.The significant effects of different nitrogen doses on
growth, essential oil composition and NPK content may bedue to decrease in soil pH that reflected to increase thenutrient availability of the soil in arid regions, it has beenreported by use of ammonium sulfate41. The significant effectsof N treatments may be due to the important physiologicalrole of N on molecule structure as porphyrin. The porphyrinstructure is found in such metabolically important compoundsas the chlorophyll pigments and the cytochromes, which areimportant in photosynthesis and respiration. Nitrogen plays animportant role in synthesis of the plant constituents throughthe action of different enzymes activities and proteinsynthesis42 that reflected in the increase of growth, yield,essential oil composition and NPK of some aromatic plantssuch as anise, coriander and sweet fennel. Obtained results arein accordance with those reported by some previousinvestigators: Ashraf et al.5, Akbarinia et al.6 and Hellal et al.11
reported that N fertilizer caused a significant improvement onthe growth, yield and chemical composition of cumin,coriander and dill. On the other hand, the increments in NPKdue to the N application may be due to the increase in the drymatter of plant materials43. Optimum plant density of a cropvaries considerably depending upon climatic conditions of thegrowing area and fertility status of the soil. Plant distance is animportant factor for higher production and gives equalopportunity to plants for their survival and the best use ofother inputs. Spacing has critical effects on quantitative andqualitative characteristics of plants16. Narrow row spacingresults in higher leaf photosynthesis and suppresses weedgrowth due to a smothering effect, compared with a wide rowspacing16. To achieve the highest yield of economic productper unit area, crops should intercept solar radiation fullyduring the growth stage, in which photosynthesis providescarbohydrates for the economic product16. In general,increasing a plant population produces a greater biologicalyield per unit land area for most crops up to some upper limitor threshold density, after which further increases in plantdensity either maintain the same yield or cause yield decline.The threshold plant population, beyond which yield does notincrease, depends on environmental factors16. Therefore, itseems that plant geometry could be used as a managementtool for maximizing crop growth and yield, so it is advisable to
carry out trials in each planting zone to establish adequateplant population density for that particular area. Taleie et al.44
studied the effects of plant density on S. rebauiana Bertoniand examined that spacing significantly affected plant height,herbage fresh and dry weights and also chemical contents.
CONCLUSION
It may concluded that the greatest growth characters perplant were recorded with 200 kg haG1 (N)×8 Plant mG2 whilethe highest mass productions (per mG2) were recorded underthe treatment of 200 kg haG1 (N)×20 Plant mG2. The essentialoil percentage or yields (per plant or per mG2) were reportedat 200 kg haG1 (N)×8 Plant mG2. The greatest accumulation ofNPK contents were observed with treatment of 200 kg haG1
(N)×8 Plant mG2.
SIGNIFICANCE STATEMENT
This study discovered that application with high level ofN (200 kg haG1) and the highest plant density (20 Plant mG2)produce higher mass production [herb (fresh or dry) andfruit yield] than other treatments. The Lowest plant density(8 Plant mG2) with high level of N (200 kg haG1) resulted inhigher values of essential oil yield (per plant or per m2) andmain constitutes of essential oil than other treatment. Thusthe farmers or producers can select if they need produce herb,fruit or essential oil.
REFERENCES
1. Dong, X., Z.T. Jiang, S. Jiang and R. Li, 2017. Compositioncomparison of essential oils extracted by hydrodistillationand microwave-assisted hydrodistillation from Petroselinumcrispum grown in China. J. Essential Oil Bearing Plants,20: 368-374.
2. Khalid, K.A., 2006. Influence of water stress on growth,essential oil and chemical composition of herbs (Ocimum sp.).Int. Agrophys., 20: 289-296.
3. Khalid, A.K., 2012. Effect of NP and foliar spray ongrowth and chemical compositions of some medicinalApiaceaeplants grow in arid regions in Egypt. J. Soil Sci. PlantNutr., 12: 617-632.
4. Baranauskiene, R., P.R. Venskutonis, P. Viskelis andE. Dambrauskiene, 2003. Influence of nitrogen fertilizerson the yield and composition of thyme (Thymus vulgaris).J. Agric. Food Chem., 51: 7751-7758.
5. Ashraf, M., Q. Ali and Z. Iqbal, 2006. Effect of nitrogenapplication rate on the content and composition of oil,essential oil and minerals in black cumin (Nigella sativa L.)seeds. J. Sci. Food Agric., 86: 871-876.
148

Asian J. Crop Sci., 10 (3): 141-150, 2018
6. Akbarinia, A., D. Jahanfar and M.B. Farzad, 2007. Effect ofnitrogen fertilizer and plant density on seed yield, essential oiland oil content of Coriandrum sativum L. Iran. J. Med.Aromatic Plants, 22: 410-419.
7. Omidbaigi, R., M. Kabudani and M. Khoorang, 2008. Nitrogenfertilizer affecting herb yield, essential oil content andcompositions of Agastache foeniculum purch. J. Essential OilBearing Plants, 11: 261-266.
8. Omidbaigi, R., B. Dadman and F. Fattahi, 2008. Influence ofnitrogen fertilizer on the herb yield, essential oil content andcomposition of Tagetes minuta L. J. Essential Oil Bear. Plants,11: 45-52.
9. Rashmi and S.B. Singh, 2008. Studying the effect of nitrogenand potassium fertilizer on growth and essential oil contentof Cymbopogon citratus and Vetiveria zizanioides. J. EssentialOil Bear. Plants, 11: 188-193.
10. Kumar, T.S., V. Swaminathan and S. Kumar, 2009. Influence ofnitrogen, phosphorus and biofertilizers on growth, yieldand essential oil constituents in ratoon crop of davana(Artemisia pallens Wall.). Electron. J. Environ. Agric. Food.Chem., 8: 86-95.
11. Hellal, F.A., S.A. Mahfouz and F.A.S. Hassan, 2011. Partialsubstitution of mineral nitrogen fertilizer by bio-fertilizer on(Anethum graveolens L.) plant. Agric. Biol. J. North Am.,4: 652-660.
12. Khalid, A.K., 2014. Essential oil composition of somespices treated with nitrogen in arid regions. Int. Food Res. J.,21: 2305-2309.
13. Pinto, J.V.D.C., M.D.C. Vieira, N.A.H. Zarate, A.S.N. Formagio,C.A. Cardoso, T.O. Carnevali and P.H.N.D. Souza, 2016. Effectof soil nitrogen and phosphorus on early development andessential oil composition of Schinus terebinthifolius Raddi.J. Essential Oil Bearing Plants, 19: 247-257.
14. Singh, M., M.M.A. Khan and M. Naeem, 2016. Effect ofnitrogen on growth, nutrient assimilation, essential oilcontent, yield and quality attributes in Zingiber officinaleRosc. J. Saudi Soc. Agric. Sci., 15: 171-178.
15. Khalid, K.A., 2018. Evaluation of black cumin oils undervarious nitrogen treatments. J. Mater. Environ. Sci., 9: 873-878.
16. Kumar, R., S. Sharma and S. Sood, 2014. Yield components,light interception and marker compound accumulation ofstevia (Stevia rebaudiana Bertoni) affected by plantingmaterial and plant density under Western Himalayanconditions. Arch. Agron. Soil Sci., 60: 1731-1745.
17. Lee, J.H., E. Heuvelink and H. Challa, 2002. Effects of plantingdate and plant density on crop growth of cutchrysanthemum. J. Hortic. Sci. Biotechnol., 77: 238-247.
18. De Camacaro, M.E.P., G.J. Camacaro, P. Hadley, M.D. Dennett,N.H. Battey and J.G. Carew, 2004. Effect of plant density andinitial crown size on growth, development and yield instrawberry cultivars Elsanta and Bolero. J. Hortic. Sci.Biotechnol., 79: 739-746.
19. Saglam, C., I. Atakisi, H. Turhan, S. Kaba, F. Arslanoglu andF. Onemli, 2004. Effect of propagation method, plant densityand age on lemon balm (Melissa officinalis) herb and oil yield.New Zealand J. Crop Hort. Sci., 32: 419-423.
20. Khorshidi, J., M.F. Tabatabaie, R. Omidbaigi and F. Sefidkon,2009. Effect of densities of planting on yield and essential oilcomponents of fennel (Foeniculum vulgare Mill Var.Soroksary). J. Agric. Sci., 1: 152-157.
21. Khasmakhi-Sabet, A., S. Sedaghathoor, J. Mohammady andA. Olfati, 2009. Effect of plant density on bell pepper yield andquality. Int. J. Vegetable Sci., 15: 264-271.
22. Berimavandi, A.R., D. Hashemabadi, M.V.F. Ghaziani andB. Kaviani, 2011. Effects of plant density and sowing date onthe growth, flowering and quantity of essential oil ofCalendula officinalis L. J. Med. Plants Res., 5: 5110-5115.
23. Mirzaei, M., S. Zehtab-Salmasi, A.D.M. Nassab andS. Shaker-Kouhi, 2016. Effects of sowing date and plantdensity on marigold (Calendula officinalis) morphology andflower yield. J. Med. Plants, 4: 229-232.
24. Kumar, R., S. Sharma and V. Pathania, 2013. Effect of shadingand plant density on growth, yield and oil composition ofclary sage (Salvia sclarea L.) in North Western Himalaya. J.Essential Oil Res., 25: 23-32.
25. Maboko, M.M. and C.P. Du Plooy, 2013. High-plant densityplanting of basil (Ocimum basilicum) during summer/fallgrowth season improves yield in a closed hydroponic system.Acta Agric. Scandinavica Section B-Soil Plant Sci., 63: 748-752.
26. Abbaszadeh, B., F. Sefidkon, M.L. Haghighi and E.K. Hajiabadi,2014. The effect of planting time and planting density onyield and essential oil of Satureja sahendica Bornm. J. Med.Plant. By-Prod., 2: 141-146.
27. Mansoori, I., 2014. The effect of plant density and harvestingtime on growth and essential oil of peppermint (Menthapiperita L.). J. Med. Bioeng., 3: 113-116.
28. Matsuo, N., T. Yamada, Y. Takada, K. Fukami and M. Hajika,2018. Effect of plant density on growth and yield of newsoybean genotypes grown under early planting condition inSouthwestern Japan. Plant Prod. Sci., 21: 16-25.
29. Khalid, K.A., 2013. Effect of nitrogen fertilization onmorphological and biochemical traits of some apiaceaecrops under arid region conditions in Egypt. NusantaraBiosci., 5: 15-21.
30. Mirdad, Z.M., 2011. Effect of irrigation intervals, nitrogensources and nitrogen levels on some characters of parsley(Petroselinum crispum Mill). J. King Abdulaziz Univ., 22: 3-17.
31. Carter, M.R. and E.G. Gregorich, 2008. Soil Sampling andMethods of Analysis. 2nd Edn., Taylor and Francis Group, USA.
32. Margenot, A.J., F.J. Calderon, K.W. Goyne, F.N.D. Mukome andS.J. Parikh, 2017. IR Spectroscopy, Soil Analysis Applications.In: Encyclopedia of Spectroscopy and Spectrometry, Lindon,J., G. Tranter and D. Koppenaal (Eds.). 3rd Edn., OxfordAcademic Press, UK., pp: 448-454.
149

Asian J. Crop Sci., 10 (3): 141-150, 2018
33. Clevenger, J.F., 1928. Apparatus for the determination ofvolatile oil. J. Am. Pharm. Assoc., 17: 345-349.
34. Adams, R.P., 2007. Identification of Essential Oil Componentsby Gas Chromatography/Mass Spectorscopy. 4th Edn.,Allured Publishing, USA., ISBN: 9781932633214, Pages: 804.
35. Kumari, S., S. Pundhir, P. Priya, G. Jeena and A. Punetha et al.,2014. EssOilDB: A database of essential oils reflecting terpenecomposition and variability in the plant kingdom. Database,Vol. 2014. 10.1093/database/bau120
36. Cincotta, F., A. Verzera, G. Tripodi and C. Condurso, 2015.Determination of sesquiterpenes in wines by HS-SPMEcoupled with GC-MS. Chromatography, 2: 410-421.
37. Anonymous, 2006. Essential oils, the Complete Database ofEssential Oils. Leffing Well and Associates Publishing, TheNetherlands.
38. AOAC., 2016. Official Methods of Analysis. 20th Edn.,Association of Official Analytical Chemists, Washington, D.C.,USA.
39. De Smith, M.J., 2015. STATSREF: Statistical AnalysisHandbook-A Web-Based Statistics Resource. The WinchelseaPress, Winchelsea, UK.
40. Statsoft, 2007. Statistica Version 7.1. Statsoft Inc., Tulsa.41. Bolan, N.S. and M.J. Hedley, 2003. Role of Carbon, Nitrogen
and Sulfur Cycles in Soil Acidification. In: Handbook of SoilAcidity, Rengel, Z. (Ed.). Marcel Dekker, New York, pp: 29-56.
42. Khalid, A.K. and M.R. Shedeed, 2015. Effect of NPK and foliarnutrition on growth, yield and chemical constituents inNigella sativa L. J. Mater. Environ. Sci., 6: 1709-1714.
43. El-Wahab, A. and A. Mohamed, 2007. Effect of nitrogen andmagnesium fertilization on the production ofTrachyspermum ammi L (Ajowan) plants under sinaiconditions. J. Applied Sci. Res., 3: 781-786.
44. Taleie, N., Y. Hamidoghli, B. Rabiei and S. Hamidoghli, 2012.Effects of plant density and transplanting date on herbage,stevioside, phenol and flavonoid yield of Stevia rebaudianaBertoni. Int. J. Agric. Crop Sci., 4: 298-302.
150