nipsco r.m. schahfer generating facility … · report . october 2016 i ... conclusions and...
TRANSCRIPT

Golder, Golder Associates and the GA globe design are trademarks of Golder Associates Corporation
A world ofcapabilities
delivered locally
NIPSCO R.M. SCHAHFER GENERATING FACILITY
WASTE DISPOSAL AREA (WDA)
STRUCTURAL STABILITY AND SAFETY FACTOR ASSESSMENT
Wheatfield, Indiana
Pursuant to 40 CFR 257.73(d) & 257.73(e)
Submitted To: Northern Indiana Public Service Company 2723 East 1500 North Wheatfield, IN 46392 Submitted By: Golder Associates Inc. 15851 South US 27, Suite 50 Lansing, MI 48906 USA October 5, 2016 Project No. 1651599
REPO
RT

October 2016 i Project No. 1651599
1
Table of Contents
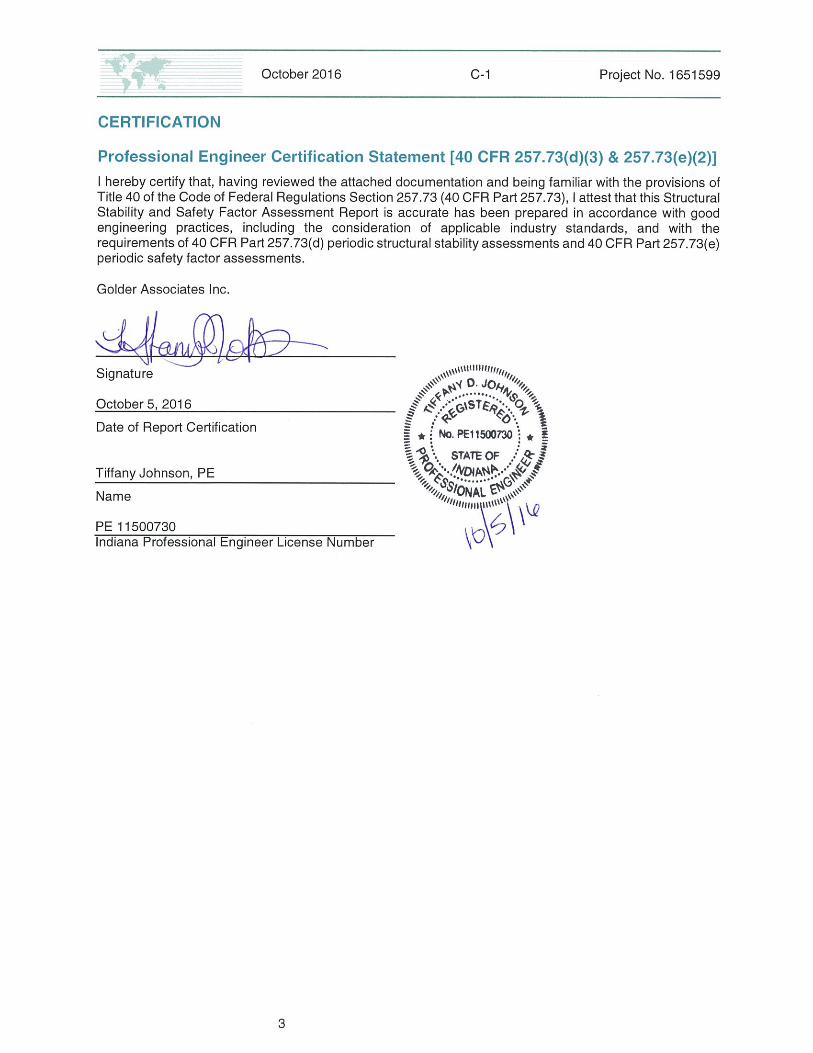
Professional Engineer Certification Statement [40 CFR 257.73(d)(3) & 257.73(e)(2)] ............................ C
1. INTRODUCTION .............................................................................................................................. 1
1.1 Purpose ........................................................................................................................................ 1
1.2 WDA Background ......................................................................................................................... 1
1.3 Previous Evaluations .................................................................................................................... 2
2. SITE DESCRIPTION ........................................................................................................................ 4
2.1 SUBSURFACE CONDITIONS ..................................................................................................... 4
2.2 Physical Properties of Foundation Materials ................................................................................ 4
2.3 Engineering Properties of Foundation Materials .......................................................................... 4
2.4 Waste Disposal Area Design and Construction Details ............................................................... 6
3. STRUCTURAL STABILITY ASSESSMENT - § 257.73(D)(1)(I)-(VII) .............................................. 8
3.1 Foundations and Abutments - §257.73(d)(1)(i) ............................................................................ 8
3.2 Slope Protection - §257.73(d)(1)(ii) .............................................................................................. 8
3.3 Dikes (Embankment) - §257.73(d)(1)(iii) ...................................................................................... 9
3.4 Vegetated Slopes - §257.73(d)(1)(iv) ........................................................................................... 9
3.5 Spillways - §257.73(d)(1)(v) ......................................................................................................... 9
3.6 Hydraulic Structures - §257.73(d)(1)(vi) ..................................................................................... 11
3.7 Downstream Slopes Adjacent to Water Body - §257.73(d)(1)(vii) ............................................. 11
3.8 Structural Stability Deficiencies - §257.73(d)(2) ......................................................................... 11
4. SAFETY FACTOR ASSESSMENT - § 257.73(E) ......................................................................... 12
4.1 Slope Stability Analysis .............................................................................................................. 12
4.1.1 Cross-Section Analyzed ......................................................................................................... 13
4.1.2 Geotechnical Material Properties ........................................................................................... 13
4.1.3 Seismic analysis..................................................................................................................... 13
4.1.4 Factor of Safety Results ......................................................................................................... 13
4.2 Liquefaction Potential Assessment ............................................................................................ 14
5. CONCLUSIONS AND RECOMMENDATIONS ............................................................................. 15
6. CLOSING ....................................................................................................................................... 16
7. REFERENCES ............................................................................................................................... 17
List of Tables
Table 1 Previous Evaluations Related to Structural Stability Assessment Table 2 Geotechnical Model Material Properties Table 3 Slope Stability Analysis Results Summary Table 4 Hydrology and Hydraulics Analysis Results Table 5 Slope Stability Analysis Results Summary

October 2016 ii Project No. 1651599
2
List of Figures
Figure 1 Site Location Map Figure 2 Site Plan (with CPT Borehole Locations Noted) Figure 3 Waste Disposal Area Figure 4 Typical Cross Section Figure 5 Typical Geotechnical Model at the Waste Disposal Area Embankment
List of Appendices
Appendix A Slope Stability Analysis Results Appendix B Liquefaction Potential Analysis Results
October 2016 1 Project No. 1651599
p:\major clients\nisource-nipsco\1651599 - rcra rule 257.73 structural integrity\200 reports\si and fos\report\final submittal\rmsgs wda si and fos report final 10-5-
16.docx
1. INTRODUCTION
1.1 Purpose
The United States Environmental Protection Agency (EPA) published 40 CFR Part 257 – Coal Combustion
Residuals (CCR) Final Rule (CCR RCRA Rule) in April 2015 to regulate the solid waste management of
CCR generated at electric utilities. The CCR RCRA Rule requires that existing CCR surface impoundments
meeting the requirements of Section 257.73(b) conduct initial and periodic structural stability assessments
in accordance with Section 257.73(d), and safety factor assessments in accordance with Section 257.73(e).
Per rule 257.73(b), this initial stability assessment and factor of safety is required for all CCR units with
either (1), a height of five feet or more and a storage volume of 20 acre-feet or more; or (2) a height of 20
feet or more. At the Northern Indiana Public Service Company (NIPSCO), R.M. Schahfer Generating
Station (RMSGS), the only CCR unit which meets this criteria is the Waste Disposal Area (WDA).
This report provides the initial structural stability assessment and the safety factor assessment for the WDA
surface impoundment at the NIPSCO RMSGS, located in Wheatfield, Indiana, see Figures 1 and 2. A
hazard potential classification was conducted for the WDA pursuant to Section 257.73(a)(2), which resulted
in a high hazard classification thereby requiring the probable maximum flood (PMF) elevation to be used in
structural assessment.
1.2 WDA Background
The WDA was designed by Sargent & Lundy Engineers of Chicago, Illinois in 1982. The WDA is formed
by a ring earth-fill dike with slurry trench core that is approximately 17 feet high and 7,540 feet long
(including the common embankment) with a crest elevation of 681 feet above mean sea level (Marbach,
2011). The WDA was constructed for NIPSCO, put in service in 1982, and has been continuously owned
and operated by NIPSCO.
The WDA accepts sluiced bottom ash and boiler slag CCR and various sump discharges from the
generating station. The sluiced CCR enters the WDA via elevated pipes at the north side and also via
buried pipes located at the northwest corner, the pipes do not penetrate the slurry wall core. Water exits
the WDA via an overflow weir, to the Recycle Basin, or through the auxiliary spillway located at the
northwest side. The overflow weir is located at the southern end of the east side of the WDA. The auxiliary
spillway consisting of two, 24 inch diameter corrugated steel pipes with a concrete down-slope channel
transitioning to a rip-rap lined downstream channel, is located near the northwest corner of the WDA. The
east side of the WDA is common with the west side of the adjacent Recycle Basin. A survey of the WDA
was performed by Marbach, Brady and Weaver, Inc. in December 2011 (Marbach, 2011), see Figure 3.

October 2016 2 Project No. 1651599
p:\major clients\nisource-nipsco\1651599 - rcra rule 257.73 structural integrity\200 reports\si and fos\report\final submittal\rmsgs wda si and fos report final 10-5-
16.docx
1.3 Previous Evaluations
A list of reviewed documents pertinent to the structural stability assessment is provided in Table 1.
Table 1: Previous Evaluations Related to Structural Stability Assessment
Document Date Author
Various construction drawings 1982 Sargent & Lundy Engineers
Assessment of Dam Safety of Coal Combustion Surface Impoundments, NIPSCO, RM Schahfer
Generating Station July 2010 CDM for the EPA
Report on Inspection of The Waste Disposal Area January 2011 Golder Associates Inc.
Final Hazard Classification Review Report – NIPSCO Schahfer Generating Station
January 2011 Golder Associates Inc.
Embankment Elevation Survey, Waste Disposal Area and Recycle Pond, NIPSCO Schahfer Generating
Station
December 2011
Marbach, Brady and Weaver, Inc.
Schahfer Spillway Hydrologic and Hydraulic Evaluation
December 2011
Golder Associates Inc.
Final Geotechnical Investigation and Embankment Stability Analyses
June 2012 Golder Associates Inc.
Report on Inspection of The Waste Disposal Area September
2012 Golder Associates Inc.
Construction in a Floodway Permit Application, NIPSCO R.M. Schahfer Generating Station
November 2012
Golder Associates Inc.
Waste Disposal and Recycle Ponds Hydrographic Survey. NIPSCO R.M. Schahfer Generating Station
December 2012
DLZ Industrial, LLC (DLZ)
Basin Operation, Maintenance and Inspection Plan, NIPSCO R. M. Schahfer Generating Station
February 2013
Golder Associates Inc.
Emergency Action Plan, Final Settling Basin (FSB), Intake Settling Basin (ISB), Waste Disposal Area
(WDA), Recycle Basin (RB), Northern Indiana Public Service Company (NIPSCO), R.M. Schahfer
Generating Station
February 2013
Golder Associates Inc.

October 2016 3 Project No. 1651599
p:\major clients\nisource-nipsco\1651599 - rcra rule 257.73 structural integrity\200 reports\si and fos\report\final submittal\rmsgs wda si and fos report final 10-5-
16.docx
State of Indiana Department of Natural Resources (DNR), Certificate of Approval, After-the-Fact,
Construction in a Floodway April 23, 2013 State of Indiana DNR
Report on Inspection of The Waste Disposal Area April 2014 Golder Associates Inc.
Construction Observation Documentation Report, Surface Water Basin Erosion Repairs, NIPSCO R.M.
Schahfer Generating Station October 2014 Golder Associates Inc.
First Annual RCRA CCR Unit Inspection Report – NIPSCO Schahfer Generating Station
January 2016 Golder Associates Inc.
Hazard Potential Classification Assessment and Visual Inspection Report – RCRA CCR Units, Waste Disposal Area, Drying Area, Material Storage Runoff
Basin, & Metal Cleaning Waste Basin – Surface Impoundments, NIPSCO, R.M. Schahfer Generating
Station
September 2016
Golder Associates Inc.
.

October 2016 4 Project No. 1651599
p:\major clients\nisource-nipsco\1651599 - rcra rule 257.73 structural integrity\200 reports\si and fos\report\final submittal\rmsgs wda si and fos report final 10-5-
16.docx
2. SITE DESCRIPTION
2.1 SUBSURFACE CONDITIONS
Soil borings and laboratory testing programs were completed in 2010, 2011 and 2012 around the WDA to
develop site specific stratigraphy and engineering material properties. Golder performed a geotechnical
investigation of the WDA in 2011 and prepared the 2012 Geotechnical Investigation and Embankment
Stability Analyses report, dated August 27, 2012. Topographically, the area is generally flat to gently rolling
with isolated hills. In the northern and northeastern portions of Jasper County where the WDA is located,
the soil is sandy, and is interspersed with sandy knolls and ridges. The northern part of the county is
covered by Pleistocene aged, alluvial sand overlying shale of Carboniferous age.
The WDA is located in a rural area and is surrounded by farmland, forested areas, and isolated farm
buildings to the south, and by the generating station and other infrastructure to the north. The Recycle
Basin is contiguous to the east. The Drying Area is contiguous to the north.
2.2 Physical Properties of Foundation Materials
Based on the site specific available boring logs (Golder, 2012), the site is underlain by a relatively uniform
deposit of coarse to fine sand with traces of gravel and silt overlying shale bedrock. Locally, there is a
clayey or fine-grained deposit just above the shale bedrock, but this stratum is not evident at all boring
locations.
Based on the available construction drawings (Sargent and Lundy, 1982), the WDA embankment is
constructed of the native sand materials obtained from on-site borrow areas. The embankment footprint
was stripped to a depth of approximately 1 foot below natural grade prior to embankment construction. The
embankment fill placement and compaction was completed prior to construction of the slurry trench, which
is located along the embankment centerline. The slurry trench is approximately 1.5 feet wide, and extends
from 2 feet below the embankment crest down to the shale bedrock. The interior of the WDA is at
approximately original ground surface elevation less the approximate 1 foot strip depth. The WDA’s inlet
and outlet pipes are located above the top of the slurry trench and do not penetrate it.
2.3 Engineering Properties of Foundation Materials
Historic construction drawings and technical specifications suggest that the WDA was constructed with
reasonable and sound construction practices. Select drawings (Sargent and Lundy, 1982) can be attributed
to the WDA, and these drawings indicate reasonable construction configurations, e.g. 3 horizontal to 1
vertical (3H:1V) upstream and downstream side slopes; embankment constructed of controlled compacted
fill; central slurry trench extending down to shale bedrock at depth; inlet and outlet pipes that do not
penetrate the slurry trench; rip-rap with bedding on the upstream slope; reinforced concrete structures at

October 2016 5 Project No. 1651599
p:\major clients\nisource-nipsco\1651599 - rcra rule 257.73 structural integrity\200 reports\si and fos\report\final submittal\rmsgs wda si and fos report final 10-5-
16.docx
the primary and auxiliary spillway, and inlet and outlet pipes; and detailed surface water control around the
structure.
The available historic construction drawings also contain some geotechnical data indicating relatively
uniform embankment foundation conditions at the WDA consisting of coarse to fine sand with traces of
gravel and silt down to shale bedrock at a depth of approximately 40 feet.
The Final 2012 Geotechnical Investigation and Embankment Stability Analyses, prepared by Golder, was
referenced during the file review for the WDA. Based on the 2012 Geotechnical Investigation and
Embankment Stability Analyses (Golder, 2012), cone penetration soundings were conducted in June 2011
at the WDA. Six cone penetration test (CPT) probes (noted at CPT-39 though CPT-44 on Figure 2) were
advanced in and around the WDA. One CPT probe (CPT-38) was advanced in the adjacent Recycle Basin,
which was built at the same time and has the same construction. CPT-38 was deeper than the 6 CPT
probed advanced in the WDA, so CPT-38 was included in this analysis for the WDA. The subsurface
conditions encountered during the June 2011 investigation are reasonably consistent with those
encountered during the previous CPT probing performed at the site, and also with information available
from previous historic geotechnical information at the site. The exploration indicated subsurface conditions
are dense to very dense sand to silty sand from ground surface to the full depth of the exploration.
Laboratory testing was also performed on samples collected during the geotechnical investigation. The
test results indicate a relatively uniform deposit of poorly graded, fine sand with typically less than 10
percent medium sand and less than 10 percent fines. The material is variously classified as a poorly graded
sand with little or no fines (SP); a silty sand or sand silt mixture (SM); or a “SP-SM” which is a borderline
classification used for materials with between 5 percent and 12 percent fines. The measured water contents
ranged from approximately 10 percent to 20 percent. The distribution of water content with depth indicates
with reasonable certainty where the water table is in the field. Laboratory samples consistently showed
lower water contents in the upper portions of holes, and higher water contents in the lower portions.
The geotechnical model for the WDA is dense silty sand (embankment fill) overlying dense silty sand
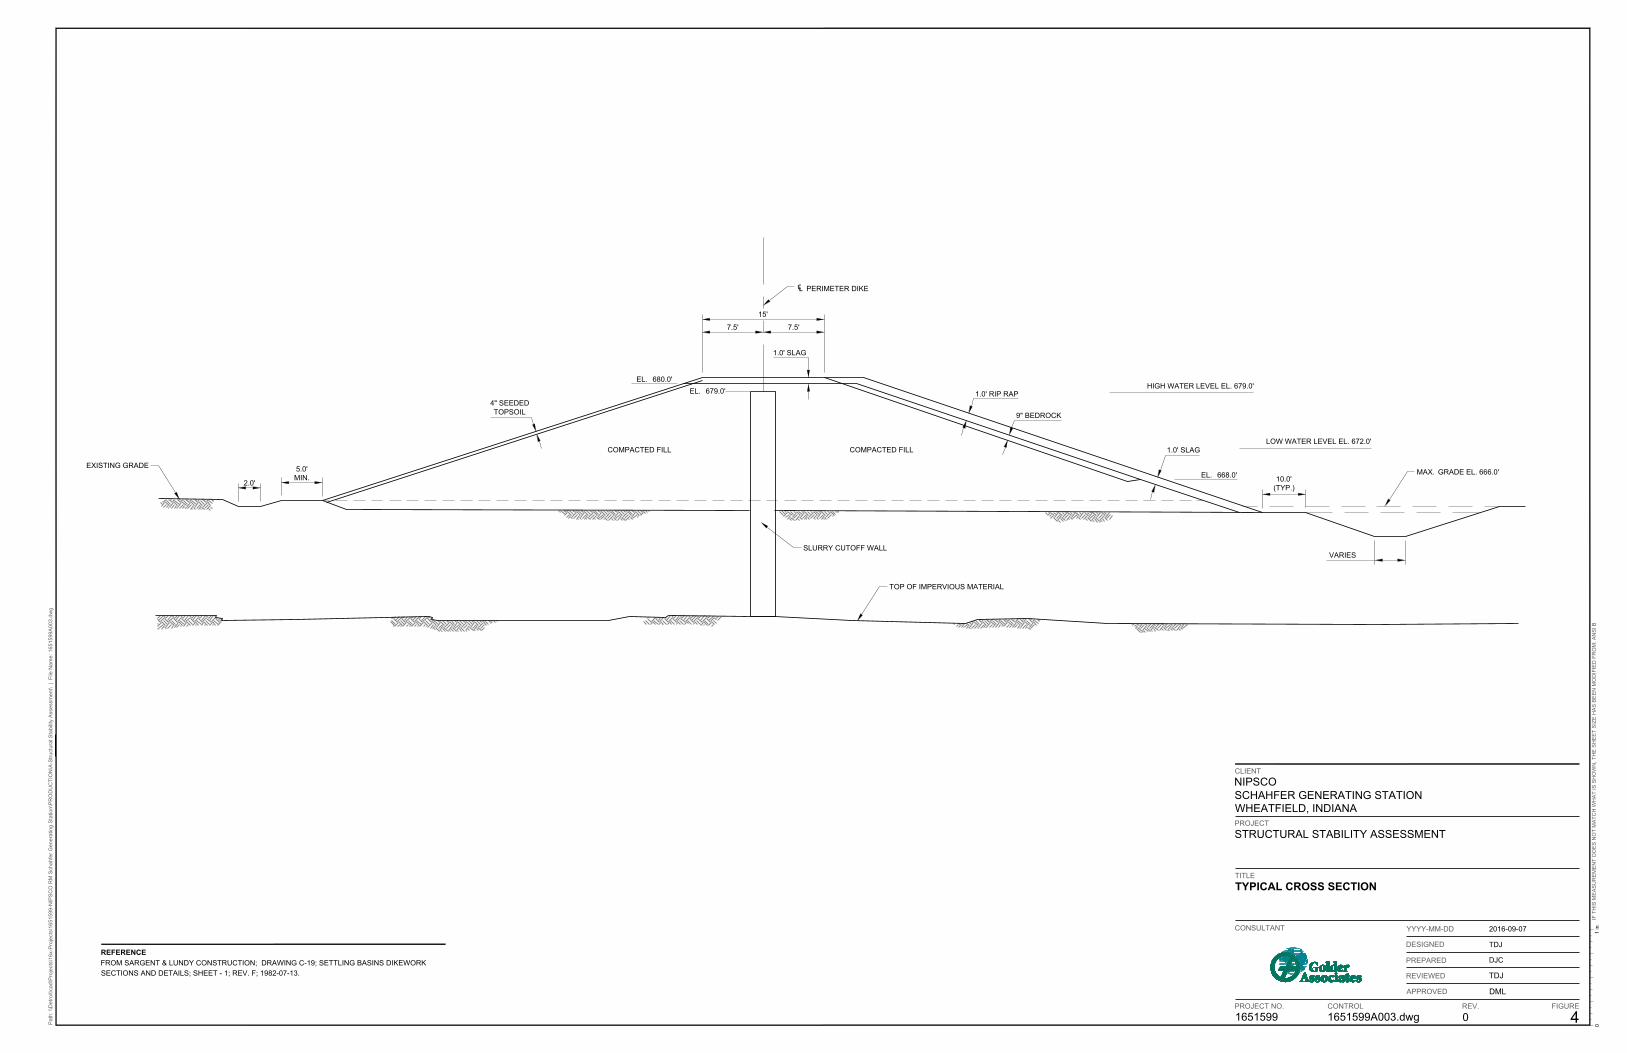
(subgrade). Figure 4, attached, shows the typical designed cross section of the WDA. Figure 5, attached,
shows the geotechnical model for the WDA to be used for the factor of safety analysis. It should be noted
that for the purposes of the factor of safety analysis prepared for the WDA and described in Section 4 of
this report, the designed crest elevation (681 feet above mean sea level (ft MSL)) was used as the highest
elevation found on the WDA, which is a worst case scenario. The surveyed lowest crest elevation (680 ft
MSL, Marbach, 2011) was used in the spillway capacity calculations, because that is a worst case scenario
for the spillway capacity calculations.
October 2016 6 Project No. 1651599
p:\major clients\nisource-nipsco\1651599 - rcra rule 257.73 structural integrity\200 reports\si and fos\report\final submittal\rmsgs wda si and fos report final 10-5-
16.docx
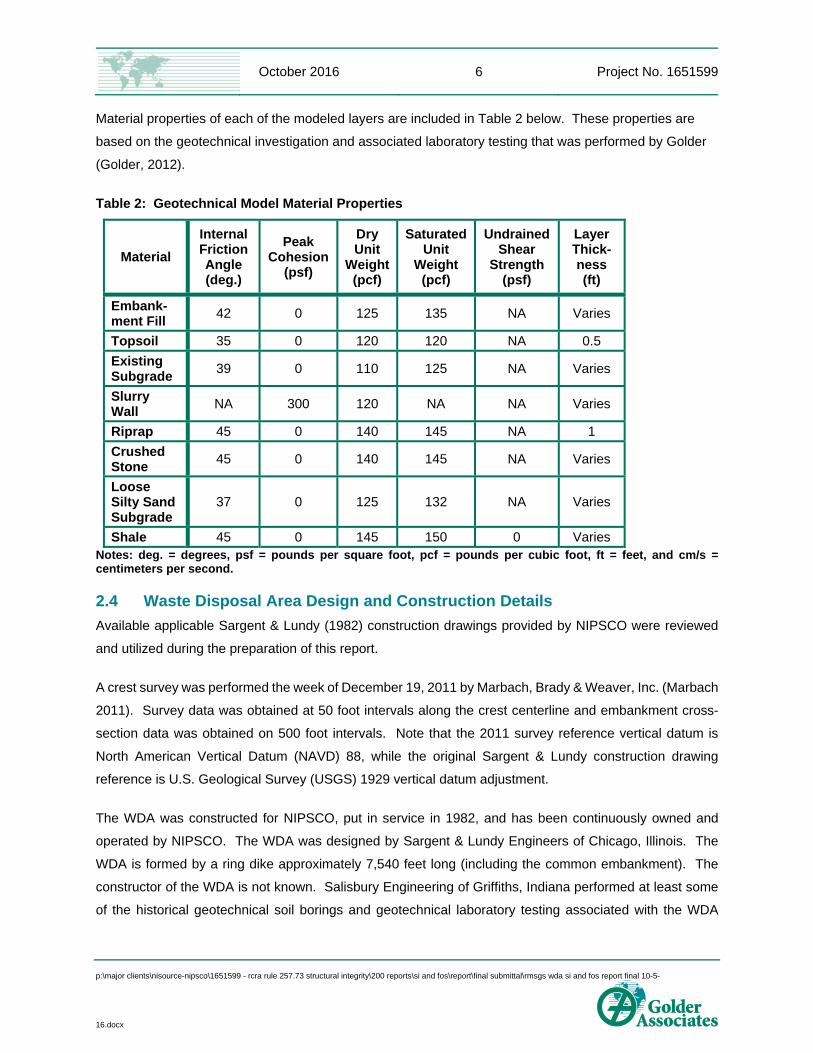
Material properties of each of the modeled layers are included in Table 2 below. These properties are
based on the geotechnical investigation and associated laboratory testing that was performed by Golder
(Golder, 2012).
Table 2: Geotechnical Model Material Properties
Material
Internal Friction Angle (deg.)
Peak Cohesion
(psf)
Dry Unit
Weight (pcf)
Saturated Unit
Weight (pcf)
Undrained Shear
Strength (psf)
Layer Thick-ness (ft)
Embank-ment Fill
42 0 125 135 NA Varies
Topsoil 35 0 120 120 NA 0.5
Existing Subgrade
39 0 110 125 NA Varies
Slurry Wall
NA 300 120 NA NA Varies
Riprap 45 0 140 145 NA 1
Crushed Stone
45 0 140 145 NA Varies
Loose Silty Sand Subgrade
37 0 125 132 NA Varies
Shale 45 0 145 150 0 Varies Notes: deg. = degrees, psf = pounds per square foot, pcf = pounds per cubic foot, ft = feet, and cm/s = centimeters per second.
2.4 Waste Disposal Area Design and Construction Details
Available applicable Sargent & Lundy (1982) construction drawings provided by NIPSCO were reviewed
and utilized during the preparation of this report.
A crest survey was performed the week of December 19, 2011 by Marbach, Brady & Weaver, Inc. (Marbach
2011). Survey data was obtained at 50 foot intervals along the crest centerline and embankment cross-
section data was obtained on 500 foot intervals. Note that the 2011 survey reference vertical datum is
North American Vertical Datum (NAVD) 88, while the original Sargent & Lundy construction drawing
reference is U.S. Geological Survey (USGS) 1929 vertical datum adjustment.
The WDA was constructed for NIPSCO, put in service in 1982, and has been continuously owned and
operated by NIPSCO. The WDA was designed by Sargent & Lundy Engineers of Chicago, Illinois. The
WDA is formed by a ring dike approximately 7,540 feet long (including the common embankment). The
constructor of the WDA is not known. Salisbury Engineering of Griffiths, Indiana performed at least some
of the historical geotechnical soil borings and geotechnical laboratory testing associated with the WDA

October 2016 7 Project No. 1651599
p:\major clients\nisource-nipsco\1651599 - rcra rule 257.73 structural integrity\200 reports\si and fos\report\final submittal\rmsgs wda si and fos report final 10-5-
16.docx
geotechnical investigation and subsurface characterization. An additional geotechnical investigation was
performed by Golder in 2011/2012.
A general description of the WDA is presented in Section 1.2. The location of the WDA relative to the
generating station and surrounding structures is shown on Figures 1 and 2, attached.
SIZE AND PHYSICAL DATA Designed Crest Elevation: 681 ft MSL (USGS 29) based on construction drawings Current Lowest Crest Elevation: 680 ft MSL based on the December 2011 (Marbach, 2011) crest
survey (NAVD 88) Surrounding Ground Elevation: Approximately 664 ft MSL High Water Level: 678.9 ft MSL based on invert elevations of spillway pipes Height: 17 feet Surface Area: 75.5 acres Reservoir Volume: 1,530 acre-feet

October 2016 8 Project No. 1651599
p:\major clients\nisource-nipsco\1651599 - rcra rule 257.73 structural integrity\200 reports\si and fos\report\final submittal\rmsgs wda si and fos report final 10-5-
16.docx
3. STRUCTURAL STABILITY ASSESSMENT - § 257.73(D)(1)(I)-(VII)
The CCR Rule requires an initial and periodic structural stability assessments be conducted by a qualified
professional engineer (QPE) to document whether the design, construction, operation and maintenance is
consistent with recognized and generally accepted good engineering practices for the maximum volume of
CCR and CCR wastewater that can be impounded therein. The following sections provide documentation
on the initial structural stability assessment and rely mainly on the recent and historic annual inspections
performed at the site. The most recent inspection was completed by Golder on June 2, 2016 for the initial
structural stability assessment (Golder, September 2016).
3.1 Foundations and Abutments - §257.73(d)(1)(i)
Based on the available construction drawings (Sargent and Lundy, 1982), the WDA embankment is
constructed of the native sand materials obtained from on-site borrow areas. The embankment footprint
was stripped to a depth of approximately 1 foot below natural grade prior to embankment construction. The
embankment fill placement and compaction was completed prior to construction of the slurry trench, which
is located along the embankment centerline. The slurry trench is approximately 1.5 feet wide, and extends
from 2 feet below the embankment crest down to the shale bedrock. The interior of the WDA is at
approximately original ground surface elevation less the approximate 1 foot strip depth. The WDA’s inlet
and outlet pipes are located above the top of the slurry trench and do not penetrate it.
There has been no indication of foundational or abutment instability or movement in recent or historic site
inspections and; therefore, the foundation soils and abutments are considered stable.
3.2 Slope Protection - §257.73(d)(1)(ii)
The downstream slope of the WDA embankment is protected from erosion and deterioration by the
establishment of a vegetative cover. The vegetative cover is inspected by NIPSCO personnel weekly for
signs of erosion, seepage, animal burrows, sloughing, and plants that could negatively impact the
embankment. The June 2016 inspection did not identify items relating to slope protection that required
investigation or repair and the downstream slopes of the WDA are not subjected to wave or sudden
drawdown effects. To reduce the possible impact of rising water surface elevations, waves, or ice sheets,
upstream shoreline rip-rap protection has been installed along the upstream slope of the dike. Additionally,
the downstream and upstream slopes are inspected weekly for erosion, signs of seepage, animal burrows,
sloughing, and vegetation that could negatively impact the embankment. The 2016 annual inspection report
did not identify any items relating to slope protection that required investigation or repair. The existing slope
protection measures are considered adequate to provide against surface erosion, wave action, and adverse
effects of sudden drawdown.

October 2016 9 Project No. 1651599
p:\major clients\nisource-nipsco\1651599 - rcra rule 257.73 structural integrity\200 reports\si and fos\report\final submittal\rmsgs wda si and fos report final 10-5-
16.docx
3.3 Dikes (Embankment) - §257.73(d)(1)(iii)
Based on the available construction drawings (Sargent and Lundy, 1982), the WDA embankment is
constructed of the native sand materials obtained from on-site borrow areas. The embankment footprint
was stripped to a depth of approximately 1 foot below natural grade prior to embankment construction. The
embankment fill placement and compaction was completed prior to construction of the slurry trench, which
is located along the embankment centerline. The slurry trench is approximately 1.5 feet wide, and extends
from 2 feet below the embankment crest down to the shale bedrock. The interior of the WDA is at
approximately original ground surface elevation less the approximate 1 foot strip depth. The WDA’s inlet
and outlet pipes are located above the top of the slurry trench and do not penetrate it. Based on the relative
density of the material encountered during the investigations, historic inspections, recent observations, and
results of the stability analysis; the embankment dikes are considered sufficient to withstand the range of
loading conditions in the WDA.
3.4 Vegetated Slopes - §257.73(d)(1)(iv)
The EPA has vacated the requirement that vegetative cover on surface impoundment dikes be maintained
at no more than six inches. At the time of the June inspection, the WDA’s downstream slopes were
adequately covered with appropriate vegetation that was well maintained. A new rule establishing
requirements relating to the use of vegetation as slope protection for CCR surface impoundments is still
pending.
3.5 Spillways - §257.73(d)(1)(v)
The principal spillway of the WDA is considered the overflow weir which is hydraulically linked to the
adjacent Recycle Basin. The overflow weir was visually inspected during the June 2016 inspection, and is
generally in good condition where visible. The overflow weir is located at the southeast side of the WDA
where it connects to the Recycle Basin and is constructed of reinforced concrete (based on historical
construction drawing review). Available drawings indicate the outlet conduit is a 36 inch diameter steel pipe
with an energy dissipating reinforced concrete structure at the outlet end. Much of this structure is buried
or was submerged and could not be inspected.
The auxiliary spillway is considered the two 24 inch diameter corrugated metals pipes (CMPs) located at
the northwest side of the WDA, and were observed to be in acceptable condition. The 24 inch diameter
CMPs are located side by side and at the outlet end there is a concrete downslope channel. Below the
concrete downslope channel is a rip-rap lined channel leading to a perimeter ditch. At the time of the June
2016 inspection, the water level in the WDA was observed at approximately 2 feet below the invert of the
inlet ends of the pipes.
October 2016 10 Project No. 1651599
p:\major clients\nisource-nipsco\1651599 - rcra rule 257.73 structural integrity\200 reports\si and fos\report\final submittal\rmsgs wda si and fos report final 10-5-
16.docx
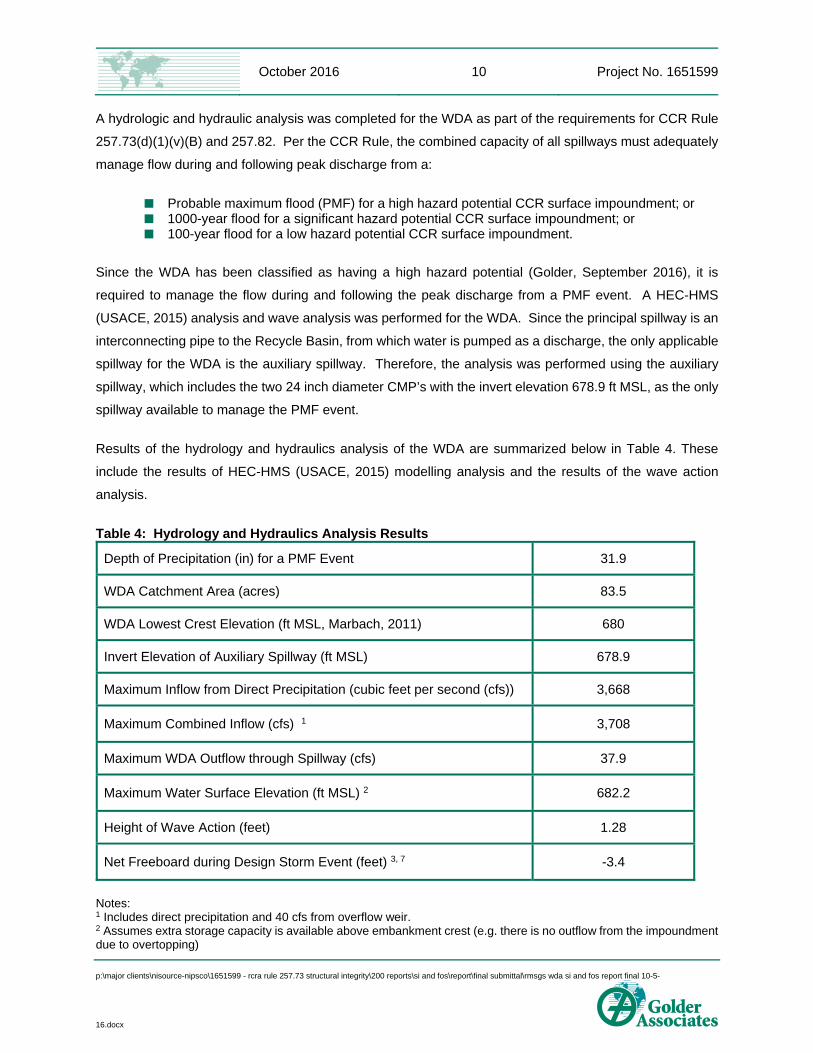
A hydrologic and hydraulic analysis was completed for the WDA as part of the requirements for CCR Rule
257.73(d)(1)(v)(B) and 257.82. Per the CCR Rule, the combined capacity of all spillways must adequately
manage flow during and following peak discharge from a:
Probable maximum flood (PMF) for a high hazard potential CCR surface impoundment; or 1000-year flood for a significant hazard potential CCR surface impoundment; or 100-year flood for a low hazard potential CCR surface impoundment.
Since the WDA has been classified as having a high hazard potential (Golder, September 2016), it is
required to manage the flow during and following the peak discharge from a PMF event. A HEC-HMS
(USACE, 2015) analysis and wave analysis was performed for the WDA. Since the principal spillway is an
interconnecting pipe to the Recycle Basin, from which water is pumped as a discharge, the only applicable
spillway for the WDA is the auxiliary spillway. Therefore, the analysis was performed using the auxiliary
spillway, which includes the two 24 inch diameter CMP’s with the invert elevation 678.9 ft MSL, as the only
spillway available to manage the PMF event.
Results of the hydrology and hydraulics analysis of the WDA are summarized below in Table 4. These
include the results of HEC-HMS (USACE, 2015) modelling analysis and the results of the wave action
analysis.
Table 4: Hydrology and Hydraulics Analysis Results
Depth of Precipitation (in) for a PMF Event 31.9
WDA Catchment Area (acres) 83.5
WDA Lowest Crest Elevation (ft MSL, Marbach, 2011) 680
Invert Elevation of Auxiliary Spillway (ft MSL) 678.9
Maximum Inflow from Direct Precipitation (cubic feet per second (cfs)) 3,668
Maximum Combined Inflow (cfs) 1 3,708
Maximum WDA Outflow through Spillway (cfs) 37.9
Maximum Water Surface Elevation (ft MSL) 2 682.2
Height of Wave Action (feet) 1.28
Net Freeboard during Design Storm Event (feet) 3, 7 -3.4
Notes: 1 Includes direct precipitation and 40 cfs from overflow weir. 2 Assumes extra storage capacity is available above embankment crest (e.g. there is no outflow from the impoundment due to overtopping)
October 2016 11 Project No. 1651599
p:\major clients\nisource-nipsco\1651599 - rcra rule 257.73 structural integrity\200 reports\si and fos\report\final submittal\rmsgs wda si and fos report final 10-5-
16.docx
3 Negative freeboard indicates that the embankment will overtop. 5 All spillway configurations assume 2% longitudinal slope at embankment crest. 6 All spillway cross-sections are trapezoidal. 7 Net freeboard = minimum freeboard required for storm event plus the height of wave action.
As shown in Table 4, the current configuration of the WDA’s auxiliary spillway is not compliant with 40 CFR
257.73(d)(1)(v). It is Golder’s recommendation that NIPSCO explore options to improve the WDA
emergency spillway to satisfy those requirements.
3.6 Hydraulic Structures - §257.73(d)(1)(vi)
Hydraulic structures underlying the base of the CCR unit or passing through the dike of the CCR unit that
maintain structural integrity and are free of significant deterioration, deformation, distortion, bedding
deficiencies, sedimentation, and debris which may negatively affect the operation of the hydraulic structure.
3.7 Downstream Slopes Adjacent to Water Body - §257.73(d)(1)(vii)
The downstream slopes of the WDA are not adjacent to water bodies and therefore rapid-drawdown was
not considered a potential mechanism for structural instability in the exterior slope.
3.8 Structural Stability Deficiencies - §257.73(d)(2)
In accordance with the CCR Rule 257.73(d)(2), the periodic assessment must identify any structural stability
deficiencies associated with the CCR unit in addition to recommending corrective measures. If a deficiency
or a release is identified during the periodic assessment, the owner or operator unit must remedy the
deficiency or release as soon as feasible and prepare documentation detailing the corrective measures
taken.
Based on structural stability assessment contained herein, one structural stability deficiency was identified
as follows:
The auxiliary spillway is not sized to manage the flow produced by a PMF event.
As a result, it is recommended that NIPSCO remedy this deficiency by improving the size of the auxiliary
spillway, operationally controlling the water level in the WDA, or implementing an equivalent engineering or
operational control.

October 2016 12 Project No. 1651599
p:\major clients\nisource-nipsco\1651599 - rcra rule 257.73 structural integrity\200 reports\si and fos\report\final submittal\rmsgs wda si and fos report final 10-5-
16.docx
4. SAFETY FACTOR ASSESSMENT - § 257.73(E)
According to Section 257.73(e)(1) of the CCR RCRA Rule, periodic safety factor assessments must be
conducted for each CCR unit. The safety factor assessment must document the calculated factor of safety
for the dike slopes under the following scenarios:
Maximum Pool Storage - Section 257.73(e)(1)(i) – Defined as the long-term, maximum storage pool (or operating) elevation and equal to the outlet elevation (elevation = 678.9 ft MSL) for this facility; static factor of safety must equal or exceed 1.5
Maximum Pool Surcharge - Section 257.73(e)(1)(ii) – Defined as the temporary raised pond level above the maximum pool storage elevation due to an inflow design flood (681 ft MSL); static factor of safety must equal or exceed 1.4
Seismic Loading Conditions - Section 257.73(e)(1)(iii) – Seismic factor of safety must equal or exceed 1.0
Liquefaction Potential - Section 257.73(e)(1)(iv) – Only necessary for dikes constructed of soils that have susceptibility to liquefaction; factor of safety must equal or exceed 1.2
The following sections provide details on the factor of safety assessment and methods used to calculate
the slope factor of safety and results of the analysis.
4.1 Slope Stability Analysis
Slope stability analyses were performed to evaluate the slope factor of safety for each of the maximum pool
storage, maximum pool surcharge, and seismic loading scenarios. In the Preamble to Sections 257 and
261 of the CCR RCRA Rule General Safety Factor Assessment Considerations [VI (E)(3)(b)(ii)(a)], limit
equilibrium methods are identified as conventional analysis procedures for calculating the factor of safety
and specific common methods are identified, including the Spencer and Janbu method of slices (Abramson
et al. 2002), which was used for this stability analysis.
The specific analysis types are:
Steady state seepage, Maximum Pool Storage (257.73 (e)(1)(i)), downstream slope
Steady state seepage, Maximum Pool Surcharge (257.73 (e)(1)(ii)), downstream slope
Seismic (pseudo-static) with Maximum Pool Storage, steady state seepage, (257.73(e)(1)(iii)),
downstream slope
The steady state analyses were performed with the fully developed phreatic surface as indicated by the site
geotechnical investigation and as extrapolated based on inferred subsurface conditions. This phreatic
surface begins at the upstream water level, extends horizontally to the upstream side of the slurry wall, then
extends downward at a steep angle through the slurry wall to near the elevation where the groundwater
level was encountered in exploratory holes in the downstream side of the embankment. The inferred

October 2016 13 Project No. 1651599
p:\major clients\nisource-nipsco\1651599 - rcra rule 257.73 structural integrity\200 reports\si and fos\report\final submittal\rmsgs wda si and fos report final 10-5-
16.docx
piezometric levels in each model are illustrated in Appendix A. Drained shear strength parameters were
used in all of the slope stability analyses for all of the material types except the slurry wall.
4.1.1 Cross-Section Analyzed
The critical section of the exterior dike was determined by using the existing topography (2011), and
considering the interpreted soil profile from the subsurface investigations, and phreatic surface. The critical
cross section is the cross section anticipated to be the most susceptible of all cross sections to structural
failure based on appropriate engineering considerations, including loading conditions.
The critical section used for the slope stability analysis is shown on Figure 4.
4.1.2 Geotechnical Material Properties
Based on the subsurface investigations and laboratory testing, representative material properties were
selected for use in the stability analysis. These properties are included in Table 2 - Geotechnical Model
Material Properties.
4.1.3 Seismic analysis
A pseudo static seismic analysis was performed on the downstream slope of the WDA. The analyses were
performed with the same steady state, fully developed phreatic surface in the embankments as was used
in the initial two cases analyzed for the WDA. The ground acceleration used in the seismic analysis was
0.1472g, which is the Maximum Considered Earthquake (MCE) ground motion of 0.2 second spectral
response, or the 2 percent exceedance in 50 years. The value of the acceleration was obtained from the
United States Geologic Survey (USGS) online seismic hazard tool, which provides such information for any
location in the United States. The zip code for the RMSGS was used as the location of the site. Contour
intervals of this same seismic acceleration are included in Appendix D of the US Army Corps of Engineers
(USCOE) publication number: ER 1110-2-1806 titled Engineering and Design – Earthquake Design and
Evaluation for Civil Works Projects. This contour map, which illustrates the seismic acceleration contours
for the 0.2 sec spectral response and 2 percent probability of exceedance in 50 years is also included in
Appendix A of this report. This map shows how the area of northwest Indiana is a relatively low hazard
area from the view point of seismic risk. The RMSGS is in Risk Zone 1 in the ASCE seismic risk
categorization which is also illustrated in the USACOE publication referenced above. This is the second
lowest category in a five category system. This ASCE seismic risk map is also included in Appendix A.
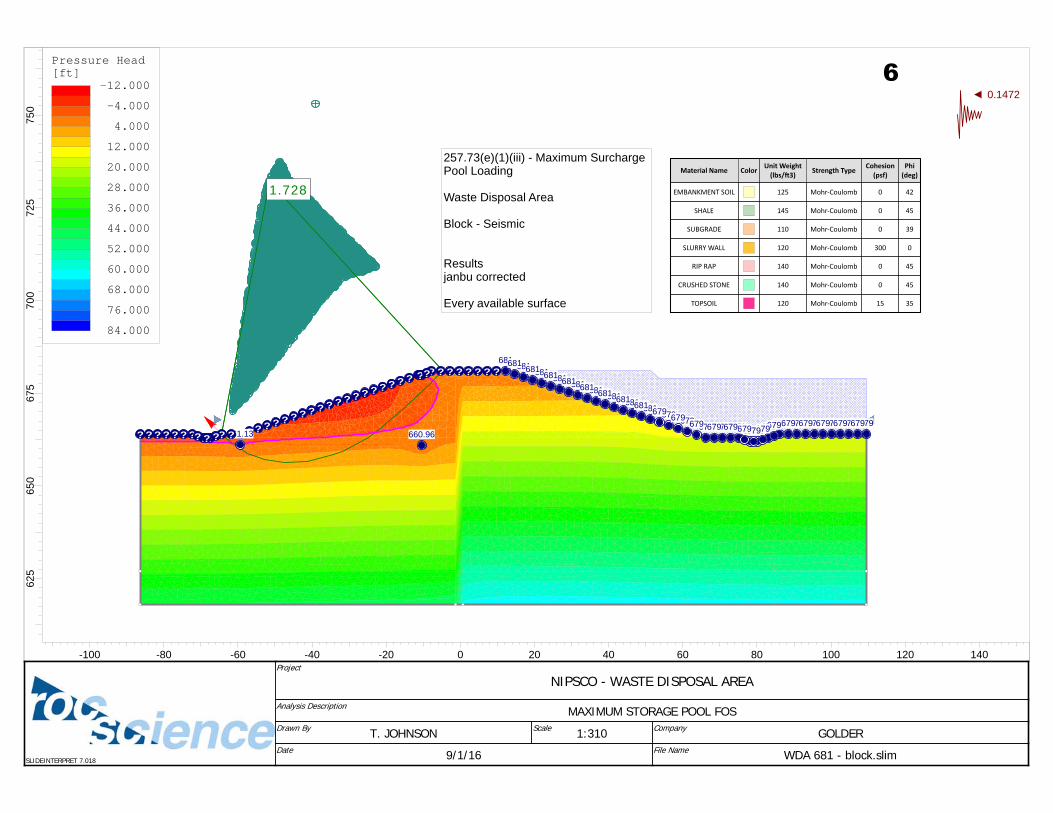
4.1.4 Factor of Safety Results
As previously indicated, analyses were performed for the loading cases on the representative cross section
for the WDA. Analyses were performed with both circular and planar (block) analyses. The search method
of analysis was used, and several thousand trial surfaces for each case and each model were evaluated
by the program.

October 2016 14 Project No. 1651599
p:\major clients\nisource-nipsco\1651599 - rcra rule 257.73 structural integrity\200 reports\si and fos\report\final submittal\rmsgs wda si and fos report final 10-5-
16.docx
The results of the analyses indicate the embankment for the WDA has adequate factors of safety given the
strength parameters used and the conditions analyzed.
A summary of the lowest factors of safety for each case analyzed for the WDA is included in Table 5 below.
Table 5: Slope Stability Analysis Results Summary
Waste Disposal Area
Case Pool Elevation Factor of Safety
1 - Steady Sate, Maximum Storage Pool Block - 257.73(e)(1)(i)
679 ft MSL 2.6
2 - Steady Sate, Maximum Storage Pool Block Seismic - 257.73(e)(1)(iii)
679 ft MSL 1.8
3 - Steady Sate, Maximum Storage Pool Rotational - 257.73(e)(1)(i)
679 ft MSL 2.7
4 - Steady Sate, Maximum Storage Pool Rotational Seismic - 257.73(e)(1)(iii)
679 ft MSL 1.8
5 - Steady State, Maximum Surcharge Pool Block - 257.73(e)(1)(ii)
681 ft MSL 2.6
6 - Steady State, Maximum Surcharge Pool Block Seismic - 257.73(e)(1)(iii)
681 ft MSL 1.7
7 - Steady State, Maximum Surcharge Pool Rotational - 257.73(e)(1)(ii)
681 ft MSL 2.8
8 - Steady State, Maximum Surcharge Pool Rotational Seismic - 257.73(e)(1)(iii)
681 ft MSL 1.8
Models from the slope stability analyses are included in Appendix A.
4.2 Liquefaction Potential Assessment
Embankment and foundation soils were screened for seismically-induced liquefaction susceptibility using
methods recommended by the National Center for Earthquake Research (NCEER), which uses CPT data
(Youd et al. 2001; Robertson and Wride 1998). The calculated factor of safety against seismically-induced
liquefaction is shown in Appendix B and was calculated to be greater than 1.2 throughout the depth of the
embankments and underlying foundation in the evaluated CPT soundings (Golder, 2012) for the considered
earthquake loading, see Figure 2. These screening-level results indicate that the embankments and
foundation soils for the WDA are not susceptible to seismically-induced liquefaction for the seismic loading
considered.
October 2016 15 Project No. 1651599
p:\major clients\nisource-nipsco\1651599 - rcra rule 257.73 structural integrity\200 reports\si and fos\report\final submittal\rmsgs wda si and fos report final 10-5-
16.docx
5. CONCLUSIONS AND RECOMMENDATIONS
Based on our review of the information provided by NIPSCO, onsite observations, and the results of the
structural stability assessment, one structural stability deficiency was identified in the WDA surface
impoundment during this assessment. As a result, it is recommended that NIPSCO remedy the deficiency
by improving the size of the auxiliary spillway, operationally controlling the water level in the WDA, or
implementing an equivalent engineering or operational control.
Based on this same information and on our analyses, the calculated factor of safety through the critical
cross section in the WDA surface impoundment meets or exceeds the minimum values listed in
§257.73(e)(1)(i)-(iv).


October 2016 17 Project No. 1651599
p:\major clients\nisource-nipsco\1651599 - rcra rule 257.73 structural integrity\200 reports\si and fos\report\final submittal\rmsgs wda si and fos report final 10-5-
16.docx
7. REFERENCES
AASHTO, 2012. American Association of State Highway and Transportation Officials, Load Resistant Factor Design (LFRD) Bridge Design Specifications, 2012.
Abramson, L.W., T.S. Lee, S. Sharma, and G.M. Boyce (2002), Slope Stability and Stabilization Methods, 2nd edition, John Wiley & Sons, New York.
Chow, Ven T., 1959. Open-Channel Hydraulics. McGraw-Hill Publishing Company. New York.
DLZ Industrial, LLC (DLZ), 2012. Waste Disposal and Recycle Ponds Hydrographic Survey. NIPSCO R.M. Schahfer generating Station. December.
Federal highway Administration (FHWA), 2016. HY-8 Software, version 7.50. July, 2016.
Indiana State Department of Natural Resources (DNR), 2001. General Guidelines for New Dams and Improvements to Existing Dams in Indiana. January.
Marbach, Brady & Weaver, Inc (Marbach), 2011. Embankment Elevation Survey Waste Disposal Area & Recycle Pond; NIPSCO Schahfer Generating Station. December.
Natural Resource Conservation Service (NRCS), 2016. Type II Temporal Rainfall Distribution, accessed from http://www.nrcs.usda.gov/wps/portal/nrcs/detailfull/national/water/?cid=stelprdb1044959 on September 2, 2016.
Robertson, R. and Wride, C. 1998. Evaluating Cyclic Liquefaction Potential Using the Cone Penetration Test, Canadian Geotechnical Journal, vol. 35, pp. 442-459.
Sargent and Lundy Engineers of Chicago (Sargent and Lundy), 1982. Construction Drawings for the Rollin M. Schahfer Gen. Sta. Units 17&19; No. Indiana Public Service Co., Wheatfield, Indiana. January.
U.S. Army Corps of Engineers (USACE), 1997. EM 1110-2-1420, Hydrologic Engineering Requirements for Reservoirs. October.
U.S. Army Corps of Engineers (USACE), 2003. ERDC/CHL CHETN-III-68, Estimating Irregular Wave Run-up on Smooth, Impermeable Slopes. September.
U.S. Army Corps of Engineers (USACE), 2005. ERDC/CHL CHETN-III-70, Estimating Irregular Wave Run-up on Rough, Impermeable Slopes. July.
U.S. Army Corps of Engineers (USACE), 2008. EM 1110-2-1100, Coastal Engineering Manual. April.
U.S. Army Corps of Engineers (USACE), 2015. Hydrologic Modeling System (HEC-HMS), Version 4.1. Institute For Water Resources, Hydrologic Engineering Center. July.
Youd, T., and Idriss, I., 2001. Liquefaction Resistance of Soils: Summary Report from the 1996 NCEER and 1998 NCEER/NSF Workshops on Evaluation of Liquefaction Resistance of Soils, Journal of Geotechnical and Geoenvironmental Engineering, April 2001, pp. 297-313.

FIGURES

SITE LOCATION
Copyright:© 2013 National Geographic Society, i-cubed
PROJECTSTRUCTURAL STABILITY ASSESSMENT
TITLESITE LOCATION MAP
1651599 0 1
DJC
1 in
0
Path: H:\16x-Projects\1651599-NIPSCO RM Schahfer Generating Station\figures\A-\1651599A000-GIS.mxd
IF TH
IS M
EASU
REME
NT D
OES
NOT M
ATCH
WHA
T IS
SHOW
N, TH
E SH
EET H
AS B
EEN
MODI
FIED
FROM
: ANS
I A
CONSULTANT
PROJECT No. CONTROL Rev. FIGURE
YYYY-MM-DDPREPAREDDESIGNREVIEWAPPROVED
_̂
_̂
§̈¦65
£¤24
£¤421
£¤231£¤41
£¤52£¤24£¤231£¤41
£¤41
UV16
UV114UV55
UV14
UV10
UV39
UV49
UV2
UV555
UV43
UV110
UV119
UV143
UV555
UV55
UV10
UV14UV10
UV10UV39
0 1000 2000Feet
2016-09-07
CLIENT
JASPERCOUNTY
I N D I A N AI N D I A N A
TDJ
NIPSCOSCHAHFER GENERATING STATIONWHEATFIELD, INDIANA
1651599A000-GIS.mxd
TDJ
DML

01
in
1651599CONTROL1651599A001.dwg
FIGURE
20
2016-09-07
DJC
TDJ
STRUCTURAL STABILITY ASSESSMENT
NIPSCOSCHAHFER GENERATING STATIONWHEATFIELD, INDIANA
SITE PLANTITLE
PROJECT NO. REV.
PROJECT
CLIENT
IF T
HIS
MEA
SUR
EMEN
T D
OES
NO
T M
ATC
H W
HAT
IS S
HO
WN
, TH
E SH
EET
SIZE
HAS
BEE
N M
OD
IFIE
D F
RO
M: A
NSI
B
CONSULTANT
PREPARED
DESIGNED
REVIEWED
APPROVED
YYYY-MM-DD
Path
: ----
| F
ile N
ame:
165
1599
A001
.dw
g
0
FEET
100 200
1'' = 200'
REFERENCE
BASE MAP TAKEN FROM MARBACH, BRADY & WEAVER ENGINEERING & SURVEYING;EMBANKMENT ELEVATION SURVEY; DRAWING NO. A-31565; FILE NO. 0221-2011.DWG; DATED2011-12-30; DELIVERED IN .DWG FORMAT
FINALSETTLING
BASIN
INTAKESETTLING
BASIN
WASTEDISPOSAL
AREA
RECYCLEBASIN
TRANSFORMERAREA
GENERATINGUNITS
RETIREDWASTE
DISPOSALAREA
RETIRED WASTEDISPOSAL
AREA
LEGEND
APPROXIMATE PROPERTY BOUNDARY
RAILROAD TRACKS
2011 / 2012 GEOTECHNICAL INVESTIGATION CPT BOREHOLE LOCATIONCPT-XX
TDJ
DML

BP = 10+00.00
EP = 79+65.98
PC = 14+72.67
PC = 20+55.76
PC = 41+87.21
PC = 45+72.05
PT = 16+42.24
PT = 31+83.34
PT = 44+55.36
681.9681.6
665.1
680.3680.2
665.6
680.5680.2
665.7
680.4680.2
666.5
680.6680.2665.7
680.4680.1
666.8 680.3679.9
665.6 680.8680.4666.1
10+0
011
+00
12+0
013
+00
14+0
015
+00
16+0
017
+00
18+0
019
+00
20+0
021
+00
22+0
023
+00
24+0
025
+00
26+0
027
+00
28+0
0
28+39.99
WASTE DISPOSAL AREA
680.6
678.8680.3
680.5678.5
BP = 10+00.00
EP = 28+39.99
680.6
678.8680.4
680.7678.4
680.7
678.9680.4
680.7678.4
678.8680.5
678.7680.6
678.9680.6
678.7680.4
678.8680.5 678.7
681.0
678.6681.9
678.7680.3
79+65.98
10+0
0
11+0
0
12+0
0
13+0
0
14+0
0
15+0
0
16+0
017
+00
18+0
019
+00
20+0
0
21+0022+00
23+0024+00
25+0026+00
27+0028+00
29+0030+00 31+00 32+00 33+00 34+00 35+00 36+00 37+00 38+00 39+00 40+00 41+00 42+00 43+00 44+00 45+00 46+00 47+00 48+00
79+00
ALIGNMENT"WDA RECYCLE"
BEGINS
ALIGNMENT"WDA RECYCLE"
ENDS
ALIGNMENT"EMBANKMENT"
ENDS
ALIGNMENT"EMBANKMENT"
BEGINS
LINE "EMBANKMENT"
LINE "WDA RECYCLE"
LOCATION OF SPILLWAY(TWO 24 INCH DIAMETER CMPs
TYPICAL SLOPE STABILITYCROSS-SECTION
WEIR LOCATION(CONNECTION TORECYCLE BASIN)
01
in
1651599CONTROL1651599A002.dwg
FIGURE
30
2016-09-07
DJC
TDJ
STRUCTURAL STABILITY ASSESSMENT
NIPSCOSCHAHFER GENERATING STATIONWHEATFIELD, INDIANA
WASTE DISPOSAL AREATITLE
PROJECT NO. REV.
PROJECT
CLIENT
IF T
HIS
MEA
SUR
EMEN
T D
OES
NO
T M
ATC
H W
HAT
IS S
HO
WN
, TH
E SH
EET
SIZE
HAS
BEE
N M
OD
IFIE
D F
RO
M: A
NSI
B
CONSULTANT
PREPARED
DESIGNED
REVIEWED
APPROVED
YYYY-MM-DD
Path
: \\D
etro
it\ca
d\Pr
ojec
ts\1
6x-P
roje
cts\
1651
599-
NIP
SCO
RM
Sch
ahfe
r Gen
erat
ing
Stat
ion\
PRO
DU
CTI
ON
\A-S
truct
ural
Sta
bilit
y As
sess
men
t\ |
File
Nam
e: 1
6515
99A0
02.d
wg
0
FEET
100 200
1'' = 200'
REFERENCE(S)
BASE MAP TAKEN FROM MARBACH, BRADY & WEAVER ENGINEERING & SURVEYING;EMBANKMENT ELEVATION SURVEY; DRAWING NO. A-31565; FILE NO. 0221-2011.DWG; DATED2011-12-30; DELIVERED IN .DWG FORMAT
TDJ
DML
01
in
1651599CONTROL1651599A003.dwg
FIGURE
40
2016-09-07
DJC
TDJ
STRUCTURAL STABILITY ASSESSMENT
NIPSCOSCHAHFER GENERATING STATIONWHEATFIELD, INDIANA
TYPICAL CROSS SECTIONTITLE
PROJECT NO. REV.
PROJECT
CLIENT
IF T
HIS
MEA
SUR
EMEN
T D
OES
NO
T M
ATC
H W
HAT
IS S
HO
WN
, TH
E SH
EET
SIZE
HAS
BEE
N M
OD
IFIE
D F
RO
M: A
NSI
B
CONSULTANT
PREPARED
DESIGNED
REVIEWED
APPROVED
YYYY-MM-DD
Path
: \\D
etro
it\ca
d\Pr
ojec
ts\1
6x-P
roje
cts\
1651
599-
NIP
SCO
RM
Sch
ahfe
r Gen
erat
ing
Stat
ion\
PRO
DU
CTI
ON
\A-S
truct
ural
Sta
bilit
y As
sess
men
t\ |
File
Nam
e: 1
6515
99A0
03.d
wg
REFERENCE
FROM SARGENT & LUNDY CONSTRUCTION; DRAWING C-19; SETTLING BASINS DIKEWORKSECTIONS AND DETAILS; SHEET - 1; REV. F; 1982-07-13.
TOP OF IMPERVIOUS MATERIAL
℄ PERIMETER DIKE
SLURRY CUTOFF WALL
EXISTING GRADE
COMPACTED FILLCOMPACTED FILL
4" SEEDEDTOPSOIL
15'
7.5' 7.5'
9" BEDROCK
1.0' RIP RAP
1.0' SLAG
1.0' SLAG
VARIES
10.0'(TYP.)
EL. 668.0'
LOW WATER LEVEL EL. 672.0'
HIGH WATER LEVEL EL. 679.0'
MAX. GRADE EL. 666.0'5.0'MIN.
2.0'
EL. 680.0'EL. 679.0'
TDJ
DML

01 in
1651599
CONTROL
1651599A003.dwg
FIGURE
5
0
2016-09-07
TDJ
TDJ
STRUCTURAL STABILITY ASSESSMENT
NIPSCO
SCHAHFER GENERATING STATION
WHEATFIELD, INDIANA
TYPICAL GEOTECHNICAL MODEL AT THE WASTE DISPOSAL AREA
EMBANKMENT (NOT TO SCALE)
TITLE
PROJECT NO. REV.
PROJECT
CLIENT
IF
T
HIS
M
EA
SU
RE
ME
NT
D
OE
S N
OT
M
AT
CH
W
HA
T IS
S
HO
WN
, T
HE
S
HE
ET
S
IZ
E H
AS
B
EE
N M
OD
IF
IE
D F
RO
M: A
NS
I B
CONSULTANT
PREPARED
DESIGNED
REVIEWED
APPROVED
YYYY-MM-DD
Path: ---- | F
ile N
am
e: 1651599A
003.dw
g
REFERENCE
FROM SARGENT & LUNDY CONSTRUCTION; DRAWING C-19; SETTLING BASINS DIKEWORK
SECTIONS AND DETAILS; SHEET - 1; REV. F; 1982-07-13. TDJ
DML

APPENDIX A SLOPE STABILITY ANALYSIS RESULTS


2.6242.6242.6242.624
679 679 679 679 679 679 679 679 679 679 679 679 679
679 679
679 679
679 679
679 679
679 679
??????????????????????? ? ? ? ? ? ? ? ? ? ?? ? ? ? 679
679 679
679 679
679 679
679 679 679 679 679 679 679 679 679 679 679 679 679
661.13??????? 660.96
?? 679
679
257.73(e)(1)(i) - Maximum Storage Pool Waste Disposal Area
Block Analysis - No Seismic
Resultsjanbu corrected
2.624
Material Name Color Unit Weight(lbs/ 3) Strength Type Cohesion
(psf)Phi(deg)
EMBANKMENT SOIL 125 Mohr‐Coulomb 0 42
SHALE 145 Mohr‐Coulomb 0 45
SUBGRADE 110 Mohr‐Coulomb 0 39
SLURRY WALL 120 Mohr‐Coulomb 300 0
RIP RAP 140 Mohr‐Coulomb 0 45
CRUSHED STONE 140 Mohr‐Coulomb 0 45
TOPSOIL 120 Mohr‐Coulomb 15 35
Pressure Head[ft]
-12.000
-4.000
4.000
12.000
20.000
28.000
36.000
44.000
52.000
60.000
68.000
76.000
84.000
775
750
725
700
675
650
625
-175 -150 -125 -100 -75 -50 -25 0 25 50 75 100
Analysis Description MAXIMUM STORAGE POOL FOSCompany GOLDERScale 1:350Drawn By T. JOHNSONFile Name WDA 679.sliDate 9/1/16
Project
NIPSCO - WASTE DISPOSAL AREA
SLIDEINTERPRET 7.018
1

1.7551.7551.7551.755
679 679 679 679 679 679 679 679 679 679 679 679 679
679 679
679 679
679 679
679 679
679 679
??????????????????????? ? ? ? ? ? ? ? ? ? ?? ? ? ? 679
679 679
679 679
679 679
679 679 679 679 679 679 679 679 679 679 679 679 679
661.13??????? 660.96
?? 679
679
257.73(e)(1)(iii) - Maximum Storage PoolWaste Disposal Area
Block Analysis - Seismic
Resultsjanbu corrected
1.755
Material Name Color Unit Weight(lbs/ 3) Strength Type Cohesion
(psf)Phi(deg)
EMBANKMENT SOIL 125 Mohr‐Coulomb 0 42
SHALE 145 Mohr‐Coulomb 0 45
SUBGRADE 110 Mohr‐Coulomb 0 39
SLURRY WALL 120 Mohr‐Coulomb 300 0
RIP RAP 140 Mohr‐Coulomb 0 45
CRUSHED STONE 140 Mohr‐Coulomb 0 45
TOPSOIL 120 Mohr‐Coulomb 15 35
0.1472
Pressure Head[ft]
-12.000
-4.000
4.000
12.000
20.000
28.000
36.000
44.000
52.000
60.000
68.000
76.000
84.000
775
750
725
700
675
650
625
-150 -125 -100 -75 -50 -25 0 25 50 75 100 125
Analysis Description MAXIMUM STORAGE POOL FOSCompany GOLDERScale 1:350Drawn By T. JOHNSONFile Name WDA 679.sliDate 9/1/16
Project
NIPSCO - WASTE DISPOSAL AREA
SLIDEINTERPRET 7.018
2

2.7392.7392.7392.739
679 679 679 679 679 679 679 679 679 679 679 679 679
679 679
679 679
679 679
679 679
679 679
??????????????????????? ? ? ? ? ? ? ? ? ? ?? ? ? ? 679
679 679
679 679
679 679
679 679 679 679 679 679 679 679 679 679 679 679 679
661.13??????? 660.96
?? 679
679
257.73(e)(1)(i) - Maximum Pool StorageWaste Disposal Area
Rotational Analysis - No Seismic
Resultsjanbu corrected
2.739
Material Name Color Unit Weight(lbs/ 3) Strength Type Cohesion
(psf)Phi(deg)
EMBANKMENT SOIL 125 Mohr‐Coulomb 0 42
SHALE 145 Mohr‐Coulomb 0 45
SUBGRADE 110 Mohr‐Coulomb 0 39
SLURRY WALL 120 Mohr‐Coulomb 300 0
RIP RAP 140 Mohr‐Coulomb 0 45
CRUSHED STONE 140 Mohr‐Coulomb 0 45
TOPSOIL 120 Mohr‐Coulomb 15 35
Safety Factor0.000
0.500
1.000
1.500
2.000
2.500
3.000
3.500
4.000
4.500
5.000
5.500
6.000+
Pressure Head[ft]
-12.000
-4.000
4.000
12.000
20.000
28.000
36.000
44.000
52.000
60.000
68.000
76.000
84.000
775
750
725
700
675
650
625
-125 -100 -75 -50 -25 0 25 50 75 100 125 150
Analysis Description MAXIMUM STORAGE POOL FOSCompany GOLDERScale 1:350Drawn By T. JOHNSONFile Name WDA 679 - ROT.slimDate 9/1/16
Project
NIPSCO - WASTE DISPOSAL AREA
SLIDEINTERPRET 7.018
3

1.8111.8111.8111.811
679 679 679 679 679 679 679 679 679 679 679 679 679
679 679
679 679
679 679
679 679
679 679
??????????????????????? ? ? ? ? ? ? ? ? ? ?? ? ? ? 679
679 679
679 679
679 679
679 679 679 679 679 679 679 679 679 679 679 679 679
661.13??????? 660.96
?? 679
679
257.73(e)(1)(iii) - Maximum Pool StorageWaste Disposal Area
Rotational Analysis - Seismic
Resultsjanbu corrected
1.811
Material Name Color Unit Weight(lbs/ 3) Strength Type Cohesion
(psf)Phi(deg)
EMBANKMENT SOIL 125 Mohr‐Coulomb 0 42
SHALE 145 Mohr‐Coulomb 0 45
SUBGRADE 110 Mohr‐Coulomb 0 39
SLURRY WALL 120 Mohr‐Coulomb 300 0
RIP RAP 140 Mohr‐Coulomb 0 45
CRUSHED STONE 140 Mohr‐Coulomb 0 45
TOPSOIL 120 Mohr‐Coulomb 15 35
0.1472
Safety Factor0.000
0.500
1.000
1.500
2.000
2.500
3.000
3.500
4.000
4.500
5.000
5.500
6.000+
Pressure Head[ft]
-12.000
-4.000
4.000
12.000
20.000
28.000
36.000
44.000
52.000
60.000
68.000
76.000
84.000
775
750
725
700
675
650
625
-125 -100 -75 -50 -25 0 25 50 75 100 125 150
Analysis Description MAXIMUM STORAGE POOL FOSCompany GOLDERScale 1:350Drawn By T. JOHNSONFile Name WDA 679 - ROT.slimDate 9/1/16
Project
NIPSCO - WASTE DISPOSAL AREA
SLIDEINTERPRET 7.018
4

2.5892.5892.5892.589
679 679 679 679 679 679 679 679 679 679 679 679 679
679 681
681 681
681 681
681 681
681 681
???????
??
??
??
??
???????? ??
??
??
??
??
? ? ? ? 681 681
681 681
681 681
679 679
679 679 679 679 679 679 679 679 679 679 679 679 661.13??????? 660.96
?? 681
681
257.73(e)(1)(ii) - Maximum Surcharge Pool Loading
Waste Disposal Area
Block - No Seismic
Resultsjanbu corrected
Every available surface
Material Name Color Unit Weight(lbs/ 3) Strength Type Cohesion
(psf)Phi(deg)
EMBANKMENT SOIL 125 Mohr‐Coulomb 0 42
SHALE 145 Mohr‐Coulomb 0 45
SUBGRADE 110 Mohr‐Coulomb 0 39
SLURRY WALL 120 Mohr‐Coulomb 300 0
RIP RAP 140 Mohr‐Coulomb 0 45
CRUSHED STONE 140 Mohr‐Coulomb 0 45
TOPSOIL 120 Mohr‐Coulomb 15 35
Pressure Head[ft]
-12.000
-4.000
4.000
12.000
20.000
28.000
36.000
44.000
52.000
60.000
68.000
76.000
84.000
750
725
700
675
650
625
600
-100 -80 -60 -40 -20 0 20 40 60 80 100 120
Analysis Description MAXIMUM STORAGE POOL FOSCompany GOLDERScale 1:300Drawn By T. JOHNSONFile Name WDA 681 - block.slimDate 9/1/16
Project
NIPSCO - WASTE DISPOSAL AREA
SLIDEINTERPRET 7.018
5
1.7281.7281.7281.728
679 679 679 679 679 679 679 679 679 679 679 679 679
679 681
681 681
681 681
681 681
681 681
???????
??
??
??
??
???????? ??
??
??
??
??
? ? ? ? 681 681
681 681
681 681
679 679
679 679 679 679 679 679 679 679 679 679 679 679 661.13??????? 660.96
?? 681
681
257.73(e)(1)(iii) - Maximum Surcharge Pool Loading
Waste Disposal Area
Block - Seismic
Resultsjanbu corrected
Every available surface
Material Name Color Unit Weight(lbs/ 3) Strength Type Cohesion
(psf)Phi(deg)
EMBANKMENT SOIL 125 Mohr‐Coulomb 0 42
SHALE 145 Mohr‐Coulomb 0 45
SUBGRADE 110 Mohr‐Coulomb 0 39
SLURRY WALL 120 Mohr‐Coulomb 300 0
RIP RAP 140 Mohr‐Coulomb 0 45
CRUSHED STONE 140 Mohr‐Coulomb 0 45
TOPSOIL 120 Mohr‐Coulomb 15 35
0.1472
Pressure Head[ft]
-12.000
-4.000
4.000
12.000
20.000
28.000
36.000
44.000
52.000
60.000
68.000
76.000
84.000
750
725
700
675
650
625
-100 -80 -60 -40 -20 0 20 40 60 80 100 120 140
Analysis Description MAXIMUM STORAGE POOL FOSCompany GOLDERScale 1:310Drawn By T. JOHNSONFile Name WDA 681 - block.slimDate 9/1/16
Project
NIPSCO - WASTE DISPOSAL AREA
SLIDEINTERPRET 7.018
6

2.8032.8032.8032.803
679 679 679 679 679 679 679 679 679 679 679 679 679
679 681
681 681
681 681
681 681
681 681
??????????????????????? ? ? ? ? ? ? ? ? ? ?? ? ? ? 681
681 681
681 681
681 679
679 679 679 679 679 679 679 679 679 679 679 679 679
661.13??????? 660.96
?? 681
681
257.73(e)(1)(ii) - Maximum SurchargePool Loading
Waste Disposal Area-No Seismic
Resultsjanbu corrected
2.803
Material Name Color Unit Weight(lbs/ 3) Strength Type Cohesion
(psf)Phi(deg)
EMBANKMENT SOIL 125 Mohr‐Coulomb 0 42
SHALE 145 Mohr‐Coulomb 0 45
SUBGRADE 110 Mohr‐Coulomb 0 39
SLURRY WALL 120 Mohr‐Coulomb 300 0
RIP RAP 140 Mohr‐Coulomb 0 45
CRUSHED STONE 140 Mohr‐Coulomb 0 45
TOPSOIL 120 Mohr‐Coulomb 15 35
Safety Factor0.000
0.500
1.000
1.500
2.000
2.500
3.000
3.500
4.000
4.500
5.000
5.500
6.000+
Pressure Head[ft]
-12.000
-4.000
4.000
12.000
20.000
28.000
36.000
44.000
52.000
60.000
68.000
76.000
84.000
775
750
725
700
675
650
625
-150 -125 -100 -75 -50 -25 0 25 50 75 100 125
Analysis Description MAXIMUM STORAGE POOL FOSCompany GOLDERScale 1:350Drawn By T. JOHNSONFile Name WDA 681 - ROT.slimDate 9/1/16
Project
NIPSCO - WASTE DISPOSAL AREA
SLIDEINTERPRET 7.018
7

1.7771.7771.7771.777
679 679 679 679 679 679 679 679 679 679 679 679 679
679 681
681 681
681 681
681 681
681 681
???????
??
??
??
??
???????? ??
??
??
??
??
? ? ? ? 681 681
681 681
681 681
679 679
679 679 679 679 679 679 679 679 679 679 679 679 661.13??????? 660.96
?? 681
681
257.73(e)(1)(iii) - Maximum Surcharge Pool Loading
Waste Disposal Area
Rotational - Seismic
Resultsjanbu corrected
1.777
Material Name Color Unit Weight(lbs/ 3) Strength Type Cohesion
(psf)Phi(deg)
EMBANKMENT SOIL 125 Mohr‐Coulomb 0 42
SHALE 145 Mohr‐Coulomb 0 45
SUBGRADE 110 Mohr‐Coulomb 0 39
SLURRY WALL 120 Mohr‐Coulomb 300 0
RIP RAP 140 Mohr‐Coulomb 0 45
CRUSHED STONE 140 Mohr‐Coulomb 0 45
TOPSOIL 120 Mohr‐Coulomb 15 35
0.1472
Safety Factor0.000
0.500
1.000
1.500
2.000
2.500
3.000
3.500
4.000
4.500
5.000
5.500
6.000+
Pressure Head[ft]
-12.000
-4.000
4.000
12.000
20.000
28.000
36.000
44.000
52.000
60.000
68.000
76.000
84.000
750
700
650
-150 -125 -100 -75 -50 -25 0 25 50 75 100 125
Analysis Description MAXIMUM STORAGE POOL FOSCompany GOLDERScale 1:350Drawn By T. JOHNSONFile Name WDA 681 - ROT.slimDate 9/1/16
Project
NIPSCO - WASTE DISPOSAL AREA
SLIDEINTERPRET 7.018
8

APPENDIX B LIQUEFACTION POTENTIAL ANALYSIS RESULTS

Project: Test Type: CPTU Golder Eng: AK Design EQ 1Location: Device: 15 cm2, Type 2 filter Check Magnitude:Client: Standard: ASTM D5778 Review:Proj No.: Push Co.: STRATIGRAPHICS Max Depth:Termination: Operator: --
CPT ID: CPT-044 CPT ID: CPT-038 CPT ID: CPT-040
Test Date: Test Date: Test Date:Northing: Northing: Northing:
Easting: Easting: Easting:Elevation: Elevation: Elevation:
amax: amax: amax:
Water Table: Water Table: Water Table: 2.3 ft
6/6/2011
2168808
2970555
664.9 ft
0.1 g
10.5 ft
6/6/2011
2170181
2971542
680.3 ft
0.09 g
6/6/2011
2169979
2968359
680.4 ft
0.09 g
11.8 ft
Target Depth
WDA RCRAWheatfield IN 4.8 gNIPSCO1651599 34 ft
Note: Factor of safeties (FS) greater than 2 are shown equal to 2.
CALCULATED LIQUEFACTION FACTOR OF SAFETY
0 1 2
CPT-038
FS<1.2 FS>1.2 1.2
0 1 2
CPT-40
FS<1.2 FS>1.2 1.2
0
20
40
0 1 2
Dep
th (
ft)
CPT-044
FS<1.2 FS>1.2 1.2
AFTDJ
Date: 10/5/16

Golder, Golder Associates and the GA globe design are trademarks of Golder Associates Corporation
Golder Associates Inc. 15851 South US 27, Suite 50
Lansing, MI 48906 USA Tel: (517) 482-2262 Fax: (517) 482-2460