nih public access plasticity. part ii: experimental study...
TRANSCRIPT
Parametric and non-parametric modeling of short-term synapticplasticity. Part II: Experimental study
Dong Song1,3,5, Zhuo Wang4, Vasilis Z. Marmarelis1,3, and Theodore W. Berger1,2,31 Berger Department of Biomedical Engineering, University of Southern California, Los Angeles,CA, USA2 Program in Neuroscience, University of Southern California, Los Angeles, CA, USA3 Center for Neural Engineering, University of Southern California, Los Angeles, CA, USA4 Center for Neurovisceral Sciences & Women’s Health, VA Greater Los Angeles HealthcareSystem, Los Angeles, CA, USA5 University of Southern California, 403 Hedco Neuroscience Building, Los Angeles, CA 90089,USA, [email protected]
AbstractThis paper presents a synergistic parametric and non-parametric modeling study of short-termplasticity (STP) in the Schaffer collateral to hippocampal CA1 pyramidal neuron (SC) synapse.Parametric models in the form of sets of differential and algebraic equations have been proposed onthe basis of the current understanding of biological mechanisms active within the system. Non-parametric Poisson–Volterra models are obtained herein from broadband experimental input–outputdata. The non-parametric model is shown to provide better prediction of the experimental output thana parametric model with a single set of facilitation/depression (FD) process. The parametric modelis then validated in terms of its input–output transformational properties using the non-parametricmodel since the latter constitutes a canonical and more complete representation of the synapticnonlinear dynamics. Furthermore, discrepancies between the experimentally-derived non-parametricmodel and the equivalent non-parametric model of the parametric model suggest the presence ofmultiple FD processes in the SC synapses. Inclusion of an additional set of FD process in theparametric model makes it replicate better the characteristics of the experimentally-derived non-parametric model. This improved parametric model in turn provides the requisite biologicalinterpretability that the non-parametric model lacks.
KeywordsNonlinear modeling; Facilitation; Depression; Poisson stimulus; Volterra kernels
1 IntroductionSynaptic transmission is a nonlinear dynamic process that plays a critical role in signaltransmission and information processing in the nervous system (Zucker and Regehr 2002). Theterm “dynamic” implies that the causal effects of a presynaptic event spread into the futurevalues of the postsynaptic events and are not limited to the present time. The term “nonlinear”
Correspondence to: Dong Song.Action Editor: David Golomb
NIH Public AccessAuthor ManuscriptJ Comput Neurosci. Author manuscript; available in PMC 2009 September 23.
Published in final edited form as:J Comput Neurosci. 2009 February ; 26(1): 21–37. doi:10.1007/s10827-008-0098-2.
NIH
-PA Author Manuscript
NIH
-PA Author Manuscript
NIH
-PA Author Manuscript
means that the combined effect of two or more presynaptic events is different from the simpleconcatenation of the postsynaptic events that would have been caused by each of thepresynaptic events separately. Thus, the process of synaptic transmission can also be viewedas a nonlinear dynamic input–output transformation of a sequence of presynaptic events intopostsynaptic events in a manner that is use-dependent (i.e., depends on the specific temporalpattern of presynaptic events) and is also termed short-term plasticity (STP).
STP can be modeled parametrically or non-parametrically for different aims (see Introductionof the companion paper). Parametric models are often developed to explain the underlyingbiological mechanisms and thus have a predictive power in terms of how the biologicalprocesses determine the systems behavior, e.g., input–output transformational property of thesystem (Dittman et al. 2000). By contrast, non-parametric models are built to quantitativelydescribe such input–output transformational property in a model-free manner (Krausz andFriesen 1977; Marmarelis and Marmarelis 1978; Berger et al. 1988a,b; Sclabassi et al. 1988;Berger et al. 1994; Bishop 1995; Marmarelis 2004). The advantages of a non-parametric modelfor such aim are the following: in terms of model configuration, a non-parametric model takesa general model form that is applicable to almost all causal systems, thus avoids potential errorsin the postulation of the model structure. In terms of parameter estimation, a non-parametricmodel is estimated from input–output data collected under broadband condition and inherentlyvalid for such condition.
The main aim of this study is to combine both parametric and non-parametric modelingmethods in a synergistic manner to study STP in CNS synapses. In the first half of this study(see companion paper), non-parametric models of synaptic STP are estimated from input–output data simulated with several parametric STP models. Results show that non-parametricmodel (in the form of Poisson–Volterra kernels) can accurately and efficiently capture thenonlinear dynamics defined by those parametric models. Volterra kernels provide a generaland quantitative representation of the synaptic STP. Furthermore, by relating the kernel shapesof the non-parametric model to the key parameters of the parametric model, many insights aregained on how the biological processes (represented by the parameters) shape the input–outputfunctional properties (described by the kernels) of the synapse.
The non-parametric model constitutes a canonical and complete representation of the system(nonlinear) dynamics that is derived directly from the broadband data. Thus, the obtained modelis not restricted by any prior assumptions and can be used as the “ground truth” to evaluate theparametric models of the system in terms of its input–output transformational property. In thispaper, we estimate the non-parametric Poisson–Volterra kernel (PV) models of the Schaffercollateral to hippocampal CA1 pyramidal neuron (SC) synapse under two extracellular calciumconditions. Results show that the PV models more accurately capture the synaptic nonlineardynamics than a parametric facilitation/depression (FD) model under both conditions. On theother hand, since these non-parametric models are descriptive representations of synapticnonlinear dynamics, they can accurately predict the synaptic output under each condition butlack the ability to explain the obtained synaptic nonlinear dynamics in a physiologically-interpretable manner. To get better understanding to the underlying mechanism, we combinethe parametric and non-parametric models again—we validate and modify the parametricFD model using the non-parametric PV model. Several significant discrepancies between theexperimentally-derived non-parametric model and the equivalent non-parametric model of theparametric model are found in the PV kernels. These discrepancies suggest the presence ofmultiple FD processes in the SC synapses. Inclusion of an additional FD process in theparametric model makes it replicate better the characteristics of the experimentally-derivednon-parametric model. The modified parametric model provides in turn the requisite biologicalinterpretability of the model components—whereby the advocated synergistic use of the twomodeling approaches.
Song et al. Page 2
J Comput Neurosci. Author manuscript; available in PMC 2009 September 23.
NIH
-PA Author Manuscript
NIH
-PA Author Manuscript
NIH
-PA Author Manuscript
2 Materials and methods2.1 Experimental procedures
2.1.1 Slice preparation—Hippocampal slices were prepared from young adult maleSprague–Dawley rats (80–200 g). Animals first were anesthetized with 5% halothane, and thenwere decapitated and the hippocampi were rapidly dissected. Both hippocampi were sectionedinto blocks while being washed with cold, oxygenated medium and slices of tissue (350 μmthick) then were cut perpendicular to the longitudinal axis using a vibratome (VT-100S; Leica).Slices were incubated with medium consisted of (in mM): 128 NaCl; 2.5 KCl; 1.25NaH2PO4; 26 NaHCO3; 10 glucose; 2 CaCl2; 3.0 MgSO4, aerated with 95% O2/5% CO2.Hippocampal slices were maintained at 32°C for 30 min and then at room temperaturethroughout the entire experiments. During the recording session, slices were transferred to therecording chamber and perfused at flow rates of 2–3 ml/min; the perfusion medium waschanged according to the experimental purposes.
2.1.2 Stimulation procedures—A bipolar stimulating electrode (a pair of twisted,insulated nichrome wires) were placed in the Schaffer collateral to orthodromically activateCA1 pyramidal cells. A cut was made between the CA3 and CA1 regions to preventepileptiform activity in the CA3 region from affecting the recording in CA1. Biphasic currentimpulses (200 μs in duration) controlled by a stimulator (Master-8; AMPI) were delivered tothe tissue via stimulation isolation units (ISO-Flex; AMPI). The stimulation intensity variedfrom 100 to 700 μA. Since the cells were under voltage-clamp and the synapses could be takento be independent current sources, the strict control of stimulation intensity was relaxed. Insteadof using stimulation/response function (I/O curve), stimulation intensities were chosen to elicitroughly constant EPSC amplitudes reflecting approximately the same number of activatedsynapses. Under 2 mM [Ca2+]o condition, the baseline EPSC amplitudes were in the range of150–600 pA; under 1 mM [Ca2+]o condition, the baseline EPSC amplitudes were in the rangeof 80–300 pA. Too small responses tended to have large variations and too big responses mightcause imperfect voltage clamp and spurious EPSCs.
Poisson random impulse trains were generated with an STG 1002 stimulator (MultiChannelSystems) and then sent to Master-8. The inter-impulse intervals were determined offline by aPoisson distribution with a mean interval of 500 ms and a range of 6–5,000 ms. The minimalinter-impulse interval (6 ms) is longer than the reported refractory period of the Schaffercollaterals (Stevens and Wang 1995; Dobrunz et al. 1997). Fixed-interval impulse trains withfour frequencies (10, 20, 30 and 40 Hz) were generated with Master-8. Each train wascomprised of ten impulses.
2.1.3 Electrophysiological recording procedures—Whole-cell recordings of EPSCwere performed with an HEKA EPC-9 patch-clamp amplifier from CA1 pyramidal cellsvisually identified with an infrared microscope (Olympus BX50WI). The glass micropipettewas filled with internal solutions containing (in mM): 95 caesium gluconate, 20 TEACl, 10NaCl, 5 QX-314, 4 Mg-ATP, 0.4 Na-GTP, 0.1 EGTA and 10 HEPES (pH 7.0, titrated withgluconic acid). Some of the experiments were performed with a reduced formula containing(in mM): 130 caesium gluconate, 5 CsCl, 0.1 CaCl2, 1 BAPTA and 10 HEPES (pH 7.0, titratedwith gluconic acid). Most of the cells were voltage-clamped at a holding potential of −70 mV.Some cells were held at −90 or −120 mV. Glass pipettes were pulled using a horizontal puller(Model P-80 PC; Sutter Instrument Co.). They had a resistance of 2–4 MΩ and were notpolished or coated. The serial resistance varied between 5 and 30 MΩ. The input resistance ofthe cells was higher than 1.0G Ω (on-cell mode). Responses were sampled at 10 or 20 kHzwith pulse data acquisition software (HEKA). Recorded data were exported in ASCII format
Song et al. Page 3
J Comput Neurosci. Author manuscript; available in PMC 2009 September 23.
NIH
-PA Author Manuscript
NIH
-PA Author Manuscript
NIH
-PA Author Manuscript
and then imported to pClamp 9.0 (Axon Instruments) and Matlab (The MathWorks, Inc.) forfurther analysis.
Both fixed-interval and random-interval impulse trains were applied to each cell. In fixed-interval train experiments, each train was repeated 16 times and then averaged. Totally 640input–output pairs were recorded. In random-interval train experiments, 1,200–3,600 input/output pairs were collected.
2.1.4 Pharmacological manipulations—In addition to cutting the CA3-CA1 connection,high concentration of Mg2+ (3 mM) was used in the incubating and recording mediums tominimize multi-synaptic activity (Mody et al. 1987). The Ca2+ concentration was altered tomanipulate the release probability of the synapses (1 or 2 mM). To simplify postsynapticmechanisms and get more reliable measurements to the presynaptic release, NMDA receptorsand GABAA receptors were blocked with DAP-V (25 μM) and picrotoxin (100 μM),respectively. In some experiments, GABAB receptors were blocked by CGP55845a (2 μM).AMPA receptor desensitization blocker cyclothiazide (CTZ) was made daily as a 10 mM stockin dimethyl sulfoxide (DMSO) and diluted to 100 μM final concentration in the perfusionmedium immediately prior to application.
Note that, although synaptic transmission involves both presynaptic and postsynapticmechanisms, most STP studies to date focus on the presynaptic mechanism (Zucker and Regehr2002). However, since the neurotransmitter release (which is the real output of the presynapticregion) is difficult to measure, researchers typically use the postsynaptically recorded signal(e.g., EPSC) to infer the strengths of synaptic release. In order to do this, it is necessary tosimplify the postsynaptic mechanisms by voltage-clamping in the postsynaptic region and byremoving postsynaptic voltage-dependent channels (e.g. NMDA). These pharmacologicalmanipulations were used to isolate the presynaptic mechanisms and, therefore, the study of theSTP process refers to the presynaptic transformation of a sequence of action potentials arrivingat the bouton (input) to the EPSCs (output) recorded from the soma.
2.2 Modeling procedures2.2.1 Estimation of presynaptic release—As indicated above, STP is primarily causedby presynaptic mechanisms. All-or-none action potentials elicit transmitter releases withvarying strengths in the presynaptic terminal which open ionic channels on the postsynapticmembrane. The transmitter release has been shown to have a short duration (Clements et al.1992) and thus the output signal of the presynaptic terminal can be adequately modeled as avariable-amplitude point-process. Because of the extremely narrow synapse cleft and technicaldifficulties in direct measurement of transmitter release, the postsynaptic signal (i.e. thesequence of EPSCs) is used to estimate the release strength through deconvolution with a singletypical EPSC waveform (Fig. 1). The resulting discrete values, instead of the EPSC peakamplitudes, are used as estimates of the amounts of transmitter release. This method excludesthe effect of EPSC temporal summation in the event of overlap and allows almost perfectreconstruction of the continuous EPSC waveforms. In this paper, without further specification,EPSC amplitude refers to the deconvolved amplitude, not the peak amplitude of EPSC. Thesetwo amplitudes are the same when there is no temporal summation of overlapping EPSCs.
2.2.2 Estimation of the non-parametric model—The employed form of non-parametricmodel is the reduced form of the discrete-time Poisson–Volterra (PV) model (Marmarelis andBerger 2005) where the PV kernels are estimated using Laguerre expansions (Marmarelis1993). The mathematical form of the PV model is:
Song et al. Page 4
J Comput Neurosci. Author manuscript; available in PMC 2009 September 23.
NIH
-PA Author Manuscript
NIH
-PA Author Manuscript
NIH
-PA Author Manuscript
(1)
where k1, k2, and k3 are the 1st, 2nd, and 3rd order PV kernels of the system. The summationsin Eq. (1) take place over all input event times within a past epoch M (termed the “systemmemory”) prior to ti. The 1st-order PV kernel, k1, represents the amplitude of the EPSCattributed to each stimulus impulse alone (i.e., baseline EPSC amplitude). The 2nd-order PVkernel, k2(τ), represents the change in the present EPSC amplitude contributed by the 2nd-orderinteraction between the present impulse and a preceding impulse, as a function of their timeinterval τ. The 3rd-order PV kernel, k3(τ1, τ2), represents the change in the present EPSCamplitude contributed by the 3rd-order interaction between the present impulse and twopreceding impulses, as a function of their time intervals τ1 and τ2. The 2nd term in Eq. (1)represents the total 2nd-order contribution from all preceding impulses within the systemmemory M. The 3rd term represents the total 3rd -order contribution from all precedingimpulses within M.
The model order is determined by means of the predictive accuracy of PV models of ascendingorder (1st, 2nd, 3rd and 4th), which is quantified by the normalized root-mean-square error(NRMSE) of the output prediction for Poisson RIT inputs. The 3rd-order model is foundconsistently to be adequate for capturing the dynamic nonlinearities of the system as reflectedon the broadband input–output data (i.e., the obtained 4th-order model decreased NRMSE onlymarginally (<1%) that does not justify the inclusion in the model of the 4th-order kernel). Thisis in agreement with the results of the companion computational study (Part I).
All PV kernels for this synapse are estimated with a system memory of 2,000ms and a samplinginterval of 1ms. The number of Laguerre basis functions is chosen to be 4, which is the valueallowing the most accurate prediction without overfitting, as determined by the model-orderselection criterion for Volterra-type models (Marmarelis 2004). The expansion coefficients ofthe kernels are estimated through ordinary least-squares using singular value decomposition.The optimal value of the Laguerre parameter α was searched in the range from 0 to 0.999 andthe average value was found to be 0.920 over the available input–output datasets.
To facilitate interpretation, the “response descriptors” (RD) that are based on the PV kernelsare used to describe the system characteristics (see companion paper). The set of RDs for agiven system is mathematically equivalent with the PV kernels, as indicated by the definingrelations for the 3rd-order model:
(2)
(3)
(4)
These defining relations indicate that the 1st-order RD, r1, is equal to the baseline EPSCamplitude; the 2nd-order RD, r2(τ), represents the total change (including both 2nd and 3rd-
Song et al. Page 5
J Comput Neurosci. Author manuscript; available in PMC 2009 September 23.
NIH
-PA Author Manuscript
NIH
-PA Author Manuscript
NIH
-PA Author Manuscript
order) in the present EPSC amplitude caused by a single preceding impulse, as a function oftheir time interval τ; the 3rd-order RD, r3(τ1, τ2), represents the joint effect (exclusive of theirindividual effects described by r2(τ1) and r2(τ2)) of two preceding impulses on the presentEPSC amplitude, as a function of their time intervals τ1 and τ2. Without loss of generality, bothr2 and r3 are normalized with r1.
2.2.3 Estimation of the parametric model—As a parametric model of the SC synapse,we consider the widely accepted residual calcium-based facilitation/depression (FD) model(Dittman et al. 2000). In this model, the EPSC is calculated as the product of facilitation anddepression factors (F and D). The residual calcium is assumed to be a linear dynamic process.The facilitation and depression factors are calculated on the basis of the residual calciumconcentration, using first-order linear differential equations and nonlinear algebraic functions(see Method of the companion paper for more details). The key parameters of this FD modelare: the initial release probability (F1), the maximum paired-pulse facilitation ratio (ρ), theminimum and maximum recovery rates (k0 and kmax) and the time constants of residual calcium(τF and τD). These key parameters are estimated using the constrained Quasi-Newtonoptimization technique (Matlab 6.5; MathWorks, Inc.). Optimal values for τF and τD weresearched in the range of 10–200 ms with a 10 ms step length. Mean values and standard errorsof the estimated parameter values calculated over all experiments are reported in Tables 1 and2. Sensitivity analysis shows that the systems input–output transformation is insensitive to theother model parameters.
Most importantly, it is found through comparison with the non-parametric model that thisparametric model must be augmented to include a second FD process (with different dynamiccharacteristics) in order to explain adequately the broadband experimental data. The equationfor the total transmitter release of this double-process FD model takes the form:
(5)
where R is the total release and N denotes the weights for each synaptic process (distinguishedby the subscripts f for “fast” and s for “slow”). Without loss of generality, the sum of the twoweights is set to unity. Each process is described by a similar FD model with its own set ofparameters (Table 3). Since the double-process FD model involves more free parameters, it ismore difficult to optimize for each individual cell than the single-process FD model. For thisreason, all parameters are optimized with respect to the averaged nonlinearities (i.e. theparameter values are determined through a search that seeks the most accurate replicas ofaverage experimentally constrained kernels), and there is no standard error reported in Table3.
3 Results3.1 Experimental exploration of STP in the SC synapse
The experimental data were collected under two different [Ca2+]o conditions (2 and 1 mM).Under each condition, both fixed-interval trains (FIT) and random-interval trains (RIT) ofstimuli were applied. EPSC amplitudes were extracted using the deconvolution techniquedescribed in Section 2. Third-order Poisson–Volterra (PV) models of STP in SC synapses wereestimated from the RIT datasets that contain PV kernels from which the RDs were computedin order to study the input–output transformatrion characteristics of the SC synapse.
3.1.1 High [Ca2+]o condition (2mM)—First, we examine experimentally the STPcharacteristics of SC synapses with the conventional FIT stimulation protocol. Four inputfrequencies are used (10, 20, 30 and 40 Hz) and each FIT comprises ten impulses. Under the
Song et al. Page 6
J Comput Neurosci. Author manuscript; available in PMC 2009 September 23.
NIH
-PA Author Manuscript
NIH
-PA Author Manuscript
NIH
-PA Author Manuscript
2 mM [Ca2+]o condition, the EPSCs peak at the second response and then decline in the restof the responses (Figs. 2 and 3). The ratios of the second responses to the corresponding firstresponses are 120 ± 9%, 132 ± 10%, 140 ± 15% and 129 ± 10% (mean ± SE; n = 7) and theratios of the third responses to the first responses are 112 ± 11%, 126 ± 12%, 141 ± 14% and122 ± 13%, in the 10, 20, 30, and 40 Hz FIT, respectively. This pattern is consistent with theprevious reports (Dittman et al. 2000) despite the relatively smaller magnitudes.
EPSC trains elicited by RIT stimuli with Poisson distribution were then recorded, and 3rd-order PV models were estimated from these input–output datasets that fully characterize thesynaptic dynamics with respect to arbitrary inter-impulse intervals (IPIs). The 2nd-order and3rd-order RDs, r2 and r3, are computed from the estimated PV kernels using the expressionsin Eqs. (2)–(4) and are shown in the top row of Fig. 4. The 1st-order RD, r1, is equal to thebaseline EPSC recorded from each cell and it is controlled experimentally to be in the rangeof 150–600pA by adjusting the stimulation intensity. The RDs, r2 and r3, are normalized withthe corresponding r1 and then averaged across all nine cells used in this study.
In the high-calcium condition (shown in the first row of Fig. 4), the computed r2 rapidlyincreases to the peak value of 27 ± 9% in the short IPI range of 6–40 ms; while in theintermediate IPI range of 40–440 ms, r2 decreases from the peak to a minimum value of −9 ±2%, crossing into negative values for an IPI around 200 ms. In the long IPI range beyond 440ms, r2 returns asymptotically to zero, practically vanishing after an IPI of approximately 1,600ms. The computed r3 is primarily negative, reflecting the dominant 3rd-order suppressingeffects of pairs of preceding impulses, especially for IPIs shorter than 200 ms, as it is evidentin the diagonal slice of r3 which exhibits a fast initial exponential phase with approximate timeconstant of 11 ms and a slower phase that can be approximated by the difference of twoexponentials with the time constant being approximately 87 ms. These results suggest that theSTP dynamics in the SC synapse involve at least two processes with different time constants.
3.1.2 Low [Ca2+]o condition (1mM)—The biphasic form of the computed r2 and thenegative monophasic form of the computed r3 under the high-calcium condition indicate thatthe SC synapses have both facilitative and depressive processes. To explore further thetransmission characteristics and the underlying mechanisms of SC synapses, the experimentswere repeated with lower [Ca2+]o (1 mM). Under low-calcium conditions, the initial releaseprobability of the synapse is suppressed and the synaptic depression caused by vesicle depletionis consequently decreased (Rahamimoff 1968; Creager et al. 1980). The response dynamicsare expected to be dominated by the facilitation processes.
Indeed, this dominant facilitation is evident in the FIT responses. As shown in Fig. 3, the EPSCamplitudes increase more in the first four responses (relative to the first response) and thenform a broad summit (resembling almost a plateau) over the subsequent responses. Theobserved ratios of the second responses to the corresponding first responses are 125 ± 8%, 138± 4%, 150 ± 25% and 148 ± 18%; and the ratios of the third responses to the correspondingfirst responses are 142 ± 8%, 171 ± 10%, 204 ± 23% and 197 ± 17%, for the 10, 20, 30, and40Hz trains, respectively (n = 5).
In the case of RIT stimulation, the computed RDs (Fig. 4, bottom row) indicate that r2 remainspositive for all IPI values and practically vanishes beyond an IPI value of 500 ms (n = 8). Afast rate of decline is observed in the IPI range up to 100ms, where r2 decays from 178 ± 13%to 126 ± 3% (corresponding to an approximate exponential time-constant of 21 ms), while therate of decline in the subsequent IPI range of 100–500 ms is much slower (corresponding toan approximate exponential time constant of 197 ms). This result suggests the presence of (atleast) two processes of facilitation in the STP dynamics of SC synapses. We also observe inthe bottom row of Fig. 4 that r3 is triphasic and remains negative for most IPI values (i.e., it is
Song et al. Page 7
J Comput Neurosci. Author manuscript; available in PMC 2009 September 23.
NIH
-PA Author Manuscript
NIH
-PA Author Manuscript
NIH
-PA Author Manuscript
slightly positive only for IPI values between 30 and 100 ms). Comparing the absolute valuesof r2 and r3, we observe that the latter is much smaller and has shorter duration. The resultsshow that under the low-calcium condition, the synaptic nonlinearity is primarily a 2nd-orderfacilitation (Fig. 4, bottom row)—unlike the high-calcium condition where the synapticnonlinearity appears to be primarily a 3rd-order depression (Fig. 4, top row).
3.1.3 AMPA desensitization does not change the pattern of STP—In this study,several strategies were used to isolate the presynaptic mechanisms of STP: postsynaptic activemembrane conductances were voltage-clamped; nonlinear NMDA receptors were blocked byD-APV and high Mg2+ in addition to voltage-clamp; GABAA receptors were blocked bypicrotoxin; temporal summations of EPSCs were eliminated by the deconvolution procedure,etc. The purpose is to leave only the AMPA receptors and use them to infer the amounts ofpresynaptic transmitter releases. However, it is known that the AMPA receptors are subject todesensitization that could potentially influence the estimation of presynaptic release, especiallyin the short IPIs (Trussell and Fischbach 1989). To eliminate the contribution of AMPAreceptor desensitization, a potent AMPA receptor desensitization inhibitor, cyclothiazide(CTZ, 100 μM), was used (Yamada and Tang 1993). After the aforementioned FIT and RITexperiments, CTZ was applied to the perfusion medium and the experiments were repeatedafter 20 min.
Under CTZ condition, the single EPSC profile is dramatically changed. In a representative cellshown in Fig. 5, the time-to-peak of the EPSC becomes 14.6 ms during CTZ application,compared to 8.7 ms in the previous experiments (control condition). The extent of EPSC isalso broadened, e.g., the area of the EPSC is increased by 77% during CTZ application afternormalizing the peak amplitudes. Due to the slower kinetics of desensitized AMPA receptors,the effect of temporal summations of EPSCs in a train is greater than the control condition dueto the larger overlap. For example, in the 40 Hz train (Fig. 5, bottom row), the ratios of thesecond to the first EPSC peak amplitudes are 2.2 with CTZ and 1.6 in control; the ratios of thethird to the first EPSC peak amplitudes are 3.1 with CTZ and 1.9 in control. However, thevalues of the deconvolved EPSC amplitudes are not significantly changed. In the same 40 Hztrain, the ratios of the second to the first deconvolved amplitudes are 1.5 with CTZ and 1.4 incontrol; the ratios of the third to the first deconvolved amplitudes are 1.7 with CTZ and 1.6 incontrol. These results demonstrate that AMPA desensitization has strong effects on the EPSCwaveforms but not on the deconvolved amplitudes of estimated transmitter release.
Consistent with the FIT results, the RDs (r2 and r3) are not significantly changed by CTZapplication, as illustrated in the middle row of Fig. 4 (n = 4). This result of negligible CTZeffect on the STP dynamics of SC synapses under 2 mM [Ca2+]o condition indicates that theobserved STP dynamics are almost exclusively due to presynaptic mechanisms.
3.1.4 Prediction of random EPSC trains with 3rd-order non-parametric models—One of the major strengths of the non-parametric model is that it is estimated directly frombroadband experimental data (representing a broad repertoire of possible inputs) and retainspredictive capability to a broad range of input patterns. The obtained kernels can be used notonly to characterize the input–output properties of the system, but also to accurately predictthe system output for a given input. For each cell/experiment, the 3rd-order PV model isestimated with random input–output data of 800–3,200 event pairs, and then used to predictthe output for a different random input dataset of 400–1,600 events. To evaluate the predictivecapability of the estimated model, the NRMSE of the model prediction is calculated based onthe predicted outputs and the respective recorded outputs. Our results show that under bothhigh and low [Ca2+]o conditions, the 3rd-order PV models are able to predict accurately theEPSC amplitudes (see Fig. 6). For high [Ca2+]o condition, the NRMSE was 23 ± 2% (n = 9),and for low [Ca2+]o condition, the NRMSE was 24 ± 3% (n = 8).
Song et al. Page 8
J Comput Neurosci. Author manuscript; available in PMC 2009 September 23.
NIH
-PA Author Manuscript
NIH
-PA Author Manuscript
NIH
-PA Author Manuscript
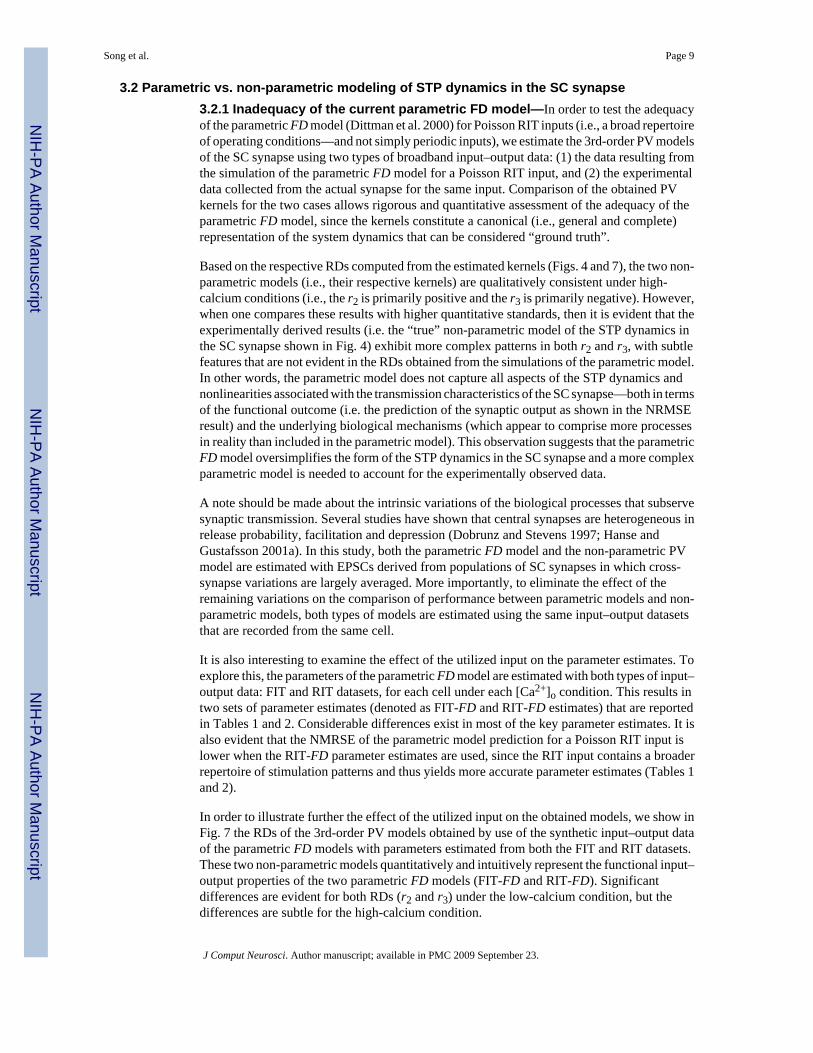
3.2 Parametric vs. non-parametric modeling of STP dynamics in the SC synapse3.2.1 Inadequacy of the current parametric FD model—In order to test the adequacyof the parametric FD model (Dittman et al. 2000) for Poisson RIT inputs (i.e., a broad repertoireof operating conditions—and not simply periodic inputs), we estimate the 3rd-order PV modelsof the SC synapse using two types of broadband input–output data: (1) the data resulting fromthe simulation of the parametric FD model for a Poisson RIT input, and (2) the experimentaldata collected from the actual synapse for the same input. Comparison of the obtained PVkernels for the two cases allows rigorous and quantitative assessment of the adequacy of theparametric FD model, since the kernels constitute a canonical (i.e., general and complete)representation of the system dynamics that can be considered “ground truth”.
Based on the respective RDs computed from the estimated kernels (Figs. 4 and 7), the two non-parametric models (i.e., their respective kernels) are qualitatively consistent under high-calcium conditions (i.e., the r2 is primarily positive and the r3 is primarily negative). However,when one compares these results with higher quantitative standards, then it is evident that theexperimentally derived results (i.e. the “true” non-parametric model of the STP dynamics inthe SC synapse shown in Fig. 4) exhibit more complex patterns in both r2 and r3, with subtlefeatures that are not evident in the RDs obtained from the simulations of the parametric model.In other words, the parametric model does not capture all aspects of the STP dynamics andnonlinearities associated with the transmission characteristics of the SC synapse—both in termsof the functional outcome (i.e. the prediction of the synaptic output as shown in the NRMSEresult) and the underlying biological mechanisms (which appear to comprise more processesin reality than included in the parametric model). This observation suggests that the parametricFD model oversimplifies the form of the STP dynamics in the SC synapse and a more complexparametric model is needed to account for the experimentally observed data.
A note should be made about the intrinsic variations of the biological processes that subservesynaptic transmission. Several studies have shown that central synapses are heterogeneous inrelease probability, facilitation and depression (Dobrunz and Stevens 1997; Hanse andGustafsson 2001a). In this study, both the parametric FD model and the non-parametric PVmodel are estimated with EPSCs derived from populations of SC synapses in which cross-synapse variations are largely averaged. More importantly, to eliminate the effect of theremaining variations on the comparison of performance between parametric models and non-parametric models, both types of models are estimated using the same input–output datasetsthat are recorded from the same cell.
It is also interesting to examine the effect of the utilized input on the parameter estimates. Toexplore this, the parameters of the parametric FD model are estimated with both types of input–output data: FIT and RIT datasets, for each cell under each [Ca2+]o condition. This results intwo sets of parameter estimates (denoted as FIT-FD and RIT-FD estimates) that are reportedin Tables 1 and 2. Considerable differences exist in most of the key parameter estimates. It isalso evident that the NMRSE of the parametric model prediction for a Poisson RIT input islower when the RIT-FD parameter estimates are used, since the RIT input contains a broaderrepertoire of stimulation patterns and thus yields more accurate parameter estimates (Tables 1and 2).
In order to illustrate further the effect of the utilized input on the obtained models, we show inFig. 7 the RDs of the 3rd-order PV models obtained by use of the synthetic input–output dataof the parametric FD models with parameters estimated from both the FIT and RIT datasets.These two non-parametric models quantitatively and intuitively represent the functional input–output properties of the two parametric FD models (FIT-FD and RIT-FD). Significantdifferences are evident for both RDs (r2 and r3) under the low-calcium condition, but thedifferences are subtle for the high-calcium condition.
Song et al. Page 9
J Comput Neurosci. Author manuscript; available in PMC 2009 September 23.
NIH
-PA Author Manuscript
NIH
-PA Author Manuscript
NIH
-PA Author Manuscript
Most importantly, we wish to compare the RDs of the non-parametric models estimated fromthe FD model (shown in Fig. 7) and from the experimental data (shown in Fig. 4) for the sameRIT input under the two calcium conditions. The results indicate that both FIT-FD and RIT-FD RDs have significant differences from the RDs of the experimentally-derived non-parametric model.
Specifically, under 2 mM [Ca2+]o condition, the r2 values of the experimentally-derived non-parametric model (i.e., the true r2) shows peak paired-pulse facilitation at about 40ms IPI (Fig.4, top row), but this peak is not captured by the r2 values of either the FIT-FD or the RIT-FD model, which are both monotonically decaying in the IPI range up to 400 ms (Fig. 7). TheFIT-FD results also overestimate the paired-pulse facilitation for short IPIs more than the RIT-FD results, relative to the results of the experimentally-derived non-parametric model. Thelatter peak value is 27 ± 9%, while the peak values for the FIT-FD and RIT-FD models are 39± 12% and 30 ± 9% respectively. The more severe overestimation of the FIT-FD model isprobably due to the fact that the FIT inputs lack IPIs shorter than 25 ms, where the synapsesexhibit weak paired-pulse facilitation (as shown in Fig. 4). Another difference is evident in thevalues of the negative (depressive) phase of r2 for IPIs around 400 ms, where the parametricmodels exhibit less depressive characteristics. Significant differences are also observed in the3rd-order RDs, where the diagonal slice of the true r3 shows a more complex shape that canbe fit in the early part (short IPIs) by an exponential with time constant of 11ms and in the latepart (IPIs from 300 to 500 ms) by an exponential with a time constant of 87 ms, while thediagonal slice of r3 of the FD models can be fit by a single exponential function with timeconstant of 69 ms for the FIT-FD model and 56 ms for the RIT-FD model. Notably, themagnitude of 3rd-order depression is much larger in the results of the experimentally-derivednon-parametric model. Differences are also evident at the off-diagonal values of r3. Theseresults suggest that more than one FD processes may be active in the actual SC synapse.
Under 1mM [Ca2+]o condition, the r2 values of the experimentally-derived non-parametricmodel exhibit a complex shape that contains at least two exponentials (Fig. 4, bottom row),while the r2 values for the FIT-FD and RIT-FD models exhibit single exponential shapes (withcomparable time constants of 107 and 103 ms, respectively). This result again suggests thatthe parametric FD model oversimplifies the facilitation process. In terms of the 3rd-order RD,the r3 values of the experimentally-derived non-parametric model are much stronger andexhibit a more complex shape than its FD-model counterparts. The diagonal slice of r3 exhibitsa triphasic form with strong depression for short IPIs and weak depression for long IPIs, whileboth FD-model counterparts have a single exponential shape with negligible depression at shortIPIs (notably the RIT-FD model exhibits very small values for all IPIs).
In order to compare quantitatively the predictive capability of the various models, we computethe NRMSE of the output prediction for Poisson RIT inputs. Results show that, under both[Ca2+]o conditions, the predictions of the experimentally-derived non-parametric models aresignificantly more accurate than the corresponding FD models (paired t-test, P < 0.01), andthe RIT-FD models are more accurate than the corresponding FIT-FD models (paired t-test,P<0.01). Since the RIT-FD models and the experimentally-derived non-parametric models areestimated from the same input–output datasets, their difference in NRMSE is solely due totheir different model configurations. The FIT-FD models have the same model configurationwith the RIT-FD models but different parameter values that were estimated from the FIT input–output datasets, thus the fact that the RIT-FD model performs better than the FIT-FD modelis a result of the greater “richness” of the RIT datasets that contain a vastly broader variety ofinput (and consequently output) patterns.
It is evident from these results that the current parametric FD model cannot account for all thenonlinear dynamics captured by the 3rd-order non-parametric model for RIT inputs.
Song et al. Page 10
J Comput Neurosci. Author manuscript; available in PMC 2009 September 23.
NIH
-PA Author Manuscript
NIH
-PA Author Manuscript
NIH
-PA Author Manuscript
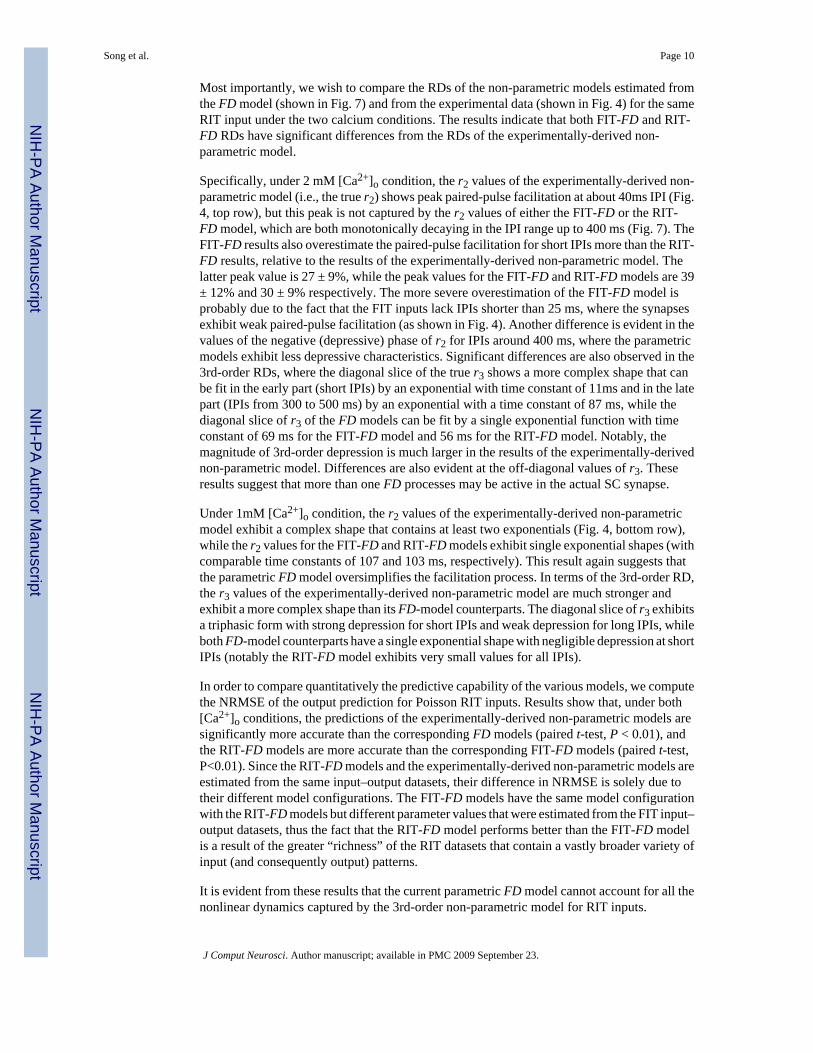
3.2.2 Modification of the parametric FD model—Based on the above experimental andsimulation results, it appears necessary to augment the parametric FD model by including asecond FD process with different residual calcium time constants (τF and τD). The resulting“double-process FD model” of the STP dynamics in SC synapses incorporates two sets offacilitation/depression mechanisms that are driven by two different residual calcium dynamics(fast-decaying calcium and slow-decaying calcium). The FD process with fast calciumdynamics is denoted as “fast FD process”, while the other is named “slow FD process”. Notefast/slow residual calcium dynamics do not necessary result in fast/slow FD dynamics, sincethe latter are mainly determined by the other key model parameters. These key parameters(e.g., the initial release probabilities and recovery rates) are estimated and shown in Table 3.As shown in Eq. (5), the total release probability can be represented as the weighted linearsummation of the release probabilities of the two processes.
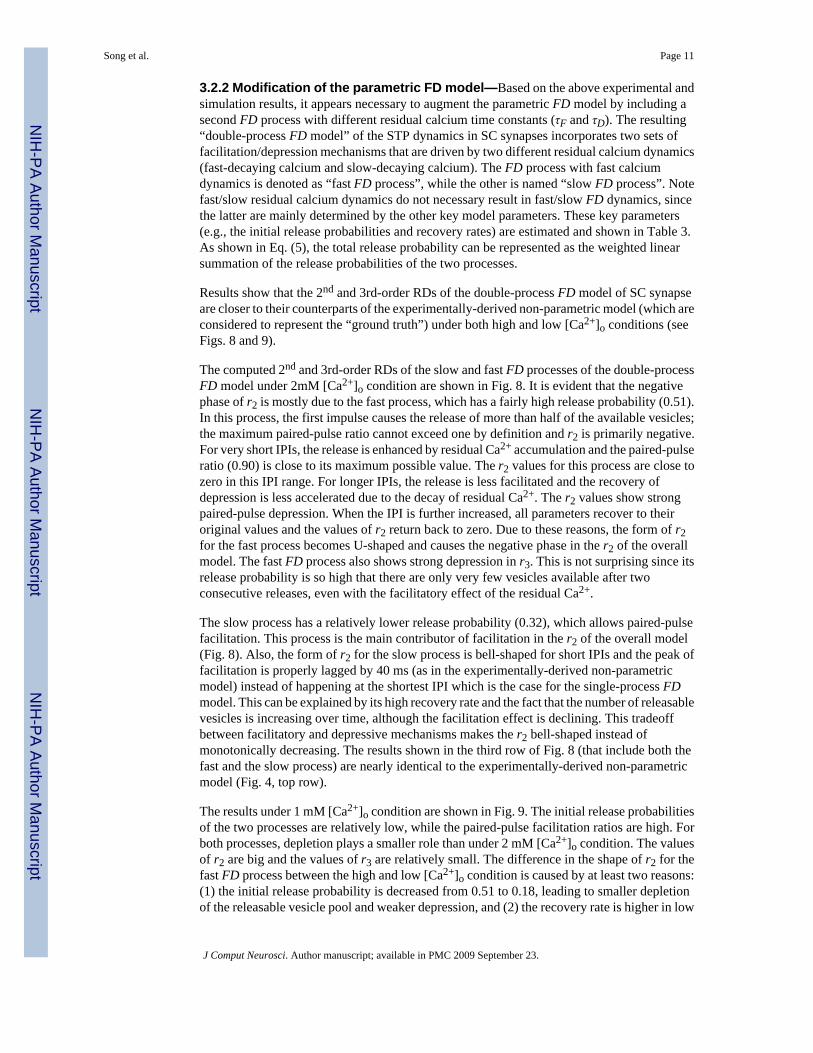
Results show that the 2nd and 3rd-order RDs of the double-process FD model of SC synapseare closer to their counterparts of the experimentally-derived non-parametric model (which areconsidered to represent the “ground truth”) under both high and low [Ca2+]o conditions (seeFigs. 8 and 9).
The computed 2nd and 3rd-order RDs of the slow and fast FD processes of the double-processFD model under 2mM [Ca2+]o condition are shown in Fig. 8. It is evident that the negativephase of r2 is mostly due to the fast process, which has a fairly high release probability (0.51).In this process, the first impulse causes the release of more than half of the available vesicles;the maximum paired-pulse ratio cannot exceed one by definition and r2 is primarily negative.For very short IPIs, the release is enhanced by residual Ca2+ accumulation and the paired-pulseratio (0.90) is close to its maximum possible value. The r2 values for this process are close tozero in this IPI range. For longer IPIs, the release is less facilitated and the recovery ofdepression is less accelerated due to the decay of residual Ca2+. The r2 values show strongpaired-pulse depression. When the IPI is further increased, all parameters recover to theiroriginal values and the values of r2 return back to zero. Due to these reasons, the form of r2for the fast process becomes U-shaped and causes the negative phase in the r2 of the overallmodel. The fast FD process also shows strong depression in r3. This is not surprising since itsrelease probability is so high that there are only very few vesicles available after twoconsecutive releases, even with the facilitatory effect of the residual Ca2+.
The slow process has a relatively lower release probability (0.32), which allows paired-pulsefacilitation. This process is the main contributor of facilitation in the r2 of the overall model(Fig. 8). Also, the form of r2 for the slow process is bell-shaped for short IPIs and the peak offacilitation is properly lagged by 40 ms (as in the experimentally-derived non-parametricmodel) instead of happening at the shortest IPI which is the case for the single-process FDmodel. This can be explained by its high recovery rate and the fact that the number of releasablevesicles is increasing over time, although the facilitation effect is declining. This tradeoffbetween facilitatory and depressive mechanisms makes the r2 bell-shaped instead ofmonotonically decreasing. The results shown in the third row of Fig. 8 (that include both thefast and the slow process) are nearly identical to the experimentally-derived non-parametricmodel (Fig. 4, top row).
The results under 1 mM [Ca2+]o condition are shown in Fig. 9. The initial release probabilitiesof the two processes are relatively low, while the paired-pulse facilitation ratios are high. Forboth processes, depletion plays a smaller role than under 2 mM [Ca2+]o condition. The valuesof r2 are big and the values of r3 are relatively small. The difference in the shape of r2 for thefast FD process between the high and low [Ca2+]o condition is caused by at least two reasons:(1) the initial release probability is decreased from 0.51 to 0.18, leading to smaller depletionof the releasable vesicle pool and weaker depression, and (2) the recovery rate is higher in low
Song et al. Page 11
J Comput Neurosci. Author manuscript; available in PMC 2009 September 23.
NIH
-PA Author Manuscript
NIH
-PA Author Manuscript
NIH
-PA Author Manuscript
rather than in high [Ca2+]o condition. The second reason is seemingly contradictory to theresidual calcium-dependent recovery hypothesis, which suggests that the recovery fromdepletion is positively correlated to the residual calcium concentration–lower [Ca2+]o thenshould cause slower, instead of faster, recovery rate. However, it must be noted that these tworecovery rates are estimated with different initial release probabilities that may have differentlevels of the “energy barrier” between the depleted and resting states (i.e., it is likely that thelow initial release probability state is easier to recover from the depleted state than the highinitial release probabilities state). The slow FD process has a positive slow-decaying r2 and anegative but relatively small r3 due to the enhanced recovery rate. The high recovery rateprevents the values of r3 from having a slow and negative component, which is indeed notobserved in the experimental data. The overall r2 caused by these two FD processes (Fig. 9,third row) shows a shape similar to its non-parametric counterpart (Fig. 4, bottom row), whilethe overall r3 values still retain some differences between the non-parametric model and theparametric double-process FD model.
4 DiscussionIn this study, the nonlinear dynamics of STP in hippocampal SC synapses are characterizedusing a non-parametric Poisson–Volterra (PV) model obtained directly from experimentalinput–output data collected during Poisson random-interval train (RIT) stimulation. The modelprovides better prediction of the output data than a parametric facilitation/depression (FD)model. The implication of this finding is that the experimentally-derived non-parametric modelcaptures better the nonlinear dynamic characteristics of synaptic transmission and constitutesa more complete functional description of the biological processes involved. Consequently,we used this non-parametric model as the “ground truth” for assessing quantitatively theadequacy of the aforementioned parametric model and to explore ways of improving theparametric model by including additional terms/parameters that represent additional biologicalprocesses involved in synaptic transmission. This task was achieved by estimating andevaluating the non-parametric surrogates of the parametric model. Evaluation of the surrogatesusing the experimentally-derived non-parametric model suggested a double-processmechanism of STP in SC synapse comprising a fast-calcium FD process and a slow-calciumFD process.
Both the low (1 mM) and high (2 mM) [Ca2+]o condition results suggest such double-processmechanism. As we know, STP is determined by facilitation and depression: facilitation is thesynaptic enhancement caused by the action of calcium remaining in the presynaptic terminalafter preceding action potential(s); depression is simply caused by the depletion of the pool ofrelease-ready transmitter vesicles. With low [Ca2+]o and the subsequent small initial releaseprobability, only a small portion of the transmitter vesicles are released after a stimulus. Thesize of the release-ready vesicle pool remains relatively constant and the effect of the depletion-dependent depression was weak. STP under this condition thus primarily reflects the dynamicsof facilitation. This is verified by the prominent positive r2 and small negative r3 in the PVmodel under low [Ca2+]o condition. The double-exponential shape r2 suggests that there aretwo distinct processes of facilitation.
When the [Ca2+]o is elevated, the initial release probability of synapses is increased; depletionmechanism is more involved and the PV model reflects the interplay of both facilitation anddepression. Both r2 and r3 under high [Ca2+]o condition show patterns distinct from those underlow [Ca2+]o condition. Interestingly, the two processes show different levels of sensitivity tothe [Ca2+]o elevation: in the short inter-impulse intervals where the fast process is involved,r2 is almost reversed and shows very weak facilitation in the high [Ca2+]o condition; r3 becomesignificant and shows strong depression. By contrast, in the longer inter-impulse intervalswhere the slow process is more involved, r2 and r3 are not dramatically changed. These results
Song et al. Page 12
J Comput Neurosci. Author manuscript; available in PMC 2009 September 23.
NIH
-PA Author Manuscript
NIH
-PA Author Manuscript
NIH
-PA Author Manuscript
suggest that the fast FD process is more sensitive to the [Ca2+]o elevation than the slow FDprocess.
Double-process facilitation in STP has been reported in a variety of synapses from differentspecies (Eccles et al. 1941; Zengel et al. 1980; Gage and Murphy 1981; Zengel and Magleby1982). To our knowledge, this study is the first to suggest its existence in hippocampal synapsesof the rat. There are several reasons why this mechanism may have been overlooked by previousstudies with traditional paired-pulse or fixed-interval stimulation protocols, but not by this one.First, instead of directly measuring the paired-pulse facilitation as a function of inter-impulseinterval, in this study, the 2nd-order RD, r2, (which is equivalent to the paired-pulsemodification function) is computed from the estimated PV kernels of the non-parametric modelthat is obtained from broadband RIT data where the intervals between impulses are randomlyvarying, while the traditional paired-pulse or fixed-interval train protocols only include a smallsubset of possible input patterns. RIT allows to capture the fine details of the STP pattern.Secondly, the STP dynamics of SC synapses are investigated under two calcium conditions inthis study, making the differences between the two processes more visible by comparing theresults under these two conditions. Lastly, when the STP dynamics are studied using paired-pulse or fixed-interval train protocols, some transient mechanisms may have been mixed withfacilitation and depression due to the non-stationary nature of these protocols. By contrast, inthe non-parametric approach the model was estimated with RIT data that do not alter thestationarity of the system.
There could be multiple ways of modifying the parametric FD model to better fit theexperimentally-identified nonlinear dynamics. We propose the double-process FD model forthe following two reasons: First, the double-process FD model introduces minimal extensionof the FD model in terms of the modeled mechanisms and dynamic processes (but not minimalnumber of extra open parameters). Additional model parameters can be readily explained usingthe existing residual calcium-facilitation/depression framework, which is supported by manyother independent studies. Second, there are experimental evidences suggesting the existenceof two types of synapses. Using minimal stimulation protocol, Hanse and Gustafsson recordedsingle CA1 synapses and showed their heterogeneity in initial release probability (Hanse andGustafsson 2001b). Furthermore, the distribution of initial release probability had two peaks,which is consistent with our double-process FD model. Despite these reasons, however, itshould be pointed out that, although the double-process FD model accurately replicates theexperimentally-identified STP nonlinear dynamics under two calcium conditions, it still shouldnot be considered as a conclusive representation of the CA1 synapse. For example, this studydoes not rule out the possibility of having a more complex residual calcium dynamics and/ordifferent types of active zones in a single synapse (as opposed to different types of synapses),since it is carried out at the synaptic population EPSC level. Instead, as a parametric model,our double-process FD model provides new mechanistic predictions/hypotheses, e.g., therelations between initial release probability, paired-pulse facilitation ratio, and recovery rate(Table 3), that can be tested with further studies, e.g., recording and modeling of singlesynapses.
Besides transmitter vesicle depletion, another mechanism that can cause use-dependentdepression of synaptic strength is the desensitization of postsynaptic receptors (Jones andWestbrook 1996; Wadiche and Jahr 2001). Consecutive exposure of ligand-gated channels totheir agonist can lead some of the channels to the non-responsive desensitized state. However,consistent with other reports (Hjelmstad et al. 1997; Hashimoto and Kano 1998; Silver et al.1998), this study showed that AMPA receptor desensitization does not play significant role inSTP. The negative-going component in r2 under high [Ca2+]o condition was not blocked bythe AMPA receptor desensitization blocker CTZ. This component was more likely due to thenonlinear dynamics in the presynaptic regions. Previous experiments have shown that profound
Song et al. Page 13
J Comput Neurosci. Author manuscript; available in PMC 2009 September 23.
NIH
-PA Author Manuscript
NIH
-PA Author Manuscript
NIH
-PA Author Manuscript
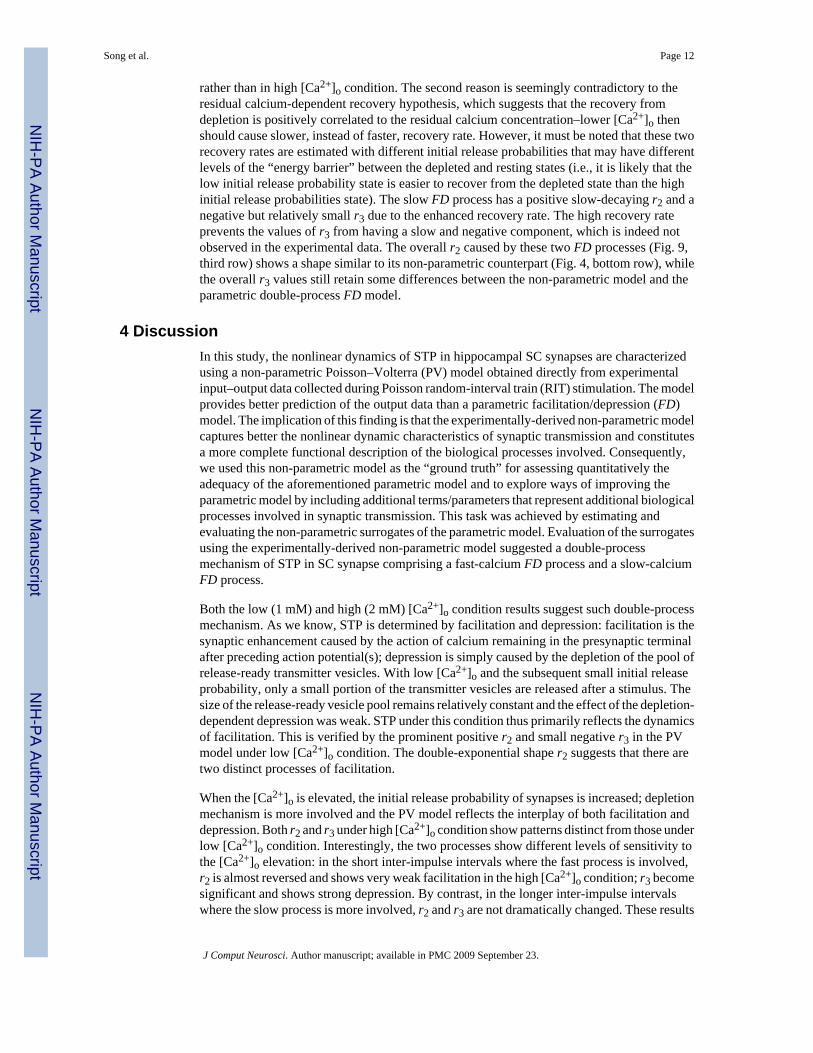
desensitization of AMPA receptor occurred on miniature excitatory postsynaptic currents(mEPSC) elicited by brief pulses of glutamate (Trussell and Fischbach 1989). Paired-pulseresponses in these studies revealed that desensitization can reduce the amplitude of the secondmEPSC to less than 30% of the amplitude of the first mEPSC with a 6 s inter-impulse interval.The time course of recovery of the second mEPSC in a pair could be fitted by a simpleexponential curve with a time constant of 9.2 ms. However, such strong depression was notreflected in the estimated PV kernels or RDs of our non-parametric model. This apparentdiscrepancy could be reconciled by taking into account the stochastic nature of transmitterrelease. Hippocampal SC synapses, as well as other central synapses, tend to haveextraordinarily low release probabilities. The average initial release probability was estimatedto be around 0.3. This means that the probability of postsynaptic AMPA receptors beingexposed to consecutive transmitter releases is very small (the probability of release over twoconsecutive pulses is 0.09). This situation is distinct from the paired glutamate pulseexperiment in which desensitization always occurs (Fig. 10).
Previous studies also showed the existence of depletion-independent mechanisms ofdepression in the synaptic STP (Hsu et al. 1996; Dobrunz et al. 1997; Kraushaar and Jonas2000; Waldeck et al. 2000; Gover et al. 2002; Kirischuk et al. 2002; Pedroarena and Schwarz2003; Fuhrmann et al. 2004). These forms of depression mechanisms are not included in thepresent parametric modeling, but potentially can be added to better explain the obtained STPdynamics. For example, the double-process FD model still underestimates the paired-pulsedepression in short IPIs under high [Ca2+]o condition (Fig. 8, bottom-left), compared to theexperimental data (Fig. 4, top-left). This discrepancy is likely to be caused by the lack of suchmechanisms (e.g., inactivation of presynaptic N-type Ca2+ channels shown by Dobrunz et al.)in the parametric model. Indeed, the proposed combined parametric/non-parametric modelingstrategy should be used iteratively for the discoveries and characterizations of new underlyingmechanisms.
In summary, the main result of this study is the corroborated proposition that an experimentally-derived non-parametric model constitutes a rigorous quantitative tool for assessing the input–output property of any proposed model and provides the quantitative means to guide the mannerin which possible improvements of a parametric model can be achieved by inclusion ofadditional terms/parameters (representing additional biological processes). This issue wasexamined here in the context of synaptic transmission in the hippocampus but has broadapplicability to all neuronal systems. Therefore, this study may serve as an experimental/modeling paradigm for other applications in the context of systems neuroscience.
AcknowledgmentsThis research was supported by the NSF ERC (BMES), DARPA (HAND), ONR, NSF (BITS), and NIH/NIBIB(BMSR). We thank the two anonymous reviewers for their insightful comments on this manuscript.
ReferencesBerger TW, Chauvet G, Sclabassi RJ. A biological based model of functional properties of the
hippocampus. Neural Networks 1994;7:1031–1064.Berger TW, Eriksson JL, Ciarolla DA, Sclabassi RJ. Nonlinear systems analysis of the hippocampal
perforant path-dentate projection. II. Effects of random impulse train stimulation. Journal ofNeurophysiology 1988a;60:1076–1094. [PubMed: 3171657]
Berger TW, Eriksson JL, Ciarolla DA, Sclabassi RJ. Nonlinear systems analysis of the hippocampalperforant path-dentate projection. III. Comparison of random train and paired impulse stimulation.Journal of Neurophysiology 1988b;60:1095–1109. [PubMed: 3171658]
Bishop, CM. Neural networks for pattern recognition. Oxford: Oxford University Press; 1995.
Song et al. Page 14
J Comput Neurosci. Author manuscript; available in PMC 2009 September 23.
NIH
-PA Author Manuscript
NIH
-PA Author Manuscript
NIH
-PA Author Manuscript
Clements JD, Lester RA, Tong G, Jahr CE, Westbrook GL. The time course of glutamate in the synapticcleft. Science 1992;258:1498–1501. [PubMed: 1359647]
Creager R, Dunwiddie T, Lynch G. Paired-pulse and frequency facilitation in the CA1 region of the invitro rat hippocampus. Journal of Physiology 1980;299:409–424. [PubMed: 7381775]
Dittman JS, Kreitzer AC, Regehr WG. Interplay between facilitation, depression, and residual calciumat three presynaptic terminals. Journal of Neuroscience 2000;20:1374–1385. [PubMed: 10662828]
Dobrunz LE, Huang EP, Stevens CF. Very short-term plasticity in hippocampal synapses. Proceedingsof the National Academy of Sciences of the United States of America 1997;94:14843–14847.[PubMed: 9405701]
Dobrunz LE, Stevens CF. Heterogeneity of release probability, facilitation, and depletion at centralsynapses. Neuron 1997;18:995–1008. [PubMed: 9208866]
Eccles JC, Katz B, Kuffler SW. Nature of the endplate potential in curarized muscle. Journal ofNeurophysiology 1941;4:362–387.
Fuhrmann G, Cowan A, Segev I, Tsodyks M, Stricker C. Multiple mechanisms govern the dynamics ofdepression at neocortical synapses of young rats. Journal of Physiology 2004;557:415–438.[PubMed: 15020700]
Gage PW, Murphy EC. Facilitation of acetylcholine secretion at a mouse neuromuscular junction. BrainResearch 1981;204:327–337. [PubMed: 6257326]
Gover TD, Jiang XY, Abrams TW. Persistent, exocytosis-independent silencing of release sites underlieshomosynaptic depression at sensory synapses in Aplysia. Journal of Neuroscience 2002;22:1942–1955. [PubMed: 11880525]
Hanse E, Gustafsson B. Factors explaining heterogeneity in short-term synaptic dynamics of hippocampalglutamatergic synapses in the neonatal rat. Journal of Physiology 2001a;537:141–149. [PubMed:11711568]
Hanse E, Gustafsson B. Vesicle release probability and pre-primed pool at glutamatergic synapses in areaCA1 of the rat neonatal hippocampus. Journal of Physiology 2001b;531:481–493. [PubMed:11230520]
Hashimoto K, Kano M. Presynaptic origin of paired-pulse depression at climbing fibre-Purkinje cellsynapses in the rat cerebellum. Journal of Physiology 1998;506:391–405. [PubMed: 9490867]
Hjelmstad GO, Nicoll RA, Malenka RC. Synaptic refractory period provides a measure of probability ofrelease in the hippocampus. Neuron 1997;19:1309–1318. [PubMed: 9427253]
Hsu SF, Augustine GJ, Jackson MB. Adaptation of Ca(2+)-triggered exocytosis in presynaptic terminals.Neuron 1996;17:501–512. [PubMed: 8816713]
Jones MV, Westbrook GL. The impact of receptor desensitization on fast synaptic transmission. Trendsin Neurosciences 1996;19:96–101. [PubMed: 9054063]
Kirischuk S, Clements JD, Grantyn R. Presynaptic and postsynaptic mechanisms underlie paired pulsedepression at single GABAergic boutons in rat collicular cultures. Journal of Physiology2002;543:99–116. [PubMed: 12181284]
Kraushaar U, Jonas P. Efficacy and stability of quantal GABA release at a hippocampal interneuron-principal neuron synapse. Journal of Neuroscience 2000;20:5594–5607. [PubMed: 10908596]
Krausz HI, Friesen WO. The analysis of nonlinear synaptic transmission. Journal of General Physiology1977;70:243–265. [PubMed: 197201]
Marmarelis VZ. Identification of nonlinear biological systems using Laguerre expansions of kernels.Annals of Biomedical Engineering 1993;21:573–589. [PubMed: 8116911]
Marmarelis, VZ. Nonlinear dynamic modeling of physiological systems. Hoboken: Wiley; 2004.Marmarelis VZ, Berger TW. General methodology for nonlinear modeling of neural systems with Poisson
point-process inputs. Mathematical Biosciences 2005;196:1–13. [PubMed: 15963534]Marmarelis, VZ.; Marmarelis, PZ. Analysis of physiological systems: the white-noise approach. New
York: Plenum; 1978.Mody I, Lambert JD, Heinemann U. Low extracellular magnesium induces epileptiform activity and
spreading depression in rat hippocampal slices. Journal of Neurophysiology 1987;57:869–888.[PubMed: 3031235]
Song et al. Page 15
J Comput Neurosci. Author manuscript; available in PMC 2009 September 23.
NIH
-PA Author Manuscript
NIH
-PA Author Manuscript
NIH
-PA Author Manuscript
Pedroarena CM, Schwarz C. Efficacy and short-term plasticity at GABAergic synapses between Purkinjeand cerebellar nuclei neurons. Journal of Neurophysiology 2003;89:704–715. [PubMed: 12574448]
Rahamimoff R. A dual effect of calcium ions on neuromuscular facilitation. Journal of Physiology1968;195:471–480. [PubMed: 4296698]
Sclabassi RJ, Eriksson JL, Port RL, Robinson GB, Berger TW. Nonlinear systems analysis of thehippocampal perforant path-dentate projection. I. Theoretical and interpretational considerations.Journal of Neurophysiology 1988;60:1066–1076. [PubMed: 3171656]
Silver RA, Momiyama A, Cull-Candy SG. Locus of frequency-dependent depression identified withmultiple-probability fluctuation analysis at rat climbing fibre-Purkinje cell synapses. Journal ofPhysiology 1998;510:881–902. [PubMed: 9660900]
Stevens CF, Wang Y. Facilitation and depression at single central synapses. Neuron 1995;14:795–802.[PubMed: 7718241]
Trussell LO, Fischbach GD. Glutamate receptor desensitization and its role in synaptic transmission.Neuron 1989;3:209–218. [PubMed: 2576213]
Wadiche JI, Jahr CE. Multivesicular release at climbing fiber-Purkinje cell synapses. Neuron2001;32:301–313. [PubMed: 11683999]
Waldeck RF, Pereda A, Faber DS. Properties and plasticity of paired-pulse depression at a central synapse.Journal of Neuroscience 2000;20:5312–5320. [PubMed: 10884315]
Yamada KA, Tang CM. Benzothiadiazides inhibit rapid glutamate receptor desensitization and enhanceglutamatergic synaptic currents. Journal of Neuroscience 1993;13:3904–3915. [PubMed: 8103555]
Zengel JE, Magleby KL. Augmentation and facilitation of transmitter release. A quantitative descriptionat the frog neuromuscular junction. Journal of General Physiology 1982;80:583–611. [PubMed:6128372]
Zengel JE, Magleby KL, Horn JP, McAfee DA, Yarowsky PJ. Facilitation, augmentation, andpotentiation of synaptic transmission at the superior cervical ganglion of the rabbit. Journal of GeneralPhysiology 1980;76:213–231. [PubMed: 6251156]
Zucker RS, Regehr WG. Short-term synaptic plasticity. Annual Review of Physiology 2002;64:355–405.
Song et al. Page 16
J Comput Neurosci. Author manuscript; available in PMC 2009 September 23.
NIH
-PA Author Manuscript
NIH
-PA Author Manuscript
NIH
-PA Author Manuscript
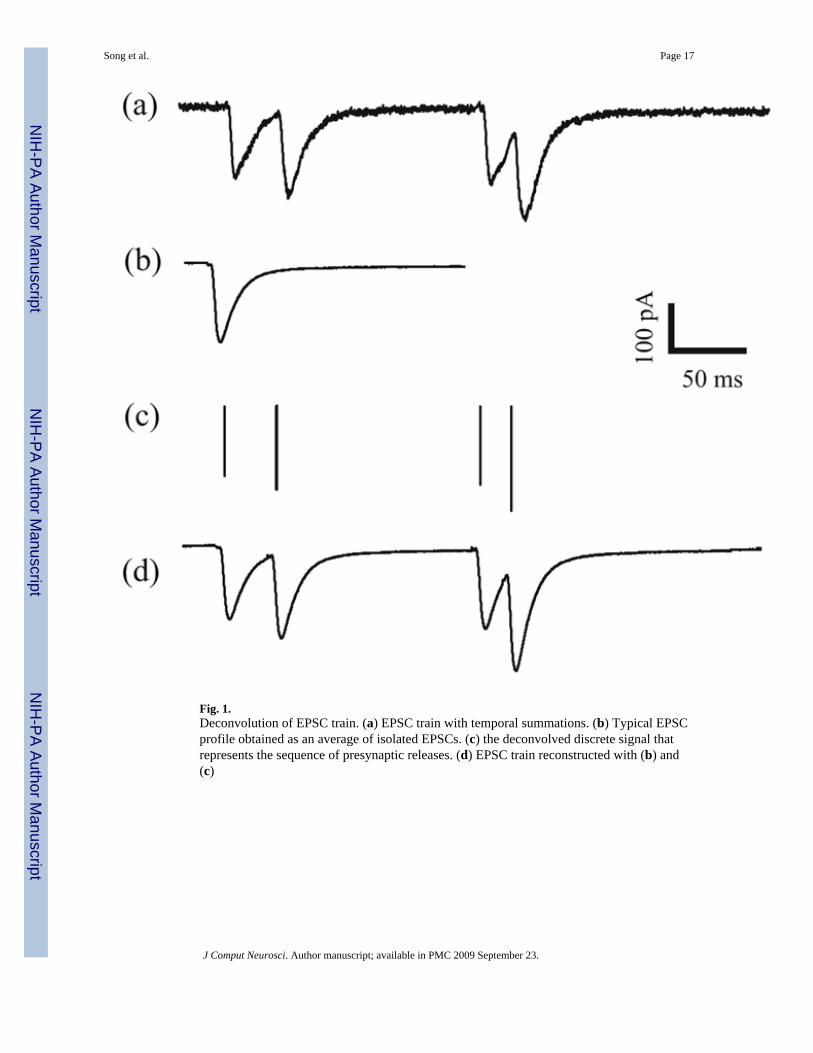
Fig. 1.Deconvolution of EPSC train. (a) EPSC train with temporal summations. (b) Typical EPSCprofile obtained as an average of isolated EPSCs. (c) the deconvolved discrete signal thatrepresents the sequence of presynaptic releases. (d) EPSC train reconstructed with (b) and(c)
Song et al. Page 17
J Comput Neurosci. Author manuscript; available in PMC 2009 September 23.
NIH
-PA Author Manuscript
NIH
-PA Author Manuscript
NIH
-PA Author Manuscript
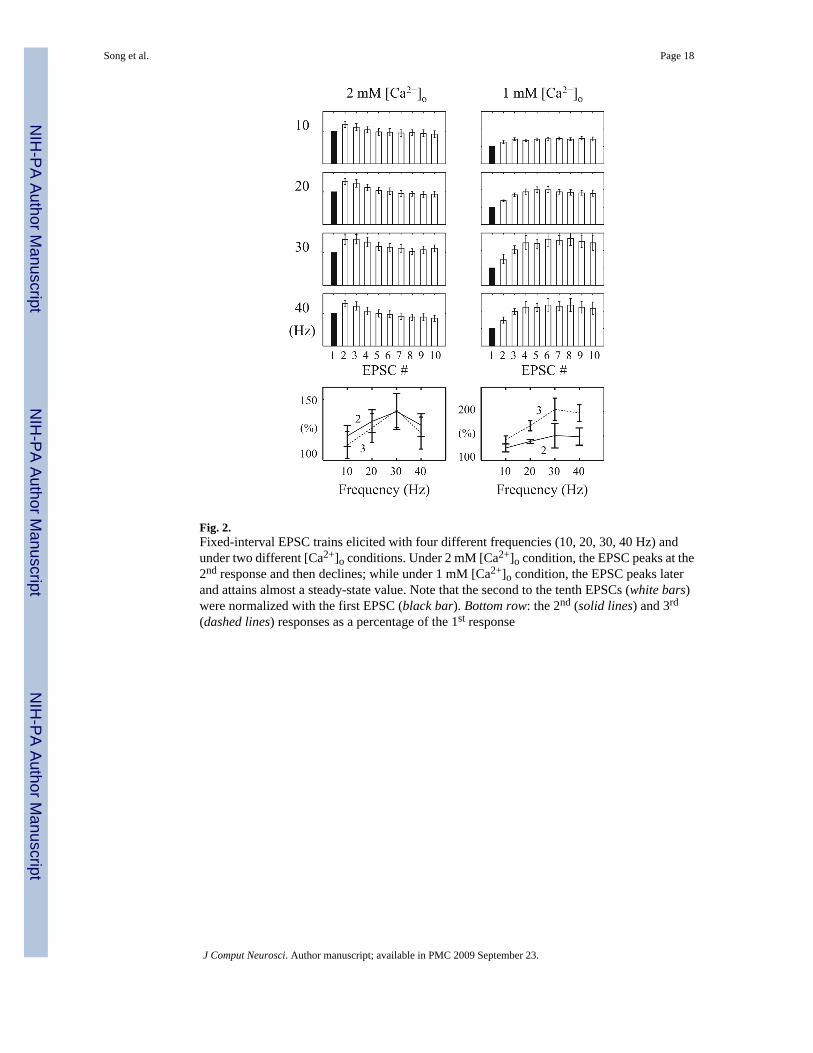
Fig. 2.Fixed-interval EPSC trains elicited with four different frequencies (10, 20, 30, 40 Hz) andunder two different [Ca2+]o conditions. Under 2 mM [Ca2+]o condition, the EPSC peaks at the2nd response and then declines; while under 1 mM [Ca2+]o condition, the EPSC peaks laterand attains almost a steady-state value. Note that the second to the tenth EPSCs (white bars)were normalized with the first EPSC (black bar). Bottom row: the 2nd (solid lines) and 3rd
(dashed lines) responses as a percentage of the 1st response
Song et al. Page 18
J Comput Neurosci. Author manuscript; available in PMC 2009 September 23.
NIH
-PA Author Manuscript
NIH
-PA Author Manuscript
NIH
-PA Author Manuscript
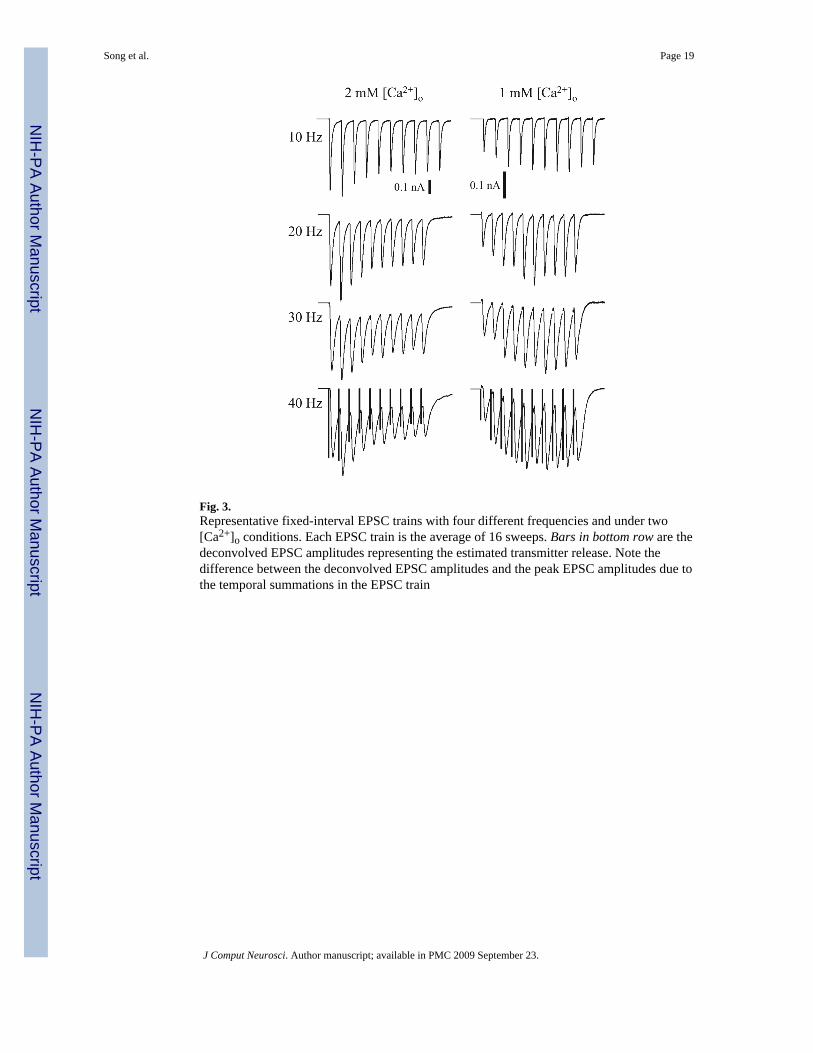
Fig. 3.Representative fixed-interval EPSC trains with four different frequencies and under two[Ca2+]o conditions. Each EPSC train is the average of 16 sweeps. Bars in bottom row are thedeconvolved EPSC amplitudes representing the estimated transmitter release. Note thedifference between the deconvolved EPSC amplitudes and the peak EPSC amplitudes due tothe temporal summations in the EPSC train
Song et al. Page 19
J Comput Neurosci. Author manuscript; available in PMC 2009 September 23.
NIH
-PA Author Manuscript
NIH
-PA Author Manuscript
NIH
-PA Author Manuscript
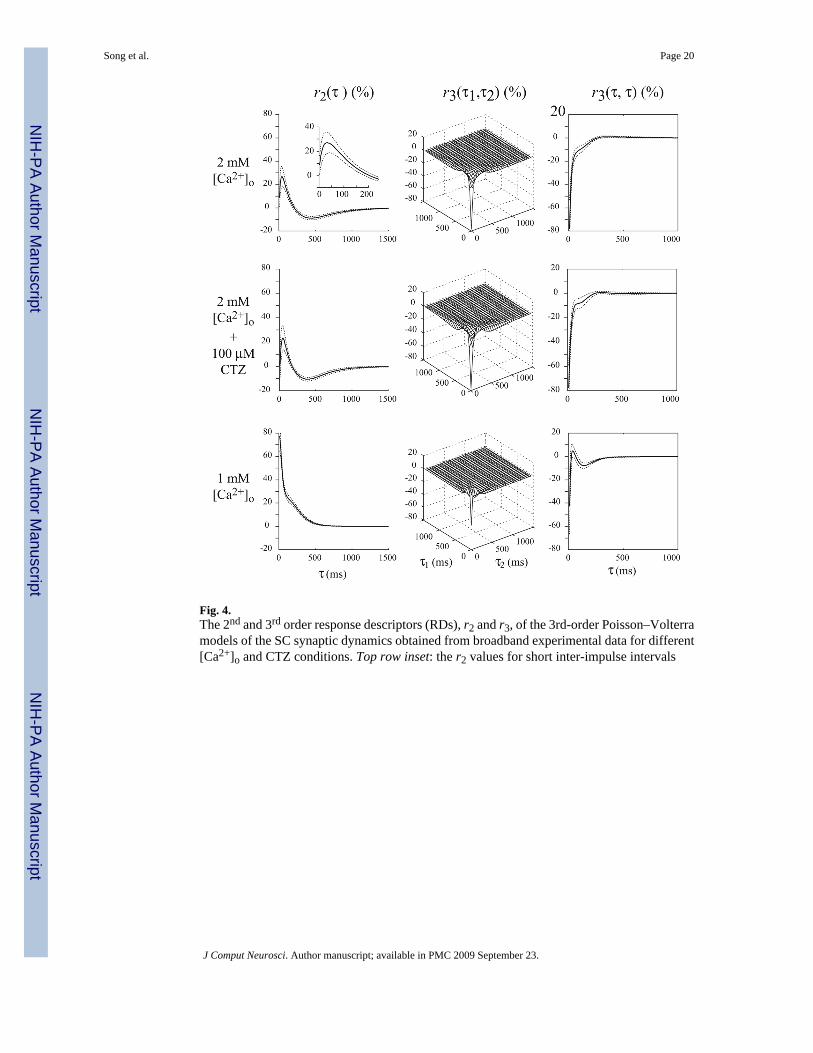
Fig. 4.The 2nd and 3rd order response descriptors (RDs), r2 and r3, of the 3rd-order Poisson–Volterramodels of the SC synaptic dynamics obtained from broadband experimental data for different[Ca2+]o and CTZ conditions. Top row inset: the r2 values for short inter-impulse intervals
Song et al. Page 20
J Comput Neurosci. Author manuscript; available in PMC 2009 September 23.
NIH
-PA Author Manuscript
NIH
-PA Author Manuscript
NIH
-PA Author Manuscript
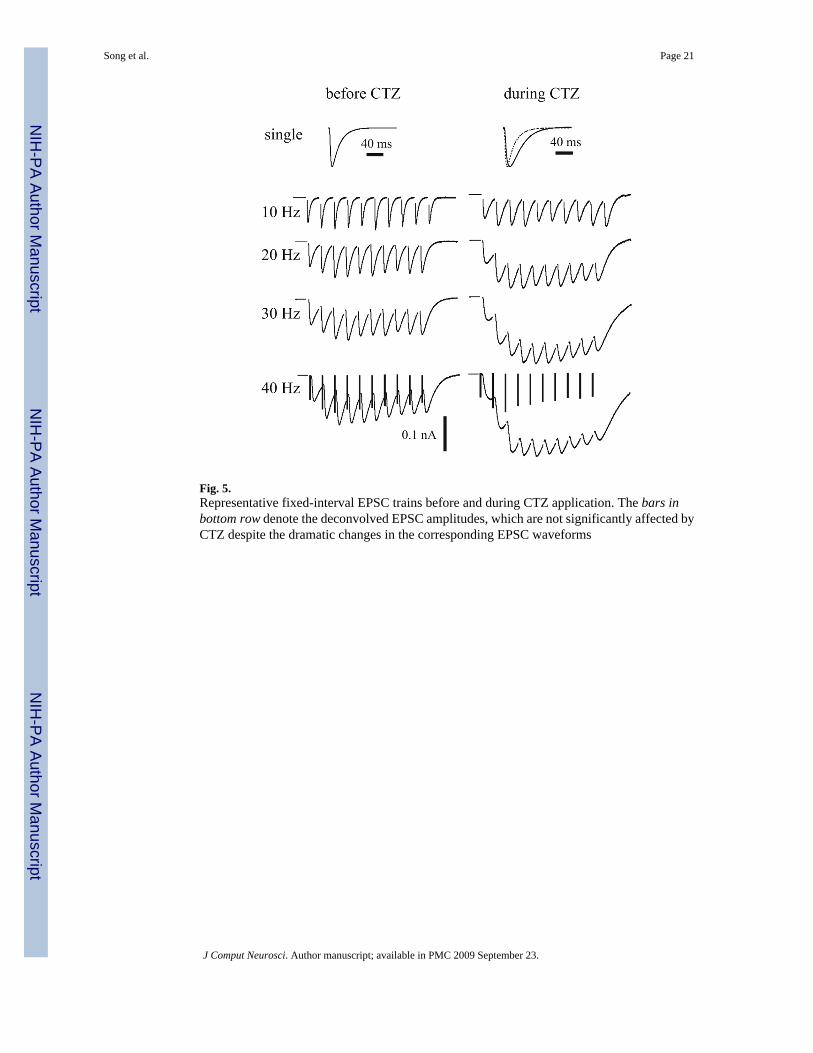
Fig. 5.Representative fixed-interval EPSC trains before and during CTZ application. The bars inbottom row denote the deconvolved EPSC amplitudes, which are not significantly affected byCTZ despite the dramatic changes in the corresponding EPSC waveforms
Song et al. Page 21
J Comput Neurosci. Author manuscript; available in PMC 2009 September 23.
NIH
-PA Author Manuscript
NIH
-PA Author Manuscript
NIH
-PA Author Manuscript
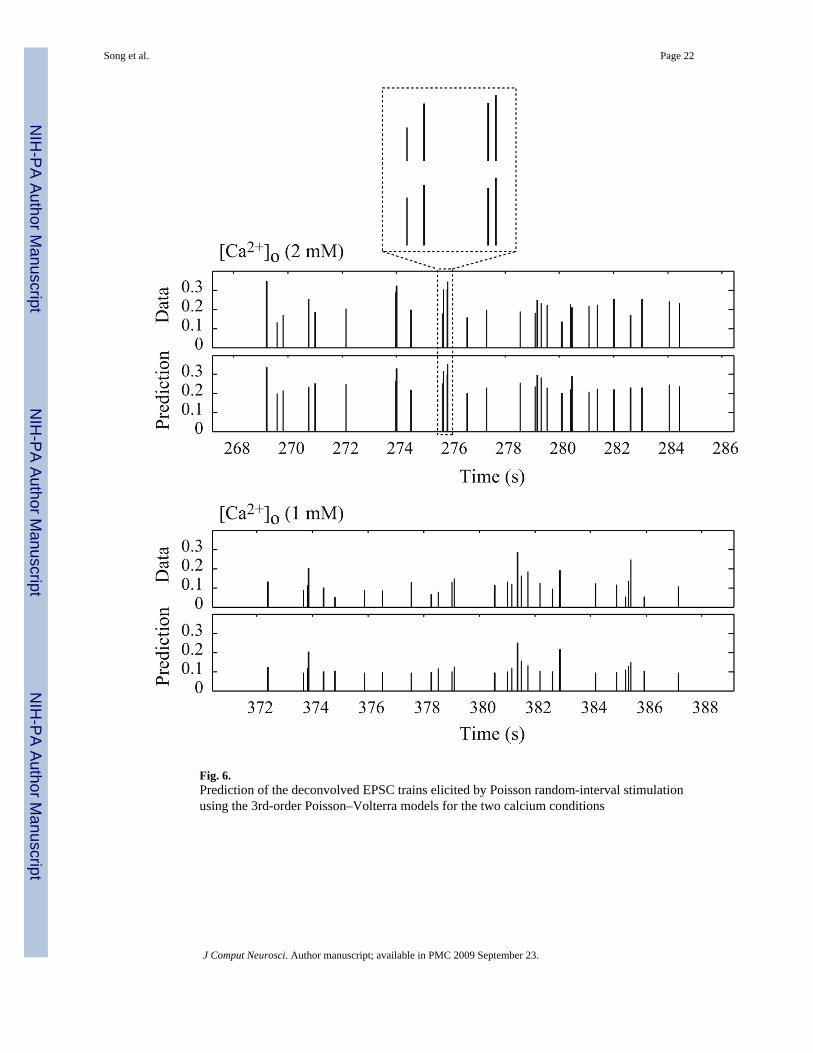
Fig. 6.Prediction of the deconvolved EPSC trains elicited by Poisson random-interval stimulationusing the 3rd-order Poisson–Volterra models for the two calcium conditions
Song et al. Page 22
J Comput Neurosci. Author manuscript; available in PMC 2009 September 23.
NIH
-PA Author Manuscript
NIH
-PA Author Manuscript
NIH
-PA Author Manuscript
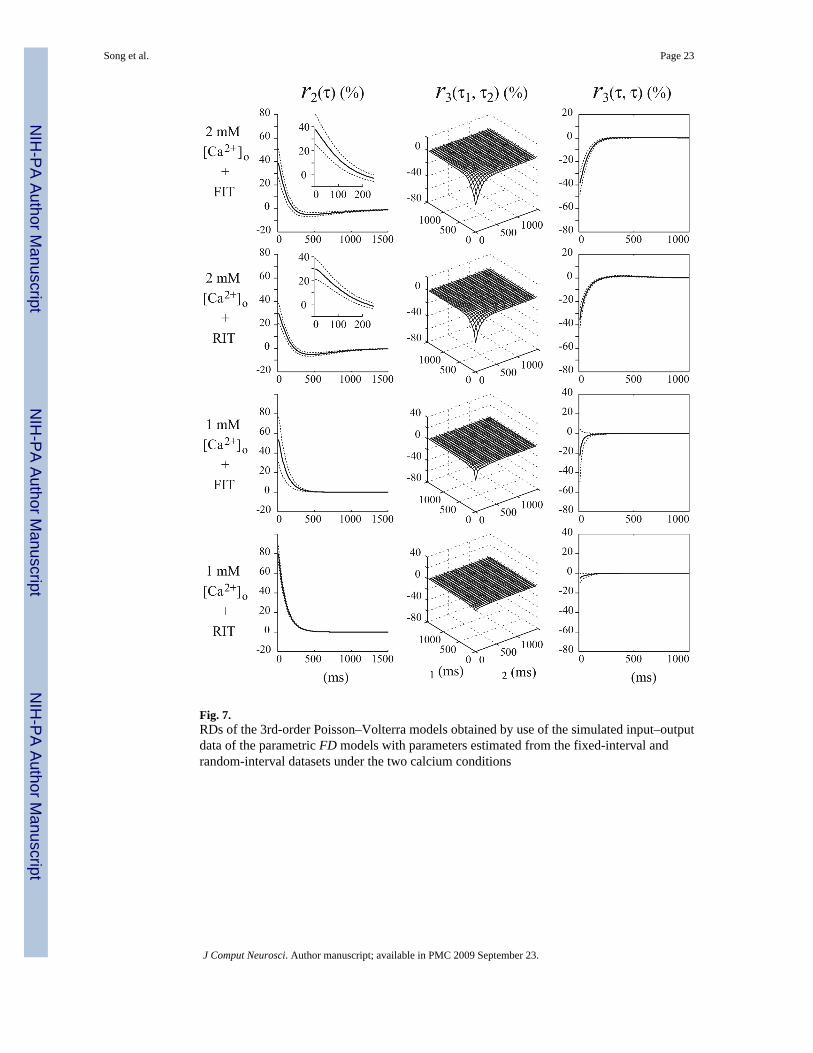
Fig. 7.RDs of the 3rd-order Poisson–Volterra models obtained by use of the simulated input–outputdata of the parametric FD models with parameters estimated from the fixed-interval andrandom-interval datasets under the two calcium conditions
Song et al. Page 23
J Comput Neurosci. Author manuscript; available in PMC 2009 September 23.
NIH
-PA Author Manuscript
NIH
-PA Author Manuscript
NIH
-PA Author Manuscript
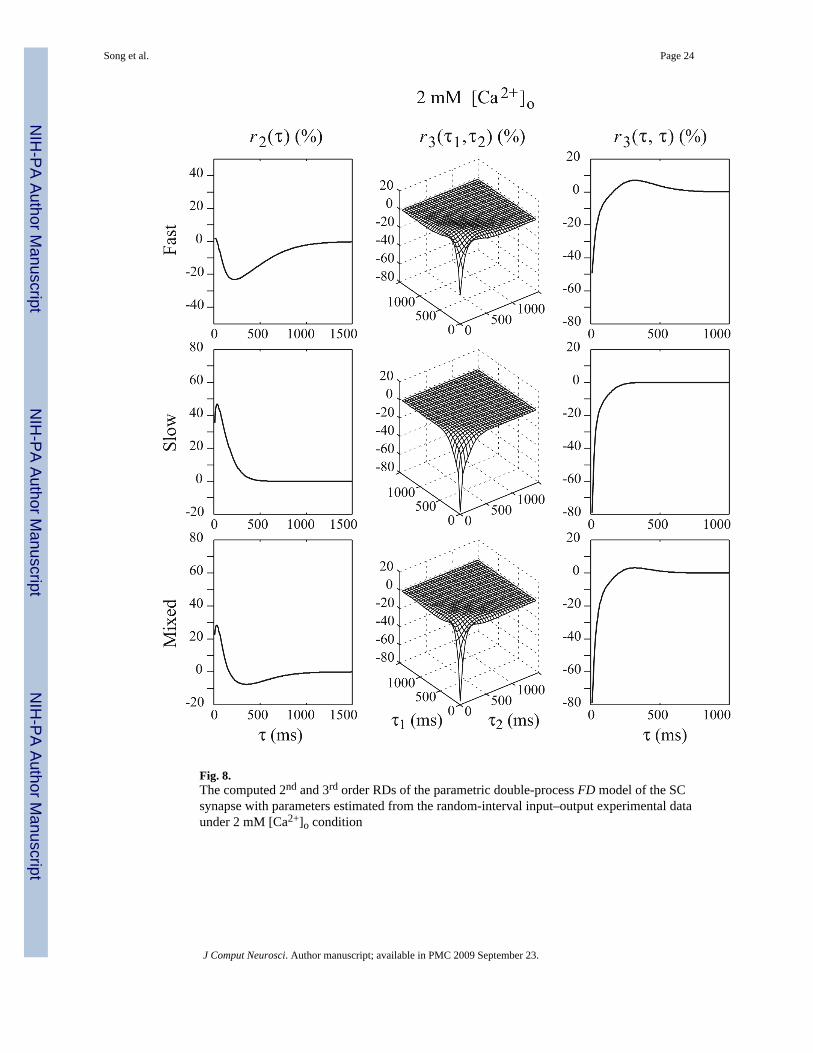
Fig. 8.The computed 2nd and 3rd order RDs of the parametric double-process FD model of the SCsynapse with parameters estimated from the random-interval input–output experimental dataunder 2 mM [Ca2+]o condition
Song et al. Page 24
J Comput Neurosci. Author manuscript; available in PMC 2009 September 23.
NIH
-PA Author Manuscript
NIH
-PA Author Manuscript
NIH
-PA Author Manuscript
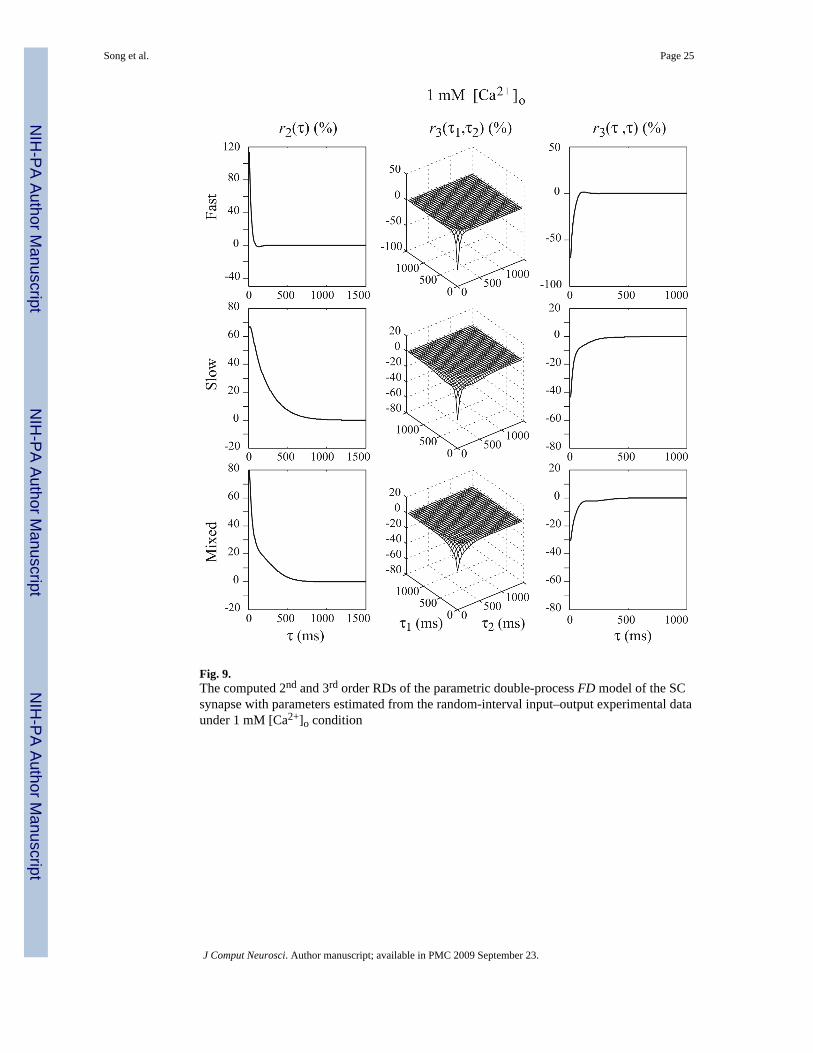
Fig. 9.The computed 2nd and 3rd order RDs of the parametric double-process FD model of the SCsynapse with parameters estimated from the random-interval input–output experimental dataunder 1 mM [Ca2+]o condition
Song et al. Page 25
J Comput Neurosci. Author manuscript; available in PMC 2009 September 23.
NIH
-PA Author Manuscript
NIH
-PA Author Manuscript
NIH
-PA Author Manuscript
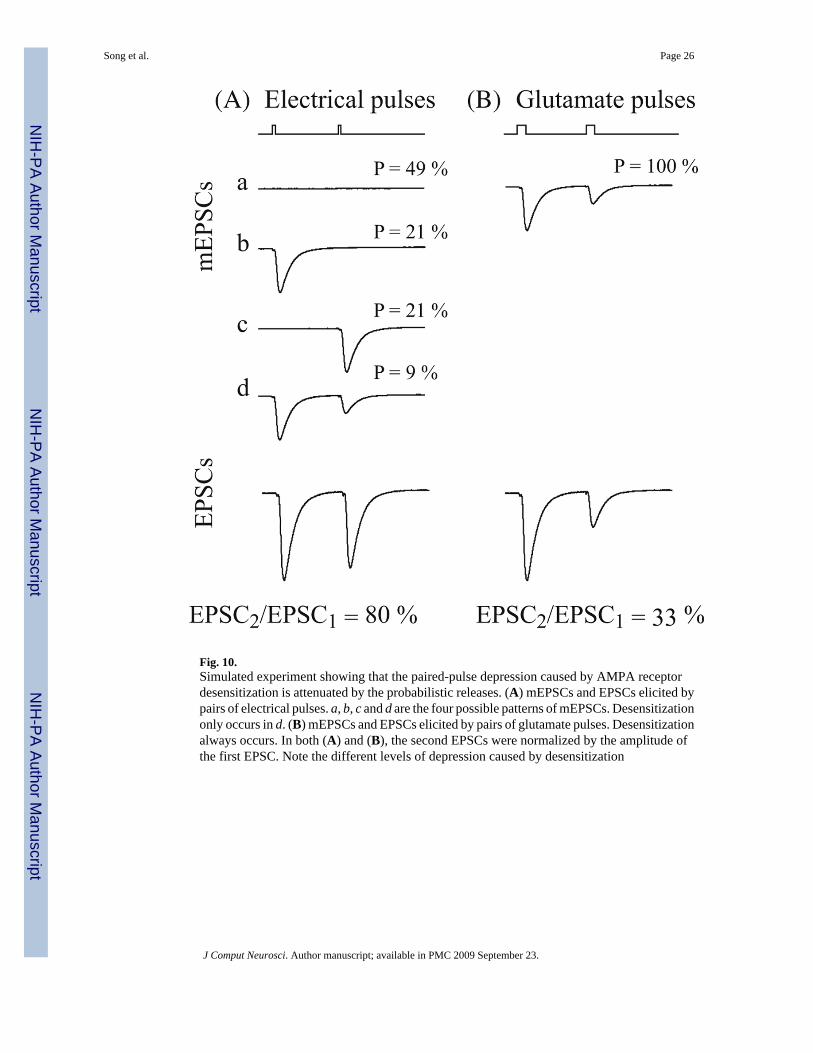
Fig. 10.Simulated experiment showing that the paired-pulse depression caused by AMPA receptordesensitization is attenuated by the probabilistic releases. (A) mEPSCs and EPSCs elicited bypairs of electrical pulses. a, b, c and d are the four possible patterns of mEPSCs. Desensitizationonly occurs in d. (B) mEPSCs and EPSCs elicited by pairs of glutamate pulses. Desensitizationalways occurs. In both (A) and (B), the second EPSCs were normalized by the amplitude ofthe first EPSC. Note the different levels of depression caused by desensitization
Song et al. Page 26
J Comput Neurosci. Author manuscript; available in PMC 2009 September 23.
NIH
-PA Author Manuscript
NIH
-PA Author Manuscript
NIH
-PA Author Manuscript

NIH
-PA Author Manuscript
NIH
-PA Author Manuscript
NIH
-PA Author Manuscript
Song et al. Page 27
Table 1Parameter estimates of the FD model obtained from fixed-interval and random-interval datasets under 2 mM [Ca2+]ocondition, and the resulting prediction NMRSE of the two parametric models
FIT-FD estimates RIT-FD estimates
F1 0.19±0.03 0.26±0.03
ρ 1.42±0.14 1.27±0.08
K0 (s−1) 2.5±0.9 1.2±0.2
kmax (s−1) 13.2±1.4 20.4±2.5
τF (ms) 90 90
τD (ms) 50 50
NRMSE (%) 33±2 28±1
J Comput Neurosci. Author manuscript; available in PMC 2009 September 23.

NIH
-PA Author Manuscript
NIH
-PA Author Manuscript
NIH
-PA Author Manuscript
Song et al. Page 28
Table 2Parameter estimates of the FD model obtained from fixed-interval and random-interval datasets under 1 mM [Ca2+]ocondition, and the resulting prediction NMRSE of the two parametric models
FIT-FD estimates RIT-FD estimates
F1 0.0048±0.0023 0.0027±0.0011
ρ 1.52±0.18 1.91±0.10
K0 (s−1) 385±177 668±34
kmax (s−1) 436±147 309±19
τF (ms) 120 120
τD (ms) 50 50
NRMSE (%) 39±4 29±3
J Comput Neurosci. Author manuscript; available in PMC 2009 September 23.

NIH
-PA Author Manuscript
NIH
-PA Author Manuscript
NIH
-PA Author Manuscript
Song et al. Page 29
Table 3Parameter estimates of the double-process FD model
1 mM [Ca2+]o 2 mM [Ca2+]o
Fast Slow Fast Slow
N 0.4 0.6 0.4 0.6
F1 0.18 0.15 0.51 0.32
ρ 2.5 1.5 0.90 1.2
K0 (s−1) 20 120 1 20
kmax (s−1) 60 130 40 90
τF (ms) 20 200 30 100
τD (ms) 20 50 20 50
J Comput Neurosci. Author manuscript; available in PMC 2009 September 23.