nih public access maureen maguire graham quinn …...associations of anisometropia with unilateral...
TRANSCRIPT
Associations of Anisometropia with Unilateral Amblyopia,Interocular Acuity Difference and Stereoacuity in Preschoolers
Gui-shuang Ying, Jiayan Huang, Maureen Maguire, Graham Quinn, Marjean Taylor Kulp,Elise Ciner, Lynn Cyert, and Deborah Orel-Bixler for the Vision In Preschoolers (VIP) StudyGroup*
AbstractPurpose—To evaluate the relation of anisometropia with unilateral amblyopia, interocular acuitydifference (IAD) and stereoacuity, among Head Start preschoolers, using both clinical notationand vector notation analyses.
Design—Multicenter, cross-sectional study.
Participants—3- to 5-year-old participants in the Vision In Preschoolers (VIP) Study (N=4040).
Methods—Secondary analysis of VIP data from participants who had comprehensive eyeexaminations including monocular visual acuity (VA) testing, stereoacuity testing, and cycloplegicrefraction. VA was retested with full cycloplegic correction when retest criteria were met.Unilateral amblyopia was defined as IAD ≥2 lines in logarithm of the Minimum Angle ofResolution (logMAR). Anisometropia was defined as ≥0.25 D (diopter) difference in sphericalequivalent (SE) or in cylinder power, and also two approaches using power vector notation. Thepercentage with unilateral amblyopia, mean IAD, and mean stereoacuity were compared betweenanisometropic and isometropic children.
Main Outcomes Measures—The percentage with unilateral amblyopia, mean IAD, and meanstereoacuity.
Results—Compared with isometropic children, anisometropic children had a higher percentageof unilateral amblyopia (8% vs. 2%), larger mean IAD (0.07 vs. 0.05 logMAR) and worse meanstereoacuity (145 vs.117 arc sec) (all p<0.0001). Larger amounts of anisometropia were associatedwith higher percentages of unilateral amblyopia, larger IAD, and worse stereoacuity (trendp<0.001). Percentage of unilateral amblyopia was significantly increased with spherical equivalent(SE) anisometropia >0.5 D, cylindrical anisometropia >0.25 D, the vertical/horizontal meridian(J0) or oblique meridian (J45) >0.125 D, or vector dioptric distance (VDD) >0.35 D (all p<0.001).VDD had higher ability in detecting unilateral amblyopia than cylinder, SE, J0 and J45 (p<0.001).
Conclusions—The presence of and amount of anisometropia were associated with the presenceof unilateral amblyopia, larger IAD and worse stereoacuity. The threshold level of anisometropiaat which unilateral amblyopia becomes significant was lower than current guidelines. VDD is
© 2012 American Academy of Ophthalmology, Inc. Published by Elsevier Inc. All rights reserved.
Correspondence to: Gui-shuang Ying, Ph.D., 3535 Market Street, Suite 700, Philadelphia, PA 19104. Tel: 215-615-1514. Fax:215-615-1531. [email protected].*A list of members of the Vision in Preschoolers Study Group is available at http://aaojournal.org.
Publisher's Disclaimer: This is a PDF file of an unedited manuscript that has been accepted for publication. As a service to ourcustomers we are providing this early version of the manuscript. The manuscript will undergo copyediting, typesetting, and review ofthe resulting proof before it is published in its final citable form. Please note that during the production process errors may bediscovered which could affect the content, and all legal disclaimers that apply to the journal pertain.
Conflict of Interest: None.
NIH Public AccessAuthor ManuscriptOphthalmology. Author manuscript; available in PMC 2014 March 01.
Published in final edited form as:Ophthalmology. 2013 March ; 120(3): 495–503. doi:10.1016/j.ophtha.2012.08.014.
NIH
-PA Author Manuscript
NIH
-PA Author Manuscript
NIH
-PA Author Manuscript

more accurate than spherical equivalent anisometropia or cylindrical anisometropia in identifyingpreschoolers with unilateral amblyopia.
INTRODUCTIONAmblyopia is one of the leading causes of monocular vision loss in the United States with aprevalence of 1% to 4%.1,2 In addition, unilateral amblyopia puts the patient at increasedrisk of vision loss throughout life.2,3 Treatment of amblyopia at a young age is highlysuccessful.4 Historically, there has been good agreement among eye care practitioners thatdetecting and treating amblyopia in early childhood is desirable to prevent permanent loss ofvision. The US Preventive Services Task Force recommends screening “to detect amblyopia,strabismus, and defects in visual acuity in children younger than 5 years.” 5 The need forearly detection of amblyopia and amblyogenic factors has been a driving force behindpreschool vision screening.
Anisometropia is a recognized risk factor for amblyopia.6-10 The population-based Multi-ethnic Pediatric Eye Disease Study 6 found that 54 (78%) of 69 cases of amblyopia wereattributed to anisometropia in African American and Hispanic children. The population-based Baltimore Pediatric Eye Disease Study 7 found 6 (32%) of 19 cases of amblyopiawere associated with anisometropia in White and African American children. These studiessupport the hypothesis that screening for high risk refractive error should detect a largeproportion of cases of amblyopia. However, because data on the likelihood of amblyopia atany given level of anisometropia are lacking, selecting referral criteria for screening tests ofrefractive error remains challenging. Also, the amount of anisometropia requiring treatmentis based largely on expert clinical opinion and varies among different professionalorganizations. The American Optometric Association defines anisometropia as a“potentially amblyogenic factor” if the difference in refractive error between eyes exceeds1.0 D (diopter) of hyperopia, 3.0 D of myopia, or 1.5 D of astigmatism.11 The AmericanAcademy of Ophthalmology in the ‘Preferred Practice Pattern’ recommends thatanisometropia of the following levels should be treated or monitored to prevent thedevelopment of amblyopia: ≥1.5 D of hyperopia, ≥2.0 D of myopia, or ≥2.0 D ofastigmatism.12 The American Association for Pediatric Ophthalmology and Strabismus(AAPOS) recommends an inter-ocular difference in sphere or cylinder more than 1.5 D to beconsidered an amblyogenic factor in preschool vision screening.13
One reason for the differences among the professional organizations on the level ofanisometropia considered to be a risk factor for amblyopia, is the scarcity of empirical datacomparing the percentages of children with amblyopia among different levels ofanisometropia. A few studies have been conducted to illustrate the relation between level ofanisometropia and risk or presence of amblyopia.14-17 However, the findings from thesestudies may not be generalizable to the screening of preschoolers, either because studieswere not tailored to the preschool age group or were determined in a selected population.Furthermore, these studies were limited by sample size in that only a small number ofsubjects were available at certain severity levels of anisometropia to determine the thresholdvalue. They were therefore, not powerful in determining the threshold level of anisometropiaassociated with an increased prevalence of amblyopia.
The Vision In Preschoolers (VIP) Study was a multi-center, cross-sectional study of 4040Head Start 3- to 5-year-old children enrolled from five VIP clinical centers across the UnitedStates.8-9 All the preschoolers underwent a comprehensive, standardized eye examination bycertified eye professionals. The rich dataset from the VIP Study provide an excellentopportunity to examine the relation between anisometropia with the presence and depth ofamblyopia in preschoolers, and the relation between anisometropia with interocular acuity
Ying et al. Page 2
Ophthalmology. Author manuscript; available in PMC 2014 March 01.
NIH
-PA Author Manuscript
NIH
-PA Author Manuscript
NIH
-PA Author Manuscript
difference and stereoacuity. The purpose of this paper is to describe the relation betweenanisometropia and unilateral amblyopia in 3- to 5-year-old preschoolers, using bothtraditional measures of anisometropia and two approaches of power vector analyses ofrefractive error. In addition, we examined the relation between anisometropia withinterocular acuity difference and stereoacuity.
METHODSThis is a secondary data analysis of the VIP data from participants of the VIP Study. Detailsof the VIP Study have been published previously,8-9 and only the details of thecomprehensive eye examinations related to this paper are described here.
Comprehensive Eye ExaminationsVIP participants were preschool children (3- to 5-year-old) enrolled in Head Start in the fiveVIP clinical centers (Berkeley, California; Boston, Massachusetts; Columbus, Ohio;Philadelphia, Pennsylvania; Tahlequah, Oklahoma). The local institutional review boardsassociated with each center approved the study protocol and informed consent documents.All Head Start children who failed their local Head Start screening and a random sample ofthose who did not fail the local Head Start screening were targeted for enrollment into theVIP Study. The enrolled children underwent a comprehensive, standardized eye examinationperformed by study-certified optometrists and ophthalmologists who were experienced inproviding care to children. The comprehensive examination incorporated monocularthreshold VA testing, cover testing, and cycloplegic refraction to determine whether a childhad amblyopia or reduced VA, strabismus, or significant refractive error. Anterior segmentevaluation and dilated fundus examination were also performed to detect possible causes ofreduced VA.
Monocular threshold VA testing was conducted with crowded, single H, O, T and Voptotypes using the Electronic Vision Assessment (EVA) system at 10 ft, according to theprotocol established by the Amblyopia Treatment Study.18 Children who wore spectacleswere tested while wearing their spectacles. Both eyes of a child were retested with fullcycloplegic correction if: (1) VA <20/50 for 3-year-old, VA <20/40 for 4- to 5-year-old, oran IAD ≥2 lines; AND (2) hyperopia ≥2.0 D, or myopia ≥0.5 D, or astigmatism ≥1.0 D waspresent in either eye. About 17% of children in VIP Phase I and 20% of children in VIPPhase II required a VA retest.
The final visual acuity score of an eye was based on the re-test for eyes that were retested,and based on the initial test for eyes that were not re-tested.
Both a cover-uncover test and an alternating cover test were performed at distance (10 ft)and near (16 inches) to evaluate ocular alignment. Cycloplegic retinoscopy was performed30 to 40 minutes after instillation of cycloplegic drops. Retinoscopy was performed with thechild wearing retinoscopy spectacles corresponding to the examiner’s working distance,while the child watched a children’s video presented at 10 ft.
In VIP Phase I-year 1, stereoacuity was tested using the Random Dot E test at 50, 100 and150 cm corresponding to 502, 252, and 168 arc sec disparity. In VIP Phase 1-year 2 andPhase II, stereoacuity was tested at 40cm using the Stereo Smile Test with six smilestereoacuity cards including card A (demo), card B (480 sec arc), card C (240 sec arc), cardD (120 sec arc), card E (60 sec arc) and a blank card (random dot pattern without disparity).
Ying et al. Page 3
Ophthalmology. Author manuscript; available in PMC 2014 March 01.
NIH
-PA Author Manuscript
NIH
-PA Author Manuscript
NIH
-PA Author Manuscript

The research followed the tenets of the Declaration of Helsinki and was approved by theinstitutional review board of each clinical center. Written informed consent was obtainedfrom parents prior to examination of each child.
Amblyopia DeterminationWe defined unilateral amblyopia solely based on the interocular difference in final VAwithout regard to the presence or absence of amblyogenic factors. We defined unilateralamblyopia as ≥2 lines difference in logarithm of the Minimum Angle of Resolution(logMAR) of the best-corrected interocular VA. Because the VIP study protocol did notspecify retesting a child with best correction when the IAD was <2 lines and VA in each eyewas in the normal range for the child’s age, these children were classified as non-amblyopicunder the assumption that the IAD would remain <2 lines upon retesting. Children with IAD≥ 2 lines who were not re-tested with correction (because their small amount of refractiveerror did not meet re-test criteria as defined above) were excluded from analysis, because itis unknown whether re-testing with correction would have resulted in a smaller IAD.
Anisometropia DefinitionAnisometropia was classified by both the traditional clinical notation using sphericalequivalent (SE) and cylinder power, and power vector notations using methods by Thibosand by Harris.21-22 SE is calculated as the sphere power plus half the cylinder power(preserving sign of the cylinder power). Using clinical notation, anisometropia was definedas an interocular difference ≥0.25 D in SE for spherical equivalent anisometropia and as aninterocular difference ≥0.25 D in cylinder for cylindrical anisometropia. Hyperopicanisometropia was defined as a SE ≥ +0.25 D in each eye, and an interocular difference≥0.25 D in SE. Myopic anisometropia was defined SE ≥ 0.25 D in each eye, and aninterocular difference ≥0.25 D in SE. If a child met the definitions of more than one type ofanisometropia, we assumed that the type of anisometropia that was inducing the amblyopiawas the type with the larger magnitude. Therefore, a child was classified into the oneanisometropia group corresponding to the largest interocular difference.
The above definitions of anisometropia used only sphere and cylinder and did not consideraxis. To take the axis into consideration, we also defined anisometropia using the powervector notation of Thibos et al 19 and of Harris 20. Using the Thibos method, we firstconverted the clinical notation of refractive error (S, C X β, where S is sphere, C is cylinder,and β is axis) into the rectangular Fourier form [M, J0, J45]. Here M is the sphere equivalentwith M=SE, J0 represents power at axis 0°/180° with J0=(-C/2)cos2β, and J45 representspower at 45°/135° with J45=(-C/2)sin2β. We calculated the interocular difference for eachof J0 and J45 and determined the amount of anisometropia based on the larger interoculardifference of J0 and J45. Using the Harris method,20 we calculated the vector dioptricdistance (VDD) between two eyes as VDD=sqrt(2) x sqrt[(M0-M1)2 + (J00-J01)2 +(J450-J451) 2], where the subscript 0 represents left eye, and 1 represents right eye. VDD providesa full description of the difference in refractive error between the two eyes. For both types ofvector notation analyses, a group of children without anisometropia (control group), similarto the isometropic group in the clinical notation analyses, was defined. Groups of childrenwith different severities of anisometropia were then compared to a control group. For vectornotation of both Thibos and Harris, subjects in the control group had zero interoculardifference of M, J0 and J45 (i.e., with zero of VDD). Because analyses of M anisometropiawas equivalent to the analyses of SE anisometropia presented in the clinical notationanalyses and because J0/J45 analyses was included to focus on the cylinder and axiscomponents of anisometropia, data from children with large SE anisometropia (SE ≥ 1.00 D)were excluded from the vector analysis of Thibos et al,19 the same analysis approach as thattaken by Dobson et al. 17
Ying et al. Page 4
Ophthalmology. Author manuscript; available in PMC 2014 March 01.
NIH
-PA Author Manuscript
NIH
-PA Author Manuscript
NIH
-PA Author Manuscript

Statistical AnalysisVisual acuity and stereoacuity results were transformed to logarithmic values for allstatistical analyses. For analysis of stereoacuity data, we restricted our analysis to thestereoacuity measured using Stereo Smile test, as Stereo Smile test has more disparity levelsand provide better measure of stereoacuity than Random Dot E test, as small stereoacuitydeficits may not be detected by Random Dot E test. For preschoolers (6.0%) who were notable to resolve the largest disparity level (480 arc sec) of Stereo Smile test, a value of 1600arc sec was assigned on the stereoacuity test, by following the same approach used by otherinvestigators.17,21 Additional sensitivity analyses were also performed by assigning 1000 arcsec and 10000 arc sec to children who could not resolve the largest disparity level.21
To evaluate whether the presence of anisometropia was associated with presence ofunilateral amblyopia, larger IAD, and worse stereoacuity, the chi-square test was used forcomparing the percentage of unilateral amblyopia, and the two group t-test was used forcomparing the mean IAD and stereoacuity between the anisometropia and isometropiagroups.
To evaluate whether larger amounts of anisometropia were associated with an increasedprevalence of unilateral amblyopia, we categorized children into several severity levels ofanisometropia and performed a test of trend in proportions. If the trend test showed astatistically significant association, we then determined the threshold level of anisometropiathat is associated with presence of unilateral amblyopia by comparing the percentage ofunilateral amblyopia between each severity level of anisometropia with that of theisometropic group. We summarized the association of anisometropia with amblyopia usingodds ratios (ORs) and their 95% confidence interval (95% CI), calculated from logisticregression models. To test whether the relation of anisometropia with unilateral amblyopiadiffers by age, a test of interaction between anisometropia and age was performed, followedby a stratified analysis by age if the interaction was found to be statistically significant.
To evaluate the ability of the different measures of anisometropia (clinical notation, powervector notations) in detecting unilateral amblyopia, we performed the analysis of ReceiverOperating Characteristic (ROC) by calculating the area under the ROC curve (AUC) andcompared AUC between pairs of different measures.22
To evaluate whether the larger amounts of anisometropia were associated with increasedIAD and stereoacuity, we performed a test of trend using analysis of variance. If test of trendis statistically significant, we proceeded with post-hoc comparisons between each severitylevel of anisometopia as compared to the isometropic group to determine the threshold levelassociated with increased IAD and worse stereoacuity. For these comparisons, we used theHochberg procedure 23 (a less conservative, more powerful procedure than Bonferronimethod) to adjust the p-values for multiple comparisons and to control the overall type Ierror of 0.05 (two-sided). All the statistical analyses were performed in SAS v9.2 (SASInstitute Inc, Cary, NC).
RESULTSStudy Subjects
A total of 4040 preschoolers were enrolled into VIP Phases 1 and 2. 160 (4.0%) subjectswere excluded due to having an IAD of ≥2 lines but not re-tested because their refractiveerror did not meet re-test criteria, 146 (3.6%) subjects were excluded due to the presence ofstrabismus, and 6 (0.2%) were excluded due to missing visual acuity or refractive error data.The remaining 3728 (92.3%) subjects constitute the population used in the analysis for thispaper. Unilateral amblyopia as defined in the methods was observed in 217 (5.8%) children.
Ying et al. Page 5
Ophthalmology. Author manuscript; available in PMC 2014 March 01.
NIH
-PA Author Manuscript
NIH
-PA Author Manuscript
NIH
-PA Author Manuscript

Anisometropia Measured with Clinical Notation and Unilateral AmblyopiaAmong the 3728 children, 1163 (31.2%) children were isometropic (ISO), 1214 (32.6%) hadSE anisometropia (≥0.25 D in SE), 1284 (34.4%) had cylindrical anisometropia (≥0.25 D incylinder), and 67 children had the same amount of SE anisometropia and cylindricalanisometropia. This latter group of children was classified as having neither spherical norcylindrical anisometropia and were excluded for the primary analysis of SE anisometropiaor cylindrical anisometropia. Among the 1214 children with SE anisometropia, 1113children had hyperopic anisometropia, 49 children had myopic anisometropia, and 52children had antimetropia. Compared to the isometropic children, those with anisometropiahad a significantly higher percentage of unilateral amblyopia (7.5% vs. 2.2%, p<0.001) withan odds ratio (OR) of 3.7 (95% CI: 2.4 – 5.6).
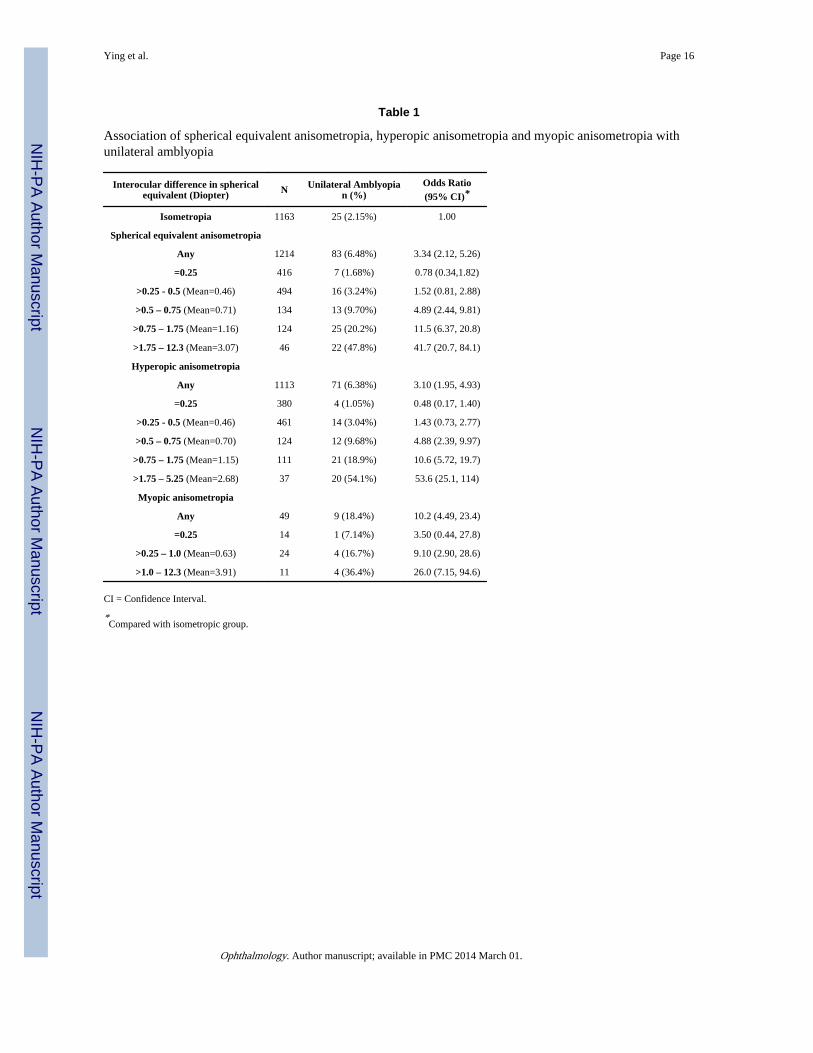
SE anisometropia was significantly associated with unilateral amblyopia (OR=3.3, 95%CI=2.1 – 5.3; Table 1). The presence of unilateral amblyopia significantly increased whenSE anisometropia was >0.50 D in SE (OR=4.9, 95% CI=2.4 – 9.8). The presence ofunilateral amblyopia increased with increasing amounts of SE anisometropia (trend p<0.001,Figure 1A, available at http://aaojournal.org). Among the 83 children with both SEanisometropia and unilateral amblyopia, the amount of SE anisometropia was significantlycorrelated with greater interocular acuity difference (Spearman correlation = 0.42,p<0.0001). Compared to the isometropic group, the OR for the presence of unilateralamblyopia ranged from 4.9 for SE anisometropia >0.5 to 0.75 D, to 42 for SE anisometropia>1.75 D. Similar relations held when only the 1113 children with hyperopic anisometropiawere considered (Table 1, Figure 1B, available at http://aaojournal.org).
Although relatively uncommon, myopic anisometropia was strongly associated withamblyopia (OR=10, 95% CI=4.5-23; Table 1). The presence of unilateral amblyopia wasstatistically significantly increased when myopic anisometropia was >0.25 D. Comparedwith the ISO group, the odds ratio was 9.1 for myopic anisometropia of >0.25 to 1.0 D andwas 26 for myopic anisometropia >1.0 D (p-values 0.002 and <0.001, respectively).
Cylindrical anisometropia was significantly associated with unilateral amblyopia (OR=3.8,95% CI=2.4-5.9; Table 2). The presence of unilateral amblyopia was statisticallysignificantly increased when cylindrical anisometropia was greater than 0.25 D (OR=2.8,95% CI=1.6 – 4.8). The presence of unilateral amblyopia increased with increased amountsof cylindrical anisometropia (trend p<0.001). Among the 98 children with both cylindricalanisometropia and unilateral amblyopia, the amount of cylindrical anisometropia wassignificantly correlated with greater interocuar acuity difference (Spearman correlation =0.31, p=0.002). Compared to the ISO group, the OR of unilateral amblyopia ranged from 2.8for cylindrical anisometropia >0.25 to 0.5 D to 23.8 for cylindrical anisometropia >1.5 D (allp-values <0.001).
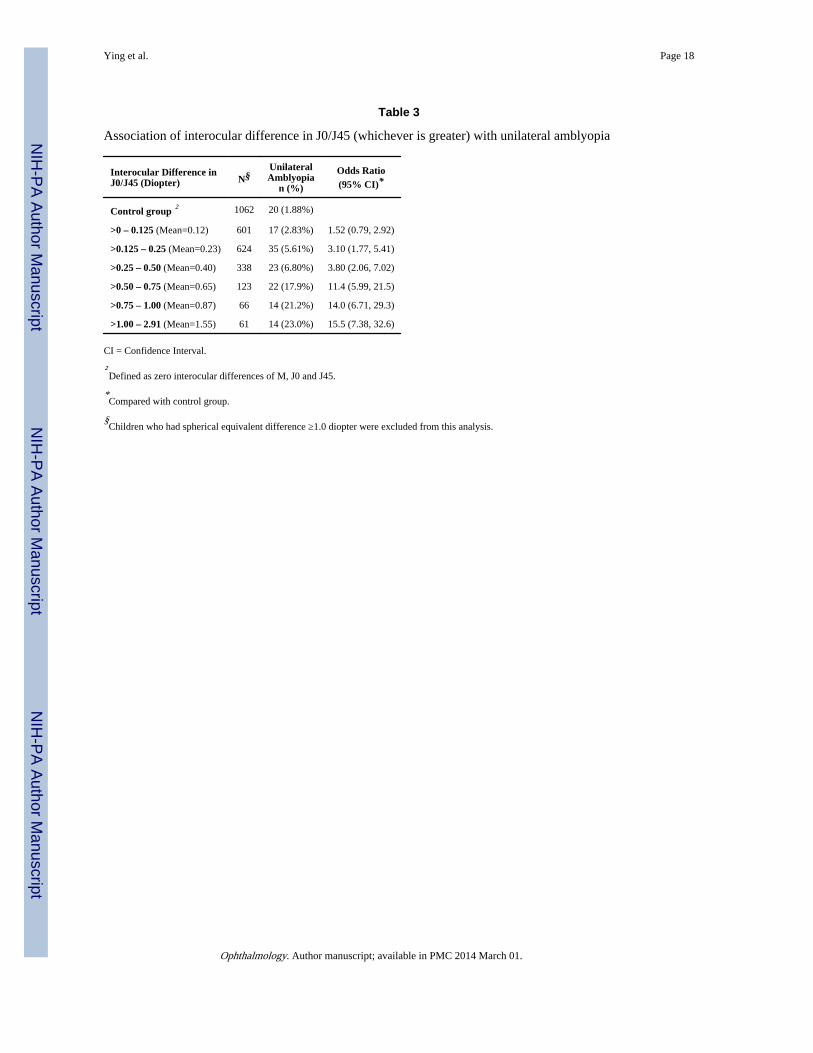
Anisometropia Measured with Vector Analysis and Unilateral AmblyopiaWhen anisometropia was measured with the vector components of Thibos, 21 increasedamounts of anisometropia (based on the larger value of J0/J45) were significantly associatedwith an increased percentage of unilateral amblyopia (trend p<0.001, Table 3, available athttp://aaojournal.org). The presence of unilateral amblyopia was statistically significantlyincreased when the interocular difference in J0/J45 was >0.125 D. Compared to the group ofchildren with zero interocular difference in J0/J45, the OR of unilateral amblyopia rangedfrom 3.1 for J0/J45 >0.125 D to 0.25 D, to 15.5 for J0/J45 >1.0 D. Similar relations withunilateral amblyopia held for J0 (power at axis 0°/180°) alone and J45 (power at axis 45°/135°) alone (data not shown).
Ying et al. Page 6
Ophthalmology. Author manuscript; available in PMC 2014 March 01.
NIH
-PA Author Manuscript
NIH
-PA Author Manuscript
NIH
-PA Author Manuscript
When anisometropia was measured with VDD, increased amounts of VDD weresignificantly associated with increased presence of unilateral amblyopia (trend p<0.001,Table 4). The presence of unilateral amblyopia was statistically significantly increased whenVDD was >0.35 D. Compared to the group with zero VDD, the OR of unilateral amblyopiaranged from 2.4 for VDD >0.35 to 0.6 D, to 99 for VDD >4.0 D.
Comparison on Measures of Anisometropia for Identifying Unilateral AmblyopiaUsing ROC analysis (Figure 2), the VDD has an AUC of 0.84 in detecting unilateralamblyopia. This is significantly better than the traditional clinical notation of anisometropiausing SE (AUC=0.69) or cylinder power (AUC=0.69). It is also better than the Thibosnotation of anisometropia using J0 (AUC=0.79), J45 (AUC=0.70), or larger value of J0/J45(AUC=0.80). Using VDD >=0.75 D for defining positive unilateral amblyopia leads to asensitivity of 0.64 and specificity of 0.81.
Age Effect on the Association between Anisometropia and Unilateral AmblyopiaThe association of the amount of cylindrical anisometropia with unilateral amblyopia differsbetween 3-year-old preschoolers and 4- to 5-year-old preschoolers (p<0.0001 for test ofinteraction). When stratifying the analysis by age group, we found the percentage ofamblyopia in 3-year-olds was more than twice as large as in 4- to 5-year-olds whencylindrical anisometropia was >0.25 to 1.0 D (Table 5, available at http://aaojournal.org).However, the percentages were nearly equal in the two age groups when cylindricalanisometropia was >1.0 D in two age groups. For all other types of anisometropia, therelation with amblyopia did not differ by age (p ≥0.25 for all tests of interaction).
Anisometropia with IADThe mean IAD in the anisometropic children was significantly larger than isometropicchildren (0.07 vs. 0.05 logMAR, p<0.001). The mean IAD as a function of amount ofanisometropia are shown for SE anisometropia (Figure 3A), hyperopic anisometropia(Figure 3B), myopic anisometropia (Figure 3C), and cylindrical anisometropia (Figure 3D).A significant increase in IAD occurred when SE anisometropia of >0.5 D, hyperopicanisometropia >0.5 D, myopic anisometropia >0.25 D, or cylindrical anisometropia >0.25 Dwere present. For each type of anisometropia, a larger amount of anisometropia wasassociated with a larger mean IAD, demonstrating clear a dose-response relationship (alltrend p-values <0.001). Using the vector notation, interocular difference of J0/J45 >0.125 D(Figure 3E) or VDD >0.35 D (Figure 3F) was associated with significantly larger IAD(p<0.001).
Anisometropia with StereoacuityUsing the traditional clinical notation for anisometropia, the mean stereoacuity in theanisometropic children was significantly worse than that of the isometropic children (119 vs.94 arc sec, p<0.001). Larger amounts of anisometropia were associated with worsestereoacuity for each type of anisometropia, in a clear dose-response manner (Figure 4). Thestereoacuity was significantly decreased when SE anisometropia was >0.5 D (Figure 4A),hyperopic anisometropia was >0.5 D (Figure 4B), myopic anisometropia was >0.25 D(Figure 4C) or cylindrical anisometropia was >0.5 D (Figure 4D). Using vector notation foranisometropia, the stereoacuity was statistically significantly decreased when the interoculardifference of J0/J45 was >0.25 D (Figure 4E) or when VDD was >0.6 D (Figure 4F). Theabove results were based on assigning a value of 1600 arc sec stereoacuity to those (6.0%preschooler) who could not resolve the largest stereoacuity disparity level (480 arc sec) ofStereo Smile test. The sensitivity analyses, by assigning either 1000 arc sec or 10000 arc secto these children, showed similar results (data not shown).
Ying et al. Page 7
Ophthalmology. Author manuscript; available in PMC 2014 March 01.
NIH
-PA Author Manuscript
NIH
-PA Author Manuscript
NIH
-PA Author Manuscript
DISCUSSIONUsing both traditional clinical notation and power vector notation as measures ofanisometropia, we found that the presence of and the amount of anisometropia weresignificantly associated with presence of unilateral amblyopia, larger IAD and worsestereoacuity. The presence of unilateral amblyopia among preschoolers was increased whenanisometropia exceeded the following criteria: SE anisometropia or hyperopic anisometropia>0.5 D, myopic anisometropia >0.25 D, cylindrical anisometropia >0.25 D, J0/J45 >0.125 Dor VDD >0.6 D.
Data on the level of anisometropia sufficient to induce unilateral amblyopia are sparse,particularly for the preschool age group. The major professional organizations concernedwith the eyecare of children have based their guidelines primarily on consensus. So far, onlytwo previous large-scale population-based studies have evaluated the association ofanisometropia with amblyopia in preschoolers.6,7 To date, the VIP study provides the largestsample size (in terms of both number of children studied and number of children withamblyopia) to study the association between anisometropia and amblyopia. Similarevaluations of the association of anisometropia and amblyopia were conducted in studies byWeakley and Dobson et al,14,17 but in different, selected populations. Weakley studied theincidence of amblyopia (defined as at least one full Snellen line of acuity difference betweentwo eyes) in a clinic-based sample of anisometropic and non-anisometropic patients between3 to 14 years of age, and found that the “levels of anisometropia at which amblyopiabecomes significant closely parallel the recent guidelines of American Academy ofOphthalmology in the Preferred Practice Pattern, which were previously supported primarilyby clinical impression and experience.” 14 Because refractive error changes with age, theassociations between refractive error and amblyopia in Weakley’s study, may not accuratelypredict the same associations among preschoolers. Dobson et al studied the association ofanisometropia and amblyopia in a school-aged population from a Native American tribewith a high prevalence of astigmatism using the same definition of amblyopia (≥2 logMARlines in interocular acuity difference), and found that hyperopic anisometropia ≥1.0 D orcylindrical anisometropia ≥ 2.0 D or VDD > 1.41 D was significantly associated withincrease in IAD and presence of amblyopia.17 However, because the study was conducted ina selected population with a high prevalence of astigmatism and little spherical error, thethreshold values from Dobson’s study may not apply to the general preschool population.More recently, Donahue et al found that among children participating in a statewidepreschool photoscreening program, children with greater degrees of anisometropia hadhigher prevalence and greater depth of amblyopia. In addition, age affected theassociation.15,16 Younger children with anisometropia (defined as >1.0 D interoculardifference in any meridian) had a lower prevalence and depth of amblyopia than olderchildren, with prevalence ranging from 14% in 1-year-olds to 76% in 5-year-olds. All thesestudies are limited by sample size in that only a small number of subjects were available incertain severity levels of anisometropia to determine the threshold value. These studies arelikely to be less precise in determining the threshold level of anisometropia associated with aclinically significant increase in the presence of amblyopia.
We found statistically significantly higher proportions of children with unilateral amblyopiawhen the degree of anisometropia was considerably lower than the levels consideredamblyogenic by the professional organizations and those identified from the Weakley andDobson studies (Table 6, available at http://aaojournal.org). Our lower thresholds are due, atleast in part, to our larger sample size. For example, in Weakley’s study, the proportion withunilateral amblyopia was higher among children with spherical hyperopic anisometropia>0.5 to 1.0 D (8%) than among the isometropic group (4%) but the difference was notstatistically significant. The VIP data presented here provide evidence that smaller degrees
Ying et al. Page 8
Ophthalmology. Author manuscript; available in PMC 2014 March 01.
NIH
-PA Author Manuscript
NIH
-PA Author Manuscript
NIH
-PA Author Manuscript

of anisometropia are associated with unilateral amblyopia. Thus, preschool children withoutstrabismus who have an inter-ocular difference in visual acuity and anisometropia above thethresholds identified in this study may benefit from treatment for anisometropic amblyopia.
For each type of anisometropia defined here, we found that larger amounts of anisometropiawere associated with higher percentages of unilateral amblyopia and greater interocularacuity difference. In addition, we found larger degrees of anisometropia were associatedwith worse stereoacuity. This dose-response relation is consistent with the findings ofDonahue’s study from a statewide preschool photoscreening program.15,16 However, ourfinding that the proportion with unilateral amblyopia is higher in 3-year-old children than in4- to 5-year-old children with moderate cylindrical anisometropia is not consistent with thefindings by Donahue that older children had a higher percentage of amblyopia than youngerchildren given the same amount of anisometropia.
We measured the degree of anisometropia using two forms of power vector analysis, theThibos approach using a rectangular Fourier form and the Harris approach using VectorVDD. We found that VDD had significantly better power (AUC=0.84) for detectingunilateral amblyopia than the traditional clinical notation of anisometropia using sphericalequivalent that ignores the axis (AUC=0.69), and the Thibo’s notation of J0/J45 thatconsiders the axis (AUC=0.80). Even though the computation of VDD is not asstraightforward as spherical equivalent, the substantial gain in the accuracy of detectingamblyopia using VDD may justify its wider use in both clinical care and clinical research.
The study is limited by the fact that in the VIP Study, visual acuity measurements were notmade using the child’s best correction for the initial test, and only children who met specificcriteria were retested with full cycloplegic correction, i.e., those with (1) VA <20/50 if 3years old, VA <20/40 if 4 or 5 years old, an IAD ≥ 2 lines; AND (2) hyperopia ≥ 2.0 D,myopia≥ 0.5 D, or astigmatism ≥ 1.0 D. However, in our analyses, we assumed that childrenwith IAD <2 lines from the initial VA test without full refraction would still have an IAD <2lines if they were tested with full refraction. We analyzed VA data from all 782 childrenwho underwent both initial VA testing without cycloplegic correction and VA re-test withcycloplegic correction because the VA re-test criteria were met. We found that re-test VAunder cycloplegic correction usually led to a smaller IAD (0.21 LogMAR in IAD from theinitial test without cycloplegic correction, and 0.15 LogMAR from the re-test withcycloplegic correction). The VA re-test also led to a lower % with unilateral amblyopia(39.6% in initial test, and 34.5% in re-test). Because the VA re-test rate was higher inanisometropic children than non-anisometropic children (22.1% vs. 7.4%), and the VA re-test under cycloplegic correction was associated with smaller IAD and a lower % withunilateral amblyopia, we could only have under-estimated rather than over-estimated thatthe association of anisometropia with unilateral amblyopia and IAD. The study alsoexcluded 160 (4.0%) children who had an IAD ≥ 2 lines yet were not re-tested with fullcorrection because their refractive error did not meet re-test criteria. However, because thedistribution of spherical equivalent anisometropia levels of these excluded children was verysimilar to those who were included in our statistical analysis (p=0.51), we don’t thinkexcluding these 160 children introduces any substantial bias. The VIP participants wereenrolled from Head Start centers in the United States and therefore all live in low-incomefamilies. If the association between anisometropia and unilateral amblyopia is found todiffer by socio-economic group, the VIP results may not apply to all preschoolers.
In summary, we analyzed the cross-sectional data from a large group of children whoparticipated in VIP and found that smaller amounts of anisometropia than currently used inmany guidelines based on expert opinion are associated with presence of unilateralamblyopia. These degrees of anisometropia are also associated with larger interocular acuity
Ying et al. Page 9
Ophthalmology. Author manuscript; available in PMC 2014 March 01.
NIH
-PA Author Manuscript
NIH
-PA Author Manuscript
NIH
-PA Author Manuscript

difference and lower stereoacuity, in a dose-response manner. While the choice of thethreshold of anisometropia for referral for evaluation of amblyopia will depend on thedesired levels of sensitivity and specificity, these data provide an evidence base for makingthe decision.
Supplementary MaterialRefer to Web version on PubMed Central for supplementary material.
AcknowledgmentsThis study is supported by grants from the National Eye Institute, National Institutes of Health, Department ofHealth and Human Services, Bethesda, MD: U10EY12534; U10EY12545; U10EY12547; U10EY12550;U10EY12644; U10EY12647; U10EY12648 and R21EY018908.
REFERENCES1. Simons K. Preschool vision screening: rationale, methodology and outcome. Surv Ophthalmol.
1996; 41:3–30. [PubMed: 8827927]
2. Simons K. Amblyopia characterization, treatment, and prophylaxis. Surv Ophthalmol. 2005;50:123–66. [PubMed: 15749306]
3. Rahi J, Logan S, Timms C, et al. Risk, causes, and outcomes of visual impairment after loss ofvision in the non-amblyopic eye: a population-based study. Lancet. 2002; 360:597–602. [PubMed:12241931]
4. Williams C, Northsone K, Harrad RA, et al. Amblyopia treatment outcomes after screening beforeor at age 3 years: follow-up from randomised trial. BMJ. 2002; 324:1549. [PubMed: 12089090]
5. U.S. Preventive Services Task Force. Screening for visual impairment in children younger than age5 years: recommendation statement. Ann Fam Med. 2004; 2:263–6. [PubMed: 15209205]
6. Multi-ethnic Pediatric Eye Disease Study Group. Prevalence of amblyopia and strabismus inAfrican American and Hispanic children ages 6 to 72 months: the Multi-ethnic Pediatric EyeDisease Study. Ophthalmology. 2008; 115:1229–36. [PubMed: 17953989]
7. Friedman DS, Repka MX, Katz J, et al. Prevalence of amblyopia and strabismus in white andAfrican children age 6 through 71 months: the Baltimore Pediatric Eye Disease Study.Ophthalmology. 2009; 116:2128–34. [PubMed: 19762084]
8. Vision In Preschoolers Study Group. Comparison of preschool vision screening tests asadministered by licensed eye care professionals in the Vision In Preschoolers Study.Ophthalmology. 2004; 111:637–50. [PubMed: 15051194]
9. Vision In Preschoolers Study Group. Preschool vision screening tests administered by nursescreeners compared to lay screeners in the Vision in Preschoolers Study. Invest Ophthalmol Vis Sci.2005; 46:2639–48. [PubMed: 16043831]
10. von Noorden GK. Factors involved in the production of amblyopia. Br J Ophthalmol. 1974;58:158–64. [PubMed: 4209595]
11. American Optometric Association n Consensus Panel On Care of the Patient With Amblyopia.Optometric Clinical Practice Guideline. Care of the Patient with Amblyopia. American OptometricAssociation; St. Louis, MO: 2004. Available at: http://www.aoa.org/documents/CPG-4.pdf[Accessed July 15, 2012]
12. American Academy of Ophthalmology Pediatric Ophthalmology/Strabismus Panel. Amblyopia.American Academy of Ophthalmology; San Francisco, CA: 2007. Preferred Practice PatternGuidelines. Available at: http://one.aao.org/CE/PracticeGuidelines/PPP.aspx [Accessed July 15,2012]
13. Donahue SP, Arnold RW, Ruben JB, AAPOS Vision Screening Committee. Preschool visionscreening: what should we detect and how should we report it? Uniform guidelines for reportingresults of preschool vision screening studies. J AAPOS. 2003; 7:314–6. [PubMed: 14566312]
Ying et al. Page 10
Ophthalmology. Author manuscript; available in PMC 2014 March 01.
NIH
-PA Author Manuscript
NIH
-PA Author Manuscript
NIH
-PA Author Manuscript

14. Weakley DR Jr. The association between nonstrabismic anisometropia, amblyopia, and subnormalbinocularity. Ophthalmology. 2001; 108:163–71. [PubMed: 11150283]
15. Donahue SP. Relationship between anisometropia, patient age, and the development of amblyopia.Am J Ophthalmol. 2006; 142:132–40. [PubMed: 16815261]
16. Leon A, Donahue SP, Morrison DG, et al. The age-dependent effect of anisometropia magnitudeon anisometropic amblyopia severity. J AAPOS. 2008; 12:150–6. [PubMed: 18155938]
17. Dobson V, Miller JM, Clifford-Donaldson CE, Harvey EM. Associations between anisometropia,amblyopia, and reduced stereoacuity in a school-aged population with a high prevalence ofastigmatism. Invest Ophthalmol Vis Sci. 2008; 49:4427–36. [PubMed: 18539935]
18. Holmes JM, Beck RW, Repka MX, et al. Pediatric Eye Disease Investigator Group. TheAmblyopia Treatment Study visual acuity testing protocol. Arch Ophthalmol. 2001; 119:1345–53.[PubMed: 11545641]
19. Thibos LN, Wheeler W, Horner D. Power vectors: an application of Fourier analysis to thedescription and statistical analysis of refractive error. Optom Vis Sci. 1997; 74:367–75. [PubMed:9255814]
20. Harris WF. The mean and variance of samples of dioptric powers: the basic calculations. Clin ExpOptom. 1990; 73:89–92.
21. Wallace DK, Lazar EL, Melia M, et al. Pediatric Eye Disease Investigator Group. Stereoacuity inchildren with anisometropic amblyopia. J AAPOS. 2011; 15:455–61.
22. DeLong ER, DeLong DM, Clarke-Pearson DL. Comparing the areas under two or more correlatedreceiver operating characteristic curves: a nonparametric approach. Biometrics. 1988; 44:837–45.[PubMed: 3203132]
23. Hochberg Y. A sharper Bonferroni procedure for multiple significance testing. Biometrika. 1988;75:800–3.
Ying et al. Page 11
Ophthalmology. Author manuscript; available in PMC 2014 March 01.
NIH
-PA Author Manuscript
NIH
-PA Author Manuscript
NIH
-PA Author Manuscript

Figure 1.Percent of children with unilateral amblyopia by levels of spherical equivalentanisometropia (Figure 1A), hyperopic anisometropia (Figure 1B), and myopic anisometropia(Figure 1C).
Ying et al. Page 12
Ophthalmology. Author manuscript; available in PMC 2014 March 01.
NIH
-PA Author Manuscript
NIH
-PA Author Manuscript
NIH
-PA Author Manuscript
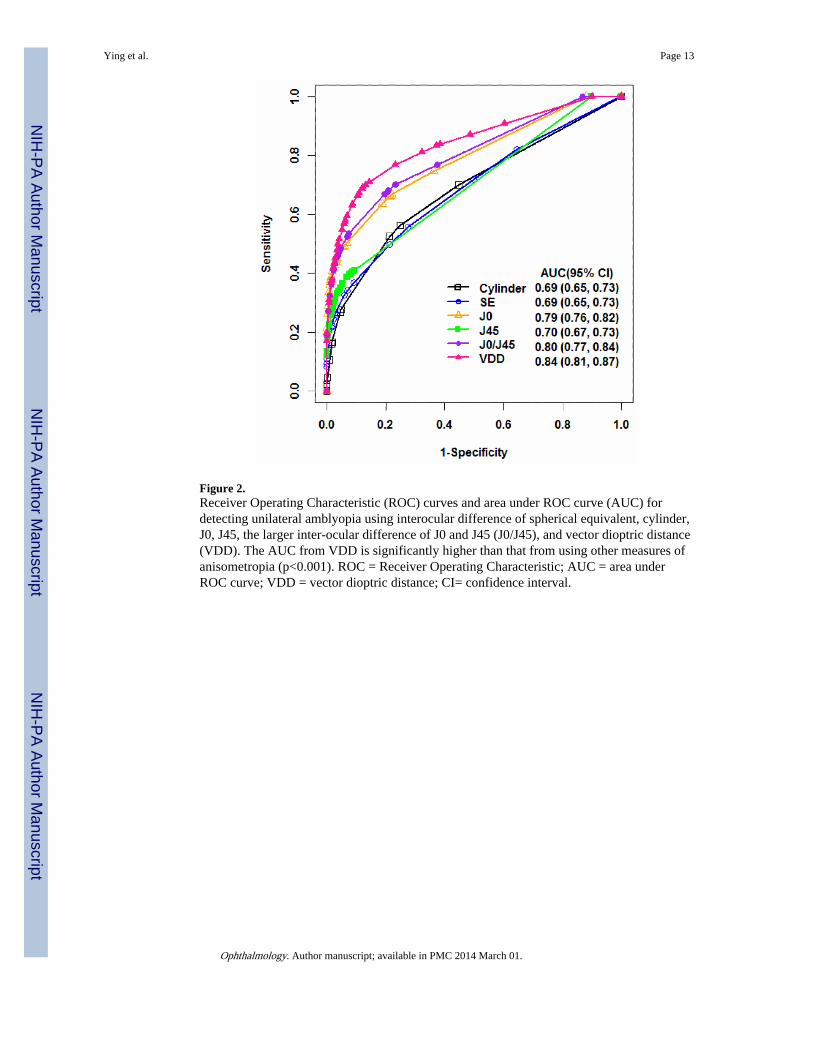
Figure 2.Receiver Operating Characteristic (ROC) curves and area under ROC curve (AUC) fordetecting unilateral amblyopia using interocular difference of spherical equivalent, cylinder,J0, J45, the larger inter-ocular difference of J0 and J45 (J0/J45), and vector dioptric distance(VDD). The AUC from VDD is significantly higher than that from using other measures ofanisometropia (p<0.001). ROC = Receiver Operating Characteristic; AUC = area underROC curve; VDD = vector dioptric distance; CI= confidence interval.
Ying et al. Page 13
Ophthalmology. Author manuscript; available in PMC 2014 March 01.
NIH
-PA Author Manuscript
NIH
-PA Author Manuscript
NIH
-PA Author Manuscript
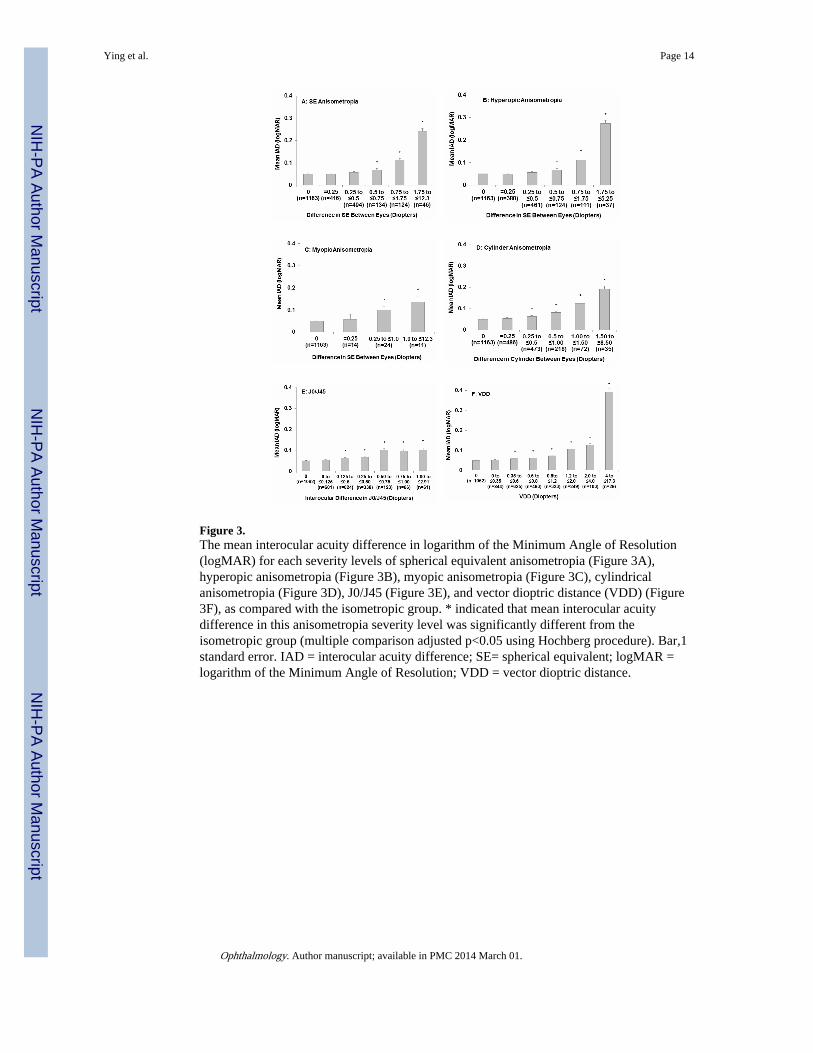
Figure 3.The mean interocular acuity difference in logarithm of the Minimum Angle of Resolution(logMAR) for each severity levels of spherical equivalent anisometropia (Figure 3A),hyperopic anisometropia (Figure 3B), myopic anisometropia (Figure 3C), cylindricalanisometropia (Figure 3D), J0/J45 (Figure 3E), and vector dioptric distance (VDD) (Figure3F), as compared with the isometropic group. * indicated that mean interocular acuitydifference in this anisometropia severity level was significantly different from theisometropic group (multiple comparison adjusted p<0.05 using Hochberg procedure). Bar,1standard error. IAD = interocular acuity difference; SE= spherical equivalent; logMAR =logarithm of the Minimum Angle of Resolution; VDD = vector dioptric distance.
Ying et al. Page 14
Ophthalmology. Author manuscript; available in PMC 2014 March 01.
NIH
-PA Author Manuscript
NIH
-PA Author Manuscript
NIH
-PA Author Manuscript

Figure 4.The mean stereoacuity from stereo smile test for each severity levels of spherical equivalentanisometropia (Figure 4A), hyperopic anisometropia (Figure 4B), myopic anisometropia(Figure 4C), cylindrical anisometropia (Figure 3D), J0/J45 (Figure 4E), and vector dioptricdistance (VDD) (Figure 4F), as compared with the isometropic group. * indicated that meanstereoacuity in this anisometropia severity level was significantly different from theisometropic group (multiple comparison adjusted p<0.05 from Hochberg procedure). Bar,1standard error. SE = spherical equivalent; VDD = vector dioptric distance.
Ying et al. Page 15
Ophthalmology. Author manuscript; available in PMC 2014 March 01.
NIH
-PA Author Manuscript
NIH
-PA Author Manuscript
NIH
-PA Author Manuscript
NIH
-PA Author Manuscript
NIH
-PA Author Manuscript
NIH
-PA Author Manuscript
Ying et al. Page 16
Table 1
Association of spherical equivalent anisometropia, hyperopic anisometropia and myopic anisometropia withunilateral amblyopia
Interocular difference in sphericalequivalent (Diopter) N Unilateral Amblyopia
n (%)Odds Ratio(95% CI)*
Isometropia 1163 25 (2.15%) 1.00
Spherical equivalent anisometropia
Any 1214 83 (6.48%) 3.34 (2.12, 5.26)
=0.25 416 7 (1.68%) 0.78 (0.34,1.82)
>0.25 - 0.5 (Mean=0.46) 494 16 (3.24%) 1.52 (0.81, 2.88)
>0.5 – 0.75 (Mean=0.71) 134 13 (9.70%) 4.89 (2.44, 9.81)
>0.75 – 1.75 (Mean=1.16) 124 25 (20.2%) 11.5 (6.37, 20.8)
>1.75 – 12.3 (Mean=3.07) 46 22 (47.8%) 41.7 (20.7, 84.1)
Hyperopic anisometropia
Any 1113 71 (6.38%) 3.10 (1.95, 4.93)
=0.25 380 4 (1.05%) 0.48 (0.17, 1.40)
>0.25 - 0.5 (Mean=0.46) 461 14 (3.04%) 1.43 (0.73, 2.77)
>0.5 – 0.75 (Mean=0.70) 124 12 (9.68%) 4.88 (2.39, 9.97)
>0.75 – 1.75 (Mean=1.15) 111 21 (18.9%) 10.6 (5.72, 19.7)
>1.75 – 5.25 (Mean=2.68) 37 20 (54.1%) 53.6 (25.1, 114)
Myopic anisometropia
Any 49 9 (18.4%) 10.2 (4.49, 23.4)
=0.25 14 1 (7.14%) 3.50 (0.44, 27.8)
>0.25 – 1.0 (Mean=0.63) 24 4 (16.7%) 9.10 (2.90, 28.6)
>1.0 – 12.3 (Mean=3.91) 11 4 (36.4%) 26.0 (7.15, 94.6)
CI = Confidence Interval.
*Compared with isometropic group.
Ophthalmology. Author manuscript; available in PMC 2014 March 01.

NIH
-PA Author Manuscript
NIH
-PA Author Manuscript
NIH
-PA Author Manuscript
Ying et al. Page 17
Table 2
Association of cylindrical anisometropia with unilateral amblyopia
Interocular difference incylinder (Diopter)
N(N=2447)
UnilateralAmblyopia
(N=123)n (%)
Odds Ratio(95% CI)*
Isometropia 1163 25 (2.15%) 1.00
Any cylindricalanisometropia 1284 98 (7.63%) 3.76 (2.41, 5.88)
=0.25 486 15 (3.09%) 1.45 (0.76, 2.77)
>0.25 - 0.5 (Mean=0.50) 473 27 (5.71%) 2.76 (1.58, 4.80)
>0.5 – 1.00 (Mean=0.86) 218 23 (10.6%) 5.37 (2.99, 9.65)
>1.00 – 1.50 (Mean=1.38) 72 21 (29.2%) 10.7 (9.84, 35.7)
>1.50 – 8.50 (Mean=2.37) 35 12 (34.3%) 23.8 (10.6, 53.0)
CI= Confidence Interval.
*Compared with isometropic group.
Ophthalmology. Author manuscript; available in PMC 2014 March 01.
NIH
-PA Author Manuscript
NIH
-PA Author Manuscript
NIH
-PA Author Manuscript
Ying et al. Page 18
Table 3
Association of interocular difference in J0/J45 (whichever is greater) with unilateral amblyopia
Interocular Difference inJ0/J45 (Diopter) N§
UnilateralAmblyopia
n (%)
Odds Ratio(95% CI)*
Control group † 1062 20 (1.88%)
>0 – 0.125 (Mean=0.12) 601 17 (2.83%) 1.52 (0.79, 2.92)
>0.125 – 0.25 (Mean=0.23) 624 35 (5.61%) 3.10 (1.77, 5.41)
>0.25 – 0.50 (Mean=0.40) 338 23 (6.80%) 3.80 (2.06, 7.02)
>0.50 – 0.75 (Mean=0.65) 123 22 (17.9%) 11.4 (5.99, 21.5)
>0.75 – 1.00 (Mean=0.87) 66 14 (21.2%) 14.0 (6.71, 29.3)
>1.00 – 2.91 (Mean=1.55) 61 14 (23.0%) 15.5 (7.38, 32.6)
CI = Confidence Interval.
†Defined as zero interocular differences of M, J0 and J45.
*Compared with control group.
§Children who had spherical equivalent difference ≥1.0 diopter were excluded from this analysis.
Ophthalmology. Author manuscript; available in PMC 2014 March 01.

NIH
-PA Author Manuscript
NIH
-PA Author Manuscript
NIH
-PA Author Manuscript
Ying et al. Page 19
Table 4
Association of vector dioptric distance with unilateral amblyopia
VDD (Diopter) NUnilateralAmblyopia
n (%)
Odds Ratio(95% CI)*
Control Group † 1062 20 (1.88%) 1.00
>0 - 0.35 (Mean=0.30) 844 18 (2.13%) 1.14 (0.60, 2.16)
>0.35 - 0.6 (Mean=0.51) 625 27 (4.32%) 2.35 (1.31, 4.23)
>0.6 - 0.8 (Mean=0.72) 493 24 (4.87%) 2.67 (1.46, 4.87)
>0.8 – 1.2 (Mean=1.02) 323 32 (9.91%) 5.73 (3.23, 10.2)
>1.2 – 2 (Mean=1.50) 249 48 (19.3%) 12.4 (7.23, 21.4)
>2 – 4 (Mean=2.64) 103 29 (28.2%) 20.4 (11.0, 37.8)
>4 – 17.3 (Mean=7.08) 29 19 (65.5%) 99.0 (40.9, 240)
CI = Confidence Interval; VDD = Vector Dioptric Distance.
†Defined as zero interocular differences of M, J0 and J45.
*Compared with isometropic group.
Ophthalmology. Author manuscript; available in PMC 2014 March 01.

NIH
-PA Author Manuscript
NIH
-PA Author Manuscript
NIH
-PA Author Manuscript
Ying et al. Page 20
Tabl
e 5
The
ass
ocia
tion
betw
een
cylin
dric
al a
niso
met
ropi
a an
d un
ilate
ral a
mbl
yopi
a by
age
of
child
ren
3-Y
ear-
Old
(N
=772
)4-
to
5-Y
ear-
old(
N=
1919
)
Inte
rocu
lar
diff
eren
ce in
cylin
der
N
Mea
nin
tero
cula
rdi
ffer
ence
in c
ylin
der
Uni
late
ral
Am
blyo
pia
n (%
)
Odd
s R
atio
(95%
CI)
*N
Mea
nin
tero
cula
rdi
ffer
ence
in c
ylin
der
Uni
late
ral
Am
blyo
pia
n (%
)
Odd
s R
atio
(95%
CI)
*
Isom
etro
pia
261
07
(2.6
8%)
1.00
902
018
(2.
00%
)1.
00
Cyl
indr
ical
anis
omet
ropi
a26
70.
5528
(10
.5%
)4.
25 (
1.82
, 9.9
2)10
170.
5770
(6.
88%
)3.
63 (
2.15
, 6.1
4)
=0.2
510
50.
253
(2.8
6%)
1.07
(0.
27, 4
.21)
381
0.25
12 (
3.15
%)
1.60
(0.
76, 3
.35)
>0.2
5 -
0.5
980.
510
(10
.2%
)4.
12 (
1.52
, 11.
2)37
50.
517
(4.
53%
)2.
33 (
1.19
, 4.5
8)
>0.5
– 1
.00
450.
889
(20.
0%)
9.07
(3.
18, 2
5.9)
173
0.86
14 (
8.09
%)
4.32
(2.
11, 8
.87)
>1.0
0 –
8.5
191.
706(
31.6
%)
16.8
(4.
92, 5
7.0)
881.
7127
(30
.7%
)21
.7 (
11.4
, 41.
7)
CI=
Con
fide
nce
Inte
rval
.
* Com
pare
d w
ith th
e is
omet
ropi
c gr
oup.
Ophthalmology. Author manuscript; available in PMC 2014 March 01.

NIH
-PA Author Manuscript
NIH
-PA Author Manuscript
NIH
-PA Author Manuscript
Ying et al. Page 21
Tabl
e 6
Ani
som
etro
pic
leve
ls th
ough
t to
be p
oten
tially
am
blyo
geni
c in
pre
scho
ol a
nd s
choo
l-ag
ed c
hild
ren
Sour
ceA
ge r
ange
(yea
rs)
Sphe
reH
yper
opia
Myo
pia
Cyl
inde
r
Am
eric
an A
cade
my
ofO
phth
alm
olog
y 12
≥ 2
≥ 1.
5 D
≥ 1.
5 D
≥ 2.
0 D
Am
eric
an O
ptom
etri
cA
ssoc
iatio
n 11
≥ 1.
0 D
≥ 3.
0 D
≥ 1.
5 D
Am
eric
an A
ssoc
iatio
n fo
rPe
diat
ric
Oph
thal
mol
ogy
and
Stra
bism
us 13
Pres
choo
lag
e>
1.5
D>
1.5
D
Wea
kley
et a
l Stu
dy14
≥ 3
≥ 1.
0 D
≥ 3.
0 D
≥ 1.
5 D
Dob
son
et a
l Stu
dy 17
4 to
13
≥ 1.
0 D
≥ 2.
0 D
Cur
rent
stu
dy3
to 5
> 0
.5 D
> 0
.25
D>
0.2
5 D
D=
Dio
pter
.
Ophthalmology. Author manuscript; available in PMC 2014 March 01.