nih public access 1,2 1,3 arya saidi1 wenjuan qi1 allen...
TRANSCRIPT
Imaging vibrating vocal folds with a high speed 1050 nm sweptsource OCT and ODT
Gangjun Liu1,2, Marc Rubinstein1,3, Arya Saidi1, Wenjuan Qi1, Allen Foulad1, BrianWong1,2,3, and Zhongping Chen1,2,*
1Beckman Laser Institute, University of California, Irvine, Irvine, California 92612, USA2Department of Biomedical Engineering, University of California, Irvine, Irvine, California 92697,USA3Department of Otolaryngology Head and Neck Surgery, University of California, Irvine, Orange,California 92868, USA
AbstractVocal fold vibration is vital in voice production and the correct pitch of speech. We havedeveloped a high speed functional optical coherence tomography (OCT) system with a centerwavelength of 1050 nm and an imaging speed of 100,000 A-lines per second. We imaged thevibration of an ex-vivo swine vocal fold. At an imaging speed of 100 frames per second, wedemonstrated high quality vocal fold images during vibration. Functional information, such asvibration frequency and vibration amplitude, was obtained by analyzing the tissue surface duringvibration. The axial direction velocity distribution in the cross-sectional images of the vibratingvocal folds was obtained with the Doppler OCT. The quantitative transverse direction velocitydistribution in the cross-sectional images was obtained with the Doppler variance images.
1. IntroductionOptical coherence tomography (OCT) is a powerful interferometric technology used toobtain cross-sectional tissue images noninvasively with micrometer resolution, millimeterpenetration depth, and a video-rate imaging speed [1]. Due to its non-contact and highresolution nature, OCT has become a valuable tool in a number of medical fields. Recently,OCT technique has been increasingly used to perform functional imaging as well. Doppleroptical coherence tomography (DOCT) or optical Doppler tomography (ODT) is one kind offunctional extension of OCT, which combines the Doppler principle with OCT. ODT hasbeen widely used for in-vivo imaging of blood flow in live animals and human beings [2–7].
Clinically, vocal fold vibration has been widely imaged using laryngeal videostroboscopyand high speed video, as these methods provide clinically relevant important information onvocal fold behavior in health and pathology. Lohscheller et al. obtained functionalinformation regarding the vibration vocal folds, such as vibrating frequency, velocity, andacceleration [8–10]. Although videostroboscopy provides an excellent method todynamically assess the vocal folds, it only provides information on the surface of the vocalfolds; therefore, the condition of the vocal folds underneath the surface remains unknownusing these systems. There is a wide spectrum of diseases that can occur in the vocal folds,including benign polyps, premalignant and malignant lesions. Differentiating these
©2011 Optical Society of America*[email protected].
NIH Public AccessAuthor ManuscriptOpt Express. Author manuscript; available in PMC 2011 July 6.
Published in final edited form as:Opt Express. 2011 June 6; 19(12): 11880–11889.
NIH
-PA Author Manuscript
NIH
-PA Author Manuscript
NIH
-PA Author Manuscript

afflictions using only direct visualization can be difficult and a biopsy is often required. Thekey element to differentiate these lesions has to do with visualizing the integrity of thebasement membrane. A loss of the basement membrane integrity is a hallmark of cancers ofthe vocal fold. Currently, there is no reliable noninvasive method to diagnose laryngealcancer without introducing a biopsy. However, doing a biopsy in the vocal folds can comewith its own risk of creating permanent damage to the vocal folds; therefore, the importanceof using a noninvasive imaging method that can visualize below the surface of the vocalcords, such as Ultrasound, and OCT, is highly practical. Ultrasound has also been used toimage the vibrating vocal folds [11–13]. Although functional information can be obtainedfrom an ultrasound, color Doppler ultrasound images suffer from low resolution and lowframe rate. Hence, there is immense value in being able to image dynamically and in real-time image the structure and characteristics of the vibrating vocal folds, as much pathologyis below the thin subsurface of this organ. Recently, imaging vibration vocal folds usingOCT has been demonstrated by several groups [14–16]. Lüerβen et al. demonstrated thevibration vocal fold OCT image at an imaging speed of 10 frames per second [14]. Ourgroup has demonstrated in-vivo imaging of human vibrating vocal folds with a 1.3 µm, 20kHz swept source OCT system and a hand-held probe [15]. Functional information, such asvibrating frequency, was obtained by analysis of the OCT structure images. Kober et al.used a triggered 10 kHz swept source OCT system to image the excised half calf larynx[16]. With the help of the particle image analysis method, the authors obtained the velocityvector in the cross section images from the OCT structure images.
For humans, the actual vocal fundamental frequencies vary by sex. In females it isapproximately 200 Hz and in males it is approximately 120 Hz. For imaging such highfrequency movement, a high speed imaging system is essential to provide high frame rateimages for the analysis. In addition, Doppler OCT requires much more dense scanningbetween A-lines. In order to cover a large enough field of view and obtain high qualityDoppler images at the same time, a fast system is essential to provide high frame rate.
In this paper, we demonstrate functional imaging of vibrating vocal folds ex-vivo with a highspeed swept source OCT and ODT system. The system has a maximum imaging speed of100 kHz A-line per second, a central wavelength of 1.05 µm, and a depth resolution of 7µm. The functional information regarding the vibrating vocal folds, such as vibratingfrequency, vibrating amplitude, and speed was obtained by fitting the surface curve of thevibrating vocal fold. To the best of our knowledge, this is the first time high quality andcross-sectional velocity distribution images of the vibrating vocal fold were obtained with anOCT and ODT system at a frame rate of 100 frames per second.
2. Experiment setup and sample preparation2.1 OCT system setup
The schematic of the OCT and ODT system is shown in Fig. 1. The laser source is a highspeed swept laser source with a central wavelength of 1050 nm and a sweeping speed of 100kHz (Axsun Technology, Billerica, MA). The MEMS-based compact laser source has a highcoherence length (>10 mm), and these MEMS-based swept source OCT systems havedemonstrated a high sensitivity roll-off in ophthalmology applications [17]. The laser sourceoutput is split into the reference and sample arms by a 20:80 coupler with 80% in thereference arm and 20% in the sample arm. In the reference arm, the light is further split by a95:5 coupler. About 95% of the light in the reference is sent to cause interference with thecollected back-reflection or backscattering signal from the sample. This interference signalis detected by a balanced photon detector and digitized by a high speed digitizer (ATS 9350,Alazar Technologies Inc., Pointe-Claire, QC, Canada). The remaining 5% of the light in thereference arm is sent to a non-balanced photon-detector after passing through cover slides
Liu et al. Page 2
Opt Express. Author manuscript; available in PMC 2011 July 6.
NIH
-PA Author Manuscript
NIH
-PA Author Manuscript
NIH
-PA Author Manuscript
and is then finally digitized by another channel in the digitizer. The system can work in twomodes, i.e. OCT or ODT modes. In OCT mode, only the signal from the channel thatconnects to the balanced photon-detector is acquired and digitized. In ODT mode, signalsfrom both channels are acquired. The measured system sensitivity is 101.2 dB around thezero path difference.
The phase stability of the system is very important for a phase resolved Doppler OCTsystem. Due to the mechanical scanning components used in the tunable filters of the sweptsource laser, the swept source laser based FD ODT systems encounter worse phase stabilityissues than spectrometer-based FD ODT systems. Usually, a static surface may be added asa reference to correct phase error and improve the phase stability. Our group has used thetop surface of chick chorioallantoic membrane (CAM) as a reference to obtain the bloodflow in a CAM [18]. Vakoc et al. have proposed a method to tap 1% of the sample arm anddirect it at a calibration mirror, which is positioned near the maximum imaging range of thesystem [19]. In this manuscript, a common-path method was used to correct phase errorssimilar to that presented by Adler et al. [20]. We tapped 5% of the light from the referencearm and pass it through a cover glass with a thickness of 1 mm. The two surfaces of thecover glass generated an inference fringe. This produced a reference surface at a depthcorresponding to the thickness of the cover glass. By subtracting a portion of the phasedifference of the reference surface location from the phase difference of the sample signal,the phase error was corrected [19]. Figures 2 (a) and 2(b) show the OCT structure image andthe phase difference between successive A-lines before correction for a mirror respectively.Figure 2(c) shows the phase difference between successive A-lines after the correction. Theimprovement can be clearly seen by comparing the images in Fig. 2(b) and Fig. 2(c). In themethod proposed here, the reference surface calibration was obtained by taking a portion ofthe reference arm light in order to be detected by another channel of the digitizer. Thesample signals were not affected by the calibration procedure, so that the system parameters,such as sensitivity and imaging range, were kept just the same as in a normal non-calibrationprocedure.
2.2 Sample preparationFresh porcine larynges, with an intact trachea, were obtained from a local biological tissuessupply company. Then, larynges were dissected with removal of supraglottic tissue exposingthe vocal fold, but leaving key structures (arytenoid cartilages, anterior commissure, thyroidcartilage) intact. A nylon suture was placed to approximate position the arytenoid cartilagesand thus create adduction of the vocal folds. Once the vocal folds were exposed, the larynxwas mounted on a custom made mount and air supply device. A cuffed endotracheal tubewas placed from below into the trachea, and to avoid air leakage the cuff was inflated. Then,warm air at different flow velocities was delivered through the endotracheal tube through thetrachea and past the glottis to vibrate the vocal folds. Figures 3 (a) and (b) show the sideview and top view photographs of the larynges mounted on the holder. A total of 6 laryngeswere prepared and investigated in this study.
3. Experimental results and analysis3.1 M-mode imaging
The M-mode was first used to image the vibrating vocal fold. In M-mode imaging, the laserbeam is not scanning and OCT images provide the depth profile of a single location atdifferent times. The location of the incident beam is shown as the red dot in Fig. 3(b). Figure4 shows the M-mode OCT structure image. The oscillation pattern of the vocal fold can beclearly seen from the images. The parameters such as oscillation period, amplitude, andspeed are important to analysis of the imaged sample. In order to get these parameters, we
Liu et al. Page 3
Opt Express. Author manuscript; available in PMC 2011 July 6.
NIH
-PA Author Manuscript
NIH
-PA Author Manuscript
NIH
-PA Author Manuscript
first found the surface curve of the vocal fold by an intensity threshold method. The surfaceis overlapped with the OCT image as depicted by the solid red line in Fig. 4. Hsaio et al.used a bilaterally fixed-ends vibrating string model to simulate the vocal vibration [11]. At afixed location, the surface curve can be described by a sine function:
(1)
where y(t) is the surface location at time t, A is the amplitude of the vibration, w is the periodof the vibration, tc and y0 are two parameters decided by the acquisition start time and initialsurface location of the sample at rest respectively. By fitting the surface curve in Fig. 4 withEq. (1), these parameters can be obtained. Figure 5 shows the curve fitting results togetherwith the data. Clearly, the sine function fits well with the curve of tissue surface movement,especially in the down slope of the vibration. The amplitude A was found to be 709 µm andw was 5.3 ms. The period was 10.6 ms and the vibration frequency was 94.3 Hz. Fromequation, the velocity of the tissue surface movement can also be obtained. This can beobtained with the following equation:
(2)
where v(t) the velocity at the tissue surface and the other parameters are the same as in Eq.(1). The maximum velocity is shown in Eq. (3), which is 0.415 m/s in this case.
(3)
We obtained the velocity of the tissue surface with the above mentioned fitting method. Inaddition to the velocity of the tissue surface, the velocity distribution beneath the tissuesurface is also valuable. Kobler et al. have used a particle image velocimetry to obtain thevelocity distribution [16]. In our case, we used the phase resolved ODT to obtain thevelocity distribution. Phase resolved ODT has been used to image blood vessels in tissue; inaddition, it utilizes the phase difference between adjacent A-lines to estimate the velocityvalue along the incident light beam direction. The Doppler frequency caused by the samplemovement in the axial direction can be obtained by the following equation:
(4)
where fd is the Doppler frequency, vz is the sample velocity along the light beam direction,λc is the central wavelength of the incident beam, Δθ is the phase difference betweenadjacent A-lines, and T is the time difference between adjacent A-lines. Figure 6 shows thevelocity distribution of a cross-sectional image obtained with the phase resolved Dopplermethod. In Fig. 6 a quasi-periodic pattern was caused by phase wrapping, and the phasedifference is wrapped between −π and π. However, wrapped phase images also give thequalitative information regarding the acceleration. The absolute value of the velocity can beobtained using the following simple method.
According to Eq. (4), we can find that the velocity may be expressed as:
Liu et al. Page 4
Opt Express. Author manuscript; available in PMC 2011 July 6.
NIH
-PA Author Manuscript
NIH
-PA Author Manuscript
NIH
-PA Author Manuscript

(5)
In this experiment, λc = 1.05 µm, T = 10 µs, and Δθ=2π corresponds to a velocity differenceof 0.0525 m/s. In Fig. 6, the black striations, as indicated by the white arrows, correspond toa velocity value of n×0.0525 m/s, where n is an integer. The regions with n=0 are decidedbased upon the peak and valley location of the oscillation. The values for n in the otherregions can then be decided by their relative distance to the n=0 region. In Fig. 6, themaximum n is 7 and the maximum velocity is between the velocities 0.3675 m/s and 0.42 m/s, which correspond to n=7 and n=8, respectively. Therefore, this value is close to themaximum velocity value obtained with the previous fitting method which shows the value is0.415 m/s. For Fig. 6 we can find that the velocity distribution in the down slope region isdifferent from that in the up slope region. In the down slope, the velocity distribution patternof the tissue surface is more like a sine function. The velocity changes fast at the peak andvalley regions, and it changes slower at the waist region. However, in the up slope thevelocity distribution pattern cannot be seen clearly.
3.2 B-Mode imagingThe B-mode OCT and ODT images are shown in Figs. 7(a) and 7(b). The solid green line inFig. 3(b) shows the location of the scanning trace. When analyzing B-mode images, weshould pay attention that the B-mode images are not “snap-shot” images of the vibrationsample, because each A-line is obtained at a different time. Taking the B-mode image as a“snap-shot” image may cause misleading results, especially when the frame rate of thesystem is close to or slower than the vibration frequency of the sample. A sliding windowcovering 50–100 A-lines may be used to analyze these images. The information provided inthis window can be considered as an “instant” or “snap-shot” image. Using the sameanalysis method proposed in the previous section, we can obtain the velocity distribution inthe B-mode cross-sectional images. Similarly, from the ODT image in Fig. 7(b), the velocitydistribution in the up slope and that of the down slope are different. As mentioned, thisimage is not a “snap-shot” image and the slopes mentioned here are different from the actual“instant” slopes of vibrating vocal folds. The velocity distribution pattern of the B-modeimage is similar to that of the M-mode image. In the down slope, the velocity distribution ismore like a sine function. In addition, the velocity changes faster at the peak and valleyregions and slower at the waist region. Consequently, the acceleration is larger at the peakand valley regions and smaller at the waist region. However, the acceleration in the up slopeis more uniform than that in the down slope, and the acceleration at the peak region is largerthan that at the valley region. On the other hand, from Fig. 5 we are able to see that the sinefunction fitting of the vibrating tissue surface works better during the down slope thanduring the up slope. Clearly, the mechanics of vocal fold vibration are very complex. Thevibration takes place not only in the vertical direction but also in the horizontal direction. Inthe setup used here, phase resolved color Doppler can only detect the velocity in the verticaldirection. Doppler variance is an extension of the Doppler imaging technique; it uses thebandwidth of the Doppler spectrum to quantify the transverse speed of the imaging sample[21]. The transverse velocity of the vibrating vocal fold with the Doppler variance image isquantified in Fig. 7(c). We can see that the horizontal velocity is high at the waist region andlow at the peak and valley region.
Due to the limited penetration depth of the OCT, the velocity distribution at greater depthsinside the tissue cannot be resolved with the current technique. Slower vibrations may easethe requirement for deeper penetration, and some mechanical properties may be found fromthe superficial layers of the vocal fold. By controlling the volume of the air flow rate, we are
Liu et al. Page 5
Opt Express. Author manuscript; available in PMC 2011 July 6.
NIH
-PA Author Manuscript
NIH
-PA Author Manuscript
NIH
-PA Author Manuscript

able to control the frequency and amplitude of the vocal fold vibration. Figure 8 shows a B-mode OCT structure, color Doppler, and Doppler variance images of the vocal fold vibratingat slow frequency and small amplitude. The images are acquired at 100 frames per second.Figure 9 is the movie of the B-mode images replayed at a slower 10 frames per second. Thevelocity distribution at different time points can be seen from the movie. Figure 10 showsfour ODT images extracted from the movie with the time difference between adjacentimages being 12 milliseconds. The velocity distribution in the cross-section of the vocal foldcan be obtained by the color Doppler images. An interesting phenomenon is that the changein velocity is in the radial direction, as pointed out by the blue arrows in Fig. 10. Althoughthis phenomenon has been found in the waist region of the fast vibration case, as shown inFig. 6 and Fig. 7, this phenomenon is more evident in the case of slower vibration like thatin Fig. 10. Furthermore, the radial directed velocity in this area is changing when the wavetravels from right to the left, as shown in the progression of Fig. 10(a)–(d). For these images,we can also quantify the wave traveling speed in the horizontal direction. The distancebetween the two yellow vertical lines in Fig. 10(a) and Fig. 10(c) is 224 µm. Since the timedifference between Fig. 10(a) and Fig. 10(c) is 24 ms (12 ms × 2 = 24 ms), the velocity forthe transverse wave is 9.3 mm/s (assume a constant velocity for the wave).
4. DiscussionFor phase resolved Doppler OCT, the minimum detectable velocity is decided by the phasestability of the system. For the current setup, the phase stability of the system is measured tobe less than 5 milliradians. According to Eq. (5) in this manuscript, this phase stabilitycorresponds to a speed of 42 µm/s. The maximum speed with Doppler OCT is usuallydecided by the phase wrapping, which corresponds to a phase difference of 2π. Furthermore,this phase difference corresponds to a speed of 0.0525 m/s. With the method introduced insection 3.1 of this paper, or phase unwrapping methods, we are able to obtain a velocitylarger than 0.0525 m/s. The accurate results that the system can provide are dependent uponthe velocity, frequency, and amplitude of the vibration sample. The velocity is decided bythe amplitude and frequency of the vibration sample. When the sample is vibrating too fast,the Doppler effect will induce erroneous depth information, and the axial resolution will bedegraded [16, 22]. The duty cycle of the laser used in this study is around 50%, and theactual integration time period for one single A-line is around 5 µs. If we set the intolerableaxial sample movement during one integration period as the axial resolution (7 µm) of thecurrent system [16, 22], then the axial direction velocity that will not introduce anintolerable depth is 1.4 m/s in our setup. The largest velocity demonstrated in thisexperiment is 0.415 m/s. This corresponds to an axial movement of around 2 µm during theintegration time of one A-line.
As mentioned in section 3.2, the B-mode images are not “snap-shot” images of the vibrationsample. When the frame rate of the system is slower than the vibration frequency of thesample, the information for the whole frame is not obtained at the same time and taking theB-mode image as a “snap-shot” image may cause misleading results. However, the velocityand acceleration information provided by color Doppler and Doppler variance images arecorrected because the phase resolved methods use 2 adjacent A-lines to obtain thisinformation. A sliding window covering 50–100 A-lines was used to analyze these B-modeimages in this study. The information provided in this window can be considered as an“instant” or “snap-shot” image. In order to obtain a “snap-shot” like B-scan image, theframe rate of the system must be much higher than the vibration frequency. This may berealized by decreasing the number of A-lines per frame or by increasing the A-line speed ofthe swept source laser.
Liu et al. Page 6
Opt Express. Author manuscript; available in PMC 2011 July 6.
NIH
-PA Author Manuscript
NIH
-PA Author Manuscript
NIH
-PA Author Manuscript

Although bulk motion is not applicable in our current experiment, the human bulk motionwill affect the results of the Doppler OCT for awake patient imaging. There is extensiveexperience regarding bulk motion from OCT ophthalmology applications [23,24]. The bulkmotion will introduce bulk phase and usually the structural images will not be affected. Thevibration frequency, amplitude and period are extracted from the structure images and weestimate that the bulk motion will not affect the extraction of these parameters. However, thevelocity information is obtained with the phase-revolved method and will be affected bybulk motion. The bulk motion artifacts may not be able to be eliminated with the histogram-based statistic method usually adopted in ophthalmology application. A way to minimizethis effect is to increase the speed of the system so that the imaging time is reduced. In thecurrent setup for B-mode imaging, the imaging speed is 100 frames per second with 1000 Alines per frame. We can increase the frame rate further by decreasing the number of A linesper frame or by increasing the sweeping rate the laser by a buffering technique [17].
5. SummaryFunctional imaging of vibrating ex-vivo porcine vocal folds was demonstrated with a highspeed swept source OCT and ODT system. The functional information regarding thevibrating vocal folds was obtained with this high speed system. The tissue surface of thevibrating vocal folds was extracted to obtain functional information such as vibrationamplitude, vibration frequency, velocity, and acceleration. Color Doppler and Dopplervariance methods were used to obtain the velocity distribution characteristics in the crosssections. Essentially, the use of this system or one similar to it by physicians inotolaryngology could show how laryngeal carcinomas and other afflictions differ frombaseline characteristics, because factors such as velocity are monitored to show how theinertial movement of the tissue is affected.
AcknowledgmentsThis work was supported by the National Institutes of Health (EB-00293, EB-10090, RR-01192, HL-103764,HL-105215), Air Force Office of Scientific Research (FA9550-04-0101), and the Beckman Laser InstituteEndowment.
Reference and links1. Huang D, Swanson EA, Lin CP, Schuman JS, Stinson WG, Chang W, Hee MR, Flotte T, Gregory
K, Puliafito CA, Fujimoto JG. Optical coherence tomography. Science. 1991; 254(5035):1178–1181. [PubMed: 1957169]
2. Chen Z, Milner TE, Dave D, Nelson JS. Optical Doppler tomographic imaging of fluid flowvelocity in highly scattering media. Opt. Lett. 1997; 22(1):64–66. http://www.opticsinfobase.org/abstract.cfm?URI=ol-22-1-64. [PubMed: 18183104]
3. Chen Z, Milner TE, Srinivas S, Wang XJ, Malekafzali A, van Gemert MJC, Nelson JS. Noninvasiveimaging of in vivo blood flow velocity using optical Doppler tomography. Opt. Lett. 1997; 22(14):1119–1121. http://www.opticsinfobase.org/ol/abstract.cfm?URI=ol-22-14-1119. [PubMed:18185770]
4. Izatt JA, Kulkarni MD, Yazdanfar S, Barton JK, Welch AJ. In vivo bidirectional color Doppler flowimaging of picoliter blood volumes using optical coherence tomography. Opt. Lett. 1997; 22(18):1439–1441. http://www.opticsinfobase.org/abstract.cfm?URI=ol-22-18-1439. [PubMed: 18188263]
5. Zhao Y, Chen Z, Saxer C, Shen Q, Xiang S, de Boer JF, Nelson JS. Doppler standard deviationimaging for clinical monitoring of in vivo human skin blood flow. Opt. Lett. 2000; 25(18):1358–1360. http://www.opticsinfobase.org/abstract.cfm?URI=ol-25-18-1358. [PubMed: 18066216]
6. Zhao Y, Chen Z, Saxer C, Xiang S, de Boer JF, Nelson JS. Phase-resolved optical coherencetomography and optical Doppler tomography for imaging blood flow in human skin with fast
Liu et al. Page 7
Opt Express. Author manuscript; available in PMC 2011 July 6.
NIH
-PA Author Manuscript
NIH
-PA Author Manuscript
NIH
-PA Author Manuscript
scanning speed and high velocity sensitivity. Opt. Lett. 2000; 25(2):114–116. http://www.opticsinfobase.org/ol/abstract.cfm?URI=ol-25-2-114. [PubMed: 18059800]
7. White B, Pierce M, Nassif N, Cense B, Park B, Tearney G, Bouma B, Chen T, de Boer J. In vivodynamic human retinal blood flow imaging using ultra-high-speed spectral domain opticalcoherence tomography. Opt. Express. 2003; 11(25):3490–3497. http://www.opticsinfobase.org/oe/abstract.cfm?URI=oe-11-25-3490. [PubMed: 19471483]
8. Patel R, Dailey S, Bless D. Comparison of high-speed digital imaging with stroboscopy forlaryngeal imaging of glottal disorders. Ann. Otol. Rhinol. Laryngol. 2008; 117(6):413–424.[PubMed: 18646437]
9. Lohscheller J, Eysholdt U, Toy H, Dollinger M. Phonovibrography: mapping high-speed movies ofvocal fold vibrations into 2-D diagrams for visualizing and analyzing the underlying laryngealdynamics. IEEE Trans. Med. Imaging. 2008; 27(3):300–309. [PubMed: 18334426]
10. Lohscheller J, Eysholdt U. Phonovibrogram visualization of entire vocal fold dynamics.Laryngoscope. 2008; 118(4):753–758. [PubMed: 18216742]
11. Hsiao TY, Wang CL, Chen CN, Hsieh FJ, Shau YW. Elasticity of human vocal folds measured invivo using color Doppler imaging. Ultrasound Med. Biol. 2002; 28(9):1145–1152. [PubMed:12401384]
12. Tsai CG, Chen JH, Shau YW, Hsiao TY. Dynamic B-mode ultrasound imaging of vocal foldvibration during phonation. Ultrasound Med. Biol. 2009; 35(11):1812–1818. [PubMed: 19716224]
13. Dedecjus M, Adamczewski Z, Brzeziński J, Lewiński A. Real-time, high-resolutionultrasonography of the vocal folds--a prospective pilot study in patients before and afterthyroidectomy. Langenbecks Arch. Surg. 2010; 395(7):859–864. [PubMed: 20640934]
14. Lüerβen K, Lubatschowski H, Radicke N, Ptok M. Optical characterization of vocal folds usingoptical coherence tomography. Med. Laser Appl. 2006; 21(3):185–190.
15. Yu L, Liu G, Rubinstein M, Saidi A, Wong BJ, Chen Z. Office-based dynamic imaging of vocalcords in awake patients with swept-source optical coherence tomography. J. Biomed. Opt. 2009;14(6):064020. [PubMed: 20059258]
16. Kobler JB, Chang EW, Zeitels SM, Yun SH. Dynamic imaging of vocal fold oscillation with four-dimensional optical coherence tomography. Laryngoscope. 2010; 120(7):1354–1362. [PubMed:20564724]
17. Potsaid B, Baumann B, Huang D, Barry S, Cable AE, Schuman JS, Duker JS, Fujimoto JG.Ultrahigh speed 1050nm swept source/Fourier domain OCT retinal and anterior segment imagingat 100,000 to 400,000 axial scans per second. Opt. Express. 2010; 18(19):20029–20048. http://www.opticsinfobase.org/abstract.cfm?URI=oe-18-19-20029. [PubMed: 20940894]
18. Zhang J, Chen Z. In vivo blood flow imaging by a swept laser source based Fourier domain opticalDoppler tomography. Opt. Express. 2005; 13(19):7449–7457. http://www.opticsinfobase.org/abstract.cfm?URI=oe-13-19-7449. [PubMed: 19498770]
19. Vakoc B, Yun S, de Boer J, Tearney G, Bouma B. Phase-resolved optical frequency domainimaging. Opt. Express. 2005; 13(14):5483–5493. http://www.opticsinfobase.org/abstract.cfm?URI=oe-13-14-5483. [PubMed: 19498543]
20. Adler DC, Huber R, Fujimoto JG. Phase-sensitive optical coherence tomography at up to 370,000lines per second using buffered Fourier domain mode-locked lasers. Opt. Lett. 2007; 32(6):626–628. http://www.opticsinfobase.org/abstract.cfm?URI=ol-32-6-626. [PubMed: 17308582]
21. Ren H, Brecke KM, Ding Z, Zhao Y, Nelson JS, Chen Z. Imaging and quantifying transverse flowvelocity with the Doppler bandwidth in a phase-resolved functional optical coherence tomography.Opt. Lett. 2002; 27(6):409–411. http://www.opticsinfobase.org/ol/abstract.cfm?URI=ol-27-6-409.[PubMed: 18007817]
22. Yun SH, Tearney G, de Boer J, Bouma B. Motion artifacts in optical coherence tomography withfrequency-domain ranging. Opt. Express. 2004; 12(13):2977–2998. http://www.opticsinfobase.org/abstract.cfm?URI=oe-12-13-2977. [PubMed: 19483816]
23. Makita S, Hong Y, Yamanari M, Yatagai T, Yasuno Y. Optical coherence angiography. Opt.Express. 2006; 14(17):7821–7840. http://www.opticsinfobase.org/abstract.cfm?URI=oe-14-17-7821. [PubMed: 19529151]
Liu et al. Page 8
Opt Express. Author manuscript; available in PMC 2011 July 6.
NIH
-PA Author Manuscript
NIH
-PA Author Manuscript
NIH
-PA Author Manuscript

24. An L, Subhush HM, Wilson DJ, Wang RK. High-resolution wide-field imaging of retinal andchoroidal blood perfusion with optical microangiography. J. Biomed. Opt. 2010; 15(2):026011.[PubMed: 20459256]
Liu et al. Page 9
Opt Express. Author manuscript; available in PMC 2011 July 6.
NIH
-PA Author Manuscript
NIH
-PA Author Manuscript
NIH
-PA Author Manuscript
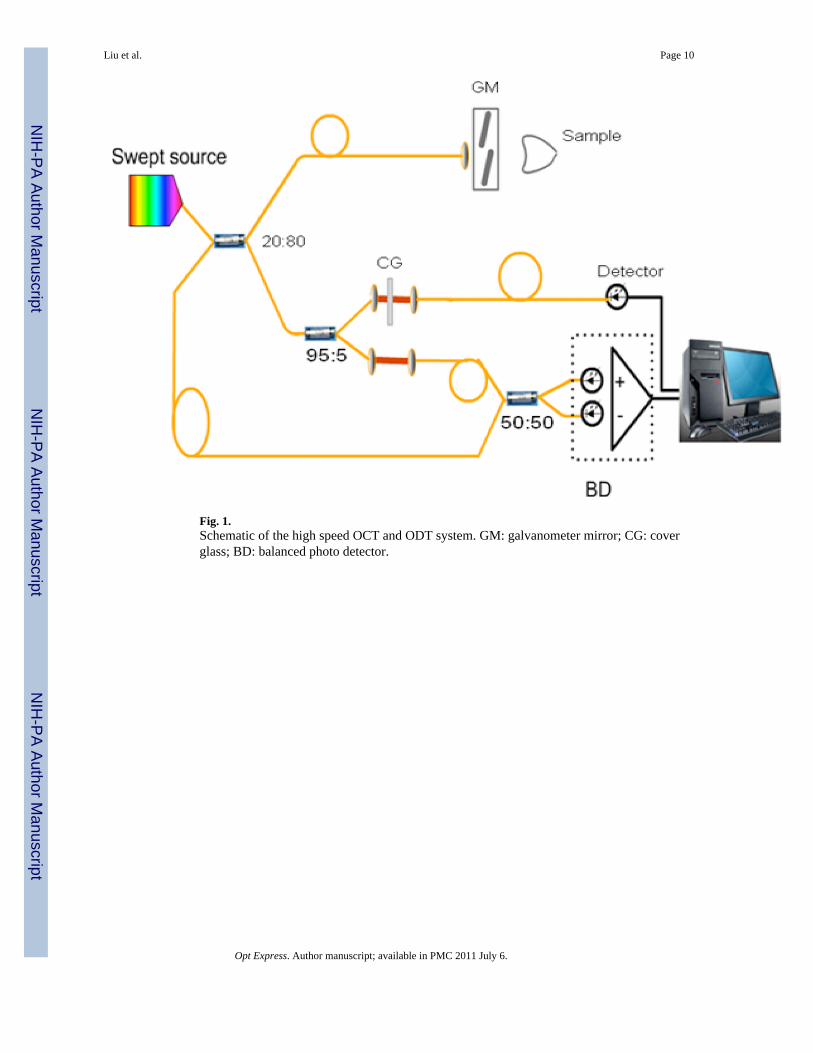
Fig. 1.Schematic of the high speed OCT and ODT system. GM: galvanometer mirror; CG: coverglass; BD: balanced photo detector.
Liu et al. Page 10
Opt Express. Author manuscript; available in PMC 2011 July 6.
NIH
-PA Author Manuscript
NIH
-PA Author Manuscript
NIH
-PA Author Manuscript

Fig. 2.(a) OCT images of a mirror; (b) Adjacent A-line phase difference before correction; (c)Adjacent A-line phase difference after correction.
Liu et al. Page 11
Opt Express. Author manuscript; available in PMC 2011 July 6.
NIH
-PA Author Manuscript
NIH
-PA Author Manuscript
NIH
-PA Author Manuscript
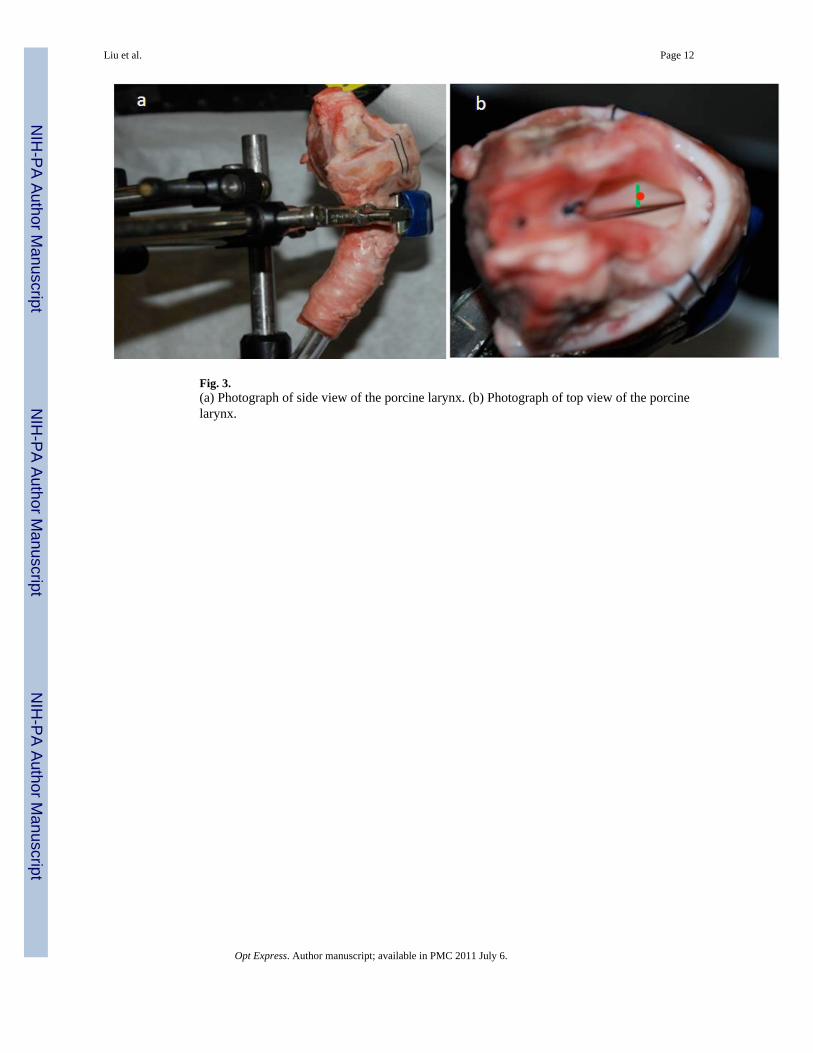
Fig. 3.(a) Photograph of side view of the porcine larynx. (b) Photograph of top view of the porcinelarynx.
Liu et al. Page 12
Opt Express. Author manuscript; available in PMC 2011 July 6.
NIH
-PA Author Manuscript
NIH
-PA Author Manuscript
NIH
-PA Author Manuscript
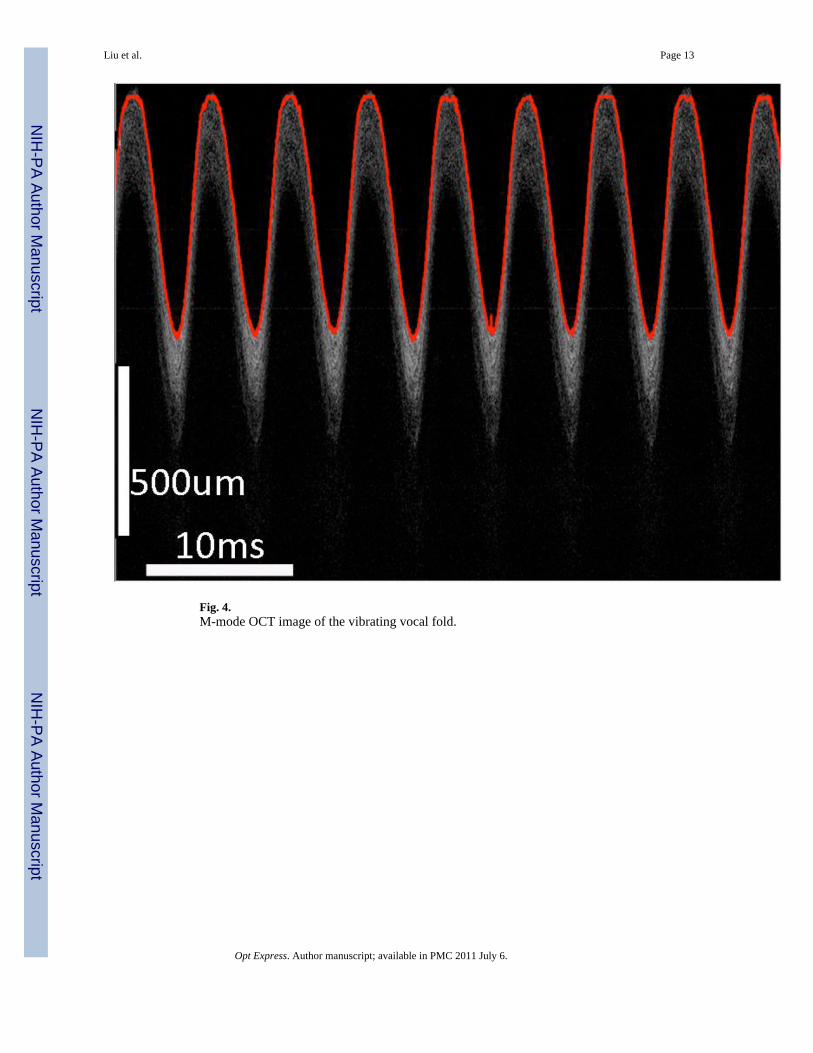
Fig. 4.M-mode OCT image of the vibrating vocal fold.
Liu et al. Page 13
Opt Express. Author manuscript; available in PMC 2011 July 6.
NIH
-PA Author Manuscript
NIH
-PA Author Manuscript
NIH
-PA Author Manuscript
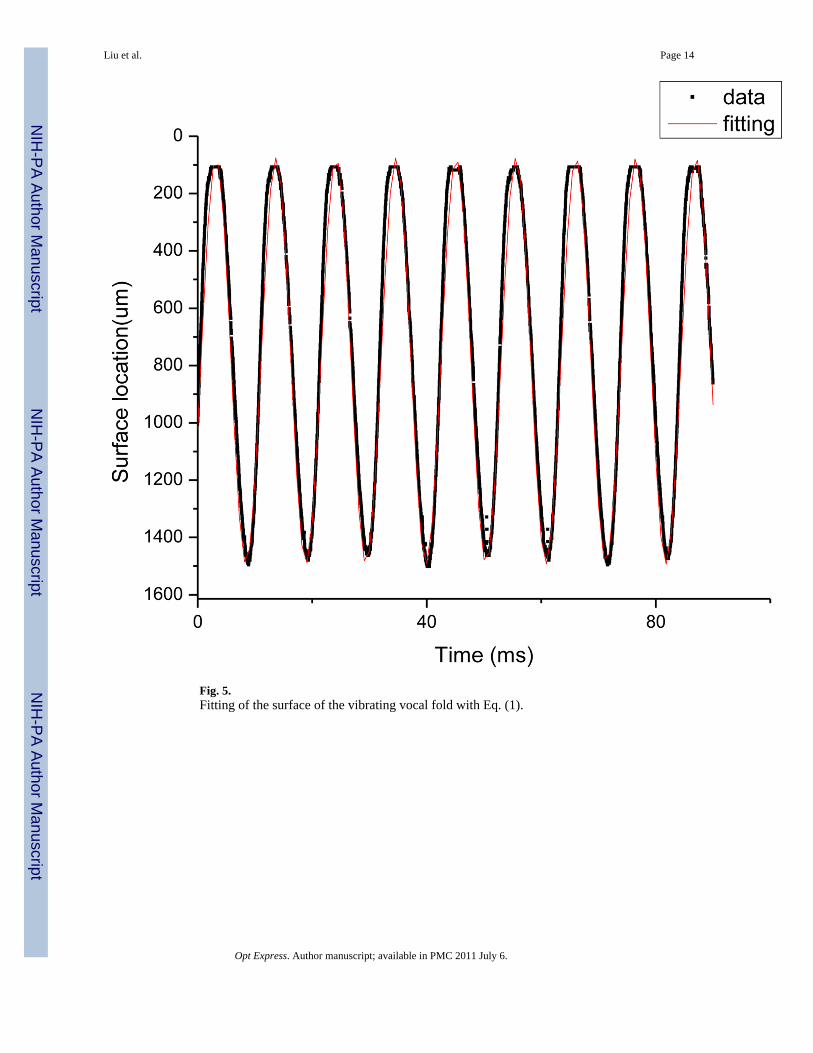
Fig. 5.Fitting of the surface of the vibrating vocal fold with Eq. (1).
Liu et al. Page 14
Opt Express. Author manuscript; available in PMC 2011 July 6.
NIH
-PA Author Manuscript
NIH
-PA Author Manuscript
NIH
-PA Author Manuscript
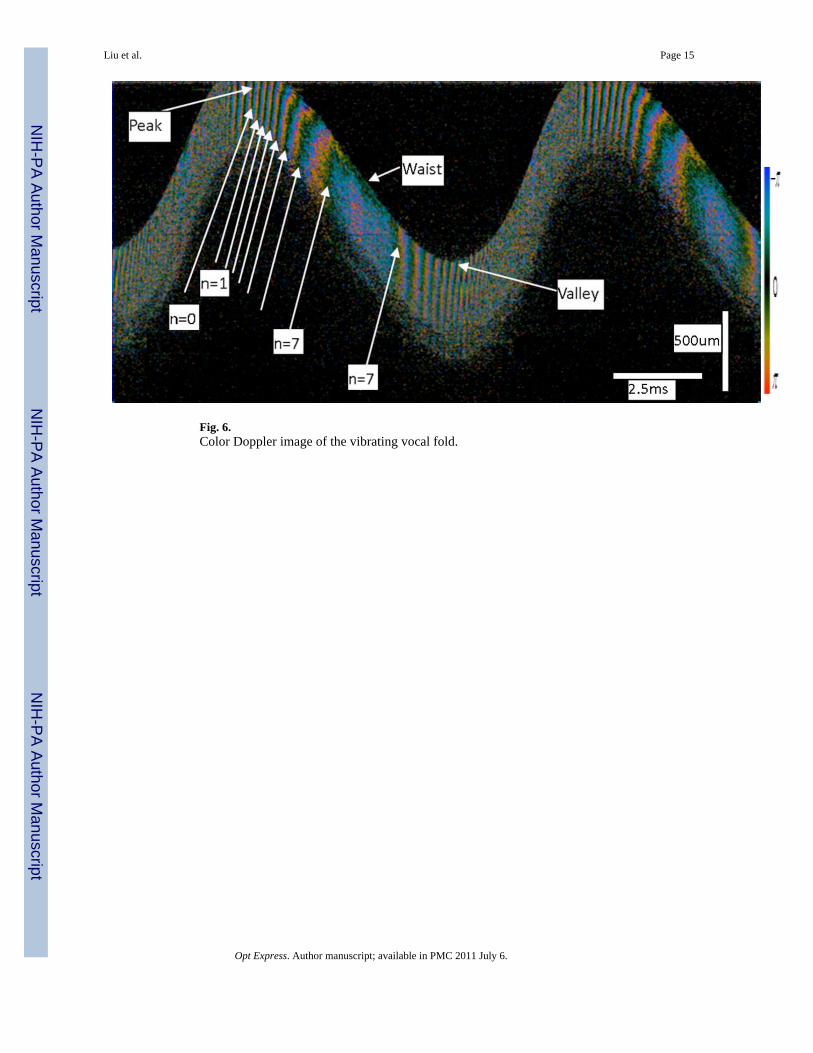
Fig. 6.Color Doppler image of the vibrating vocal fold.
Liu et al. Page 15
Opt Express. Author manuscript; available in PMC 2011 July 6.
NIH
-PA Author Manuscript
NIH
-PA Author Manuscript
NIH
-PA Author Manuscript
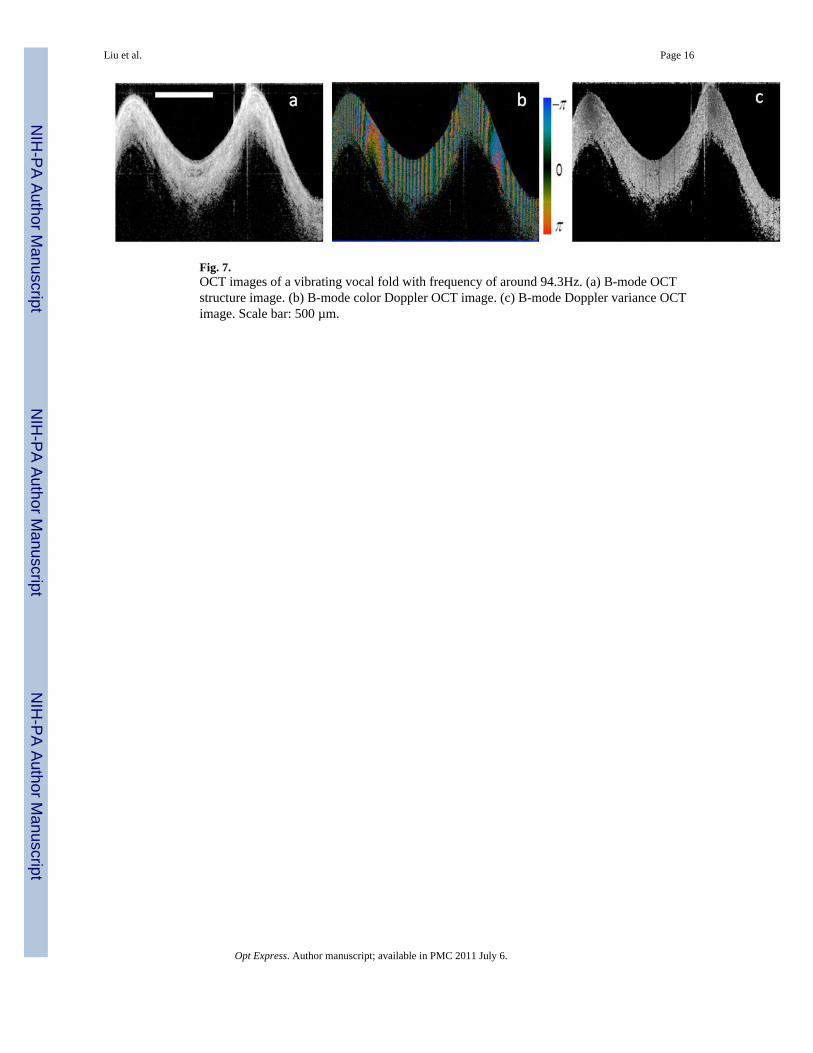
Fig. 7.OCT images of a vibrating vocal fold with frequency of around 94.3Hz. (a) B-mode OCTstructure image. (b) B-mode color Doppler OCT image. (c) B-mode Doppler variance OCTimage. Scale bar: 500 µm.
Liu et al. Page 16
Opt Express. Author manuscript; available in PMC 2011 July 6.
NIH
-PA Author Manuscript
NIH
-PA Author Manuscript
NIH
-PA Author Manuscript
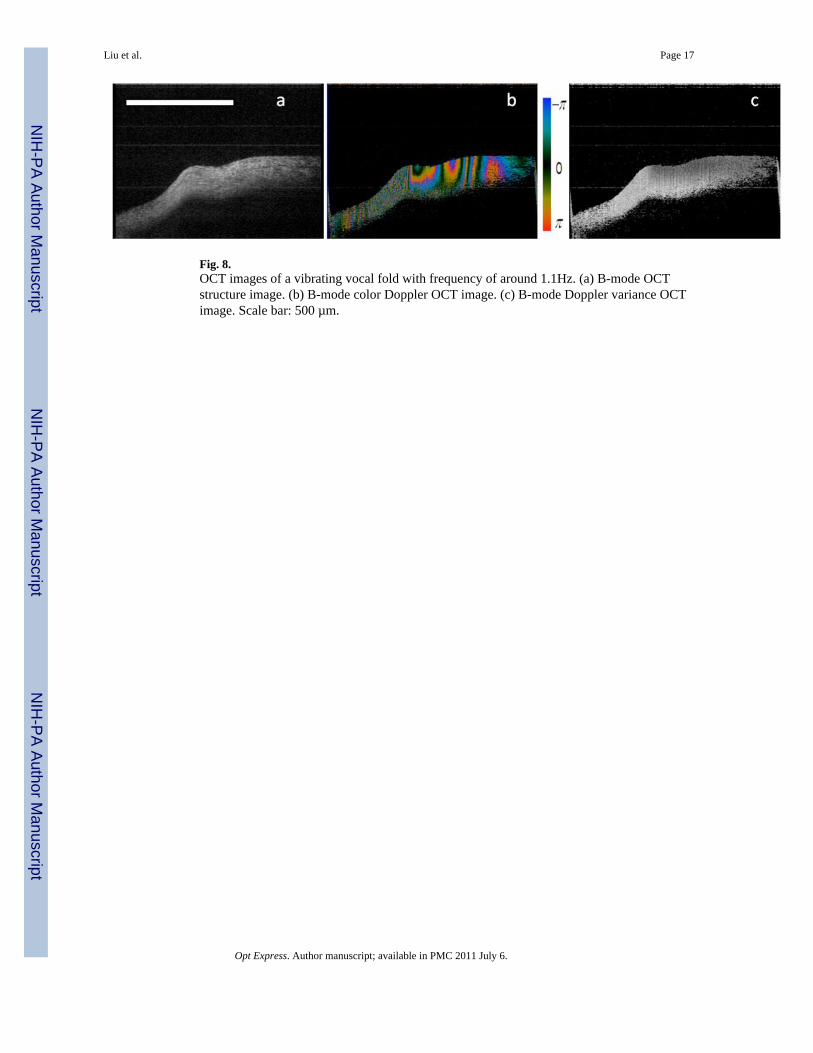
Fig. 8.OCT images of a vibrating vocal fold with frequency of around 1.1Hz. (a) B-mode OCTstructure image. (b) B-mode color Doppler OCT image. (c) B-mode Doppler variance OCTimage. Scale bar: 500 µm.
Liu et al. Page 17
Opt Express. Author manuscript; available in PMC 2011 July 6.
NIH
-PA Author Manuscript
NIH
-PA Author Manuscript
NIH
-PA Author Manuscript

Fig. 9.OCT Movies of a vibrating vocal fold with frequency of around 1.1Hz. (a) B-mode OCTstructure image (Media 1). (b) B-mode color Doppler OCT image (Media 2). (c) B-modeDoppler variance OCT image (Media 3).
Liu et al. Page 18
Opt Express. Author manuscript; available in PMC 2011 July 6.
NIH
-PA Author Manuscript
NIH
-PA Author Manuscript
NIH
-PA Author Manuscript
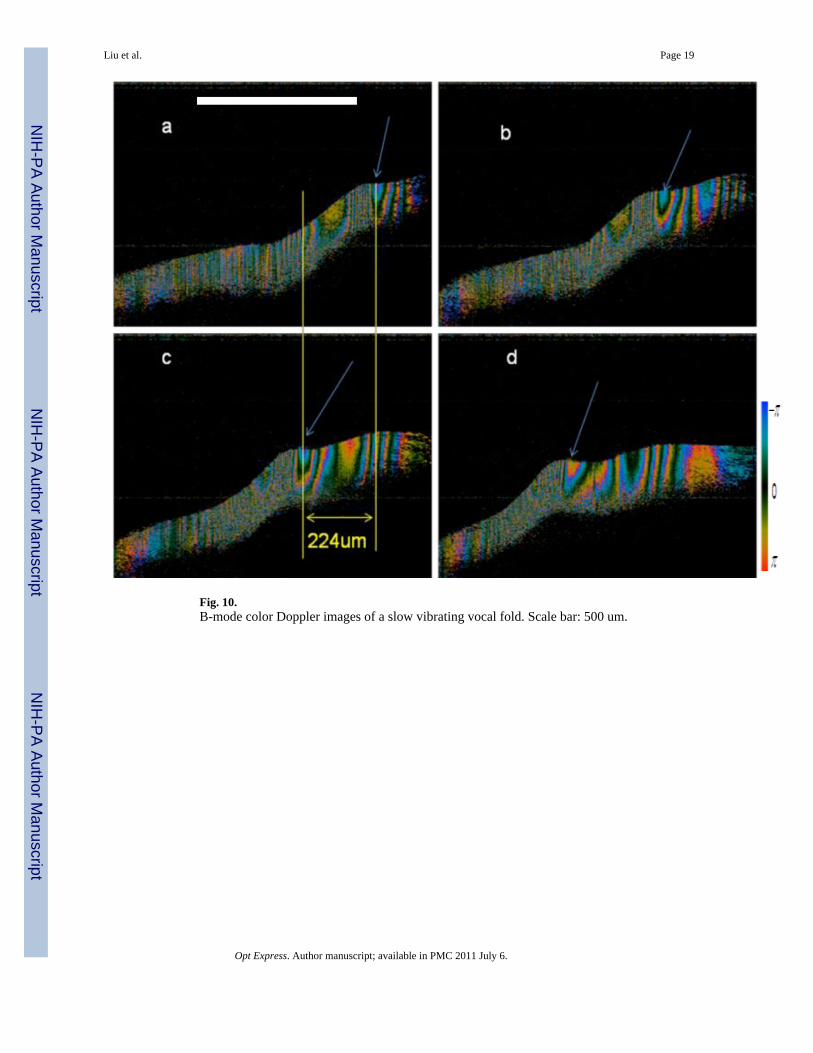
Fig. 10.B-mode color Doppler images of a slow vibrating vocal fold. Scale bar: 500 um.
Liu et al. Page 19
Opt Express. Author manuscript; available in PMC 2011 July 6.
NIH
-PA Author Manuscript
NIH
-PA Author Manuscript
NIH
-PA Author Manuscript