nielsen - evolving markets and consumer e-book purchasing behavior
DESCRIPTION
David Walter (Nielsen) shows some numbers about US, Europe and Italy.TRANSCRIPT

David Walter 19 March 2013
EVOLVING MARKETS AND CONSUMER E-BOOK PURCHASING BEHAVIOUR
Co
pyr
igh
t ©
2012
Th
e N
iels
en C
om
pan
y. C
on
fid
enti
al a
nd
pro
pri
etar
y.
2
• Context
• Consumer Confidence and International Print Book Markets
• Connected devices adoption
• US and Italy e-reader and tablet penetration
• Manufacturer market share
• The UK e-book market
• E-book penetration and the rate of change
• The value of the e-book and print book market
• E-book pricing and the consequence for print book prices
CONTEXT
Co
pyr
igh
t ©
2012
Th
e N
iels
en C
om
pan
y. C
on
fid
enti
al a
nd
pro
pri
etar
y.
4
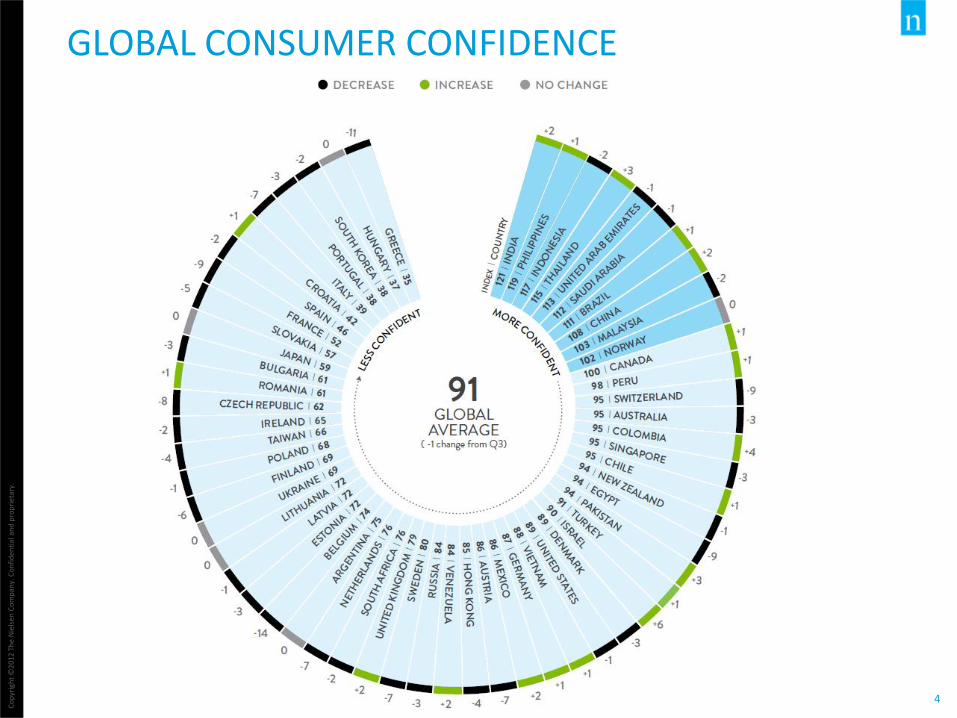
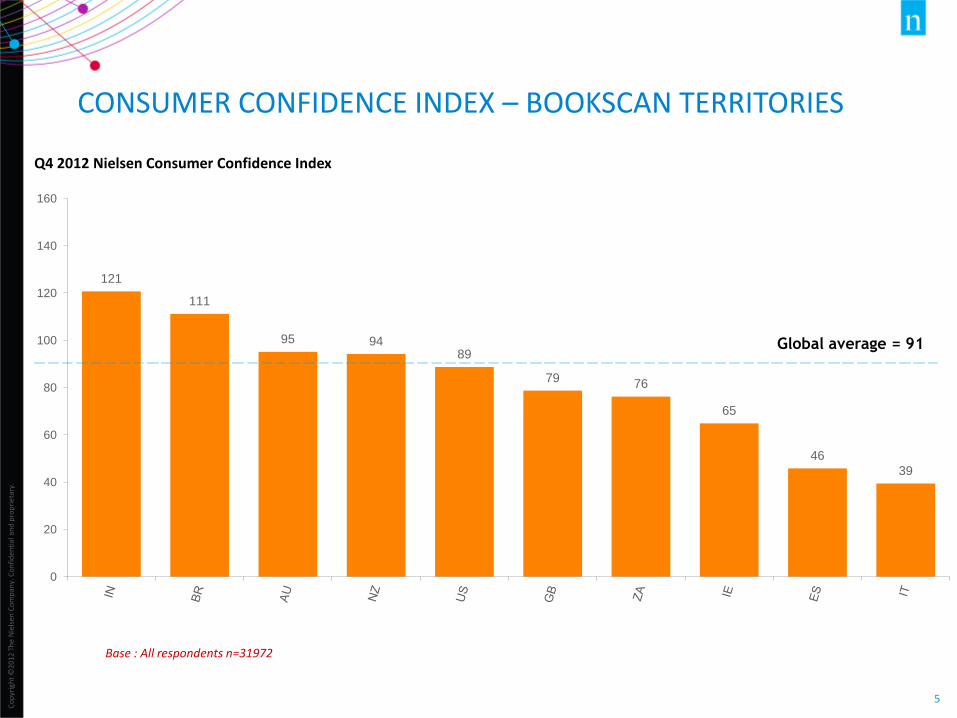
GLOBAL CONSUMER CONFIDENCE
Co
pyr
igh
t ©
2012
Th
e N
iels
en C
om
pan
y. C
on
fid
enti
al a
nd
pro
pri
etar
y.
5
121
111
95 94 89
79 76
65
46
39
0
20
40
60
80
100
120
140
160
Global average = 91
Q4 2012 Nielsen Consumer Confidence Index
CONSUMER CONFIDENCE INDEX – BOOKSCAN TERRITORIES
Base : All respondents n=31972
Co
pyr
igh
t ©
2012
Th
e N
iels
en C
om
pan
y. C
on
fid
enti
al a
nd
pro
pri
etar
y.
6
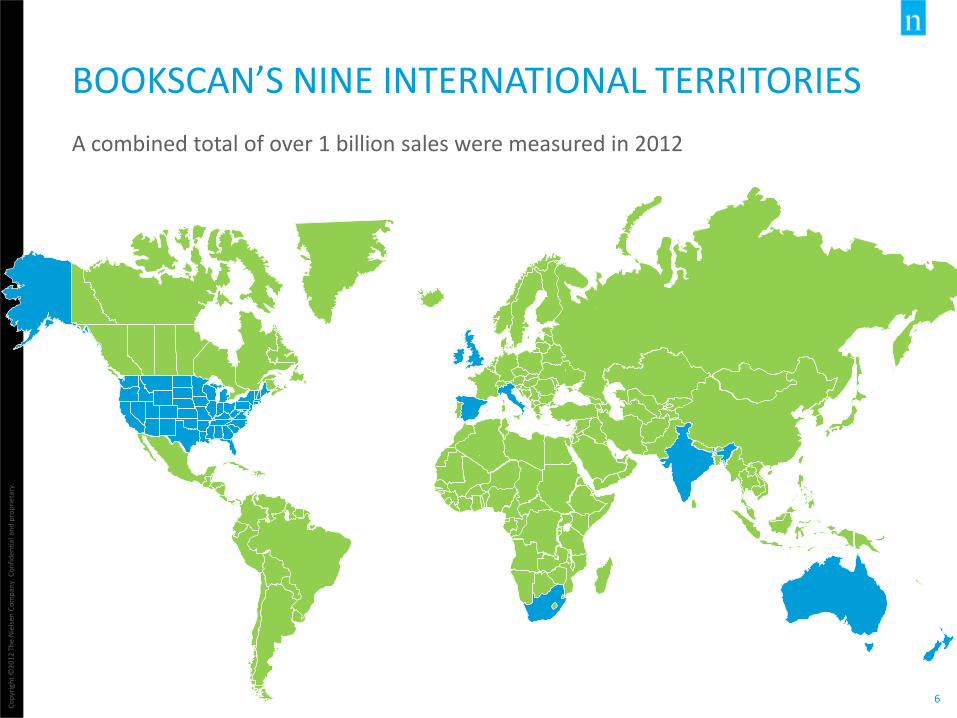
BOOKSCAN’S NINE INTERNATIONAL TERRITORIES
A combined total of over 1 billion sales were measured in 2012
Co
pyr
igh
t ©
2012
Th
e N
iels
en C
om
pan
y. C
on
fid
enti
al a
nd
pro
pri
etar
y.
7
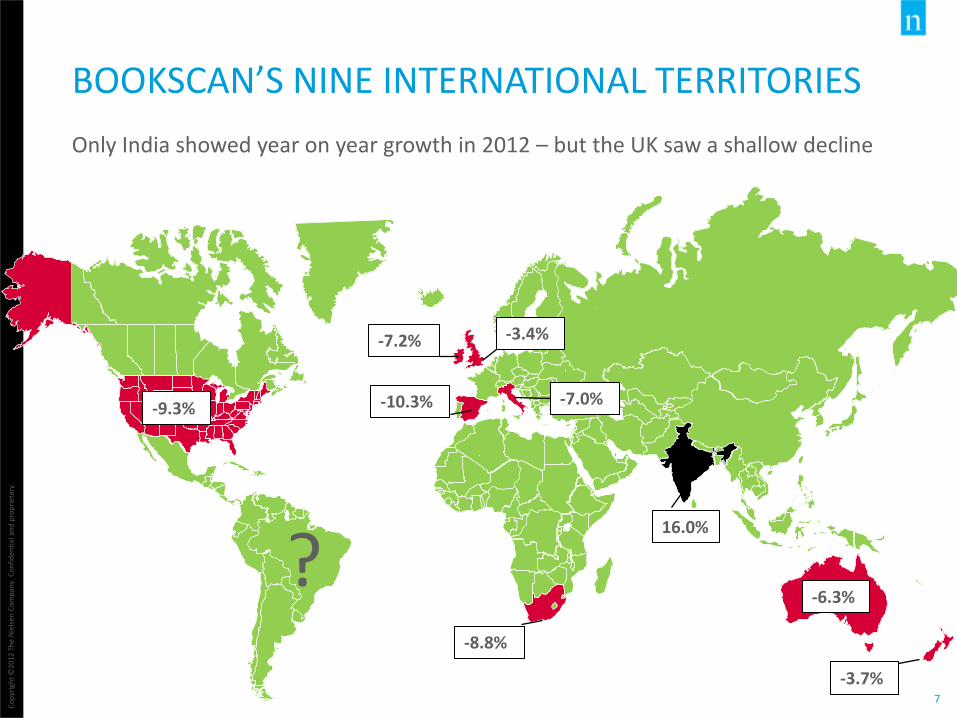
-7.2% -3.4%
-7.0% -10.3%
-8.8%
-6.3%
-9.3%
16.0%
-3.7%
BOOKSCAN’S NINE INTERNATIONAL TERRITORIES
Only India showed year on year growth in 2012 – but the UK saw a shallow decline
?
Co
pyr
igh
t ©
2012
Th
e N
iels
en C
om
pan
y. C
on
fid
enti
al a
nd
pro
pri
etar
y.
8
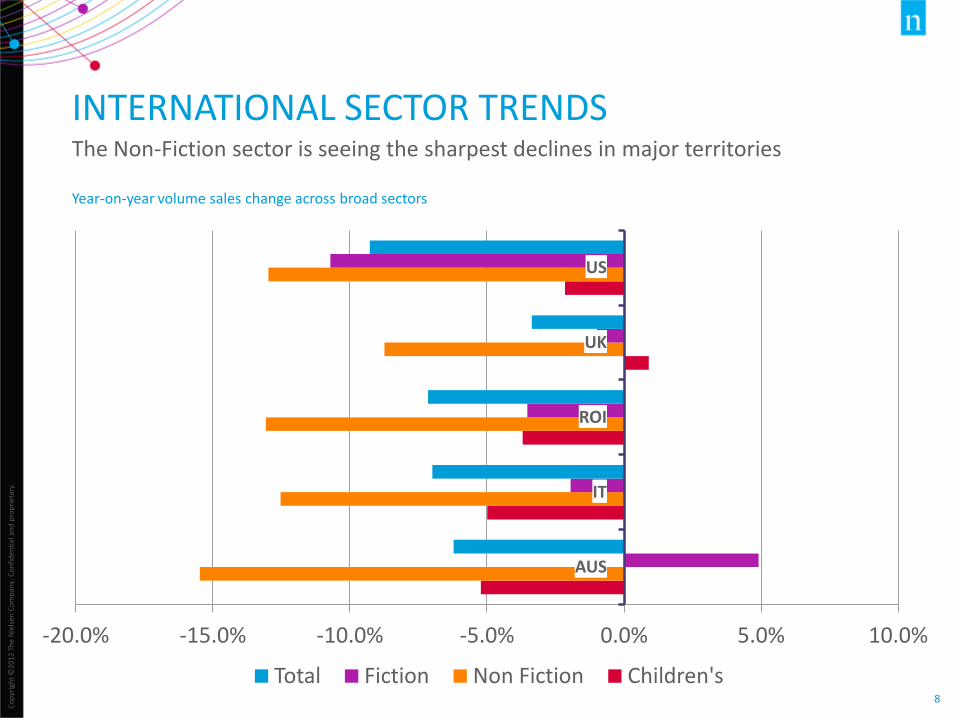
Year-on-year volume sales change across broad sectors
-20.0% -15.0% -10.0% -5.0% 0.0% 5.0% 10.0%
AUS
IT
ROI
UK
US
Total Fiction Non Fiction Children's
INTERNATIONAL SECTOR TRENDS The Non-Fiction sector is seeing the sharpest declines in major territories
THE UK E-BOOK MARKET
Co
pyr
igh
t ©
2012
Th
e N
iels
en C
om
pan
y. C
on
fid
enti
al a
nd
pro
pri
etar
y.
10
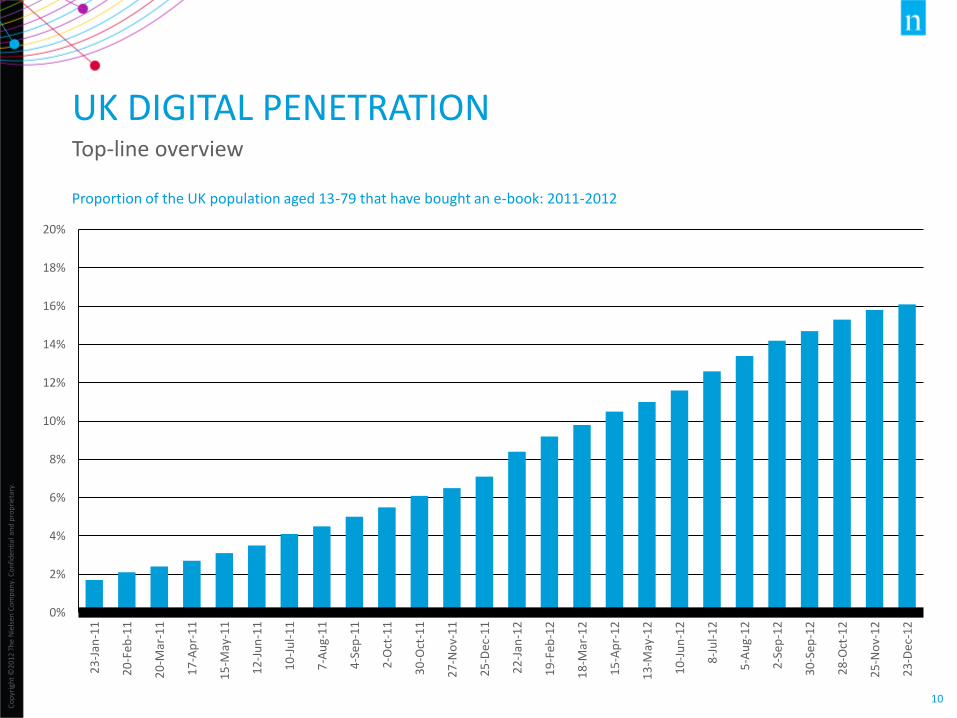
Proportion of the UK population aged 13-79 that have bought an e-book: 2011-2012
0%
2%
4%
6%
8%
10%
12%
14%
16%
18%
20%
23
-Jan
-11
20
-Feb
-11
20
-Mar
-11
17
-Ap
r-1
1
15
-May
-11
12
-Ju
n-1
1
10
-Ju
l-1
1
7-A
ug-
11
4-S
ep-1
1
2-O
ct-1
1
30
-Oct
-11
27
-No
v-1
1
25
-Dec
-11
22
-Jan
-12
19
-Feb
-12
18
-Mar
-12
15
-Ap
r-1
2
13
-May
-12
10
-Ju
n-1
2
8-J
ul-
12
5-A
ug-
12
2-S
ep-1
2
30
-Sep
-12
28
-Oct
-12
25
-No
v-1
2
23
-Dec
-12
UK DIGITAL PENETRATION Top-line overview
Co
pyr
igh
t ©
2012
Th
e N
iels
en C
om
pan
y. C
on
fid
enti
al a
nd
pro
pri
etar
y.
11
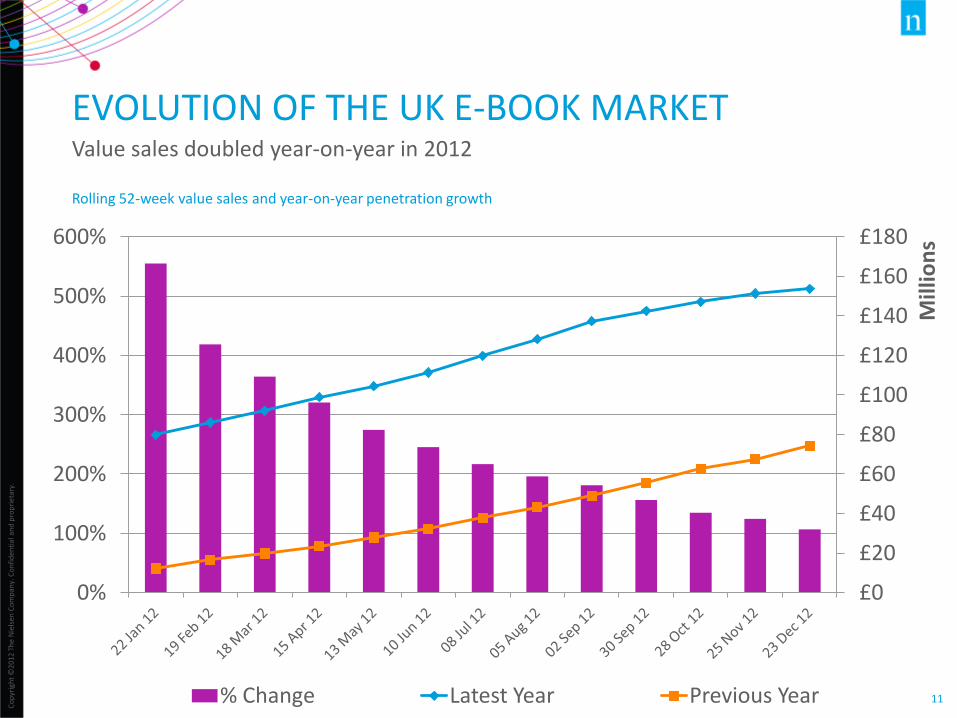
Rolling 52-week value sales and year-on-year penetration growth
£0
£20
£40
£60
£80
£100
£120
£140
£160
£180
0%
100%
200%
300%
400%
500%
600%
Mill
ion
s
% Change Latest Year Previous Year
EVOLUTION OF THE UK E-BOOK MARKET Value sales doubled year-on-year in 2012
Co
pyr
igh
t ©
2012
Th
e N
iels
en C
om
pan
y. C
on
fid
enti
al a
nd
pro
pri
etar
y.
12
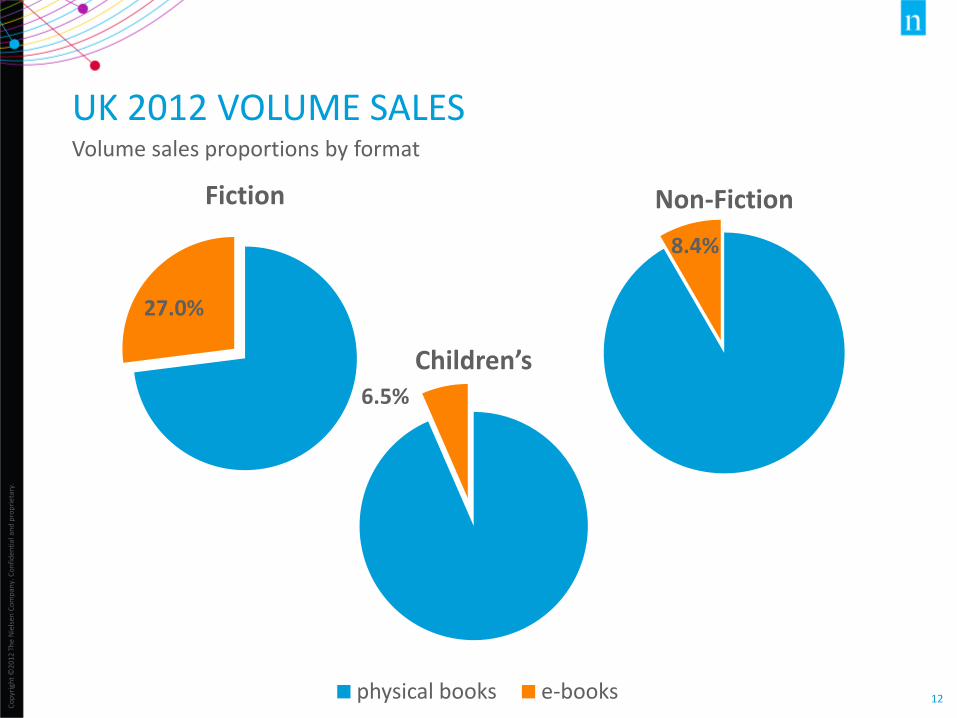
27.0%
Fiction
UK 2012 VOLUME SALES Volume sales proportions by format
8.4%
Non-Fiction
6.5%
Children’s
physical books e-books
Co
pyr
igh
t ©
2012
Th
e N
iels
en C
om
pan
y. C
on
fid
enti
al a
nd
pro
pri
etar
y.
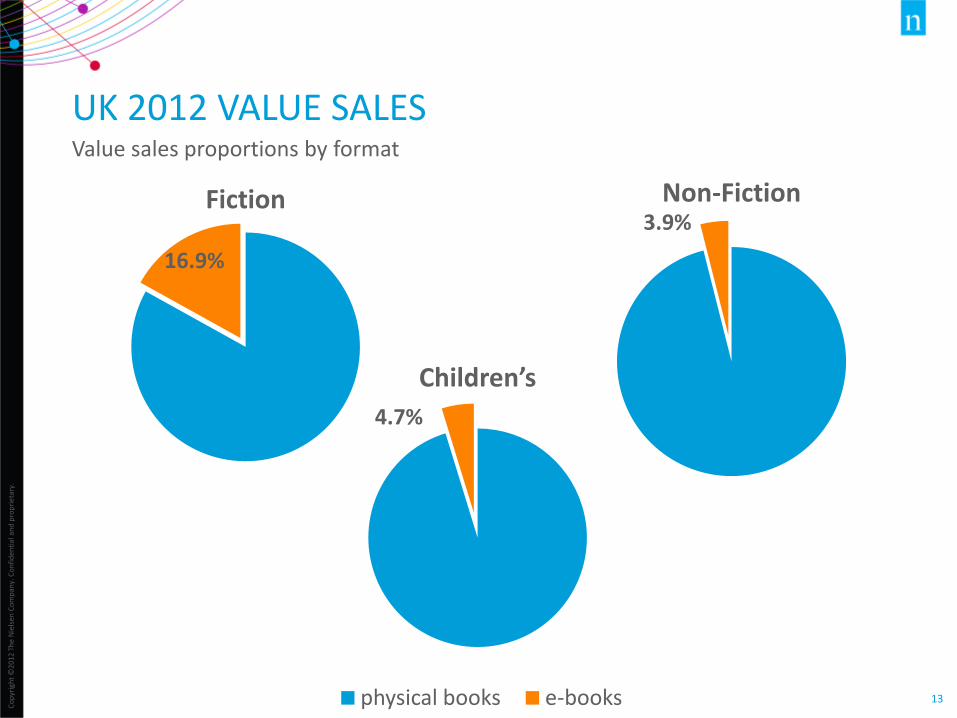
13
16.9%
Fiction
UK 2012 VALUE SALES Value sales proportions by format
3.9% Non-Fiction
4.7%
Children’s
physical books e-books
Co
pyr
igh
t ©
2012
Th
e N
iels
en C
om
pan
y. C
on
fid
enti
al a
nd
pro
pri
etar
y.
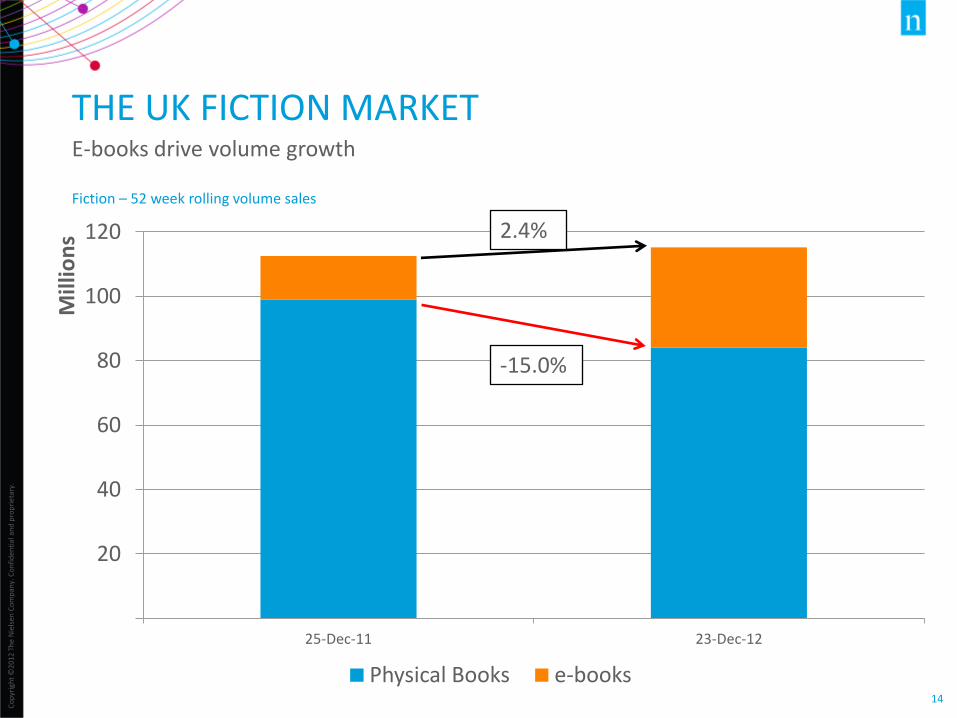
14
Fiction – 52 week rolling volume sales
THE UK FICTION MARKET E-books drive volume growth
20
40
60
80
100
120
25-Dec-11 23-Dec-12
Mill
ion
s
Physical Books e-books
-15.0%
2.4%
Co
pyr
igh
t ©
2012
Th
e N
iels
en C
om
pan
y. C
on
fid
enti
al a
nd
pro
pri
etar
y.
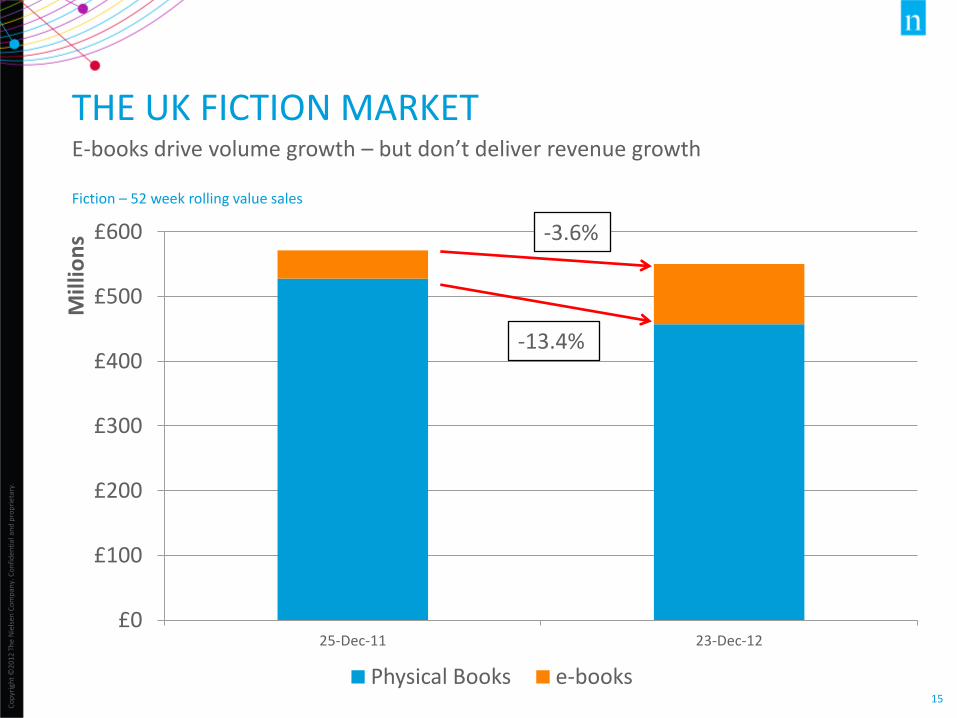
15
£0
£100
£200
£300
£400
£500
£600
25-Dec-11 23-Dec-12
Mill
ion
s
Physical Books e-books
-13.4%
-3.6%
THE UK FICTION MARKET E-books drive volume growth – but don’t deliver revenue growth
Fiction – 52 week rolling value sales
Co
pyr
igh
t ©
2012
Th
e N
iels
en C
om
pan
y. C
on
fid
enti
al a
nd
pro
pri
etar
y.
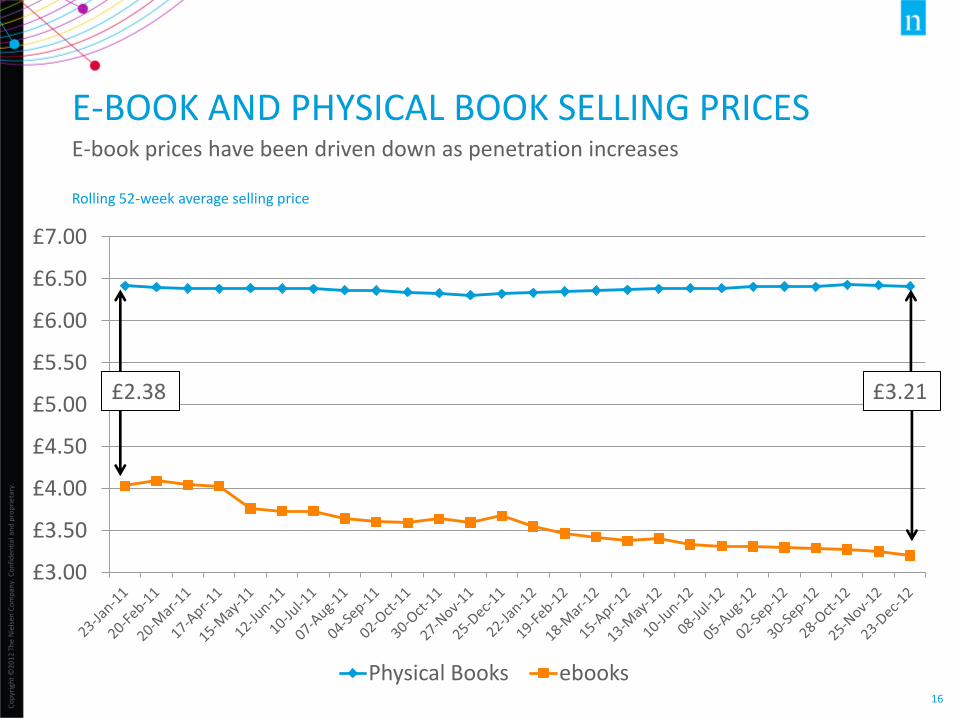
16
Rolling 52-week average selling price
£3.00
£3.50
£4.00
£4.50
£5.00
£5.50
£6.00
£6.50
£7.00
Physical Books ebooks
E-BOOK AND PHYSICAL BOOK SELLING PRICES E-book prices have been driven down as penetration increases
£2.38 £3.21
Co
pyr
igh
t ©
2012
Th
e N
iels
en C
om
pan
y. C
on
fid
enti
al a
nd
pro
pri
etar
y.
17
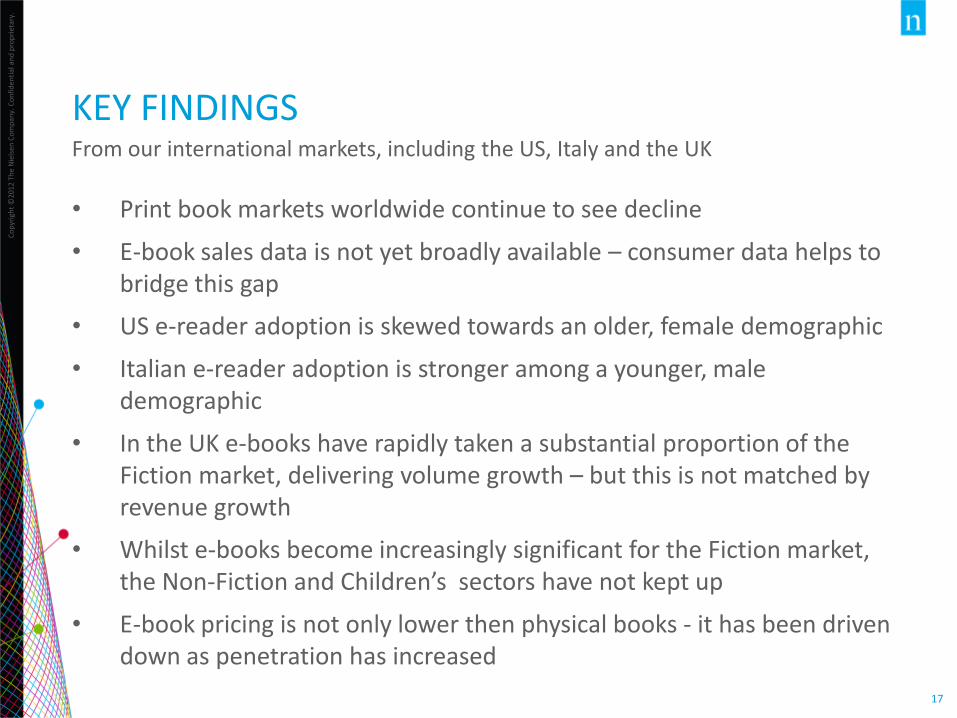
KEY FINDINGS From our international markets, including the US, Italy and the UK
• Print book markets worldwide continue to see decline
• E-book sales data is not yet broadly available – consumer data helps to bridge this gap
• US e-reader adoption is skewed towards an older, female demographic
• Italian e-reader adoption is stronger among a younger, male demographic
• In the UK e-books have rapidly taken a substantial proportion of the Fiction market, delivering volume growth – but this is not matched by revenue growth
• Whilst e-books become increasingly significant for the Fiction market, the Non-Fiction and Children’s sectors have not kept up
• E-book pricing is not only lower then physical books - it has been driven down as penetration has increased
Co
pyr
igh
t ©
2012
Th
e N
iels
en C
om
pan
y. C
on
fid
enti
al a
nd
pro
pri
etar
y.
18
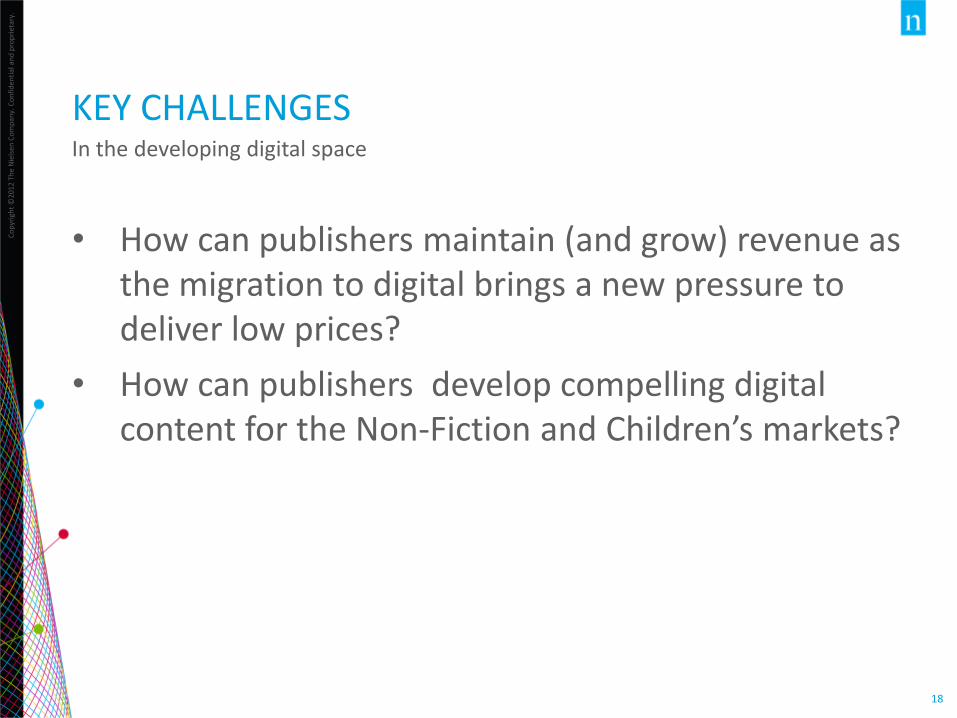
KEY CHALLENGES In the developing digital space
• How can publishers maintain (and grow) revenue as the migration to digital brings a new pressure to deliver low prices?
• How can publishers develop compelling digital content for the Non-Fiction and Children’s markets?