nickel cadmium battery operations on-orbit: success on the … · 2013-08-30 · n94-28120 nickel...
TRANSCRIPT

N94- 28120
Nickel Cadmium Battery Operations On-Orbit:Trials, Tribulations and Success on
the Upper Atmosphere Research Satellite
Gopalakrishna M. Rao and Scott D. Miller*
NASAJGoddard Space Flight Center
Greenbelt, Maryland 20771
Abstract
The Upper Atmosphere Research Satellite (UARS), designed, built, integrated,tested and operated by NASA and Martin Marietta is a low-Earth orbiting, Earth-observing spacecraft which was launched via Space Shuttle Discovery on September12, 1991 and deployed three days later. The Modular Power Subsystem (MPS) on-board the satellite is equipped with three NASA Standard 50 Ampere-hour (Ah) nickel-cadmium (NiCd) batteries. McDonnell Douglas Electronics Systems Companyfabricated the MPS, and batteries from Gates Aerospace Batteries cells.
Nominal battery performance was achieved for the first four months of spacecraftoperation. First evidence of anomalous battery performance was observed in January1992, after the first maximum beta angle (low Depth of Discharge) period. Since then,
the Flight Operations Team (FOT), under the direction of Goddard Space FlightCenter's UARS Project and Space Power Application Branch, has monitored andmanaged battery performance by adjusting solar array offset angle, conductingperiodic deep discharge, and controlling battery recharge ratio. This paper covers abrief overview of the UARS, its MPS, the FOT's operational battery management, and
the observed spacecraft battery performance.
'lk
Martin Marietta Services Inc. - Goddard Operations, Lanham MD
1993 NASA Aerospace Battery Workshop -459- Nickel-Cadmium Teclmologies Session
https://ntrs.nasa.gov/search.jsp?R=19940023617 2020-04-15T12:31:01+00:00Z

Introduction
Spacecraft Systems Overview
The Upper Atmosphere Research Satellite (UARS) is NASA's first spacecraft (SIC)in its Mission to Planet Earth. The study of environmental change affecting the entire
Earth as a self-contained system via space observations is the mission's goal. Nine
instruments (plus one sensor of opportunity) simultaneously and comprehensively
study global stratospheric energy input, winds, and chemical composition, in additionto those changes associated with human activities which lead to ozone depletion.
The UARS design is a three axis stabilized spacecraft which combines a
Multimission Spacecraft (MMS) bus designed and manufactured by Fairchild Space
Company with an Instrument Module (IM) designed, fabricated, integrated and tested
by Martin Marietta (formerly General Electric) AstroSpace, East Windsor, New Jersey.This work was completed for NASA/Goddard Space Flight Center's (GSFC's) Earth
Science Mission Operations (ESMO) Project.
UARS achieved orbit through Space Shuttle Discovery launch on September 12,
1991 and was deployed three days later, September 15. Mission Operations have
since been carried out by Martin Marietta for NASA's ESMO Project. The mission orbit
is a 96 minute, circular orbit inclined 57 degrees to the Equator with a 585 Km height.
This allows stratospheric sensors to observe up to 80 degrees in latitude (North and
South) and provides near total global coverage. The full range of local times at all
geographic locations is viewed every 36 days.
The UARS was designed for a nominal mission life of 18 months covering 2
Northern Hemisphere winters - the design life of the CLAES cryogenic instrument,with a minimum of an additional 18 months planned and a goal of 5 years. The SIC
power system was designed for a maximum 1600 Watts (orbital average), 786 Wattsof which was reserved for the instrument load. The SIC maximum load has beenabout 1350 Watts with instrument loads of approximately 450 Watts. SIC weight upon
mission orbit insertion was 6800 kg. The FOT utilizes NASA's Space Network and the
Tracking and Data Relay Satellite System (TDRSS) to provide routine command
uplinks and science and telemetry data downlinks.
The IM is a truss-type torque-box constructed of graphite-epoxy tubes with titanium
end fittings and supports all ten instruments. The plus Y side of the S/C, where the
limb-looking andCryogenic instruments reside, must be kept in shadow at all times.
To satisfy both the shadowing and full globe coverage requirements, a "Yaw-Around"
maneuver is performed every 36 to 42 days. This entails turning the SIC around 180
degrees and allows, alternately, Northern (backwards flight) and Southern (forward
flight) Hemisphere Limb viewing.
1993 NASA Aerospace Battery Workshop -460- Nickel-Cadmium Technologies Session

The MMS bus includes the Modular Attitude Control Subsystem (MACS), the
Propulsion Module (PM), the Command and Data Handling Subsystem (C&DH) which
incorporates the On-Board Computer (OBC), the Earth Sensor Assembly Module, the
Signal Conditioning and Control Unit, and the Modular Power Subsystem (MPS) whichhouses the three NASA Standard 50 Ah NiCd batteries and power control/distribution
circuitry.
The UARS Power Subsystem comprises all power control, power distribution and,
all other related hardware. It contains the McDonnell Douglas Electronics Systems
Company (MDESC) supplied MPS, main and auxilliary Solar Arrays and related
equipment. Figure 1 relates how these components are connected and interact.
I I
I Aux
Solar
Array
Main
Solar
Array
Aux Array Switch I
II
IPCU
|
MPS
Payloadsand
Mission
Unique
Equipment
• On/OffCharge
Relay
_D"-_ Power
Disconnect
Relay
Figure 1. UARS Power Subsystem Block Diagram
1993 NASA Aerospace Battery Workshop -461- Nickel-Cadmium Technologies Session

Table 1 lists the major Power Subsystem components and their functions.
TABLE 1. UARS Power Subsystem Components and Their Functions
Power Subsystem Component
Standard Power Regulation
Unit (SPRU)
Function|
Battery charge control.
Signal Conditioning Assembly Command and telemetry conditioning.
(SCA)Fusing of internal MPS loads.Bus Protection Assembly (BPA)
50 Ah Batteries
Power Control Unit (PCU)
Remote Interface Units (RIUs)
Main Array
Aux Array
Auxiliary Array Switch
Solar Array Drive and
Deployment Electronics
(SADDE)
Solar Array Drive (SAD)
Energy storage.Power distribution and system configuration.
C&DH Interfaces.
Energy conversion - provides 1200 Watts power for
instrument loads and battery charging.
Energy conversion - provides additional 400 Watts
power for instrument loads only.
Controls Aux Array power as a function of Instrument
load current.Provides drive and rate control to rotate SA at 1
revolution per orbit, tracking the Sun.
Maintains SA Sun-pointing while the SIC is in an
Earth-viewing orientation. Can rotate the SA ineither direction for both forward and backward SIC
flight.
Mission & Power Subsystem Operations
Total SiC operations are provided by Martin Marietta under the direction of the
ESMO/UARS Project staff. The power and battery operations are managed in concert
with the Space Power Applications Branch.
The Power Subsystem was designed to provide 1600 Watts orbital average by
using the MPS in conjunction with an auxilliary Solar Array and auxilliary array switch,since the MPS capability is limited to 1200 Watts. Power is distributed to the MMS and
IM modules at 28 +/-7 Volts D.C. The MPS was constructed by MDESC according to
the NASAJGSFC Specification for Multimission Modular Spacecraft (MMS) Modular
Power Subsystem(1). According to the UARS General Instrument Interface
Specification(2), the MPS output voltage range should be between 22 and 35 V.
1993 NASA Aerospace Battery Workshop -462- Nickel-Cadmium Technologies Session

The MPS receives commands from the OBC for enabling the battery control mode
in the SPRU and for setting the operating limits for battery voltage and battery current.
The various MPS operation modes are summarized in Table 2.
Table 2. MPS Charge Modes and Their Operations
MPS Battery, Charge Mode
Standby
Peak Power Tracking (PPT)
Battery Voltage Limited
(V/T)
Constant Current Limited
(CCM)
Safehold
Operationi i |
When no SA power is available and the
batteries are supplying the SIC power, theSPRU retains its last commanded state in
memory and can receive additionalcommands.
The SPRU will always operate at the SA
maximum power output point in order t6
transfer all available power to the load and tocharge the batteries until the voltage-
temperature set point (V/T mode) is reached,
or until the battery current reaches the currentset point if Constant Current Mode (CCM) isenabled.
The SPRU will operate on the voltage side ofthe SA I-V curve in order to control the battery
voltage to one of the eight selected voltage-
temperature set points, and will allow thebattery to charge at a current determined by the
battery characteristics.'¢_en enabled, the SPRU will operate on
voltage side of the SA I-V curve in order to
control the battery current to one of three
selected levels (0.75, 1.5, 3.0 A), and will allowthe batteries to charge at a voltage determined
by the battery characteristics up to the selectedV/T limit.
When an OBC fault is detected, the SPRU will
receive a command to disable CCM (if
enabled) and to set the V/T set point to a
preselected V/T level. This remains in effect
until reset by an external command.
1993 NASA Aerospace Battery Workshop -463- Nickel-Cadmium Technologies Session

MPS telemetry data is reported by the C&DH module and is plotted by the UARS
Generalized Plotting Software/Level Zero (UGPL) off-line. Table 3 lists the MPS
Telemetry Points that the UARS FOT uses for trend analysis.
Table 3. MPS Telemetry Points
Battery Terminal Voltage (Volts)
Load Bus Voltage
(Volts: EOD,EON,Instantaneous)
Battery Current(Amperes: High & Low Sensors)
Total SIC Current (Amperes)
IM Current (Amperes)
Half-Battery Differential Voltage (mV).,
Battery Temperatures (C)
MPS Temperatures (C)
Total Discharge (Amp-min)
Net Charge (Amp-min)C/D Ratios
State Of Charge (%)
Depth Of Discharge (%)Main SA Power (Watts)
Aux SA Power (Watts)
Solar Array Temperatures (C)
Solar Array Output Power (Watts)
Batteries
The three NASA Standard 50 Ah NiCd Batteries on-board UARS, which were
fabricated by MDESC using GAB cells (50AB35, LOT 2), are on a parallel bus and
charged to NASA Standard V/T curves using the MPS and NASA Standard Power
Regulator Unit (SPRU). The battery cells were constructed according to theNASNGSFC Specification for the Manufacture of Aerospace Nickel-Cadmium Storage
Cells(3 & 4), while the Batteries were manufactured according to NASAJGSFC
Specification for the Standard Nickel-Cadmium Spacecraft Batteries (5)-
The batteries were specified to a name plate capacity of 50 Ah and to operate in
low-Earth orbit up to 20% Depth of Discharge (DOD), and 28+/-7 Volts for a nominal
36-month mission (3 & 4). Thermal vacuum testing revealed that with a full-up UARS
at 24% DOD, the lowest EON Voltage at the beginning of the mission should have
been close to 27.0 V(2). Thermal vacuum testing also revealed nominal performance
within specifications on ground tests prior to launch.
1993 NASA Aerospace Battery Workshop -464- Nickel-Cadmium Technologies Session

Beta Angle
Beta angle is defined as the angle between the orbital plane and the Earth-to-Sun
line. Variation of this parameter affects the Solar Array (SA) energy conversion, theSIC loading, and the Battery Charge and Discharge profiles. The cyclical variation of
the orbit Beta angle (_) is caused by the 57 degree orbital inclination and orbital
geometry. Figure 2 shows the cyclical Beta angle and Night Length variations sincelaunch. The Beta angle variation changes SA Night periods (in addition to the normal
seasonal changes) from a maximum eclipse of 36 minutes at zero degree Beta, to a
minimum of zero minutes at Beta angles above 66 degrees. Figure 3 is a plot of theTotal SIC Current over the mission to date
Beta Night Length
_ 70
_50 i
2 20 j; iI- lo = ii ij":
' T '
01 06 10 15 19 23 29 03 07 ;2, 16 20 25 29 03 07 ;4 18 _ 27 01 05 10 14Sep Oct _ Dec Jan Feb Mar MacJun JJI A_,; Se_Oct Nov Jan Fee Mar Apt k_ J-n Aug Sep Oct I'_91 91 91 gl g2 92 92 92 92 92 92 92 92 92 93 93 93 93 93 .=3 93 93 g3 93
Date
Figure 2. Beta Angle & Night Length vs. Date
1993 NASA Aerospace Battery Workshop -465- Nickel-Cadmiurn Technologies Session '

40.0Q)I,=.
a) 38.0C3.
E 36.O<
34.0
" 32.0e,-
'.- 30.0&=,
o 28.0
O 26.O
_o 24.0
22.0
< 20.0
>- 18.0om
16.0
14.0
- jLI iiiL iii;l!l 01Ln, n !I -Ilnll, lllllll il II,,ill,|ll,
llflltl Iltlilll tit,tin,illll,l,lt t LIi !!!!1 IIli |ill 111Iii111/Iiti!1I!!|
li Ii_ll II' 'Ill I'l illd'IlllkJ'i__
t-tl ill !
_ >o __°_-_ 0
Date
Figure 3. Total S/C Load
Battery/M PS Management
This section highlights UARS MPS and battery management from deployment to
26 October 1993. Table format is used to aid both clarity and brevity. The headinglists the covered periods and orbit beta angles, the battery performance and
characteristic parameters are presented in each Table.
The FOT, Project Office and Space Power Applications Branch have managed the
MPS and Batteries by monitoring the Half Battery Differential Voltage (Differential
Voltage), End Of Night (EON) Voltage, and Battery Charge and Discharge currentsharing, and by controlling battery overcharge, recharge ratio, battery temperature, thedifference between battery temperature (delta temperature), and DOD. This strategy
has continuously been updated and changed to fit the battery performance and
characteristics that were of greatest concern at that particular time. The end result is
a plan that started with a basic premise that operations would be normal and not
intensive.
1993 NASA Aerospace Battery Workshop -466- Nickel-Cadmium Technologies Session
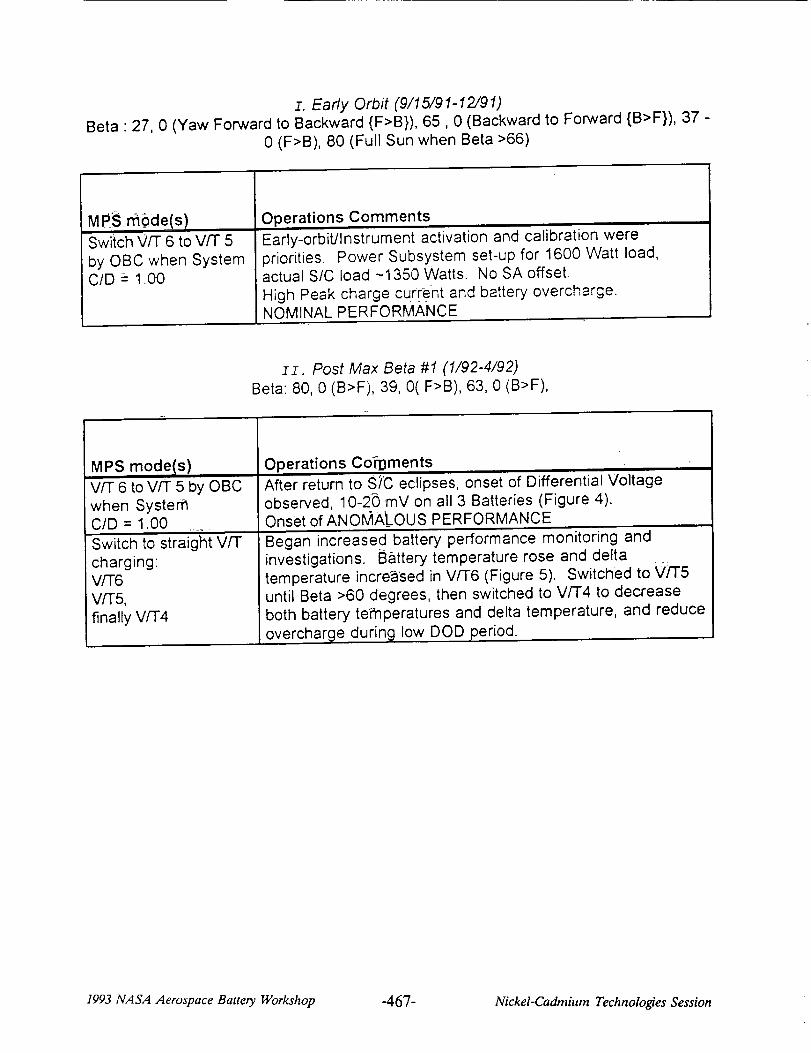
z. Early Orbit (9/15/91-12/91)
Beta • 27, 0 (Yaw Forward to Backward {F>B}), 65,0 (Backward to Forward {B>F}), 37 -
0 (F>B), 80 (Full Sun when Beta >66)
MPS 'n_ode(s)
Swiich V/T 6 to V/T 5
by OBC when SystemC/D -- 1.00
Operations Comments
Early-orbit/Instrument activation and calibration were
priorities. Power Subsystem set-up for 1600 Watt load,actual SIC load ~1350 Watts. No SA offset.
High Peak charge cur(ent and battery overcharge.NOMINAL PERFORMANCE
zz. Post Max Beta #1 (1/92-4/92)
Beta: 80, 0 (B>F), 39, O(F>B), 63, 0 (B>F),
MPS mode(s)
VFF 6 to V/T 5 by OBC
when SystemC/D = 1.00
Switch to straight V/T
chargingVFr6
V/T5,
finally VFF4
Operations CommentsAfter return to S;(C eclipses, onset of Differential Voitage
observed, 10-20 mV on all 3 Batteries (Figure 4).Onset of ANOMA_LOUS PERFORMANCE
Began increased battery performance monitoring andinvestigations. [3attery temperature rose and deltatemperature increased in V/T6 (Figure 5). Switched to V/T5
until Beta >60 degrees, then switched to V/-I-4 to decrease
both battery tef'nperatures and delta temperature, and reduce
overcharge during low DOD period.
1993 NASA Aerospace Battery Workshop -467- Nickel-Cadmium Technologies Session

............ B3
Date
Figure 4. Half Battery Differential Voltage. 15 December 91 - 15 April 92
o 5 _ 'B1 -
4.56)'- 46)
a 3.5
36)
-.-- 2.5k..
• 2E6) 1.5
I--
>. 1I,.,.
6)-'05
m 0
Z3 r_0
,,#
_z ................ B3
v
k./ \ /\../
Date
1993 NASA Aerospace Battery Workshop -468- Nickel-Cadmium Techuologies Session

Figure 5. Battery Temperatures :15 December 91 - 15 April 92
III. Through next relative max Beta, low DOD (4/92-5/92)Beta:,-65, 0 (F>B), 37,
_PS mode(s) ___.
V/T5,and then back to VfT4
V/T4
Operations Commentsf/T4 at higher Beta angl--_'s, switched to VFI5 after increasing
the load, but battery temperature rose and de!ta temperature
diverged dramatically, switched back to V/T4 and batterytemperature and delta temperature decreased, however still
operating with higher delta temperature. Began TMONcontrol of MPS heater thermostat with little to no effect on
delta temperature.After next relative max Beta (37 deg), began SA Offset -35
deg ahead, controlled manually. Reduced peak charge
current per battery from 33 A to -20-25 A. Still no effect ondifferential volta_temperature or delta temperature.
Iv. SA Drive Anomaly (6/92-7/92)
Beta:, 0 (B>F), 80, 0 (F>B),
MPS mode(s)V/T4
"_/T4
Operations Comments..... Min-'_'mum SIC Load (2 of 10SA "parked" at SIC Noon.instruments on) - max DOD 18-20%. SIC nights vary from
54 min to 10 min over Beta cycle with the SA stoed._.p_..e__
Reduced charge capability during full sun reduces
overcharge during Max Beta. Higher effective load anddecreased charge rates. Observed first beneficial battery
operations and improved performance during this period.Differential Voltages, delta temperatures and C/Ds decrease.
1993 NASA Aerospace Battery Workshop -469- Nickel-Cadmium Technologies Session
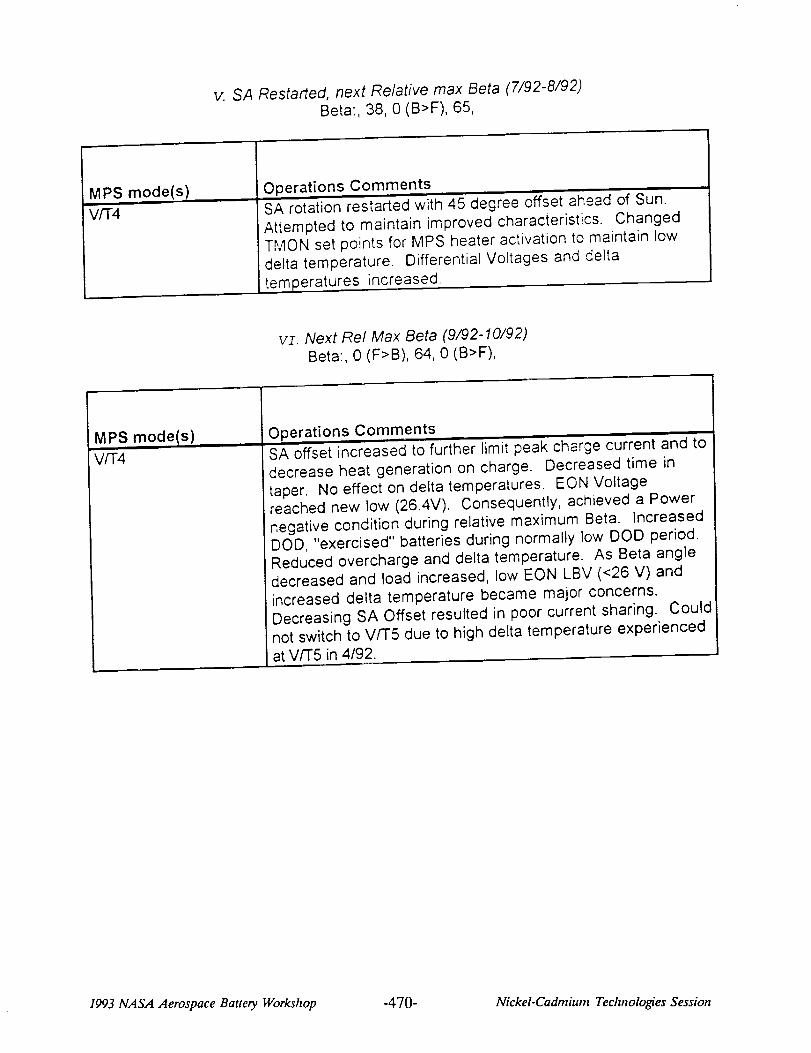
v. SA Restarted, next Relative max Beta (7/92-8/92)Beta:, 38, 0 (B>F), 65,
MPS mode(s)
V/T4
Operations CommentsSA rotation restarted with 45 degree offset ahead of Sun.
Attempted to maintain improved characteristics. ChangedTMON set points for MPS heater activation to maintain low
delta temperature. Differential Voltages and delta
temperatures increased.
vz. Next Rel Max Beta (9/92-10/92)
Beta:, 0 (F>B), 64, 0 (B>F),
MPS mode(s)
V/T4
Operations Comments ,,SA offset increased to further limit peak charge current and to
decrease heat generation on charge. Decreased time in
taper. No effect on delta temperatures. EON Voltagereached new low (26.4V). Consequently, achieved a Power
negative condition during relative maximum Beta. IncreasedDOD, "exercised" batteries during normally low DOD period.Reduced overcharge and delta temperature. As Beta angle
decreased and load increased, low EON LBV (<26 V) and
increased delta temperature became major concerns.
Decreasing SA Offset resulted in poor current sharing. Couldnot switch to V/T5 due to high delta temperature experienced
at V/T5 in 4/92.
1993 NASA Aerospace Battery Workshop -470- Nickel-Cadmium Technologies Session

VII. EON LBV continues to decrease (11/92)
Beta:, 39, 0 (F>B),
MPS mode(s)
VFF4
VFF4
Operations Comments
Differential Voltage curves change character, considered a
change but not certain if this indicates improvement or further
degradation. By Inhibiting the warmest/weakest battery (#1)from controlling the VFI- feedback loop, EON voltage was
raised. Battery 3 (next warmest battery) controls/delays V/T
switch to taper (effective VFF=4.2+), increased charge without
increasing peak charge current. Consequently, battery
temperatures rose.At maximum SIC loading, could not provide required EON
Voltages. Used other than normal MPS configuration tomaitain EON LBV above 26.8V when DOD>18%. Load
sharing improved slightly with inhibited Battery 1 V/T
feedback loop (Figure 6).
6)
. -9
. -11
e= -13L.Im
-15
-17
-19
_, -21
Q)
-23m
tB1 .......... B2 ............. B3 }
i
- oF, -,d4 /
Date
Figure 6. Battery Load Sharing: September - December 92
1993 NASA Aerospace Battery Workshop -471- Nickel-Cadmium Technologies Session

VIII. Max Beta #3, Deep DOD Conditioning #1 (12/92)Beta:, 80,
MPS mode(s)
then V/'T3 when
DOD<IO%
M 0.75A
V/T3
VFF3
VFF4
:ions Comments
1 differential voltage range surpassed battery 3's.
Decreased battery overcharge and increased DOD during
low load period.Performed first low earth orbit battery cond;t;oning to boost
EON Voltage - Deep DOD (target 35%) conditioning without
reconditioning circuitry. Used Full-Sun period 12/12-12/25when recharge opportunities are the greatest. Increased SIC
load to maximum (slow discharge rates ~5-9 Amps ),increased SA Offset to achieve a negative energy balance,
and took the best performer (battery 2) off the charge bus to
force it to discharge through the diode which allowed
batteries 1 & 3 to get deeper DODs. Also used Constant
Current Mode of 0.75 A to limit charge during Albedo Charge
iods.When battery 2 reached 32% DOD; began Peak Power
Tracking and decreased SA offset to allow system to be
power positive. Put battery 2 back on charge bus when allthree battery voltages were approximately the same.Maximum DODs were: Battery 3=34.0%, Battery 1=31.5%,
and Battery 2=32%. Voltages increased approximately 1.5
volts per battery (see Figure 7), however, battery dischargeremained unchan ed_re 8).
Exercised the batteries when normal DOD<10%. Increased
SA Offset to make subsystem power negative and achieve a
DOD between 12-18% at least once other da
When DOD>10%, resumed normal operations. Loaded NewPMON Software to autonomously control SA Offset. Three SA
Control modes: (1). Select Offset Angle and PMON maintains
it, (2). Select Desired Total Peak Charge Current and PMONcalculates and commands required SA Offset once per orbit,
and (3). Retain Manual Control by rate variation (same as
before).
1993 NASA Aerospace Battery Workshop -472- Nickel-Cadmium Technologies Session

A
G)
O
I==
mD3
28
24
20
16
12
8
4
0
B1 Pre B1 Post B2 Pre B2 Post 133 Pre B3 Post
Figure 7. Battery Voltages Pre and Post Conditioning (December 92)
¢)Im
-5
-7
-9
-11-13
u_ -15
-17
-19_.=_= -21
B1 B2 B3Pre Post Pre Post Pre Post
::::::::::::::::::::::::::::::::::::::::::
:_::,$'_K<,$'.4#_$ :._ .,.$:__._.>.::
>>_>;'2>:+_:'_" *:2, _//.¢,
Figure 8. Battery Discharge Currents Pre and Post Conditioning (December 92)
1993 NASA Aerospace Battery Workshop -473- Nickel-Cadmium Technologies Session

_x. Post Max Beta #3, and next Zero Beta (1/93-2/93)Beta:, 0 (B>F), 38, 0 (F>B),
vM4_,_,._,_psmode(s)
VFT4.2+
V/T4 &VFT4.2+
Operations CommentsBattery delta temperatures and current sharing diverged.
Inhibited battery 1 from VF[ feedback to increase chargewithout increasing peak charge currents and boost E'ON
Voltages. Used V/T4 when delta temperatures increase.&lso decreased MPS heaters on period with TMONs. Battery
temperatures and delta temperature remained unchanged.At Zero Beta (Maximum load) turned off redundant SIC
equipment (1 Transponder and 1 Star Tracker) and damagedinstruments to reduce load and maintain EON LBV above
24.8V- Further evidence of weak batteryperformance.
MPS mode(s),,
V/T4 &
V/T4.2+
V/T3
x. Next 2 Relative max Betas (3/93-4/93)Beta:, 64, 0 (B>F), 64, 0 (F>B),
Operations Comments -,----"-"----Battery temperatures and cha_e/discharge current sharingcontinued to diverge. MPS battery heaters on at SIC sunrise
by stored commands to better control peak charge heating,and also decreased peak charge current and decreased
overcharge, but no real effect on temperatures and current
sharing. ---'--At relative maximum Beta angles, when DOD<10%, cycled
SA Offset to achieve 12-18% DOD at least once every other
day and exercised batteries. Tested New PMON softwareallowing a switch from VfT control to CCM based on aselected battery 1 CID goal. Ac.____hievedqreater control of
Also utilized SA Offset control to select
_ current.
1993 NASA Aerospace Battery Workshop -474- Nickel-Cadmium Technologies Session

xz. Relative Max Beta (5/93)
Beta:, 39, 0 (B>F),
MPS mode(s)
VFr4
V/T4 to CCM (0.75 A)at selected Battery 1
C/D goal.
Operations CommentsLoad decreased due to ISAMS decreased operation, 7 of 10
instruments fully operational. Still observing significant delta
temperatures and poor charge/discharge current sharing.Results of decreased overcharge lead to implementation of
Vfl- control to CCM switching upon reaching Battery 1 C/D
goal as the operational mode. Ccntinued i_0rovement in
charge acceptance, load sharing (Fiaure 9}, and battery delta
temperatures (Fiqur.e. 10).
-13
t,.,,
= -15
We -17e3 I"r-"
.2 E -19
$ 21
_3m
-23
i
B1 B2 Bsj
},
,t
Dale
Figure 9. Battery Load Sharing from March - May 93
1993 NASA Aerospace Battery Workshop -475- Nickel-Cadmium Technologies Session

Date
Figure 10.March - May 93
Battery Temperatures from
1993 NASA Aerospace Battery Workshop -476- Nickel-Cadmium Technologies Session

xzz. Max Beta #4, Deep, Discharge Conditioning #2 (6/93)
Beta:, 80 (Full Sun, Min DOD, 6115-6/18),
MPS mode(s)V/-F3
VFF3 & CCM 0.75A
&VFF1 & CCM 1.5A
&VfT3
V/T3 &
VFF4
Operations CommentsWhen DOD<10%, exercised batteries, by cycling SA Offset to
achieve 12-18% DOD at least once per day. Decreased
overcharge and increased load during low DOD/Ioad period.
Deep DOD Conditioning #2:_erformed 2 conditioning discharges - one each on
consecutive Full-sun days, to achieve the full benefit of the
deep discharges based on the ground test results of
Zimmerman and Effa( 6)-DAY ONE - Deep Discharge (40% target, discharge rates -5-
9 amps) and Slow Recharge (Increased SA Offset), Battery 2off the charge bus, and extra heater loads to decreaseAIbedo charging. When Battery 3=36% DOD (B1=33%,
B2=31.5%), decreased SA Offset, Commanded V/T1 at CCM1.5 A until all 3 battery voltages were same, then put Battery 2
back on the charge bus and switched to straight V/T3
recharge back to 100% SOC.DAY TWO - Repeated Day One with all three batteries on
charge bus. When Battery 2=40% DOD (B3=38.5%,B1=34.5%) decreased SA Offset, commanded straight V/T3
recharge to 100%. No net EON Voltage gain (Figure 11),however, battery discharge sharing improved (see Figure 12
below).Continued to limit overcharge and to exercise batteries until
DOD>10% by cycling SA Offset to achieve 12-18% DOD at
least once every other day. Switched to V/T4 when
DOD>10%, SA Cycling ceased
1993 NASA Aerospace Battery Workshop Nickel-Cadmium Technologies Session

28
26
._.24
""220> 2O
18
16
14
12
10
8
6
4
2
0
m
0
lu
¢B
B1 Pre B1 Post B2 #re B2 Post B3 Pre B3 Post
Figure 11. Battery Voltages Pre and Post June 93 Conditioning
BI B2 B3"_" Pre Post P re Post Pre Post
o
&
-4
-6-8
_ -12
_-16 __[--
"_ -18
Figure 12. Battery Discharge Current Pre and Post Conditioning June 93
1993 NASA Aerospace Battery Workshop -478- Nickel-Cadmium Technologies Session

xzzz. Post Max Beta #4, Next 2 relative Max Betas (7/93-8/93)
Beta: 0 (F>B), 37, 0 (B>F), 66
MPS mode(s)
V/T4 and CCM (0.75A)
VFT4 and CCM (0.75A)
VFF4 and CCM (0.75A)
Operations Comments
Battery charge and discharge current sharing continued to
improve. Battery delta temperatures decreased. Battery
performance improved. Continued to utilize switching fromVFT4 to CCM based on selected C/D of battery 1 (maintained
Battery 1 C/D between 1.04 and 1.05).
SA Anomaly - SA parked at SIC Noon from 4 to 8 August ledto minimum Instrument Load (2 of 10 on) and a change in
battery charge regime due to fixed SA.
SA restarted with Offset after Yaw around, utilized SA Offset to
control peak charge currents. No change in battery
performance.
xz'v'. Next Relative Max Beta: September 93 SA Anomaly to Present (9�93-Present)Beta: 0 (F>B), 62, 0 (B>F)
MPS mode(s)
VFI4 and CCM (0.75A)
VFF4 and CCM
(0.75A),Straight V/T4,VFI'5 &
VFF5 and CCM (0.75A)
V/T5 and CCM (0.75A)
Operations Comments
SA Anomaly - SA parked at S/C noon 9/17-9/21, leads tominimum Instrument Load (4 of 10 on). SA-control TMONS
developed and loaded to SIC. SA restarted with SA Offset
9/21. Little change to battery performance.
SA stopped to, investigate "jumping ahead" SA motion 10/2-10/25. However, _,.qw kept 5 of 10 instruments on with
parked SA due to impro,'_d battery performance and SIC loadmanagement. Switched to VFT5 as load increased and Betadecreased without battery thermal runaway. Differential
Voltage pegged (>+728mV) during SA testing (>65 min SA
night, EON LBV=24.2V @ 28% DOD).SA restarted with Offset after Yaw around. Battery
performance continues to improve.
1993 NASA Aerospace Battery Workshop -479- Nickel-Cadmhtm Technologies Session :

Figure 13 shows the EON LBV from December 1992 (the first deep dischargeattempt) though October 26, 1993. It is annotated with significant events effecting theEON LBV and all YAW maneuvers. Yaw maneuvers usually represent the highest
DOD for any particular Beta cycle. Figure 14 is a plot of the Minimum EON Voltage for
the mission to date. CID ratios, and Half Battery Differential Voltages over the mission
are represented in Figures 15, and 16 respectively. Battery load sharing and Battery
Temperatures since launch are presented in Figures 17 and 18.
31_IRECOND #1
30
RECOND #2Low DOO'High
Voltage due to
Low DOD/High B > 60 aeg 1Voltage due to
B > 60 d_l_ _ SA
"Pa, rlted"I I
f !
_Yaw
F_B SA T_ Yaw
night, 24.2V @ BIF
Figure 13. Daily Minimum EON LBV, 1 Dec 92 - 26 Oct 93
1993 NASA Aerospace Battery Workshop -480- Nickel-Cadmium Technologies Session

31 LI III II
29 Ilil-_ LJ L _ _ II ill1II h_28 ! .j L
24 II.L,I
Date
Figure f 4. EON Load Bus Voltage
1.3
'_ 1.25
1.2lid
1.12
_, 1.1o
$ 1.05
," 1O
0.95
B3
I
7
Date
Figure f 5. Battery C/D Ratio
1993 NASA Aerospace Battery Workshop -48 l- Nickel-Cadmium Technologies Session

w
" 390.- 340•" 290
240... 190
_:_ 140= .-. 90(_ 40rr_ -10
_ _ -60-r" "6 -110
> -160_) -210•_ -26O
-310-36o-410
Date
Figure 16. Average Half Battery Differential Voltage
1993 NASA Aerospace Battery Workshop -482- Nickel-Cadmium Technologies Session

t-G)
I.,=
r.
a3
9
-11
"_" -13
" -15
E -17
.-. -19
-21
-23
i
I
I
B1_B2 -----'---"--- B3
I_ .T,_.
J
¢',,I0_I O,I
' '_ ' : i "-'i
ii LIt '!I, Ii
_ '-L__-
II
' <i'll 1I
q_l ('kl o_ q'4 £M £_J O.J _'*'3 ('_ #_, _ _'_ o_ _"_ _ c_ {'_ I_) _'_')
-- _ ¢ o o
Date
Figure 17. Daily Average Battery Load Sharing
1993 NASA Aerospace Battery Workshop -483- Nickel-Cadmium Technologies Session

_ -B1 B2 B3[
&
DATE
Figure 18. Daily Average Battery Temperatures
Thus, better current sharing; lower recharge ratio, differential voltage, and delta
temperature; and fairly stable EON voltage indicate improved battery performance over
the past several months. These trends began when overcharge was limited byswitchinq from VT control mode to M based on the selected battery ! C/D ratio.
1993 NASA Aerospace Battery Workshop -484- Nickel-Cadmium Technologies Session
Conclusions
Anomalous battery performance was first observed in January 1992. During this
early mission period, the onset of Half Battery Differential Voltage excursions wereconsidered a problem. However, Half Battery Differential Voltage changes do not tell
us whether those changes are an effect of just one or of many cells. As a result, Half
Battery Differential Voltages are used as a "first warning" or an indicator of battery
degradation. Other battery characteristics and performance parameters must bemonitored for additional information. These parameters are used to manage battery
performance.
Because the batteries are in parallel in the MPS design (Figure 1), the effective
operation of the MPS relies heavily upon having batteries that are well matched. TheUARS batteries, although well matched at mission start, have operated with delta
temperatures since launch. Temperature differences between batteries along with
the battery temperatures have served as good indicators of relative battery
performance.
Battery charge and discharge current sharing have both shed light on the battery
performance puzzl& Charge and Discharge current sharing go hand-in-hand withbattery temperatures in pointing to both the most efficient and the weakest performingbatteries. For example, Battery #1 has had the greatest Half Battery Differential
Voltage range and the highest temperature. It has also accepted the most chargecurrent while providing the least discharge current, and is hence considered the
weakest performer.
In addition, the weakest performer has been the battery receiving the greatest
overcharge. Battery and MPS operations during the early part of the mission --
charging at V/T 6 to a system C/D=1.00 and then switching to V/T 5 with taper,
probably contributed to battery overcharge.
Aggressive management of overcharge has been the underlying operation leading
to improvements and relative stabilization of battery behavior. Battery temperatures,delta temperatures, and current sharing during charge and discharge have all trended
back to more nominal behavior.
Battery exercise certainly helps to limit overcharge during low load (high beta
angle/minimum SIC night) periods. Cycling the SA Offset to achieve a power negativecondition and allowing the batteries to "spiral down" in SOC for several orbits,
exercises the batteries during those low load periods when DODs of only 6-10% are
expected. The result is a DOD of 12-18% at least once per day over a week when lowloads are the norm. In addition, this battery exercise may minimize the so called
"memory effects" which are common for NiCd batteries (6).
1993 NASA Aerospace Battery Workshop -485- Nickel-Cadmium Technologies Session

Deep Discharges have been performed during the bi-annual Full-Sun periods to
minimize overcharge and to attempt to improve battery performance. UARS utilizes
these very low load (-1-6% DOD) intervals to condition the batteries through low rate,
deep discharges up to 40% DOD and followed by low rate recharge. This operationhas been added to our operational list in an effort to maintain and possibly boost EON
LBV.
Even though these batteries have met the minimum mission requirements, we
contend that the amount of "care and feeding" they have required has been
considerably greater than was originally anticipated. One of the biggest obstacles theFOT has had to overcome in operating the UARS power subsystem is both the limited
number and selection of telemetry points available to trend. Individual cell voltage
monitors, more accurately calibrated current sensors, and the addition of battery
temperature sensors on and around each battery would indicate early anomalousbehavior and overcharge conditions, and would certainly have helped in managing the
battery operations as discussed above.
Recognizing that the case for Low-Earth Orbit Battery Reconditioning is still beingdebated, we have found deep conditioning discharges and periodic battery exercise
during low load periods to be beneficial. To aid these operations, it would be usefulto have "reconditioning" circuitry available in the S/C Power Subsystem. Deep
Discharge is only possible on UARS during the periods of Full-Sun (almost full orbit
opportunities to charge batteries) that the S/C experiences bi-annually.
Several additional MPS features that would have been advantageous in conducting
the operations outlined above are:• Independent charge controller for each battery.• Single commands for each V/T level/MPS charge mode selection.• Greater thermal control over the MPS.
. Incorporation of the heat pipe used successfully on other S/C.Additional MPS/Battery heaters and/or heater control.
and• Incorporation of a charge system based on controlling overcharge.
- Switching MPS modes at a specific C/D, etc.
NASA is currently implementing some of these features in GSFC's up-coming low-
Earth orbiting S/C's Power Subsystem designs.
1993 NASA Aerospace Battery Workshop -486- Nickel-Cadmium Technologies Session

Finally, the success of the UARS mission and the power subsystem in particularhas been directly affected by the successful management of the MPS and the
batteries. Anomalous battery performance and its resultant effects have been
aggressively attacked through monitoring and managing the following parameters:
Monitor;• Voltage (EON/EOD/Instantaneous),• Current Sharing during Charge and Discharge (High and Low currents)
• Half Battery Differential Voltage,• SOC, and
• Eclipse Time (Beta Angle),
Mana qe:• Battery Overcharge,
• Temperature,
• Recharge ratio,• DOD,
• Time in peak Power Tracking,
• Time in Taper,• Solar Array Offset (Peak Charge Current),• V/T control mode, and
• Constant Current Mode.
It is our fervent hope that the Trials, Tribulations, and Successes experienced by
the UARS Power Subsystem Operations Group, which includes the UARS GSFC
Project Staff, GSFC's Space Power Applications Branch, the UARS FOT, UARS
Mission Planning Group/Space Systems Applications Incorporated (SSAI), andMDESC can aid future Power Subsystem Designers and Operators by documenting
the problems encountered, solutions stumbled across, and of course the planned,
successful operations performed during UARS mission operation to date.
1993 NASA Aerospace Battery Workshop -487- Nickel-Cadmium Technologies Session

Acknowledgments
The authors wish to sincerely thank all of the extremely professional and expert
NASA, Martin Marietta, MDESC, and SSAI employees involved with the UARS MPS and
battery operations for their efforts over the design and operational lifetimes of this
project. V_thout their hard work and steadfast dedication, the UARS Project would
truly not be what it is today.
Special Thanks to:
NASA/GSFC S0ace Power Applications Branch:
Dr. John Day
Marion Enciso
Jim Jagielski
Dave Jung
Ernie Rodriguez
NASA/GSFC, UAR$-Pro!ec-_t.Ken Dolan
John Donley
Sam OsierDave Lorenz
]_rtin Marietta-UAR$ FO_-Hal CollinsGene Pearlman
Nick Chilelli
Erik Larson
Rich Calvin
Rich BeckAll On-line Operations Team Members
McDonnell Dou_ systems Company_
Mark Toft
Mo Zollner
Bob Green
_..&.q_e ._j_ms Applications Incorporated_:
Dan Wise
Bob Neff
Barb HoltRavi Bahethi
Kim McCarty
1993 NASA Aerospace Battery Workshop -488- Nickel-Cadmium Technologies Session

References
1. NASA Goddard Space Flight Center Code 408, "Multimission Modular
Spacecraft (MMS) Modular Power Subsystem (MPS) Battery Storage And OperatingProcedures", Rev B, NASA GSFC, Greenbelt MD, Document # 408-2101-0002, pp. 4-1
to 7-11, February 1980.
2. NASA Goddard Space Flight Center Code 430, "UARS General Instrument
Interface Specification (GIIS)", Rev C, NASA GSFC, Greenbelt MD, Document# 430-
1601-002, pp. 3-4 to 3-6, February 1985.
3. Tort M., "NASA Standard 50 Ah Nickel Cadmium Battery Cell - Cell Level
Performance History", NASA Aerospace Battery Workshop, Huntsville Alabama, NASAConference Publication # 3140, pp. 343-378, 1991.
4. NASA Goddard Space Flight Center "GSFC Specification of Manufacturing of
Aerospace Nickel Cadmium Storage Cells", NASA GSFC, Greenbelt MD, January
1974.
5. NASA Goddard Space Flight Center Code 408, "GSFC Specification For The
NASA Standard 20-Ah Spacecraft Battery and the 50 Ah Spacecraft Battery", Rev B,
NASA GSFC, Greenbelt MD, Document # S-7111-16, pp. 3-1 through 3-16, September1980.
6. Zimmerman, A.H. and Effa, P.K., "Nickel-Cadmium Cell Performance Recovery
and Reconditioning", Chemistry and Physics Laboratory Operations, The Aerospace
Corporation, El Segundo, CA, for Space Division Air Force Systems Command, Los
Angeles CA, Report SD-TR-82-63, September 1982.
7. Vasanth, K.L., "Second Plateau Voltage in Nickel Cadmium Cells", NASA/GSFC,
Battery Workshop Proceedings, Greenbelt, MD, NASA Conference Publication # 2331,
pp. 223-239, 1983.
8. NASA Goddard Space Flight Center Code 430, "GSFC Specification For The
Upper Atmosphere Research Satellite (UARS) Observatory", Rev A, NASA GSFC,
Greenbelt MD, Document # 430-1101-001, pp 3-14, June 1986.
1993 NASA Aerospace Battery Workshop -489- Nickel-Cadmium Technologies Session

g