niches and networks: prospects for strategic analysis
TRANSCRIPT
NICHES AND NETWORKS: PROSPECTS FOR STRATEGIC ANALYSIS
Philip Boxer, Boxer Research Ltd. Robin Wensley, Warwick Business School
SYNOPSIS
The network characteristic of markets has been widely recognized by a number of researchers particularly in the field of Organizational Buyer Behavior and Industry Innovation. An analogous development in Industrial Economics and micro economic analysis is the recognition of the relationship between the various value, added stages of production and the role of intermediaries in the overall industry structure.
This widespread recognition of the greater complexity of both producer and market organization has, however, posed severe problems for analysis at the level of both the individual firm and also public policy. In the former case there has developed an espousal of so-called 'niche* strategies for firms whilst in the later case the realities of market organization are often ignored in the general notion of the 'free* market. The complexity of the data requires powerful forms of analysis which can address such issues in a more systematic manner and yet most current attempts fail to reveal new insights or taxonomies for the network structures that are observed.
This paper proposes a closer evaluation of the particular problems of network analysis to indicate what form such analysis might take and how it might be translated into a strategy framework. Such a development provides the opportunity for a critical appraisal of some current examples of empirical work in this area as well as indicating the sorts of questions and issues that the new forms of analysis might address. A number of these questions are seen as critical to developing a more market based method for strategy evaluation in such contexts.
Address for Correspondence:
Professor Robin Wensley, Warwick Business School, Warwick University. COVENTRY, CV4 7AL, ENGLAND

50
INTRODUCTION
As the analysis of marketing strategies for individual firms and business units have developed, and particularly the search for so-called 'value added* strategies, a number of related issues have been recognised:
- the trend towards ' niche* strategies as a response to increasing competition with the consequential requirement to find better and better 'fits' between customers' needs and producers' capabilities.
- the existence of 'intermediary 1 positions mixing-and- matching between one set of producers and another, creating chains along which different activities attract margin in varying ways upstream to downstream.
- the existence of 'linkages' defined both in terms of technology and customer synergies. In this sense, technology linkages are based on transferability of knowledge whilst customer synergies are based on commonality of problem .
This series of developments adds up to a degree of complexity which is a phenomenon in itself, both from the point-of-view of our analysis of markets as well as for the development of sustainable marketing strategies for individual firms. Indeed the conflict between the inherently over-simple assumptions in many of the forms of corporate strategy analysis and the complexity of strategy choices in reality can be seen as the key limitation in the application of systematic analysis in this area 1 .
VALUE CHAINS, DISTRIBUTION CHANNELS AND BUYER-SELLER INTERACTIONS
The network characteristics of markets have been widely recognised by a number of researchers particularly in the field of Organisational Buyer Behaviour and Industry Innovation:
- Foxall 2 distinguishes between manufacture-initiated and user-initiated innovation - active or passive customers.
- Gadde and Mattsson 3 describe the matrix of relationships which exist between any one set of suppliers and buyers over time in terms of the one-to-one and the one-to-many relationships of supplier and buyer over time. Their focus is on the changes in the structure of this matrix of relationships over time.

51
- Mathur 4 defines the relationship between buyer and supplier in terms of its 'hardware' and 'software 1 - the technology itself and the services and activities associated with technology transfer - in order to characterise the relationship as needing to differentiate performance on these two axes. He describes the relationship as having a life cycle in which the ways in which the software and hardware dimensions of the relationship change over time.
The existence of a complex matrix of relationships surrounding any buyer-suppler relationships can therefore be regarded as self-evident.
An analogous development in micro economic analysis is the recognition of the relationship between the various value adding stages of production and the role of intermediaries in the overall industry structure. Porter 5 represents a form of analysis in which 'value* is defined as the surpluses accruing to business activity along a chain of supplier-buyer relations linking producer to end-user. This concept apples as much within businesses as between them, although in the former case 'value' is more obviously subject to accounting convention than in the latter case, where issues of competitive advantage become more apparent.
The basic elements in the supplier-buyer link can be represented by three matrices:
* The 'producer' matrix which specifies how the supplier/producer transforms inputs into outputs (products).
* The 'channel* matrix which details the specific and consistent exchange relationships between seller outputs and buyer inputs
* The 'customer' matrix which represents the ways in which the buyer transforms inputs (use situations) into outputs (end uses).
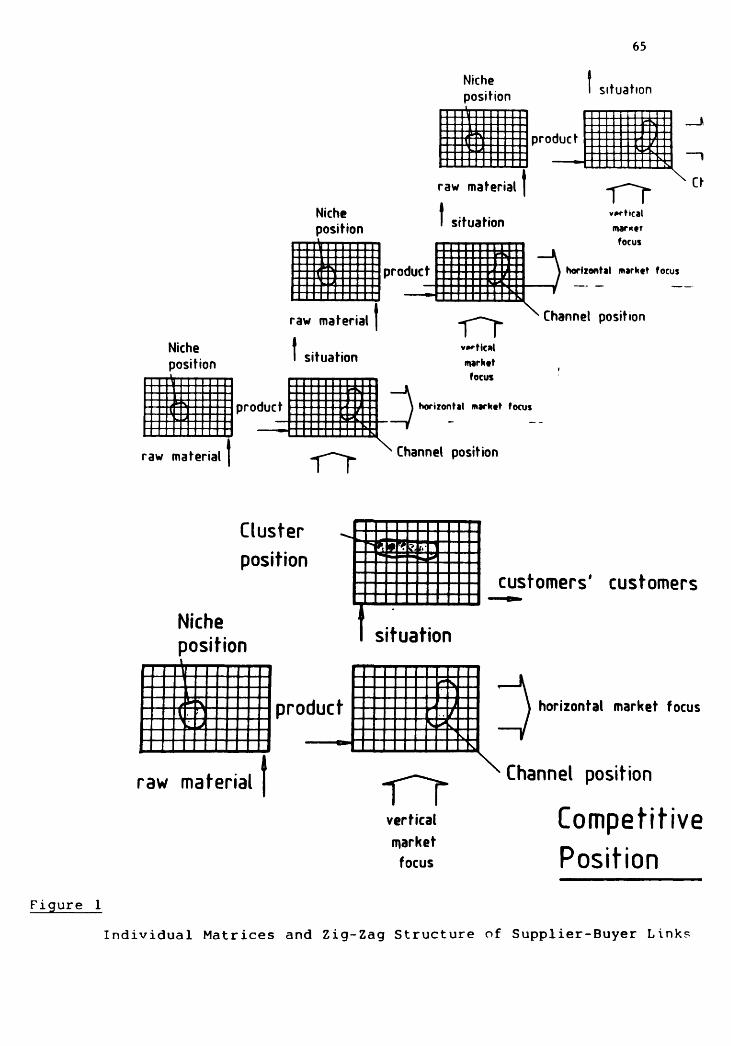
Any firm which spans more than one exchange transaction or transformation can define a 'boundary' around the set of matrix elements that it incorporates. This then becomes the competitive position adopted by the firm. In terms of the diagram (Figure 1) a bias towards the horizontal in the channel matrix represents a focus on product outputs whilst a bias towards the vertical represents a focus on situation inputs. This greater complexity of both producer organisation and the relationship between producers provides a framework in which to describe the development of three generic strategy types: not only the so-called 'niche* strategies but also 'channel* and 'cluster* strategies.

52
The concept of a 'niche' strategy seems most closely associated with finding a position in the producer matrix in which the business is singularly well-equipped to dominate both supplier and buyer relationships over time. Such a position is rooted in the business 1 command of its productive technology in ways which contrast with the other 'generic' strategy types, the 'channel 1 business which must depend on the goodwill in its relationships with both suppliers and buyers; and the 'cluster' business which must know more about how to solve its customers' problems than the customer themselves. In a complex supply chain, however, a customer matrix becomes a producer matrix for the next step in the chain. The three matrices define a 'zig-zag' of relationships which can be repeated indefinitely along a chain of suppler- buyer relationships.
Of course, from a competitive strategy point-of-view for the individual firm, there are not only many positions within any one matrix but also many positions along each chain. In the development of systematic research in this area an obvious problem arises: the complexity of the data describing these multiple positions requires more powerful forms of analysis than those designed to analyse singular competitive positions. Glaser and Halliday6 suggest that managers within such a complex competitive environment 'arrange' things in such a way that they are able to ignore all but the important relationships; and that this behaviour is the key characteristic for ensuring the stability of the networks over time. While a practical way of 'coping' on a day-to-day basis, this does not suggest any way in which managers are able to 'rise above things' in order to form new relationships. Thus it offers no basis for redefining competitive advantage. In contrast, Easton7 introduces a way of classifying the nature of the important relationships across the network in order to be able to re-define 'industry' primarily in terms of competitive behaviours rather than in terms of products or asset positions. While valuable in shifting attention away from asset-based descriptions of competitive advantage towards behaviour-based ones, this approach seems to take position as a 'given' rather than treating it too as behaviour-based (ie as itself an incorporation of one or more exchange transactions and transformations).
The problem seems to be that no descriptive methodology seems to exist which can describe both position (what will later be called first-order organisation...) as well as the relationship between position (... and second order organisation) - one or other gets taken as a given. Thus most current attempts seem to fail to reveal new insights or even taxonomies for the observed network structures in these terms yet these questions are critical to developing a more market based method for evaluating not only firm strategy but also the interactions between firm strategies and the policy issues

53
associated with market organisation. Clearly much of the explanation for this failure lies in the different interests and intentions of the researchers themselves but if we are to develop market network analysis in this direction we must also develop a method which enables us to analyse the network at different 'levels' concurrently.
THE ANALYSIS OF POSITION AND MARKET ORGANISATION
The analytical problems are clearly substantial but we first need to recognise the key limitations of some of the recent approaches. One approach is to focus on the 'elements' of resources, activities and actors . This approach has the advantage of distinguishing between passive resources, transformational activities and the goal directed behaviour of individuals or firms but it does not address systematically the analysis of forms of organisation. Hence we need a descriptive capability which does not collapse the various levels of coordination and connectivity.
Gadde and Matteson 3 make reference to the possible use of communication network approaches. However, their own analysis only looks at the 'intermediary network* between one set of producers and a set of customers defined as usage situations. What happens when we give this treatment to a whole chain is that we get an explosion of situations or producers depending on whether we work from upstream down or downstream up.
We need to describe particular ways in which these portfoliosof exchange relationships are organised by individual actorsor firms - first-order organisation.
Glaser and Halliday6 show how actors create stability by ignoring relationships not defined as relevant to their activity. This is another way of defining a strategy - particularly a niche strategy - as a choice to pay attention to particular relationships as being of 'strategic' importance; and others as not. First order organisation then can.be described as these particular incorporations of one or more exchange transactions and transformations. These positions themselves can be logically distinguished in the zig-zag chain as being in producer, channel or customer matrices.
We can now begin to discuss how these positions taken by actors themselves interact - 'second-order 1 organisation. We refer to this second-order organisation as market organisation to distinguish it from the forms of first-order organisation brought forth by individual firm or corporate strategy. This definition of 'market organisation' is critical to the analytical method that we will introduce later in this paper. In particular, market organisation should be clearly distinguished from the notion of a 'market', which refers

solely to a specific means of transacting between different actors with respect to a product or service.
Easton 7 attempts to describe the nature of these second-order relationships but without a direct analytical method to relate his description of market organisation to both the level of firm organisation and also specific exchange patterns.
To develop our analysis further we need to use a specific 'industry* example. Pilkingtona provides an example of an industry where it is fairly easy to follow a product down a supply chain from original manufacture to end-use. Figure 2 illustrates the different stages in the supply chain. It is possible to draw these matrices so that each channel matrix overlaps with more than one subsequent 'niche 1 matrix. In order to make it visually simpler however, this has been represented by the presence of 'Primary 1 , 'Secondary' etc Distribution lines and columns in the subsequent matrices."
The format follows the general format of niche-channel-cluster which repeats itself at each stage. Thus from the point-of- view of the 'Raw Matrix' niche position, the 'Primary Processing Matrix* is a cluster position in relation to which the processes in the 'Raw* and 'Primary Distribution' Matrices cluster. From the point-of-view of the 'Bulk Breakers' both 'Primary Processing' and the 'Raw* positions are niche positions - it all depends on where you are looking from. In all there are 8 matrices describing niche positions, with 8 corresponding matrices describing channel positions. The ninth matrix (the columns of which would be "Households" and "Office+Factory" defines the positions around which the rest of the industry cluster.
It becomes apparent immediately that this is a very complicated potential network of relationships. Each step reaches downstream anything from one to six further steps; so there is considerable 'leapfrogging* within the industry. Some of this will, of course, be because the analysis itself has not differentiated clearly enough between positions; but apart from this, the 'leapfrogging* will be because the sustainability of intermediary positions varies across technologies and supplier-buyer relationships.
The other factor complicating infrastructure is the presence of Pilkingtons businesses along the whole length of the chain. This not only means that they have the ability to gain intelligence on each step in the chain; but also that their strategic views are capable of influencing the development of the whole industry.
To produce a picture like this takes a long time, but is possible in an industry like this precisely because there is a product to follow through. In chemicals, electronics, engineering, health services to name just a few, both the

55
number of steps and the number of positions in each step would increase exponentially. Clearly a diagrammatic form such as this would become inadequate to describe infrastructure.
Even at this level of complexity however it is possible to begin to see the scope for competitive re-definition of positions within the industry, quite apart from considering the effects of new technology. It is clear that greater 'methodological purchase* is going to be needed if we are to do justice to the range of strategic options open to an actor in the industry.
VARIOUS LEVELS OF ANALYSIS OP THE STEPS IN THE CHAIN
The original data from the Pilkington's study was used to begin to think through their downstream strategy - for example where retailing and contract management fit into the rest of their 'portfolio 1 . However, we merely wish to use it here to illustrate the initial forms of analysis that are feasible.
The way we seek to gain greater 'methodological purchase 1 on the data is firstly to introduce a formal syntax which carries all the distinctions about position and layer 9 . We use this syntax to describe the network of relationships between positions against a backcloth of three forms of overlay:
(i) the infrastructural overlays of asset sunk costs of producers; and the equivalent sunk costs of customers which manifest themselves individually as 'usage situations' and collectively as different kinds of customer context;
(ii) the ownership and technology linkages - the former being primarily concerned with issues of management accountability and control and the latter with either producers' knowledge or customers' problem domains;
(iii) the superstructural framing by the directing presence of various businesses through owning multiple positions and being able therefore to determine market organisation in relation to the overall 'zig-zag' chain.
The syntax for describing the chains themselves uses the following conventions:
&-prefix product or market%-prefix niche/cluster position"-prefix channel position
&Name starting with a Capital letter signifies a horizontal market focus; and &name with a lowercase letter signifies a vertical market focus. As above the terms 'product' and

56
'market 1 are treated as relatively synonymous in that they can both be regarded as the physical manifestation of an exchange relationship. 'Market organization 1 , however, has a very different meaning.
Hence the supply/demand chain always has the following syntax:
(n -> %.... -> (N -> ".... -> (n
In this way the linkages, which include both the transformational and exchange elements across the whole industry's supply-demand chain can be described, such as:
%imports -> (Float_glass, (Horticast, &Roughcast,(Wiredcast, (Patterned, &Sheet
(rawjnaterials -> %St_Helens -> (Float_glass (rawjnaterials -> %Watson_St -> (Horticast, (Roughcast,
(Wiredcast, (Patterned
(Float_glass -> "distnl -> (corby, (motor_window_mfrs, (tougheners, (silverers, tlaminators, (sealed_unit_mfrs, (bulk_breakers, (merchants, &Motor_window_reps, (acrylic_mfrs
On these linkages we can then describe
(i) infrastructure:
l-prefix asset capabilities £-prefix customer contexts;
(ii) organisation:
$-prefix accountability*-prefix technology/know-how linkages; and
(iii) superstructure:
?-prefix direction.
These infrastructural, organisational and superstructural linkages form a backcloth against which chains are formed. In this example the directing presence of Pilkingtons can be shown in the form:
PPilkingtons :: (St_Helens, &corby,&doncaster, (tougheners, &sealed_unitjnfrs, &framejnakers, (motor_window mfrs, &bulk_breakers, (merchants, (home improvers, (gTass shops, &greenhouse_mfrs, (conservatoryjnFrs, (glaziers, (Watson St.

57
The matrix form of the Pilkingtons data (Figure 3) shows this same data in visual form. The rows define product/markets; the columns in the left matrix define the positions; and the entries in the matrix define the linkages. The right-hand matrix shows the superstructure of direction represented by three significant players in the industry: Pilkingtons, Solaglass and Heywood Williams.
COMPETITIVE ANALYSIS AGAINST THE NETWORK BACKCLOTH
It is possible to see from Figure 3 that these three players have different but overlapping superstructural presences in the industry; and if the infrastructural assets and organisational business accountabilities and technology linkages were also shown, then they too would reveal different overlapping connectivities across the industry which collectively formed a backcloth against which to evaluate competitive position. The issue is how we systematically analyse such connectivities in terms relevant to competitive strategy. To do this we need to have a means of analysis which both represents and also compares the organising capabilities of the various competitors.
'Simple' network analysis tools such as density and dispersion measures are unable to address this type of question. Since the essence of structure is the connectivity between individual parts of a system, it is important to be able to describe adequately this basic characteristic. Q-analysis is an operational language of structure devised by the mathematician R.H. Atkin 10 . It is a language that is characterised by its verbal, graphical and mathematical nature 1 , and it is important to appreciate that it is not a technique or quantitative method, but rather an entire methodological perspective, and is based on a branch of mathematics called algebraic topology.
With Q-analysis we can measure the degree of relative interconnectedness of various patterns of activities against the backcloth of the layers of infrastructure, organisation and superstructure.
Pilkingtons has a presence in 15 product/markets. It can therefore create up to 14 linkages between these product/markets: so Pilkingtons' Q-dimensionality is 14; Solaglass' is 11; and Heywood Williams' is 8. The Q- dimensionality therefore is defined in terms of linkages - a Q-dimensionality of 1 identifies a 1-dimensional linkage. Thus Pilkingtons has a greater potential influence across the industry because of its higher Q-dimensionality. The highest level at which Pilkingtons shares common linkages is at Q-8 with Solaglass. Thus up to this level of connectivity. Solaglass and Pilkingtons can compete on an equal basis. Above this level however, Pilkingtons can 'outflank' any move

58
which Solaglass can make. Thus although no distinction is being made between whether this capability to 'outflank' is based on horizontal or vertical integration beyond that of Solaglass, Pilkingtons can be said to be "eccentric", in that there is more to Pilkingtons than Solaglass can see. This eccentricity represents the degree to which Pilkington's Q- dimensionality (its upper-q) exceeds the level at which it shares common presence with other businesses (its lower-q):
Lower-q Upper-q Eccentricity
PPilkingtons 8 14 0.67PSolaglass 8 11 0.33?Heywood Williams 7 8 0.12
It can be seen that Solaglass and Heywood Williams are also 'eccentric* with respect to Pilkingtons. Thus depending on the nature of the eccentric positions, both may have positional competitive advantage. To understand the significance of these different structural presences in the industry, we need to look in more detail at the analysis of both the supply chains leading to specific product markets and the linkages between product markets
The function matrix, is one in which the columns are the same as for the structure matrix, but the rows start with an @- prefix which signifies a supply or demand chain. In this case each chain is a supply chain showing all the positions involved prior to that product/market. Despite considerable variablility in q values all the supply chains have zero eccentricity (upper-q equal to lower-q):
TABLE 1
ANALYSIS OF SUPPLY CHAINS
q=0: @raw_materials
q=3: eacrylicjnfrs; gcorby; gdoncaster; gmotor_window_mfrs; gpic_framejnfrs; gsilverers;
q=10:@bulk_breakers; glaminators; §motor_mfrs.
q=12:@tougheners.
q=17:@sealed_unit_mfrs.
q=20:^merchants; imotor_window_reps.
q=23:@builders; £conservatory_mfrs; ^contractors;@framejnakers; §furniture_mfrs; §glass_shops;@glaziers; @greenhouse_mfrs; §home_improvers; §motor_end_users.
q=25:gretailers.

59
q=35:@households; @office+factory.
The fact that none of these are eccentric means that we are dealing with a very well-defined industry - all of the chains overlap with other chains. The q-dimensionality of the chain indicates the length of the chain and the complexity therefore of the positioning issues along the chain. Debate about competitive advantage would raise questions of the sustainability of so many different steps in the chain - without the organisation information on technology linkages and accountabilities, it is not possible to debate further whether these lengths of chain are necessary.
A related analysis in terms of the product/markets linked also shows very low eccentricities. Only for those links marked * does the upper-q value exceed the lower-q value, and then only by one unit.
TABLE 2
ANALYSIS OF LINKS BETWEEN PRODUCT MARKETS
Upper q values
q=0: +raw_materials.
q=7: +acrylic_mfrs*; +corby; +doncaster; +motor_windowjnfrs; +pic_framejnfrs; +silverers.
q=17:+bulk_breakers; « lamina tors; +motor_mfrs.
q=19:+tougheners.
q=25:+sealed_unit_mfrs.
q=27:+merchants; +motor_window_reps.
q=31: +motor_end__users*.
q=32:+builders; +conservatory_mfrs; ^contractors;+framejnakers; +furniture_mfrs; +glass_shops; ^glaziers; +greenhouse_mfrs; +home_improvers;
q=34: -^-retailers.
q=51: ̂ households*; ^officer-factory* -
Again the number of prior product/markets involved is surprising - it indicates the extent to which the chains link across multiple product types/processes - many players are involved in many parts of the industry.
60
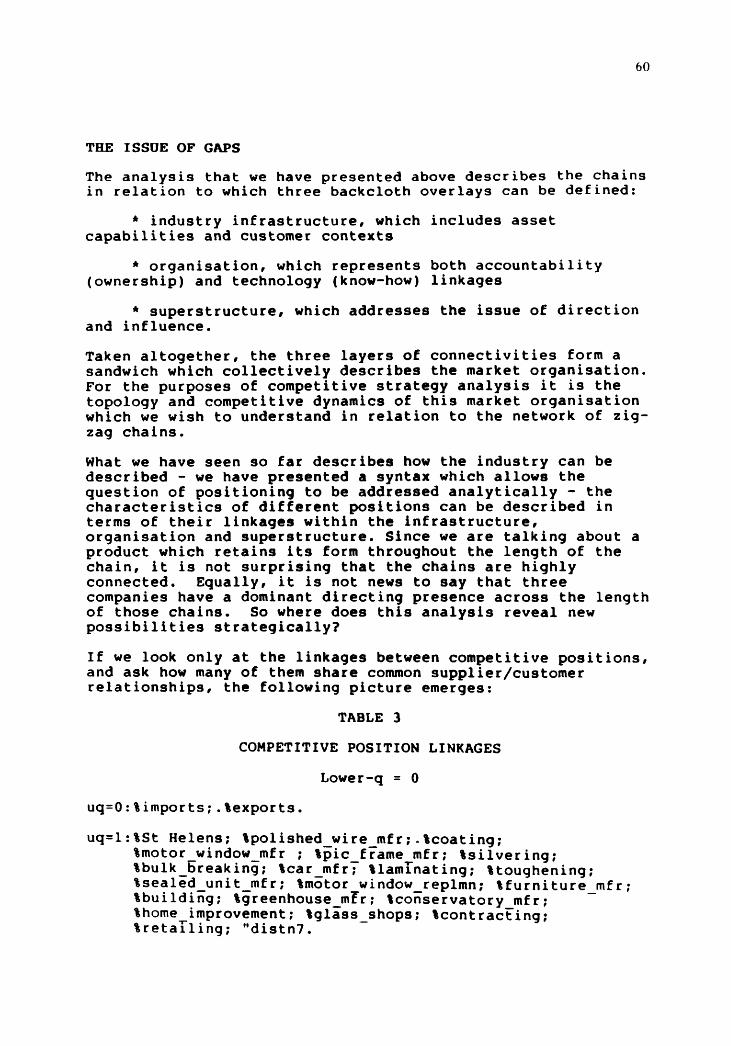
THE ISSUE OF GAPS
The analysis that we have presented above describes the chains in relation to which three backcloth overlays can be defined:
* industry infrastructure, which includes asset capabilities and customer contexts
* organisation, which represents both accountability (ownership) and technology (know-how) linkages
* superstructure, which addresses the issue of direction and influence.
Taken altogether, the three layers of connectivities form a sandwich which collectively describes the market organisation. For the purposes of competitive strategy analysis it is the topology and competitive dynamics of this market organisation which we wish to understand in relation to the network of zig zag chains.
What we have seen so far describes how the industry can be described - we have presented a syntax which allows the question of positioning to be addressed analytically - the characteristics of different positions can be described in terms of their linkages within the infrastructure, organisation and superstructure. Since we are talking about a product which retains its form throughout the length of the chain, it is not surprising that the chains are highly connected. Equally, it is not news to say that three companies have a dominant directing presence across the length of those chains. So where does this analysis reveal new possibilities strategically?
If we look only at the linkages between competitive positions, and ask how many of them share common supplier/customer relationships, the following picture emerges:
TABLE 3
COMPETITIVE POSITION LINKAGES
Lower-q = 0
uq=0:% imports;.%exports.
uq=l:%St Helens; %polished_wire_mfr;-%coating;%motor windowjnfr ; %pic_frame mfr; Isilvering; %bulk_5reaking; %car_mfr; %lamlnating; %toughening; %sealed_unit_mfr; %motor window_replmn; %furniture_mfr; %building; %greenhouse_mf~r ; %conservatory_mf r ; ~ Ihome improvement; %glass_shops; %contracFing; %retalling; "distn7.

61
Lower-q > 0; eccentricity = 0
uq=l:"imports4: "exports4. uq=2:%imports2; "exports2. uq=3:"exportsl. uq=5:%importsl.
Lower-q > 0; eccentricity > 0
Lower-q Upper-q Eccentricity
%merchanting 1 2 0.5%glazing 1 2 0.5"collection 13 1"instaln 17 3%Watson_St 3 4 0.25"distn6 3 6 0.75"distn4 49 1"distn2 5 12 1.17"distnl 6 21 2.14M distn3 7 11 0.5"distn6 7 13 0.75
The large number of these positions of lower-q=0 means that they all share at least a purchase or customer relationship with one other kind of business; but otherwise their positions are all differentiated. On the assumption that infrastructural assets correspond closely to these positions these describe classic 'niche* positions of varying attractiveness. All the other non-eccentric positions with lower-q > 0 are in import/export where the chain has not been completed.
This leaves a number of positions of lower-q>0 which share more than one supplier/customer relationship; but all of which are eccentric. These either occupy very complex positions in the chain (merchanting, glazing, Watson_St) where the business faces many conflicting pressures on how it operates as a business; or are highly eccentric because they are involved in creating channel linkages spanning a number of different steps in the chain coupling supply and demand at different steps in the chain). Competitve advantage here will depend very much on the nature of the organisational backcloth (which itself is very bound up with the use made of informational technology).
This picture of a large number of individual positions which overlap very little with other parts of the chain; and a few (channel) positions which occupy very complex positions linking together many of the other positions can be summarised in the form of a 'structure vector 1 :

62
Structure Vector:
Q-level 0 1 2 3 4 5 6 7 8 9 10 11 12 13 14... 21 Number 1 28 5355555544321... 1
This shows that at q-level=0 there is only one 'component 1 everything is linked to at least one position. At q=l (sharing at least 1 linkage with another position) there are 28 different components. This means that at q=l there are many different positions which have their own internal problems concerned with integrating their supply/customer relationships which are unique to them and which they do not share with (27) other positions in the industry. At q=2 the number of separate components is 5; and so on.
Thus if a new pattern of demand or supply emerges in the form of a new chain, while on the one hand we know it will impact on the chain as a whole because of its connectivity, the characteristics of the industry's infrastructure mean that a large number of different positions will be affected. The change will have to filter along the chain, however, through a large number of local linkages. This absence of connectivity of sufficient Q-dimesionality corresponding to patterns of demand is a GAP in the industry's infrastructure. A business which can fill such a GAP in times of change will be able to respond much faster in creating new competitive positions. Because of then high dimensionality of Plikington's superstructural presence, it is more likely to be able to 'see* such an opportunity; and depending on its organisational capabilities to deploy behaviours to fill the gap.
The issue of public policy is directly related to the nature of the gaps. If we can understand the dynamics of the gaps then we begin to address policy issues such as the extent to which, say, restructuring of particular ownership patterns and forms of corporate organisation will aid the resolution of specific gap 'problems'.
CONCLUSION
This paper has been addressed to the problem of relating the network nature of any overall market or industry structure to the forms of analysis that can be used in aiding the formulation of both corporate strategies and public policy responses.
An appropriate form of analysis in such situations needs to adequately represent the complexity of the network structure and enable the user to interpret the network against a backcloth of infrastructural, organisational and

63
superstructural layers. The particular example used illustrates one such possible approach using Q-analytical techniques.
To develop such analysis further,the importance of gaps in the backcloth must be recognised. These provide not only the opportunity for competitive advantage through new forms of organisation but also the means of providing a diagnostic guide for public policy evaluation.

FOOTNOTES
1. Wensley, R.
2. Foxall G.R
3. Gadde L.E. & Mattsson L.G.
Mathur S.S.
5. Porter, M.E.
6. Glaser S.& Halliday M.I
Easton G.
"Strategic Marketing: Betas, Boxes or Basics", Journal of Marketing, 45 (Summer), 1981, 173-182.
"Markets, Hierarchies, and User-Initiated Innovation: Implications for the Marketing of Technology", in R. Wensley (ed), MEG Proceedings July, 1987, Warwick University, 567-606.
"Stability and change in network relationships", International Journal of Research in Marketing, 4, 1987, 29-41.
"Competitive Industrial Marketing Strategies", Long Range Planning, 7(4), 1984, Reprinted in McRinsey Quarterly, Winter 1985.
Competitive Advantage, 1985, New York: Free Press.
"The Stability of a Complex Social System", paper presented at TIMS/ORSA Conference, Seattle, March 1988.
Competition and Marketing Strategy", European Journal of Marketing, 22(2), 1988, 31-49
8. Hakansson, H (ed)Industrial Technology Development - ANetwork Approach, 1987, London: Groom Helm.
9. The syntax and methodology which follows is based on 'PAN 1 -software designed specifically to support the analysis of market organisation.
10. Atkin R.H
11. Gould P
" Q-Analysis: a hard language for the soft sciences". Futures ,December, 1978, pp 492-499.
"Q-analysis, or a language of structure: an introduction for social scientists, geographers and planners", International Journal of Man-Machine Studies, Vol 12, 1980, pp 169-199.
65
ct
Channel position
horizontal marfctt focus
raw material -rr Channel position
Cluster position
customers' customers
Niche position situation
product
raw material\
verticalmarketfocus
horizontal market focus
Channel position
Competitive Position
Figure 1
Individual Matrices and Zig-Zag Structure of Supplier-Buyer Link?

retailer
Glass Supply
Chain Matrix
assembly
wholesale
sealed unit mfr
2ary processing
bulk breaking
1ary processing
raw
enduser
7ary
6ary
Sary
4ary
3ary
2ary
1ary distribution
• •
U:
r^i ST I
«•*•• I
Figure 2Different Overall Stages in the Glass Supply Chain and Detail of First Stage.

Figure 3
Directional Presence of Pilkingtons and Two Compet itors .
t*IHm"»ttn : Hl«* I
67
IMII»««