nice sugar nejm 2009
TRANSCRIPT
n engl j med 360;13 nejm.org march 26, 2009 1283
The new england journal of medicineestablished in 1812 march 26, 2009 vol. 360 no. 13
Intensive versus Conventional Glucose Control in Critically Ill Patients
The NICE-SUGAR Study Investigators*
A BS TR AC T
The NICE-SUGAR study is a collabora-tion of the Australian and New Zealand Intensive Care Society Clinical Trials Group, the George Institute for Interna-tional Health (University of Sydney), the Canadian Critical Care Trials Group, and the Vancouver Coastal Health Research Institute (University of British Columbia). The NICE-SUGAR study writing commit-tee (Simon Finfer, F.R.C.P., F.J.F.I.C.M., Dean R. Chittock, F.R.C.P.C., Steve Yu-Shuo Su, Ph.D., Deborah Blair, R.N., Denise Foster, R.N., Vinay Dhingra, F.R.C.P.C., Rinaldo Bellomo, F.J.F.I.C.M., Deborah Cook, M.D., Peter Dodek, M.D., William R. Henderson, F.R.C.P.C., Paul C. Hébert, M.D., Stephane Heritier, Ph.D., Daren K. Heyland, M.D., Colin McArthur, F.J.F.I.C.M., Ellen McDonald, R.N., Imo-gen Mitchell, F.R.C.P., F.J.F.I.C.M., John A. Myburgh, Ph.D., F.J.F.I.C.M., Robyn Nor-ton, Ph.D., M.P.H., Julie Potter, R.N., M.H.Sc.(Ed.), Bruce G. Robinson, F.R.A.C.P., and Juan J. Ronco, F.R.C.P.C.) assumes full responsibility for the overall content and integrity of the article. Address re-print requests to Dr. Finfer at the George Institute for International Health, P.O. Box M201, Missenden Rd., Sydney NSW 2050, Australia, or at [email protected].
*The Normoglycemia in Intensive Care Evaluation–Survival Using Glucose Al-gorithm Regulation (NICE-SUGAR) study committees and investigators are listed in the Appendix.
This article (10.1056/NEJMoa0810625) was published at NEJM.org on March 24, 2009.
N Engl J Med 2009;360:1283-97.Copyright © 2009 Massachusetts Medical Society.
Background
The optimal target range for blood glucose in critically ill patients remains unclear.
Methods
Within 24 hours after admission to an intensive care unit (ICU), adults who were expected to require treatment in the ICU on 3 or more consecutive days were ran-domly assigned to undergo either intensive glucose control, with a target blood glucose range of 81 to 108 mg per deciliter (4.5 to 6.0 mmol per liter), or conven-tional glucose control, with a target of 180 mg or less per deciliter (10.0 mmol or less per liter). We defined the primary end point as death from any cause within 90 days after randomization.
Results
Of the 6104 patients who underwent randomization, 3054 were assigned to un-dergo intensive control and 3050 to undergo conventional control; data with regard to the primary outcome at day 90 were available for 3010 and 3012 patients, respec-tively. The two groups had similar characteristics at baseline. A total of 829 patients (27.5%) in the intensive-control group and 751 (24.9%) in the conventional-control group died (odds ratio for intensive control, 1.14; 95% confidence interval, 1.02 to 1.28; P = 0.02). The treatment effect did not differ significantly between operative (surgical) patients and nonoperative (medical) patients (odds ratio for death in the intensive-control group, 1.31 and 1.07, respectively; P = 0.10). Severe hypoglycemia (blood glucose level, ≤40 mg per deciliter [2.2 mmol per liter]) was reported in 206 of 3016 patients (6.8%) in the intensive-control group and 15 of 3014 (0.5%) in the conventional-control group (P<0.001). There was no significant difference between the two treatment groups in the median number of days in the ICU (P = 0.84) or hos-pital (P = 0.86) or the median number of days of mechanical ventilation (P = 0.56) or renal-replacement therapy (P = 0.39).
Conclusions
In this large, international, randomized trial, we found that intensive glucose con-trol increased mortality among adults in the ICU: a blood glucose target of 180 mg or less per deciliter resulted in lower mortality than did a target of 81 to 108 mg per deciliter. (ClinicalTrials.gov number, NCT00220987.)
The New England Journal of Medicine Downloaded from nejm.org on September 29, 2015. For personal use only. No other uses without permission.
Copyright © 2009 Massachusetts Medical Society. All rights reserved.

T h e n e w e ngl a nd j o u r na l o f m e dic i n e
n engl j med 360;13 nejm.org march 26, 20091284
Hyperglycemia is common in acute-ly ill patients, including those treated in intensive care units (ICUs).1 The occur-
rence of hyperglycemia, in particular severe hyper-glycemia, is associated with increased morbidity and mortality in a variety of groups of patients,2-5 but trials examining the effects of tighter glucose control have had conflicting results.6-13 Systematic reviews and meta-analyses have also led to differ-ing conclusions.14,15 Nevertheless, many profes-sional organizations recommend tight glucose con-trol for patients treated in ICUs.16,17
Barriers to widespread adoption of tight glucose control include the increased risk of severe hypo-glycemia,14 concerns about the external validity of some studies,18,19 the difficulty in achieving nor-moglycemia in critically ill patients,20,21 and the increased resources that would be required.22 Be-cause of these issues and uncertainty about the balance of risks and benefits, tight glucose con-trol is used infrequently by some clinicians.23,24 We designed the Normoglycemia in Intensive Care Evaluation–Survival Using Glucose Algorithm Reg-ulation (NICE-SUGAR) trial to test the hypothesis that intensive glucose control reduces mortality at 90 days.
Me thods
Study Design
We conducted a parallel-group, randomized, con-trolled trial involving adult medical and surgical patients admitted to the ICUs of 42 hospitals: 38 academic tertiary care hospitals and 4 community hospitals. Eligible patients were those expected to require treatment in the ICU on 3 or more consecu-tive days (see Appendix A in the Supplementary Appendix, available with the full text of this article at NEJM.org). A detailed description of the study was published previously.25
The study was approved by the ethics commit-tees of the University of Sydney, the University of British Columbia, and each participating institu-tion. Written informed consent, obtained before randomization, or delayed consent was obtained from each patient or from a legal surrogate.
Study participants were randomly assigned to glucose control with one of two target ranges: the intensive (i.e., tight) control target of 81 to 108 mg per deciliter (4.5 to 6.0 mmol per liter), based on that used in previous studies,12,13 or a conven-
tional-control target of 180 mg or less per deci-liter (10.0 mmol or less per liter), based on practice surveys in Australia, New Zealand, and Cana-da.23,25 Randomization was stratified according to type of admission (operative or nonoperative) and region (Australia and New Zealand or North America). Patients were randomly assigned to a treatment group by the clinicians treating them or by local study coordinators, with the use of a minimization algorithm26 accessed through a se-cure Web site. The treatment assignments were concealed before randomization, but subsequently, clinical staff were aware of them.
Control of blood glucose was achieved with the use of an intravenous infusion of insulin in saline. In the group of patients assigned to undergo con-ventional glucose control, insulin was adminis-tered if the blood glucose level exceeded 180 mg per deciliter; insulin administration was reduced and then discontinued if the blood glucose level dropped below 144 mg per deciliter (8.0 mmol per liter). Blood glucose levels in each patient were managed as part of the normal duties of the clini-cal staff at the participating center. In both groups, this management was guided by treatment algo-rithms accessed through a secure Web site (for de tails of the treatment algorithm, see https://studies.thegeorgeinstitute.org/nice/).
The trial intervention was discontinued once the patient was eating or was discharged from the ICU but was resumed if the patient was readmit-ted to the ICU within 90 days. It was discontinued permanently at the time of death or 90 days after randomization, whichever occurred first.
Blood samples for glucose measurement were obtained by means of arterial catheters whenever possible; the use of capillary samples was discour-aged. Blood glucose levels were measured with the use of point-of-care or arterial blood gas analyz-ers or laboratory analyzers in routine use at each center. All other aspects of patient care, including nutritional management, were carried out at the discretion of the treating clinicians.
Assessments and Data Collection at BaselineLocal study coordinators at each institution col-lected the data; source data were verified by study monitors from regional coordinating centers. At baseline, demographic and clinical characteristics, including the Acute Physiology and Chronic Health Evaluation II (APACHE II) score27 (which can range
The New England Journal of Medicine Downloaded from nejm.org on September 29, 2015. For personal use only. No other uses without permission.
Copyright © 2009 Massachusetts Medical Society. All rights reserved.

Intensive vs. Conventional Glucose Control in Critically Ill Patients
n engl j med 360;13 nejm.org march 26, 2009 1285
from 0 to 71, with higher scores indicating more severe illness) and the diagnostic criteria for se-vere sepsis,28 were collected. Admissions to the ICU directly from the operating or recovery room were classified as operative admissions. Patients were classified as having diabetes on the basis of their medical history and were classified as having trau-ma if the ICU admission occurred within 48 hours after admission to the hospital for trauma. Previ-ous treatment with corticosteroids was defined as treatment with systemic corticosteroids for 72 hours or more immediately before randomization.
From the time of randomization to the time of discharge from the ICU or 90 days after random-ization (whichever came first), we recorded all blood glucose measurements, insulin administra-tion, red-cell administration, blood cultures that were positive for pathogenic organisms, type and volume of all enteral and parenteral nutrition and additional intravenous glucose administered, and corticosteroid administration. Also recorded were the cardiovascular, respiratory, renal, hepatic, and hematologic components of the Sequential Organ Failure Assessment (SOFA, for which scores can range from 0 to 4 for each organ system, with higher scores indicating more severe dysfunc-tion)29 and the use of mechanical ventilation and renal-replacement therapy.
Outcome MeasuresOutcome measures and statistical analyses were defined in a prespecified statistical-analysis plan.30 The primary outcome measure was death from any cause within 90 days after randomization, in an analysis that was not adjusted for baseline char-acteristics. Secondary outcome measures were sur-vival time during the first 90 days, cause-specific death (see Appendix C in the Supplementary Ap-pendix for more information), and durations of mechanical ventilation, renal-replacement therapy, and stays in the ICU and hospital. Tertiary out-comes were death from any cause within 28 days after randomization, place of death (ICU, hospital ward, or other), incidence of new organ failure, positive blood culture, receipt of red-cell transfu-sion, and volume of the transfusion.
The primary outcome was also examined in six predefined pairs of subgroups: operative patients and nonoperative patients, patients with and those without diabetes, patients with and those without trauma, patients with and those without severe
sepsis, patients treated and those not treated with corticosteroids, and patients whose APACHE II score was 25 or more and those whose score was less than 25.30
Serious Adverse EventsA blood glucose level of 40 mg per deciliter (2.2 mmol per liter) or less was considered a serious adverse event. When the blood glucose level was measured with a bedside point-of-care analyzer, we requested that the treating clinician obtain a blood sample for laboratory confirmation before treating the presumed hypoglycemia. The details of each event were reviewed by the two study man-agement committees and submitted to the research ethics committees of all participating centers and to the independent data and safety monitoring committee.
Statistical Analysis
The study was originally designed to enroll 4000 patients. On the basis of data reported by Van den Berghe et al. in 2006,13 the sample size was in-creased to 6100, thereby providing a statistical power of 90% to detect an absolute difference in mortality between the two groups of 3.8 percent-age points, assuming a baseline mortality of 30% at a two-sided alpha level of less than 0.05. All data were analyzed according to the intention-to-treat principle, with no imputation for missing values. The primary analysis for death at 90 days was performed with the use of an unadjusted chi-square test. A secondary analysis based on logis-tic regression was also conducted, with the strata used for randomization (type of admission and geographic region) as covariates, as well as age, location before ICU admission, APACHE II score, and use or nonuse of mechanical ventilation at baseline. Other binary end points were analyzed by means of a chi-square test or Fisher’s exact test. Continuous variables were compared with the use of unpaired t-tests, Welch’s tests, or Wilcoxon rank-sum tests. All odds ratios and their correspond-ing 95% confidence intervals were calculated ac-cording to the profile-likelihood method. The time from randomization to death in the two treatment groups was compared with the use of the log-rank test, and the results are presented as Kaplan–Meier curves. Hazard ratios were obtained from Cox models. The time-weighted blood glucose level (with weighting based on the time difference be-
The New England Journal of Medicine Downloaded from nejm.org on September 29, 2015. For personal use only. No other uses without permission.
Copyright © 2009 Massachusetts Medical Society. All rights reserved.

T h e n e w e ngl a nd j o u r na l o f m e dic i n e
n engl j med 360;13 nejm.org march 26, 20091286
tween two consecutive measurements applied to the average of the two consecutive measurements) was computed for all patients for whom data were available.
Subgroup analyses for the primary outcome were based on an unadjusted test of interaction in a logistic model. Estimated distributions of indi-vidual patients’ average time-weighted blood glu-cose levels, according to treatment group, were obtained by fitting generalized lambda distribu-tions with the use of the method of maximum likelihood.31,32 All analyses were conducted with the use of S-PLUS software (version 8.0) and R software (version 2.7.0), and the results were verified independently with SAS software (ver-sion 9.1). The data were analyzed by the Statisti-cal Services Division of the George Institute for International Health (University of Sydney).
Two preplanned interim analyses were per-formed by an independent statistician when 1500 and 4000 of the 6100 patients (25% and 66%, re-spectively) reached the 90th day of follow-up. The analyses were reviewed by the independent data and safety monitoring committee, which was charged with recommending that the trial be stopped if there was evidence beyond a reasonable doubt of a difference in the rate of death from any cause between the two treatment groups. Since a difference of 3 SE was used as a guideline to rec-ommend early stopping, the final mortality anal-ysis was conducted with an alpha of 0.048.
R esult s
Study Participants
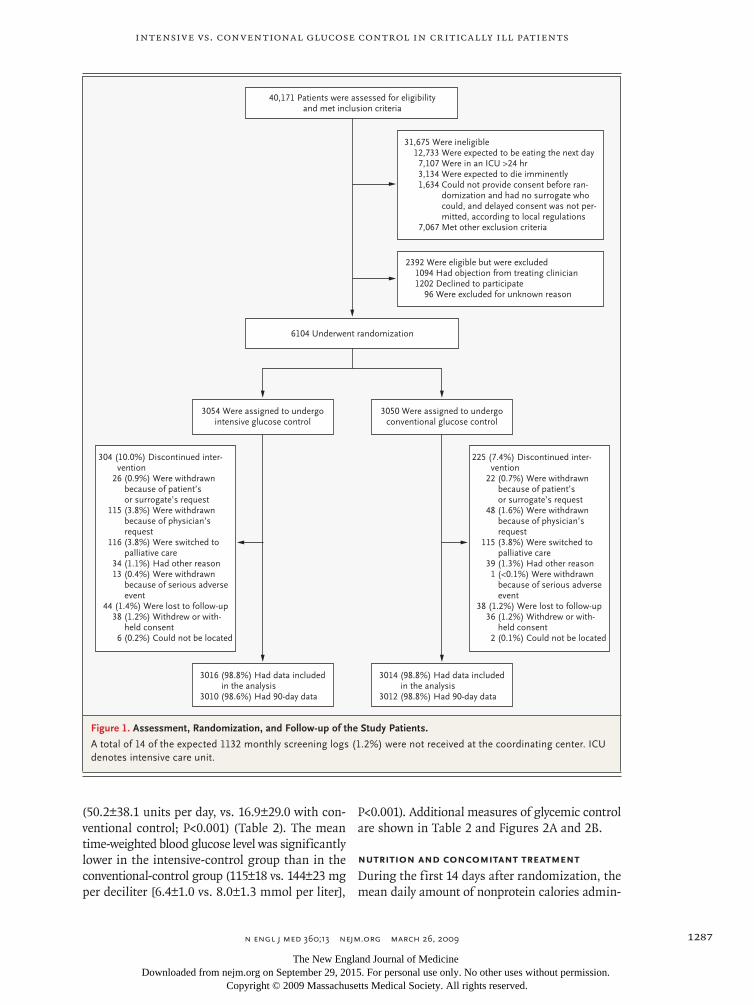
Participants were recruited and had follow-up dur-ing the period from December 2004 through No-vember 2008; 6104 were randomly assigned to one of the two treatment groups: 3054 to intensive glu-cose control and 3050 to conventional glucose con-trol (Fig. 1). Where delayed consent was permitted, every patient or a legal surrogate was approached for consent. Delayed consent to the use of study-related data was withheld, or previously obtained consent was withdrawn, for 38 of the 3054 patients (1.2%) assigned to intensive control and 36 of the 3050 patients (1.2%) assigned to conventional con-trol; thus, study data were available for 3016 and 3014 patients, respectively. At 90 days, an addi-tional six patients (0.2%) in the intensive-control group and two (0.1%) in the conventional-control group were lost to follow-up. Of the 6030 patients
for whom study data were available, 5275 (87.5%) were recruited in Australia or New Zealand.
The baseline characteristics of the treatment groups were similar (Table 1). The mean (±SD) age was 60.4±17.2 and 59.9±17.1 years in the in-tensive-control group and the conventional-con-trol group, respectively; the percentage of male patients, 62.6% and 64.2%; the mean APACHE II score, 21.1±7.9 and 21.1±8.3; and the percentage of operative admissions, 36.9% and 37.2%.
The assigned study treatment, intensive or con-ventional blood glucose management according to the study-treatment algorithm, was administered to 5997 of 6030 patients (99.5%): 2998 of 3016 (99.4%) in the intensive-control group and 2999 of 3014 (99.5%) in the conventional-control group. The median duration of study treatment was 4.2 days (interquartile range, 1.9 to 8.7) in the in-tensive-control group and 4.3 days (interquartile range, 2.0 to 9.0) in the conventional-control group (P = 0.69).
Study treatment was discontinued prematurely in 304 of 3054 patients (10.0%) in the intensive-control group and 225 of 3050 patients (7.4%) in the conventional-control group. Reasons for dis-continuation were withdrawal because of a request by the patient or surrogate (26 patients [0.9%] as-signed to intensive control and 22 patients [0.7%] assigned to conventional control) or by the treat-ing physician (115 patients [3.8%] and 48 patients [1.6%], respectively), because of serious adverse events (13 patients [0.4%] and 1 patient [<0.1%], respectively), because of a change in the focus of treatment to palliative care (116 patients [3.8%] and 115 patients [3.8%], respectively), and mis-cellaneous reasons (34 patients [1.1%] and 39 pa-tients [1.3%], respectively).
At the completion of the trial, data on vital status 90 days after randomization were unavail-able for 82 of 6014 patients (1.4%), 44 in the in-tensive-control group and 38 in the convention-al-control group. For 74 of these patients, the vital-status data were missing because consent had been withheld or withdrawn (Fig. 1).
Insulin Administration and Treatment Effects
Patients undergoing intensive glucose control were more likely than those undergoing conventional control to have received insulin (2931 of 3014 pa-tients [97.2%] vs. 2080 of 3014 [69.0%], P<0.001), and they received a larger mean insulin dose
The New England Journal of Medicine Downloaded from nejm.org on September 29, 2015. For personal use only. No other uses without permission.
Copyright © 2009 Massachusetts Medical Society. All rights reserved.
Intensive vs. Conventional Glucose Control in Critically Ill Patients
n engl j med 360;13 nejm.org march 26, 2009 1287
(50.2±38.1 units per day, vs. 16.9±29.0 with con-ventional control; P<0.001) (Table 2). The mean time-weighted blood glucose level was significantly lower in the intensive-control group than in the conventional-control group (115±18 vs. 144±23 mg per deciliter [6.4±1.0 vs. 8.0±1.3 mmol per liter],
P<0.001). Additional measures of glycemic control are shown in Table 2 and Figures 2A and 2B.
Nutrition and Concomitant Treatment
During the first 14 days after randomization, the mean daily amount of nonprotein calories admin-
33p9
6104 Underwent randomization
40,171 Patients were assessed for eligibilityand met inclusion criteria
31,675 Were ineligible12,733 Were expected to be eating the next day7,107 Were in an ICU >24 hr3,134 Were expected to die imminently1,634 Could not provide consent before ran-
domization and had no surrogate whocould, and delayed consent was not per-mitted, according to local regulations
7,067 Met other exclusion criteria
2392 Were eligible but were excluded1094 Had objection from treating clinician1202 Declined to participate
96 Were excluded for unknown reason
3054 Were assigned to undergointensive glucose control
3050 Were assigned to undergoconventional glucose control
304 (10.0%) Discontinued inter-vention
26 (0.9%) Were withdrawnbecause of patient’sor surrogate’s request
115 (3.8%) Were withdrawnbecause of physician’srequest
116 (3.8%) Were switched topalliative care
34 (1.1%) Had other reason13 (0.4%) Were withdrawn
because of serious adverseevent
44 (1.4%) Were lost to follow-up38 (1.2%) Withdrew or with-
held consent6 (0.2%) Could not be located
225 (7.4%) Discontinued inter-vention
22 (0.7%) Were withdrawnbecause of patient’sor surrogate’s request
48 (1.6%) Were withdrawnbecause of physician’srequest
115 (3.8%) Were switched topalliative care
39 (1.3%) Had other reason1 (<0.1%) Were withdrawn
because of serious adverseevent
38 (1.2%) Were lost to follow-up36 (1.2%) Withdrew or with-
held consent2 (0.1%) Could not be located
3016 (98.8%) Had data includedin the analysis
3010 (98.6%) Had 90-day data
3014 (98.8%) Had data includedin the analysis
3012 (98.8%) Had 90-day data
AUTHOR:
FIGURE:
JOB: ISSUE:
4-CH/T
RETAKE
SIZE
ICM
CASE
EMail LineH/TCombo
Revised
AUTHOR, PLEASE NOTE: Figure has been redrawn and type has been reset.
Please check carefully.
REG F
Enon
1st
2nd3rd
Finfer
1 of 3
03-26-09
ARTIST: ts
36013
Figure 1. Assessment, Randomization, and Follow-up of the Study Patients.
A total of 14 of the expected 1132 monthly screening logs (1.2%) were not received at the coordinating center. ICU denotes intensive care unit.
The New England Journal of Medicine Downloaded from nejm.org on September 29, 2015. For personal use only. No other uses without permission.
Copyright © 2009 Massachusetts Medical Society. All rights reserved.

T h e n e w e ngl a nd j o u r na l o f m e dic i n e
n engl j med 360;13 nejm.org march 26, 20091288
istered was 891±490 kcal in the intensive-control group and 872±500 kcal in the conventional-con-trol group (P = 0.14). Of this amount, 624±496 kcal (70.0%) and 623±496 kcal (71.4%), respectively, were given as enteral nutrition; 173±359 kcal (19.4%) and 162±345 kcal (18.6%) as parenteral nu-trition; and 93.4±88.8 kcal (10.5%) and 87.2±93.5
kcal (10.0%) as intravenous glucose (Table 2, and Appendix B in the Supplementary Appendix).
After randomization, more patients in the in-tensive-control group than in the conventional-control group were treated with corticosteroids (1042 of 3010 [34.6%] vs. 955 of 3009 [31.7%], P = 0.02). The median time from randomization to
Table 1. Baseline Characteristics of the Study Patients.*
Variable Intensive Glucose Control Conventional Glucose Control
Age — yr 60.4±17.2 59.9±17.1
Female sex — no./total no. (%) 1128/3016 (37.4) 1079/3014 (35.8)
Weight — kg 80.7±21.4 80.9±21.2
Body-mass index† 27.9±7.7 28.0±7.2
Interval from ICU admission to randomization — hr 13.4±7.6 13.4±7.7
Reason for ICU admission — no./total no. (%)
Operative 1112/3015 (36.9) 1121/3014 (37.2)
Nonoperative 1903/3015 (63.1) 1893/3014 (62.8)
Location before ICU admission — no./total no. (%)
Emergency department 718/3015 (23.8) 749/3014 (24.9)
Hospital floor (or ward)
Without previous ICU admission 640/3015 (21.2) 618/3014 (20.5)
With previous ICU admission 42/3015 (1.4) 30/3014 (1.0)
Another ICU 125/3015 (4.1) 102/3014 (3.4)
Another hospital 445/3015 (14.8) 453/3014 (15.0)
Operating room
After emergency surgery 682/3015 (22.6) 671/3014 (22.3)
After elective surgery 363/3015 (12.0) 391/3014 (13.0)
APACHE II score 21.1±7.91 21.1±8.3
Blood glucose level — mg/dl 146±52.3 144±49.1
Organ failure or dysfunction — no./total no. (%)
Respiratory
Dysfunction (SOFA score, 1–2) 1207/2993 (40.3) 1222/2990 (40.9)
Failure (SOFA score, 3–4) 1526/2993 (51.0) 1521/2990 (50.9)
Coagulatory
Dysfunction (SOFA score, 1–2) 947/2987 (31.7) 874/2989 (29.2)
Failure (SOFA score, 3–4) 128/2987 (4.3) 137/2989 (4.6)
Hepatic
Dysfunction (SOFA score, 1–2) 831/2807 (29.6) 834/2802 (29.8)
Failure (SOFA score, 3–4) 70/2807 (2.5) 50/2802 (1.8)
Cardiovascular
Dysfunction (SOFA score, 1–2) 583/3011 (19.4) 614/3012 (20.4)
Failure (SOFA score, 3–4) 1726/3011 (57.3) 1695/3012 (56.3)
Renal
Dysfunction (SOFA score, 1–2) 1042/2981 (35.0) 1071/2974 (36.0)
Failure (SOFA score, 3–4) 249/2981 (8.4) 228/2974 (7.7)
The New England Journal of Medicine Downloaded from nejm.org on September 29, 2015. For personal use only. No other uses without permission.
Copyright © 2009 Massachusetts Medical Society. All rights reserved.

Intensive vs. Conventional Glucose Control in Critically Ill Patients
n engl j med 360;13 nejm.org march 26, 2009 1289
commencement of corticosteroid treatment was 0 days (interquartile range, 0 to 1) in both groups (P = 0.34). The most common indication for cor-ticosteroid administration in both groups was the treatment of septic shock, occurring in 376 of the 1042 patients in the intensive-control group (36.1%) who received corticosteroids, as compared with 328 of the 955 patients in the conventional-con-trol group (34.3%) (absolute difference, 1.7 per-centage points; 95% confidence interval [CI], −2.5 to 5.9; P = 0.42) (Table 2).
Outcomes
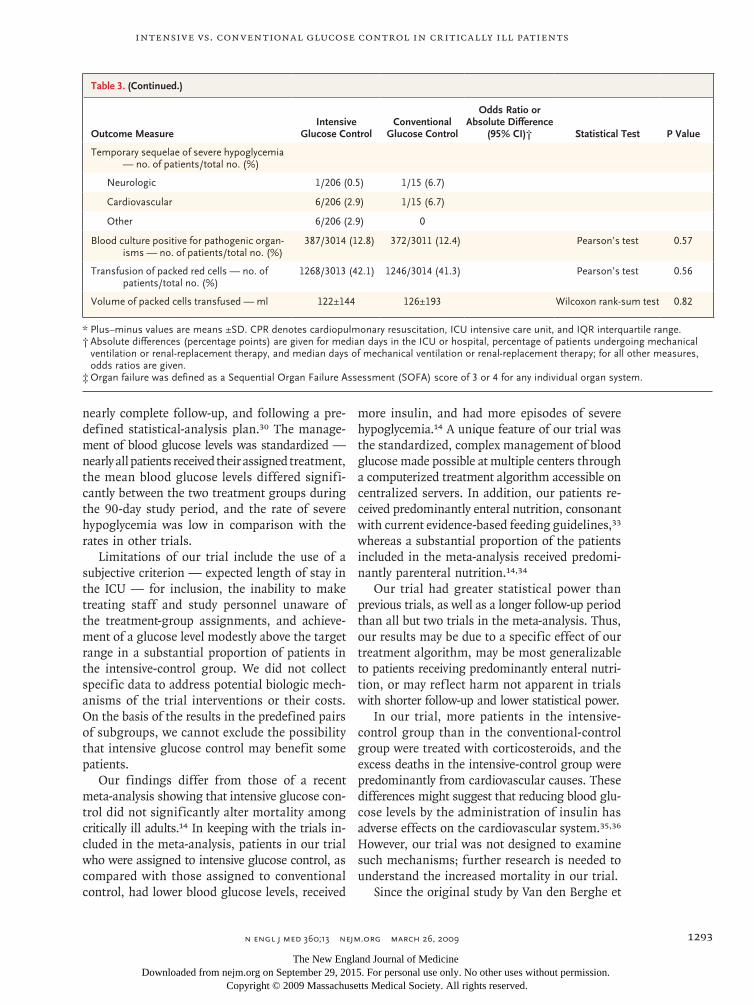
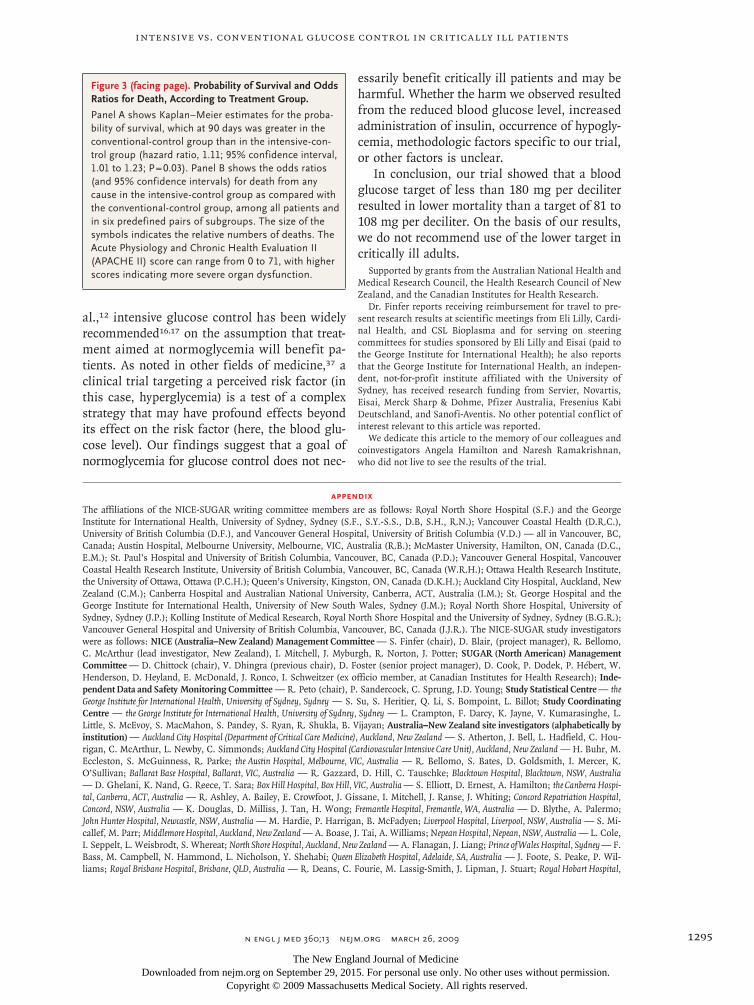
Ninety days after randomization, 829 of 3010 pa-tients (27.5%) in the intensive-control group had died, as compared with 751 of 3012 patients (24.9%) in the conventional-control group (Table 3). The absolute difference in mortality was 2.6 percent-age points (95% CI, 0.4 to 4.8), and the odds ratio for death with intensive control was 1.14 (95% CI, 1.02 to 1.28; P = 0.02). The difference in mortality between the two treatment groups was still sig-nificant after adjustment for the predefined base-line risk factors (adjusted odds ratio, 1.14; 95% CI, 1.01 to 1.29; P = 0.04). The median survival time was lower in the intensive-control group than in the conventional-control group (hazard ratio, 1.11; 95% CI, 1.01 to 1.23; P = 0.03) (Fig. 3A).
Overall, the distributions of proximate causes of death were similar in the two groups (P = 0.12)
(Table 3). However, deaths from cardiovascular causes were more common in the intensive-con-trol group (345 of 829 patients [41.6%]) than in the conventional-control group (269 of 751 pa-tients [35.8%]) (absolute difference, 5.8 percentage points; P = 0.02). In the intensive-control group and the conventional-control group, the majority of deaths occurred in the ICU (546 of 829 patients [65.9%] and 498 of 751 patients [66.3%], respec-tively) or in the hospital after discharge from the ICU (220 of 829 patients [26.5%] and 197 of 751 patients [26.2%], respectively). The remaining deaths (63 of 829 patients [7.6%] undergoing in-tensive control and 56 of 751 patients [7.5%] un-dergoing conventional control) occurred after hospital discharge. In both groups, potentially life-sustaining treatments were withheld or withdrawn in more than 90% of the patients who died (see Appendix D in the Supplementary Appendix).
During the 90-day study period, there was no significant difference between the two groups in the median length of stay in the ICU or hospital (Table 3). At 90 days, 7 of the 3016 patients (0.2%) in the intensive-control group and 6 of the 3014 patients (0.2%) in the conventional-control group were still in the ICU (P = 0.78), and 174 patients (5.8%) and 166 patients (5.5%), respectively, were still in the hospital (P = 0.66).
The number of patients in whom new single or multiple organ failures developed were simi-
Table 1. (Continued.)
Variable Intensive Glucose Control Conventional Glucose Control
Mechanical ventilation — no./total no. (%) 2825/3014 (93.7) 2793/3014 (92.7)
Renal-replacement therapy — no./total no. (%) 179/3014 (5.9) 165/3014 (5.5)
History of diabetes mellitus — no./total no. (%) 615/3015 (20.4) 596/3014 (19.8)
Type I diabetes 50/615 (8.1) 42/596 (7.0)
Type II diabetes 565/615 (91.9) 554/596 (93.0)
Previous treatment with insulin 183/615 (29.8) 163/596 (27.3)
Previous treatment with systemic corticosteroids — no./total no. (%) 393/3014 (13.0) 378/3014 (12.5)
Subgroup classification — no./total no. (%)
Severe sepsis at randomization 676/3014 (22.4) 626/3014 (20.8)
Trauma 422/3014 (14.0) 466/3014 (15.5)
APACHE II score ≥25 929/3013 (30.8) 945/3012 (31.4)
* Plus–minus values are means ±SD. Acute Physiology and Chronic Health Evaluation II (APACHE II) scores can range from 0 to 71, with higher scores indicating more severe illness, and Sequential Organ Failure Assessment (SOFA) scores can range from 0 to 4 for each organ system, with higher scores indicating more severe organ dysfunction. Severe sepsis was defined according to the consensus-conference cri-teria of the American College of Chest Physicians–Society of Critical Care Medicine.28 To convert the values for blood glucose to millimoles per liter, multiply by 0.05551. ICU denotes intensive care unit.
† The body-mass index is the weight in kilograms divided by the square of the height in meters.
The New England Journal of Medicine Downloaded from nejm.org on September 29, 2015. For personal use only. No other uses without permission.
Copyright © 2009 Massachusetts Medical Society. All rights reserved.

T h e n e w e ngl a nd j o u r na l o f m e dic i n e
n engl j med 360;13 nejm.org march 26, 20091290
Table 2. Blood Glucose Management and Levels, Calorie Administration, and Corticosteroid Treatment, According to Treatment Group.*
Variable
Total No. of Patients with Data
Intensive Glucose Control
Conventional Glucose Control
Absolute Difference (95% CI) Statistical Test P Value
percentage points
Treated with insulin — no./total no. (%) 6028 2931/3014 (97.2) 2080/3014 (69.0) 28.2 (26.5 to 30.0) Pearson’s test <0.001
Insulin dose — units/day 6028 50.2±38.1 16.9±29.0 33.3 (31.6 to 35.0) Welch’s test <0.001
Days on treatment algorithm — median (interquartile range)
5991 4.2 (1.9 to 8.7) 4.3 (2.0 to 9.0) −0.2 t-test 0.69
Morning blood glucose — mg/dl
From randomization to cessation of study treatment
6001 118±25 145±26 −27 (−28 to −25) Welch’s test <0.001
From randomization to ICU dis-charge
5987 118±25 145±26 −27 (−28 to −25) Welch’s test <0.001
Time-weighted blood glucose — mg/dl
From randomization to cessation of study treatment
6014 115±18 144±23 −29 (−30 to −28) Welch’s test <0.001
From randomization to ICU dis-charge
6000 115±19 144±23 −29 (−30 to −28) Welch’s test <0.001
Nonprotein calories administered on days 1–14 — kcal/day
By enteral route 624±496 623±496 2 (−24 to 27) Welch’s test 0.89
By parenteral route 173±359 162±345 11 (−7 to 29) Welch’s test 0.22
As intravenous glucose 93.4±88.8 87.2±93.5 6.3 (1.6 to 10.9) t-test 0.008
Total 891±490 872±500 19 (−6 to 44) t-test 0.14
Corticosteroid treatment — no./total no. (%)
6022 1042/3013 (34.6) 955/3009 (31.7) 2.9 (0.5 to 5.2) Pearson’s test 0.02
Interval from randomization to cortico-steroid treatment — median (interquartile range)
1996 0 (0 to 1) 0 (0 to 1) 0 t-test 0.34
Indication for corticosteroids — no./total no. (%)†
1997 Pearson’s test
Replacement for previous cortico-steroid treatment
168/1042 (16.1) 168/955 (17.6) −1.5 (−4.8 to 1.8) 0.38
Septic shock 376/1042 (36.1) 328/955 (34.3) 1.7 (−2.5 to 5.9) 0.42
Fibroproliferative ARDS 26/1042 (2.5) 17/955 (1.8) 0.7 (−0.6 to 2.0) 0.27
Immunosuppression for prevention or treatment of organ rejection
40/1042 (3.8) 41/955 (4.3) −0.5 (−2.2 to 1.3) 0.61
Immunosuppression for treatment of inflammatory disease
73/1042 (7.0) 61/955 (6.4) 0.6 (−1.6 to 2.8) 0.58
Cerebral edema after neurosurgery 46/1042 (4.4) 43/955 (4.5) −0.1 (−1.9 to 1.7) 0.92
Acute exacerbation of COPD 98/1042 (9.4) 90/955 (9.4) −0.02 (−2.6 to 2.6) 0.99
Acute asthma 39/1042 (3.7) 32/955 (3.4) 0.4 (−1.2 to 2.0) 0.64
Other 256/1042 (24.6) 237/955 (24.8) −0.3 (−4.0 to 3.5) 0.90
* Plus–minus values are means ±SD. To convert the values for blood glucose to millimoles per liter, multiply by 0.05551. ARDS denotes acute respiratory distress syndrome, and COPD chronic obstructive pulmonary disease.
† The sum of the number of indications for corticosteroids is greater than the number of patients with data (the number of patients treated), since some patients had more than one indication.
The New England Journal of Medicine Downloaded from nejm.org on September 29, 2015. For personal use only. No other uses without permission.
Copyright © 2009 Massachusetts Medical Society. All rights reserved.

Intensive vs. Conventional Glucose Control in Critically Ill Patients
n engl j med 360;13 nejm.org march 26, 2009 1291
lar with intensive and conventional glucose con-trol (P = 0.11) (Table 3). There was no significant difference between the two groups in the num-bers of days of mechanical ventilation and renal-replacement therapy or in the rates of positive blood cultures and red-cell transfusion (Table 3).
With respect to 90-day mortality, subgroup analyses suggested no significant difference in the treatment effect for the comparisons of op-erative and nonoperative patients (P = 0.10), pa-tients with and those without diabetes (P = 0.60), patients with and those without severe sepsis (P = 0.93), and patients with an APACHE II score of 25 or more and those with a score of less than 25 (P = 0.84) (Fig. 3B). Tests for interaction indi-cated a possible trend toward subgroup-specific treatment effects for patients with trauma as com-pared with those without trauma (P=0.07) and for patients receiving corticosteroids at baseline as compared with those not receiving corticosteroids (P = 0.06).
Severe hypoglycemia (defined as a blood glu-cose level ≤40 mg per deciliter [2.2 mmol per li-ter]) was recorded in 206 of 3016 patients (6.8%) undergoing intensive glucose control, as compared with 15 of 3014 patients (0.5%) undergoing con-ventional control (odds ratio, 14.7; 95% CI, 9.0 to 25.9; P<0.001). The recorded number of episodes of severe hypoglycemia was 272 in the intensive-control group, as compared with 16 in the con-ventional-control group; 173 of all 288 episodes (60.1%) were confirmed by a laboratory measure-ment, 112 (38.9%) were unconfirmed bedside readings, and 3 (1.0%) were of unknown confir-mation status. No long-term sequelae of severe hypoglycemia were reported.
Discussion
In this large, international, randomized trial in-volving adults in the ICU, we found that intensive glucose control, as compared with conventional glucose control, increased the absolute risk of death at 90 days by 2.6 percentage points; this repre-sents a number needed to harm of 38. The dif-ference in mortality remained significant after adjustment for potential confounders. Severe hy-poglycemia was significantly more common with intensive glucose control.
In conducting our trial, we sought to ensure a high degree of internal and external validity by concealing treatment assignments before random-
ization, selecting a long-term outcome that is not subject to biased ascertainment, evaluating a num-ber of clinically important outcomes, achieving
22p3
180
Blo
od G
luco
se L
evel
(mg/
dl)
140
120
80
160
100
0Base-line
2 3 4 5 6 7 8 9 10 11 12 131 14
Intensive glucose control
Intensivecontrol
Conventionalcontrol
Conventional glucose control
Day after Randomization
B
A
0.035
Den
sity
0.025
0.030
0.020
0.015
0.005
0.010
0.0000 50 100 150 200 250
Time-Weighted Mean Blood Glucose Level (mg/dl)
No. of PatientsConventional controlIntensive control
29952989
22332260
13801428
909908
583562
AUTHOR:
FIGURE:
JOB:
4-CH/T
RETAKE
SIZE
ICM
CASE
EMail LineH/TCombo
Revised
AUTHOR, PLEASE NOTE: Figure has been redrawn and type has been reset.
Please check carefully.
REG F
Enon
1st
2nd3rd
Finfer
2 of 3
03-26-09
ARTIST: ts
36013 ISSUE:
108
107 14240
Figure 2. Data on Blood Glucose Level, According to Treatment Group.
Panel A shows mean blood glucose levels. Baseline data are the averages of the last blood glucose measurement obtained before randomization; day 1 data are the average levels from the time of randomization to the end of the day of randomization. The bars indicate the 95% confidence intervals. The dashed line indicates 108 mg per deciliter, the upper limit of the target range for intensive glucose control. Panel B shows the density plot for the mean time-weighted blood glucose levels for individual patients. The dashed lines indicate the modes (most frequent values) in the intensive-control group (blue) and the conventional-control group (red), as well as the upper threshold for severe hypoglycemia (black). To convert the values for blood glucose to millimoles per liter, multiply by 0.05551.
The New England Journal of Medicine Downloaded from nejm.org on September 29, 2015. For personal use only. No other uses without permission.
Copyright © 2009 Massachusetts Medical Society. All rights reserved.

T h e n e w e ngl a nd j o u r na l o f m e dic i n e
n engl j med 360;13 nejm.org march 26, 20091292
Table 3. Outcomes and Adverse Events.*
Outcome MeasureIntensive
Glucose ControlConventional
Glucose Control
Odds Ratio or Absolute Difference
(95% CI)† Statistical Test P Value
Death — no. of patients/total no. (%) Logistic regression
At day 90 829/3010 (27.5) 751/3012 (24.9) 1.14 (1.02 to 1.28) 0.02
At day 28 670/3010 (22.3) 627/3012 (20.8) 1.09 (0.96 to 1.23) 0.17
Potentially life-sustaining treatment limited or withheld before death — no. of pa-tients/total no. (%)
746/816 (91.4) 669/741 (90.3) 1.15 (0.81 to 1.62) Logistic regression 0.44
Limited because death was imminent 527/816 (64.6) 459/741 (61.9) 1.12 (0.91 to 1.38) 0.28
Withheld because not appropriate 219/816 (26.8) 210/741 (28.3) 0.93 (0.74 to 1.16) 0.51
CPR as terminal event — no. of patients/total no. (%)
70/816 (8.6) 72/741 (9.7) 0.87 (0.62 to 1.23) Logistic regression 0.44
Days from randomization to limitation or withholding of potentially life- sustaining treatment — median (IQR)
6 (3 to 16) 6 (2 to 15) t-test 0.42
Proximate cause of death — no. of patients/total no. (%)
Pearson’s test 0.12
Cardiovascular-distributive shock 168/829 (20.3) 140/751 (18.6)
Other cardiovascular 177/829 (21.4) 129/751 (17.2)
Neurologic 180/829 (21.7) 194/751 (25.8)
Respiratory 191/829 (23.0) 177/751 (23.6)
Other 113/829 (13.6) 111/751 (14.8)
Place of death — no. of patients/total no. (%)
ICU 546/829 (65.9) 498/751 (66.3)
Elsewhere in hospital 220/829 (26.5) 197/751 (26.2)
Outside hospital, after discharge 63/829 (7.6) 56/751 (7.5)
Severe hypoglycemia — no. of patients/total no. (%)
206/3016 (6.8) 15/3014 (0.5) 14.7 (9.0 to 25.9) Logistic regression <0.001
Days in ICU — median (IQR) 6 (2 to 11) 6 (2 to 11) 0 Log-rank test 0.84
Days in hospital — median (IQR) 17 (8 to 35) 17 (8 to 35) 0 Log-rank test 0.86
Mechanical ventilation — no. of patients/ total no. (%)
2894/3014 (96.0) 2872/3014 (95.3) 0.7 (−0.3 to 1.76) Pearson’s test 0.17
Days of mechanical ventilation 6.6±6.6 6.6±6.5 0 Wilcoxon rank-sum test 0.56
Renal-replacement therapy — no. of patients/total no. (%)
465/3014 (15.4) 438/3014 (14.5) 0.9 (−0.9 to 2.7) Pearson’s test 0.34
Days of renal-replacement therapy 0.8±2.6 0.8±2.8 0 Wilcoxon rank-sum test 0.39
No. of new organ failures — no. of patients/total no. (%)‡
Pearson’s test 0.11
0 1571/2682 (58.6) 1536/2679 (57.3)
1 790/2682 (29.5) 837/2679 (31.2)
2 263/2682 (9.8) 257/2679 (9.6)
3 44/2682 (1.6) 46/2679 (1.7)
4 11/2682 (0.4) 2/2679 (0.1)
5 3/2682 (0.1) 1/2679 (<0.1)
The New England Journal of Medicine Downloaded from nejm.org on September 29, 2015. For personal use only. No other uses without permission.
Copyright © 2009 Massachusetts Medical Society. All rights reserved.
Intensive vs. Conventional Glucose Control in Critically Ill Patients
n engl j med 360;13 nejm.org march 26, 2009 1293
nearly complete follow-up, and following a pre-defined statistical-analysis plan.30 The manage-ment of blood glucose levels was standardized — nearly all patients received their assigned treatment, the mean blood glucose levels differed signifi-cantly between the two treatment groups during the 90-day study period, and the rate of severe hypoglycemia was low in comparison with the rates in other trials.
Limitations of our trial include the use of a subjective criterion — expected length of stay in the ICU — for inclusion, the inability to make treating staff and study personnel unaware of the treatment-group assignments, and achieve-ment of a glucose level modestly above the target range in a substantial proportion of patients in the intensive-control group. We did not collect specific data to address potential biologic mech-anisms of the trial interventions or their costs. On the basis of the results in the predefined pairs of subgroups, we cannot exclude the possibility that intensive glucose control may benefit some patients.
Our findings differ from those of a recent meta-analysis showing that intensive glucose con-trol did not significantly alter mortality among critically ill adults.14 In keeping with the trials in-cluded in the meta-analysis, patients in our trial who were assigned to intensive glucose control, as compared with those assigned to conventional control, had lower blood glucose levels, received
more insulin, and had more episodes of severe hypoglycemia.14 A unique feature of our trial was the standardized, complex management of blood glucose made possible at multiple centers through a computerized treatment algorithm accessible on centralized servers. In addition, our patients re-ceived predominantly enteral nutrition, consonant with current evidence-based feeding guidelines,33 whereas a substantial proportion of the patients included in the meta-analysis received predomi-nantly parenteral nutrition.14,34
Our trial had greater statistical power than previous trials, as well as a longer follow-up period than all but two trials in the meta-analysis. Thus, our results may be due to a specific effect of our treatment algorithm, may be most generalizable to patients receiving predominantly enteral nutri-tion, or may reflect harm not apparent in trials with shorter follow-up and lower statistical power.
In our trial, more patients in the intensive-control group than in the conventional-control group were treated with corticosteroids, and the excess deaths in the intensive-control group were predominantly from cardiovascular causes. These differences might suggest that reducing blood glu-cose levels by the administration of insulin has adverse effects on the cardiovascular system.35,36 However, our trial was not designed to examine such mechanisms; further research is needed to understand the increased mortality in our trial.
Since the original study by Van den Berghe et
Table 3. (Continued.)
Outcome MeasureIntensive
Glucose ControlConventional
Glucose Control
Odds Ratio or Absolute Difference
(95% CI)† Statistical Test P Value
Temporary sequelae of severe hypoglycemia — no. of patients/total no. (%)
Neurologic 1/206 (0.5) 1/15 (6.7)
Cardiovascular 6/206 (2.9) 1/15 (6.7)
Other 6/206 (2.9) 0
Blood culture positive for pathogenic organ-isms — no. of patients/total no. (%)
387/3014 (12.8) 372/3011 (12.4) Pearson’s test 0.57
Transfusion of packed red cells — no. of patients/total no. (%)
1268/3013 (42.1) 1246/3014 (41.3) Pearson’s test 0.56
Volume of packed cells transfused — ml 122±144 126±193 Wilcoxon rank-sum test 0.82
* Plus–minus values are means ±SD. CPR denotes cardiopulmonary resuscitation, ICU intensive care unit, and IQR interquartile range.† Absolute differences (percentage points) are given for median days in the ICU or hospital, percentage of patients undergoing mechanical
ventilation or renal-replacement therapy, and median days of mechanical ventilation or renal-replacement therapy; for all other measures, odds ratios are given.
‡ Organ failure was defined as a Sequential Organ Failure Assessment (SOFA) score of 3 or 4 for any individual organ system.
The New England Journal of Medicine Downloaded from nejm.org on September 29, 2015. For personal use only. No other uses without permission.
Copyright © 2009 Massachusetts Medical Society. All rights reserved.

T h e n e w e ngl a nd j o u r na l o f m e dic i n e
n engl j med 360;13 nejm.org march 26, 20091294
0.6 0.8 1.0 1.2 1.4 1.6
ConventionalControlBetter
IntensiveControlBetter
Operative admission
Yes
No
Diabetes
Yes
No
Severe sepsis
Yes
No
Trauma
Yes
No
APACHE II score
≥25
<25
Corticosteroids
Yes
No
All deaths at day 90
Odds Ratio for Death (95% CI)
IntensiveControl
(N=3010)
ConventionalControl
(N=3012)Subgroupno. of deaths/no. with data available
222/1121
529/1891
165/596
586/2416
172/626
579/2386
57/465
694/2547
363/944
387/2066
140/378
611/2634
751/3012
1.31 (1.07–1.61)
1.14 (1.02–1.28)
1.20 (1.06–1.36)0.88 (0.66–1.19)
1.17 (1.01–1.36)
1.14 (0.95–1.37)
1.17 (1.04–1.32)0.77 (0.50–1.18)
1.13 (0.89–1.44)
1.15 (1.01–1.31)
1.12 (0.99–1.28)
1.21 (0.95–1.55)
1.07 (0.93–1.23)
P Value forHeterogeneity
272/1111
557/1898
195/615
634/2394
202/673
627/2335
41/421
788/2587
386/927
442/2080
134/392
695/2616
829/3010
0.10
0.60
0.93
0.07
0.84
0.06
0.02
AUTHOR:
FIGURE:
JOB:
4-CH/T
RETAKE
SIZE
ICM
CASE
EMail LineH/TCombo
Revised
AUTHOR, PLEASE NOTE: Figure has been redrawn and type has been reset.
Please check carefully.
REG F
Enon
1st
2nd3rd
Finfer
3 of 3
03-26-09
ARTIST: ts
36013 ISSUE:
33p9
B
A1.0
Prob
abili
ty o
f Sur
viva
l
0.8
0.9
0.7
0.6
0.00 10 20 30 40 50 60 70 80 90
Conventional glucose control
Intensive glucose control
Days after Randomization
No. at RiskConventional controlIntensive control
30143016
23792337
23042227
22612182
P=0.03
The New England Journal of Medicine Downloaded from nejm.org on September 29, 2015. For personal use only. No other uses without permission.
Copyright © 2009 Massachusetts Medical Society. All rights reserved.
Intensive vs. Conventional Glucose Control in Critically Ill Patients
n engl j med 360;13 nejm.org march 26, 2009 1295
al.,12 intensive glucose control has been widely recommended16,17 on the assumption that treat-ment aimed at normoglycemia will benefit pa-tients. As noted in other fields of medicine,37 a clinical trial targeting a perceived risk factor (in this case, hyperglycemia) is a test of a complex strategy that may have profound effects beyond its effect on the risk factor (here, the blood glu-cose level). Our findings suggest that a goal of normoglycemia for glucose control does not nec-
essarily benefit critically ill patients and may be harmful. Whether the harm we observed resulted from the reduced blood glucose level, increased administration of insulin, occurrence of hypogly-cemia, methodologic factors specific to our trial, or other factors is unclear.
In conclusion, our trial showed that a blood glucose target of less than 180 mg per deciliter resulted in lower mortality than a target of 81 to 108 mg per deciliter. On the basis of our results, we do not recommend use of the lower target in critically ill adults.
Supported by grants from the Australian National Health and Medical Research Council, the Health Research Council of New Zealand, and the Canadian Institutes for Health Research.
Dr. Finfer reports receiving reimbursement for travel to pre-sent research results at scientific meetings from Eli Lilly, Cardi-nal Health, and CSL Bioplasma and for serving on steering committees for studies sponsored by Eli Lilly and Eisai (paid to the George Institute for International Health); he also reports that the George Institute for International Health, an indepen-dent, not-for-profit institute affiliated with the University of Sydney, has received research funding from Servier, Novartis, Eisai, Merck Sharp & Dohme, Pfizer Australia, Fresenius Kabi Deutschland, and Sanofi-Aventis. No other potential conflict of interest relevant to this article was reported.
We dedicate this article to the memory of our colleagues and coinvestigators Angela Hamilton and Naresh Ramakrishnan, who did not live to see the results of the trial.
APPENDIXThe affiliations of the NICE-SUGAR writing committee members are as follows: Royal North Shore Hospital (S.F.) and the George Institute for International Health, University of Sydney, Sydney (S.F., S.Y.-S.S., D.B, S.H., R.N.); Vancouver Coastal Health (D.R.C.), University of British Columbia (D.F.), and Vancouver General Hospital, University of British Columbia (V.D.) — all in Vancouver, BC, Canada; Austin Hospital, Melbourne University, Melbourne, VIC, Australia (R.B.); McMaster University, Hamilton, ON, Canada (D.C., E.M.); St. Paul’s Hospital and University of British Columbia, Vancouver, BC, Canada (P.D.); Vancouver General Hospital, Vancouver Coastal Health Research Institute, University of British Columbia, Vancouver, BC, Canada (W.R.H.); Ottawa Health Research Institute, the University of Ottawa, Ottawa (P.C.H.); Queen’s University, Kingston, ON, Canada (D.K.H.); Auckland City Hospital, Auckland, New Zealand (C.M.); Canberra Hospital and Australian National University, Canberra, ACT, Australia (I.M.); St. George Hospital and the George Institute for International Health, University of New South Wales, Sydney (J.M.); Royal North Shore Hospital, University of Sydney, Sydney (J.P.); Kolling Institute of Medical Research, Royal North Shore Hospital and the University of Sydney, Sydney (B.G.R.); Vancouver General Hospital and University of British Columbia, Vancouver, BC, Canada (J.J.R.). The NICE-SUGAR study investigators were as follows: NICE (Australia–New Zealand) Management Committee — S. Finfer (chair), D. Blair, (project manager), R. Bellomo, C. McArthur (lead investigator, New Zealand), I. Mitchell, J. Myburgh, R. Norton, J. Potter; SUGAR (North American) Management Committee — D. Chittock (chair), V. Dhingra (previous chair), D. Foster (senior project manager), D. Cook, P. Dodek, P. Hébert, W. Henderson, D. Heyland, E. McDonald, J. Ronco, I. Schweitzer (ex officio member, at Canadian Institutes for Health Research); Inde-pendent Data and Safety Monitoring Committee — R. Peto (chair), P. Sandercock, C. Sprung, J.D. Young; Study Statistical Centre — the George Institute for International Health, University of Sydney, Sydney — S. Su, S. Heritier, Q. Li, S. Bompoint, L. Billot; Study Coordinating Centre — the George Institute for International Health, University of Sydney, Sydney — L. Crampton, F. Darcy, K. Jayne, V. Kumarasinghe, L. Little, S. McEvoy, S. MacMahon, S. Pandey, S. Ryan, R. Shukla, B. Vijayan; Australia–New Zealand site investigators (alphabetically by institution) — Auckland City Hospital (Department of Critical Care Medicine), Auckland, New Zealand — S. Atherton, J. Bell, L. Hadfield, C. Hou-rigan, C. McArthur, L. Newby, C. Simmonds; Auckland City Hospital (Cardiovascular Intensive Care Unit), Auckland, New Zealand — H. Buhr, M. Eccleston, S. McGuinness, R. Parke; the Austin Hospital, Melbourne, VIC, Australia — R. Bellomo, S. Bates, D. Goldsmith, I. Mercer, K. O’Sullivan; Ballarat Base Hospital, Ballarat, VIC, Australia — R. Gazzard, D. Hill, C. Tauschke; Blacktown Hospital, Blacktown, NSW, Australia — D. Ghelani, K. Nand, G. Reece, T. Sara; Box Hill Hospital, Box Hill, VIC, Australia — S. Elliott, D. Ernest, A. Hamilton; the Canberra Hospi-tal, Canberra, ACT, Australia — R. Ashley, A. Bailey, E. Crowfoot, J. Gissane, I. Mitchell, J. Ranse, J. Whiting; Concord Repatriation Hospital, Concord, NSW, Australia — K. Douglas, D. Milliss, J. Tan, H. Wong; Fremantle Hospital, Fremantle, WA, Australia — D. Blythe, A. Palermo; John Hunter Hospital, Newcastle, NSW, Australia — M. Hardie, P. Harrigan, B. McFadyen; Liverpool Hospital, Liverpool, NSW, Australia — S. Mi-callef, M. Parr; Middlemore Hospital, Auckland, New Zealand — A. Boase, J. Tai, A. Williams; Nepean Hospital, Nepean, NSW, Australia — L. Cole, I. Seppelt, L. Weisbrodt, S. Whereat; North Shore Hospital, Auckland, New Zealand — A. Flanagan, J. Liang; Prince of Wales Hospital, Sydney — F. Bass, M. Campbell, N. Hammond, L. Nicholson, Y. Shehabi; Queen Elizabeth Hospital, Adelaide, SA, Australia — J. Foote, S. Peake, P. Wil-liams; Royal Brisbane Hospital, Brisbane, QLD, Australia — R. Deans, C. Fourie, M. Lassig-Smith, J. Lipman, J. Stuart; Royal Hobart Hospital,
Figure 3 (facing page). Probability of Survival and Odds Ratios for Death, According to Treatment Group.
Panel A shows Kaplan–Meier estimates for the proba-bility of survival, which at 90 days was greater in the conventional-control group than in the intensive-con-trol group (hazard ratio, 1.11; 95% confidence interval, 1.01 to 1.23; P = 0.03). Panel B shows the odds ratios (and 95% confidence intervals) for death from any cause in the intensive-control group as compared with the conventional-control group, among all patients and in six predefined pairs of subgroups. The size of the symbols indicates the relative numbers of deaths. The Acute Physiology and Chronic Health Evaluation II (APACHE II) score can range from 0 to 71, with higher scores indicating more severe organ dysfunction.
The New England Journal of Medicine Downloaded from nejm.org on September 29, 2015. For personal use only. No other uses without permission.
Copyright © 2009 Massachusetts Medical Society. All rights reserved.

T h e n e w e ngl a nd j o u r na l o f m e dic i n e
n engl j med 360;13 nejm.org march 26, 20091296
Hobart, TAS, Australia — A. Bell, T. Field, R. McAllister, K. Marsden, A. Turner; Royal North Shore Hospital, Sydney — S. Ankers, S. Bird, S. Finfer, R. Lee, A. O’Connor, J. Potter, N. Ramakrishnan, R. Raper; St. George Hospital, Sydney — V. Dhiacou, K. Girling, A. Jovanovska, J. Myburgh; St. Vincent’s Hospital, Melbourne, VIC, Australia — N. Groves, J. Holmes, J. Santamaria, R. Smith; Sir Charles Gairdner Hospital, Perth, WA, Australia — S. Baker, B. Roberts; Wellington Hospital, Wellington, New Zealand — L. Andrews, R. Dinsdale, R. Fenton, D. Mackle, S. Mortimer; Western Hospital, Melbourne, VIC, Australia — C. French, L. Little, H. Raunow; Wollongong Hospital, Wollongong, NSW, Australia — M. Gales, F. Hill, S. Rachakonda, D. Rogan; NSW Institute of Trauma and Injury Management, Sydney — C. Allsop; Australian and New Zealand In-tensive Care Research Centre, Melbourne, VIC, Australia — L. Higgins; University of Sydney (Faculty of Medicine), Kolling Institute, and Department of En-docrinology, Royal North Shore Hospital, Sydney — B. Robinson; North American site investigators (alphabetically by institution) — Calgary Health Region, Calgary, AB, Canada — K. Champagne, C. Doig, L. Knox, P. Taylor, C. Wilson; Kingston General Hospital, Kingston, ON, Canada — J. Drover, S. Hammond, E. Mann, M. Myers, A. Robinson; Maisonneuve Rosemont Hospital, Montreal — J. Harvey, Y. Skrobik; Mayo Clinic, Rochester, MN — A. Baumgartner, L. Meade, N. Vlahakis; Mount Sinai Hospital, Toronto — C. Ethier, M. Kramer-Kile, S. Mehta; Ot-tawa General Hospital, Ottawa — C. Gaudert, S. Kanji, T. McArdle, I. Watpool; St Joseph’s Healthcare, Hamilton, ON, Canada — F. Clarke, D. Cook, E. McDonald, A. Tkaczyk; St. Michael’s Hospital, Toronto — J. Marshall, J. Morrissey, K. Porretta, O. Smith, V. Wen; St. Paul’s Hospi-tal, Vancouver, BC, Canada — B.J. Ashley, P. Dodek, S. Mans; Sunnybrook Health Sciences Centre, Toronto — B. Bojilov, K. Code, R. Fowler, N. Marinoff; Toronto General Hospital, Toronto — L. Chu, J. Granton, M. McGrath-Chong, M. Steinberg; Toronto Western Hospital, Toronto — N. Ferguson, S. Go, A. Matte, J. Rosenberg, J. Stevenson; University of Alberta Hospital, Edmonton, AB, Canada — M. Jacka, L. Sonnema; Van-couver General Hospital, Vancouver, BC, Canada — R. Autio, D. Chittock, D. Davies, P. Ganz, M. Gardner, S. Logie, L. Smith; Vancouver Island Health Authority, VIC, BC, Canada — L. Atkins, F. Auld, M. Stewart, G. Wood.
References
Inzucchi SE. Management of hyper-1. glycemia in the hospital setting. N Engl J Med 2006;355:1903-11.
Capes SE, Hunt D, Malmberg K, Ger-2. stein HC. Stress hyperglycaemia and in-creased risk of death after myocardial in-farction in patients with and without diabetes: a systematic overview. Lancet 2000;355:773-8.
Capes SE, Hunt D, Malmberg K, 3. Pathak P, Gerstein HC. Stress hyperglyce-mia and prognosis of stroke in nondia-betic and diabetic patients: a systematic overview. Stroke 2001;32:2426-32.
Gale SC, Sicoutris C, Reilly PM, 4. Schwab CW, Gracias VH. Poor glycemic control is associated with increased mor-tality in critically ill trauma patients. Am Surg 2007;73:454-60.
Krinsley JS. Association between hy-5. perglycemia and increased hospital mor-tality in a heterogeneous population of critically ill patients. Mayo Clin Proc 2003; 78:1471-8.
Malmberg K, Rydén L, Wedel H, et al. 6. Intense metabolic control by means of in-sulin in patients with diabetes mellitus and acute myocardial infarction (DIGAMI 2): effects on mortality and morbidity. Eur Heart J 2005;26:650-61.
Malmberg K, Rydén L, Efendic S, et al. 7. Randomized trial of insulin-glucose infu-sion followed by subcutaneous insulin treatment in diabetic patients with acute myocardial infarction (DIGAMI study): ef-fects on mortality at 1 year. J Am Coll Car-diol 1995;26:57-65.
The ADVANCE Collaborative Group. 8. Intensive blood glucose control and vas-cular outcomes in patients with type 2 dia-betes. N Engl J Med 2008;358:2560-72.
Duckworth W, Abraira C, Moritz T, et 9. al. Glucose control and vascular compli-cations in veterans with type 2 diabetes. N Engl J Med 2009;360:129-39.
The Action to Control Cardiovascular 10.
Risk in Diabetes Study Group. Effects of intensive glucose lowering in type 2 dia-betes. N Engl J Med 2008;358:2545-59.
Brunkhorst FM, Engel C, Bloos F, et 11. al. Intensive insulin therapy and pen-tastarch resuscitation in severe sepsis. N Engl J Med 2008;358:125-39.
Van den Berghe G, Wouters P, Week-12. ers F, et al. Intensive insulin therapy in critically ill patients. N Engl J Med 2001; 345:1359-67.
Van den Berghe G, Wilmer A, Her-13. mans G, et al. Intensive insulin therapy in the medical ICU. N Engl J Med 2006; 354:449-61.
Wiener RS, Wiener DC, Larson RJ. 14. Benefits and risks of tight glucose control in critically ill adults: a meta-analysis. JAMA 2008;300:933-44.
Langley J, Adams G. Insulin-based 15. regimens decrease mortality rates in criti-cally ill patients: a systematic review. Dia-betes Metab Res Rev 2007;23:184-92.
Rodbard HW, Blonde L, Braithwaite 16. SS, et al. American Association of Clinical Endocrinologists medical guidelines for clinical practice for the management of diabetes mellitus. Endocr Pract 2007;13: Suppl 1:1-68.
American Diabetes Association. Stan-17. dards of medical care in diabetes — 2008. Diabetes Care 2008;31:Suppl 1:S12-S54.
Bellomo R, Egi M. Glycemic control 18. in the intensive care unit: why we should wait for NICE-SUGAR. Mayo Clin Proc 2005;80:1546-8.
Angus DC, Abraham E. Intensive in-19. sulin therapy in critical illness. Am J Res-pir Crit Care Med 2005;172:1358-9.
Shulman R, Finney SJ, O’Sullivan C, 20. Glynne PA, Greene R. Tight glycaemic control: a prospective observational study of a computerised decision-supported in-tensive insulin therapy protocol. Crit Care 2007;11:R75.
Chase JG, Shaw GM. Is there more to 21.
glycaemic control than meets the eye? Crit Care 2007;11:160.
Aragon D. Evaluation of nursing work 22. effort and perceptions about blood glu-cose testing in tight glycemic control. Am J Crit Care 2006;15:370-7.
Mitchell I, Finfer S, Bellomo R, Hig-23. lett T. Management of blood glucose in the critically ill in Australia and New Zea-land: a practice survey and inception co-hort study. Intensive Care Med 2006;32: 867-74.
Mackenzie I, Ingle S, Zaidi S, Buczaski 24. S. Tight glycaemic control: a survey of in-tensive care practice in large English hos-pitals. Intensive Care Med 2005;31:1136.
The NICE-SUGAR Study Investiga-25. tors. The Normoglycemia in Intensive Care Evaluation (NICE) (ISRCTN04968275) and Survival Using Glucose Algorithm Regulation (SUGAR) Study: development, design and conduct of an international multi-center, open label, randomized con-trolled trial of two target ranges for glyce-mic control in intensive care unit patients. Am J Respir Crit Care Med (online ab-stracts). (Accessed March 6, 2009, at http://ajrccm.atsjournals.org/cgi/data/172/11/ 1358/DC1/1.)
Pocock SJ, Simon R. Sequential treat-26. ment assignment with balancing for prognostic factors in the controlled clini-cal trial. Biometrics 1975;31:103-15.
Knaus WA, Draper EA, Wagner DP, 27. Zimmerman JE. APACHE II: a severity of disease classification system. Crit Care Med 1985;13:818-29.
Bone RC, Balk RA, Cerra FB, et al. 28. Definitions for sepsis and organ failure and guidelines for the use of innovative therapies in sepsis. Chest 1992;101:1644-55.
Vincent JL, de Mendonça A, Cantraine 29. F, et al. Use of the SOFA score to assess the incidence of organ dysfunction/failure in intensive care units: results of a multi-
The New England Journal of Medicine Downloaded from nejm.org on September 29, 2015. For personal use only. No other uses without permission.
Copyright © 2009 Massachusetts Medical Society. All rights reserved.

Intensive vs. Conventional Glucose Control in Critically Ill Patients
n engl j med 360;13 nejm.org march 26, 2009 1297
center, prospective study. Crit Care Med 1998;26:1793-800.
Finfer S, Heritier S. The NICE-SUGAR 30. (Normoglycaemia in Intensive Care Evalu-ation and Survival Using Glucose Algo-rithm Regulation) Study: statistical analy-sis plan. Crit Care Resusc 2009;11:46-57.
Su S. Numerical maximum log likeli-31. hood estimation for generalized lambda distributions. Comput Stat Data Anal 2007; 51:3983-98.
Idem.32. Fitting single and mixture of generalized lambda distributions to data via discretized and maximum likelihood
methods: GLDEX in R. J Stat Software 2007;21:1-17.
The use of enteral nutrition vs. paren-33. teral nutrition: clinical practice guidelines. Kingston, ON, Canada: Critical Care Nu-trition, 2007. (Accessed March 6, 2009, at http://www.criticalcarenutrition.com/docs/cpg/1.0_envspn_07.pdf.)
Van den Berghe G, Wilmer A, Milants 34. I, et al. Intensive insulin therapy in mixed medical/surgical intensive care units: ben-efit versus harm. Diabetes 2006;55:3151-9.
Dunbar JC, O’Leary DS, Wang G, 35. Wright-Richey J. Mechanisms mediating
insulin-induced hypotension in rats: a role for nitric oxide and autonomic mediators. Acta Diabetol 1996;33:263-8.
Herlein JA, Morgan DA, Phillips BG, 36. Haynes WG, Sivitz WI. Antecedent hypo-glycemia, catecholamine depletion, and subsequent sympathetic neural responses. Endocrinology 2006;147:2781-8.
Krumholz HM, Lee TH. Redefining 37. quality — implications of recent clinical trials. N Engl J Med 2008;358:2537-9.Copyright © 2009 Massachusetts Medical Society.
electronic access to the journal’s cumulative index
At the Journal’s site on the World Wide Web (NEJM.org), you can search an index of all articles published since January 1975
(abstracts 1975–1992, full text 1993–present). You can search by author, key word, title, type of article, and date. The results will include the citations
for the articles plus links to the full text of articles published since 1993. For nonsubscribers, time-limited access to single articles and 24-hour site
access can also be ordered for a fee through the Internet (NEJM.org).
The New England Journal of Medicine Downloaded from nejm.org on September 29, 2015. For personal use only. No other uses without permission.
Copyright © 2009 Massachusetts Medical Society. All rights reserved.